• Cat-intel
  • MedIntelliX
  • Resources
  • About Us
  • Request Free Sample ×

    Kindly complete the form below to receive a free sample of this Report

    Leading companies partner with us for data-driven Insights

    clients tt-cursor

    Electric Bus Charging Infrastructure Market

    ID: MRFR/AM/9458-CR
    100 Pages
    Swapnil Palwe
    September 2022

    Electric Bus Charging Infrastructure Market Research Report Information By Charger Type (DC charger, Pantograph), By Charging Method (Fast Charging, Slow Charging), And By Region (North America, Europe, Asia-Pacific, And Rest Of The World) –Market Forecast Till 2030

    Share:
    Download PDF ×

    We do not share your information with anyone. However, we may send you emails based on your report interest from time to time. You may contact us at any time to opt-out.

    Electric Bus Charging Infrastructure Market Research Report—Global Forecast till 2030 Infographic
    Purchase Options
    $ 4,950.0
    $ 5,950.0
    $ 7,250.0
    Table of Contents

    Electric Bus Charging Infrastructure Market Summary

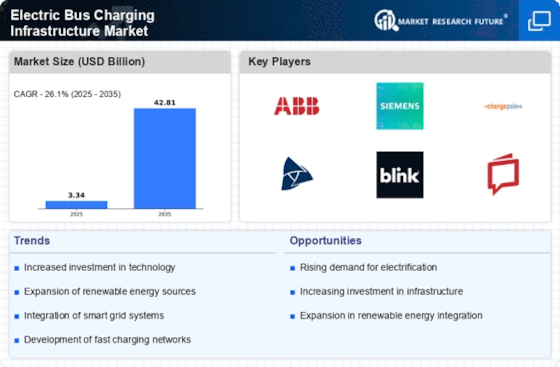
    As per Market Research Future Analysis, the Electric Bus Charging Infrastructure Market was valued at USD 2.1 billion in 2022 and is projected to reach USD 16.1 billion by 2030, growing at a CAGR of 26.1% from 2023 to 2030. The market is driven by increasing demand for electric vehicles, government policies, and strategic initiatives by major players. The pantograph segment is expected to lead the market, while slow charging will dominate the charging method segment. North America is anticipated to hold the largest market share, followed by Europe and Asia-Pacific.

    Key Market Trends & Highlights

    Government policies and subsidies are significantly driving market growth.

    • Governments are establishing charging stations to promote electric vehicle adoption.
    • The EU mandates one charger per ten electric cars by 2030.
    • China proposed a USD 1.4 trillion digital infrastructure initiative, including EV charging funding.
    • Fleet owners are adopting electric vehicles to reduce fuel expenses and maintenance costs.

    Market Size & Forecast

    2022 Market Size USD 2.1 Billion
    2030 Market Size USD 16.1 Billion
    CAGR 26.1%

    Major Players

    Siemens AG (Germany), SCHUNK Group (Germany), ABB (Switzerland), Bombardier Inc (Canada), Kempower OY (US), Daimler AG (Germany), Proterra (US), ChargePoint, Inc (US), EFACEC (Portugal), Shijiazhuang Tonhe Electronics Technologies Co., Ltd (China), Kehua Hengsheng Co., Ltd (China), XCharge Inc (Germany), Alpitronic GmbH (Italy), JEMA ENERGY (Spain), Ekoenergetyka (Poland).

    Electric Bus Charging Infrastructure Market Trends

      • Government policies and subsidies are driving the market growth

    To reduce the negative impact on the environment and foreign exchange reserves, governments and state governments in several nations are establishing charging stations to stimulate the adoption of electric vehicles. In several nations, efforts are underway to plan and deploy large-scale interconnected EV charging stations along several major transportation corridors. Digitalization, interoperability, and charging network roadmaps are all important concerns to be addressed in the planning process. In several cases, stimulus packages are augmenting the funding for EV infrastructure.

    In the European Union, the Alternative Fuel Infrastructure Directive (AFID) is the main measure directing the roll-out of publicly accessible EV Charging stations. Members of the EU are required to set deployment targets for publicly accessible EV chargers for the decade to 2030, with a suggestive ratio of one charger per ten electric cars. China proposed a USD 1.4 trillion digital infrastructure public spending initiative like large-scale investments in Europe, including EV Charging stations funding. Hence, due to government policies and subsidies, the Electric Bus Charging Infrastructure Market's CAGR growth is expected to gain traction throughout the forecast period.

    Additionally, the intense rivalry among fleet owners has resulted in adopting measures that increase profit margins. Electric vehicles can be critical in reducing fuel expenses and increasing profit margins, requiring very little maintenance with few moving parts. Thus, they minimize the total cost of ownership further. The fleet owners are looking for new developments, technologies, and trends to improve the business case for hybrid-electric buses and drive increased Electric Bus Charging Infrastructure market revenue. Manufacturers have begun investing in the development of electric buses, primarily focused on the fleet requirement, to meet future demand for electric buses among fleets.

    For instance, in 2018, VDL Bus & Coach supplied 100 electric buses to Connexxion for the Amstelland Meerlanden concession in Amsterdam, Europe, making it the world's largest electric bus fleet. More than 160 electric buses have struck the streets of Groningen-Drenthe, a new European concession, in 2019. As a result, the increased demand for electric buses, particularly among fleets, creates attractive prospects for players operating in the Electric Bus Charging Infrastructure Market.

    The expansion of electric bus charging infrastructure is poised to play a crucial role in facilitating the transition to sustainable urban mobility, as cities increasingly prioritize clean transportation solutions.

    U.S. Department of Energy

    Electric Bus Charging Infrastructure Market Drivers

    Market Growth Projections

    The Global Electric Bus Charging Infrastructure Market Industry is projected to experience substantial growth in the coming years. With a market value of approximately 3.89 USD Billion in 2024, it is anticipated to reach around 51.3 USD Billion by 2035. This growth trajectory suggests a robust expansion, driven by factors such as increasing electric bus adoption, supportive government policies, and technological advancements in charging solutions. The expected CAGR of 26.45% from 2025 to 2035 further emphasizes the market's potential, indicating a significant shift towards electric public transportation solutions.

    Government Initiatives and Funding

    Government initiatives play a pivotal role in the expansion of the Global Electric Bus Charging Infrastructure Market Industry. Various countries are introducing policies and funding programs aimed at promoting electric vehicle adoption, including electric buses. For example, the U.S. government has allocated significant funds for the development of charging infrastructure as part of its broader environmental strategy. Such initiatives not only enhance the availability of charging stations but also encourage private investments in the sector. As a result, the market is projected to grow substantially, potentially reaching 51.3 USD Billion by 2035, driven by these supportive policies and funding mechanisms.

    Urbanization and Population Growth

    Urbanization and population growth are critical factors influencing the Global Electric Bus Charging Infrastructure Market Industry. As urban areas continue to expand, the demand for efficient public transportation systems increases. Electric buses are becoming a preferred choice for city planners aiming to reduce congestion and pollution. Cities like Beijing and New Delhi are investing heavily in electric bus fleets, which necessitates the development of extensive charging networks. This trend indicates a growing market, as urban centers recognize the need for sustainable transport solutions. The increasing urban population is likely to further accelerate the demand for electric bus charging infrastructure.

    Rising Fuel Prices and Operational Costs

    Rising fuel prices and operational costs are driving the transition to electric buses, thereby impacting the Global Electric Bus Charging Infrastructure Market Industry. As traditional fuel prices fluctuate, public transport operators are seeking cost-effective alternatives. Electric buses offer lower operational costs, particularly in terms of fuel and maintenance. This economic advantage is prompting many transit authorities to invest in electric bus fleets and the necessary charging infrastructure. The shift towards electric buses is expected to contribute to the market's growth, as operators recognize the long-term savings associated with electric vehicles.

    Growing Demand for Sustainable Public Transport

    The Global Electric Bus Charging Infrastructure Market Industry is witnessing a surge in demand for sustainable public transport solutions. Governments worldwide are increasingly prioritizing the reduction of greenhouse gas emissions, leading to the adoption of electric buses. For instance, cities like Los Angeles and London are implementing extensive electric bus fleets, necessitating robust charging infrastructure. This trend is expected to drive the market value to approximately 3.89 USD Billion in 2024, as municipalities invest in charging stations to support their electric bus operations. The shift towards eco-friendly transportation options is likely to bolster the growth of the electric bus charging infrastructure.

    Technological Advancements in Charging Solutions

    Technological advancements are transforming the Global Electric Bus Charging Infrastructure Market Industry, enabling more efficient and faster charging solutions. Innovations such as ultra-fast charging stations and wireless charging technologies are being developed to meet the increasing demands of electric bus fleets. For instance, companies are now offering charging solutions that can recharge buses in under 30 minutes, significantly reducing downtime. This technological evolution not only enhances operational efficiency but also attracts more operators to switch to electric buses, thereby expanding the charging infrastructure. The anticipated growth rate of 26.45% CAGR from 2025 to 2035 underscores the importance of these advancements in driving market expansion.

    Market Segment Insights

    Electric Bus Charging Infrastructure Charger Type Insights

    The Electric Bus Charging Infrastructure Market segmentation, based on charger type, includes DC chargers and Pantograph. The pantograph segment is expected to have a higher CAGR and lead the market share during the forecast period. Pantographs are scissor-like contact arms that draw power from stationary masts for vehicle operation. Pantographs are available in different versions.

    Figure1: Electric Bus Charging Infrastructure Market, by Charger Type, 2022 & 2032 (USD billion)

     Electric Bus Charging Infrastructure Market, by Charger Type, 2022 & 2032

    Source: Secondary Research, Primary Research, Market Research Future Database, and Analyst Review

    Electric Bus Charging Infrastructure Charging Method Insights

    Based on the charging method, the Electric Bus Charging Infrastructure Market segmentation includes Fast Charging, and Slow Charging. The slow-charging segment is expected to have the highest CAGR and dominate the market share during the forecast period. Slow Charging is typically associated with overnight Charging. This is the most ordinary form of charging used by various charging infrastructure solutions for charging electric vehicles. More than 70% of personal vehicles are parked during the day and thus have 22 hours per day to be recharged, which indicates that slow AC charging can meet the needs of many.

    October 2021 ABB partnered with Basel for Switzerland's largest infrastructure projects. Basel selected ABB's charging technology for sustainable e-bus operations during the forecast period. The contract is part of Basel Public Transport's (BVB) efforts to convert its entire bus fleet to battery-electric operations.

    October 2021 Custom Denning, one of Australia's leading bus manufacturers, selected Siemens AG's electric bus Charging stations and digital depot management solution for its fleet of fully Australian-designed and built Element electric buses. These charging stations will help the bus manufacturer prototype electric buses and will be available for future e-Bus orders from its customers.

    Regional Insights

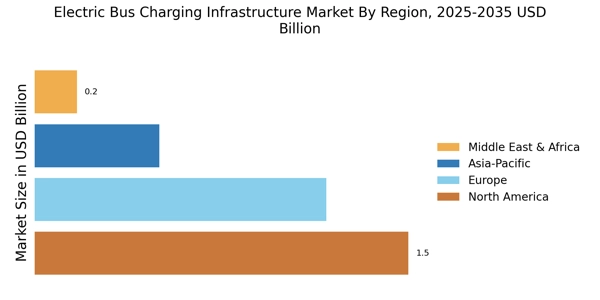
    By Region, the study provides market insights into North America, Europe, Asia-Pacific, and the Rest of the World. The North American electric bus charging infrastructure market will dominate due to increased demand for electric vehicles; strategic initiatives by major players and government policies will boost the market growth in this Region.

    Further, the major countries studied in the market report are The U.S., Canada, German, France, the UK, Italy, Spain, China, Japan, India, Australia, South Korea, and Brazil.

    Figure2: Electric Bus Charging Infrastructure Market Share By Region 2022 (%)

    ELECTRIC BUS CHARGING INFRASTRUCTURE MARKET SHARE BY REGION 2022

    Source: Secondary Research, Primary Research, Market Research Future Database, and Analyst Review

    Europe's Electric Bus Charging Infrastructure market accounts for the second-largest market share. The growth can be attributed to Tier-1 players in this Region and the increasing number of electric bus charging infrastructure manufacturers. Further, the German Electric Bus Charging Infrastructure market held the largest market share, and the UK Electric Bus Charging Infrastructure market was the fastest growing market in the European Region.

    The Asia-Pacific Electric Bus Charging Infrastructure Market is expected to grow at the fastest CAGR from 2023 to 2032. This is due to various factors such as the upsurge in demand for low-emission commuting and increasing investments by governments for charging and hydrogen fueling stations and zero-emission vehicles through subsidies & tax rebates. Moreover, China’s Electric Bus Charging Infrastructure market held the largest market share, and the Indian Electric Bus Charging Infrastructure market was the fastest-growing market in the Asia-Pacific region.

    Key Players and Competitive Insights

    Leading market players are investing heavily in research and development to expand their product lines, which will help the electric bus charging infrastructure market grow even more. Market participants are also undertaking various strategic activities to expand their global footprint, with important market developments including new product launches, contractual agreements, mergers and acquisitions, higher investments, and collaboration with other organizations. The electric bus charging infrastructure industry must offer cost-effective items to expand and survive in a more competitive and rising market climate.

    Manufacturing locally to minimize operational costs is one of the key business tactics manufacturers use in the global Electric Bus Charging Infrastructure industry to benefit clients and increase the market sector. In recent years, the Electric Bus Charging Infrastructure industry has offered some of the most significant advantages to the automotive industry.

    Major players in the Electric Bus Charging Infrastructure market, including Siemens AG (Germany), SCHUNK Group (Germany), ABB (Switzerland), Bombardier Inc (Canada), Kempower OY (US), Daimler AG (Germany), Proterra (US), ChargePoint, Inc (US), EFACEC (Portugal), Shijiazhuang Tonhe Electronics Technologies Co., Ltd (China), Kehua Hengsheng Co., Ltd (China), XCharge Inc (Germany), Alpitronic GmbH (Italy), JEMA ENERGY (Spain), Ekoenergetyka (Poland)., and others, are attempting to increase market demand by investing in research and development operations.

    ABB is a technology leader in electrification and automation, enabling a more sustainable and resource-efficient future. The company's solutions connect engineering know-how and software to optimize how things are manufactured, moved, powered, and operated.ABB's ~105,000 employees are committed to driving innovations that accelerate industrial transformation.ABB partnered with Basel as a partner for Switzerland's largest infrastructure projects. Basel selected ABB's charging technology for sustainable e-bus operations during the forecast period. The contract is part of Basel Public Transport's (BVB) efforts to convert its entire bus fleet to battery-electric operations.

    Custom Bus is an Australian bus-body building, having produced its first vehicle in 1955. Custom has a reputation for producing sophisticated city buses for government and route services, designed for a 25-year life cycle. Products range between the  CB80 low-floor city bus and the SB50 school bus products (12.5m, midi, front/rear engine, articulated, cargo variants). Custom Denning, one of Australia's leading bus manufacturers, selected Siemens AG's electric bus Charging stations and digital depot management solution for its fleet of fully Australian-designed and built Element electric buses.

    These charging stations will help the bus manufacturer prototype electric buses and will be available for future e-Bus orders from its customers.

    Key Companies in the Electric Bus Charging Infrastructure Market market include

    Industry Developments

    In April 2024, the Vertelo EV financing platform for India was introduced by the Macquarie Group of Australia. The organization has allocated 95% of its $1.5 billion investment towards the electrification of commercial vehicle fleets. Solutions for fleet management, financing, and charging infrastructure will be provided by the platform. The remaining 5% will be allocated to infrastructure charging and other necessary expenditures.

    Macquarie had previously stated that it and the Green Climate Fund (GCF) of the United Nations would establish an electric vehicle (EV) financing platform with an initial focus on shared fleets, charging infrastructure, and electric buses. However, the nature of this investment was not specified. Fleet electrification is a priority for the Australian financial services conglomerate at a time when global EV sales are declining and automakers are resorting to discounts to stimulate demand. The state of New York began financing infrastructure for charging electric school buses in March 2024.

    Variable funding amounts are allocated to applicants in accordance with predetermined criteria. As an illustration, financial support commences at $25,000 per bus to cover hardware, installation, and associated expenses. Priority districts are eligible to receive an additional $10,000.

    Additionally, candidates who adopt a comprehensive Fleet Electrification Plan are eligible to receive a maximum of $30,000 per bus. There is considerable momentum behind the implementation of sanitary buses in school bus operations. The Environmental Protection Agency of the United States selected 67 applicants to receive nearly $1 billion through the first Clean School Bus Program Grants Competition in early 2024.

    The grants, facilitated by the Investing in America initiative of President Biden, will assist recipients in procuring more than 2,700 environmentally friendly school buses for 280 school districts that provide education to more than 7 million students in 37 states.

    Future Outlook

    Electric Bus Charging Infrastructure Market Future Outlook

    The Electric Bus Charging Infrastructure Market is projected to grow at a 26.45% CAGR from 2024 to 2035, driven by urbanization, government policies, and technological advancements.

    New opportunities lie in:

    • Develop integrated charging solutions for fleet operators to enhance efficiency.
    • Invest in renewable energy sources for charging stations to reduce operational costs.
    • Create smart charging networks utilizing AI for optimized energy management.

    By 2035, the market is poised to be a cornerstone of sustainable urban transport solutions.

    Market Segmentation

    Electric bus charging infrastructure Regional Outlook

    • US
    • Canada
    • Germany
    • France
    • UK
    • Italy
    • Spain
    • Rest of Europe
    • China
    • Japan
    • India
    • Australia
    • South Korea
    • Rest of Asia-Pacific
    • Middle East
    • Africa

    Electric bus charging infrastructure Charger Type Outlook

    • DC charger
    • Pantograph

    Electric bus charging infrastructure Charging Method Outlook

    • Fast Charging
    • Slow Charging

    Report Scope

    Report Attribute/Metric Details
    Market Size 2022 USD 2.1 billion
    Market Size 2030 USD 16.1 billion
    Compound Annual Growth Rate (CAGR) 26.1% (2023-2030)
    Base Year 2022
    Market Forecast Period 2023-2030
    Historical Data 2019- 2021
    Market Forecast Units Value (USD Billion)
    Report Coverage Revenue Forecast, Market Competitive Landscape, Growth Factors, and Trends
    Segments Covered Charger Type, Charging Method, and Region
    Geographies Covered North America, Europe, AsiaPacific, and the Rest of the World
    Countries Covered The U.S., Canada, German, France, the UK, Italy, Spain, China, Japan, India, Australia, South Korea, and Brazil
    Key Companies Profiled  Siemens AG (Germany), SCHUNK Group (Germany), ABB (Switzerland), Bombardier Inc (Canada), Kempower OY (US), Daimler AG (Germany), Proterra (US), ChargePoint, Inc (US), EFACEC (Portugal), Shijiazhuang Tonhe Electronics Technologies Co., Ltd (China), Kehua Hengsheng Co., Ltd (China), XCharge, Inc (Germany), Alpitronic GmbH (Italy), JEMA ENERGY (Spain), Ekoenergetyka (Poland)
    Key Market Opportunities Obesity in children, healthier and more balanced diets
    Key Market Dynamics Increase in demand for electric vehicles Strategic initiatives by major players Government policies and subsidies

    Market Highlights

    Author
    Swapnil Palwe
    Team Lead - Research

    With a technical background as Bachelor's in Mechanical Engineering, with MBA in Operations Management , Swapnil has 6+ years of experience in market research, consulting and analytics with the tasks of data mining, analysis, and project execution. He is the POC for our clients, for their consulting projects running under the Automotive/A&D domain. Swapnil has worked on major projects in verticals such as Aerospace & Defense, Automotive and many other domain projects. He has worked on projects for fortune 500 companies' syndicate and consulting projects along with several government projects.

    Leave a Comment

    FAQs

    How much is the Electric Bus Charging Infrastructure market?

    The Electric Bus Charging Infrastructure Market size was valued at USD 2.1 Billion in 2022.

    What is the growth rate of the Electric Bus Charging Infrastructure market?

    The global market is projected to grow at a CAGR of 26.1% during the forecast period, 2023-2030.

    Which Region held the largest market share in the Electric Bus Charging Infrastructure market?

    North America had the largest share of the global market

    Who are the key players in the Electric Bus Charging Infrastructure market?

    The key players in the market are Siemens AG (Germany), SCHUNK Group (Germany), ABB (Switzerland), Bombardier Inc (Canada), Kempower OY (US), Daimler AG (Germany), Proterra (US), ChargePoint Inc (US), EFACEC (Portugal), Shijiazhuang Tonhe Electronics Technologies Co., Ltd (China), Kehua Hengsheng Co., Ltd (China), XCharge, Inc (Germany), Alpitronic GmbH (Italy), JEMA ENERGY (Spain), Ekoenergetyka (Poland).

    Which Charger Type led the Electric Bus Charging Infrastructure market?

    The Pantograph Electric Bus Charging Infrastructure category dominated the market in 2022.

    Which Charging Method had the largest market share in the Electric Bus Charging Infrastructure market?

    Slow Charging had the largest share of the global market.

    1. 'TABLE OF CONTENTS
    2. EXECUTIVE SUMMARY
      1. GLOBAL ELECTRIC BUS CHARGING
    3. INFRASTRUCTURE MARKET, BY CHARGER TYPE
      1. GLOBAL ELECTRIC BUS CHARGING INFRASTRUCTURE
    4. MARKET, BY CHARGING METHOD
      1. GLOBAL ELECTRIC BUS CHARGING INFRASTRUCTURE
    5. MARKET, BY REGION
    6. MARKET INTRODUCTION
      1. DEFINITION
      2. SCOPE OF THE STUDY
      3. MARKET STRUCTURE
    7. RESEARCH METHODOLOGY
      1. RESEARCH
    8. PROCESS
      1. PRIMARY RESEARCH
      2. SECONDARY RESEARCH
      3. MARKET SIZE
    9. ESTIMATION
      1. FORECAST MODEL
      2. LIST OF ASSUMPTIONS
    10. MARKET DYNAMICS
      1. INTRODUCTION
      2. DRIVERS
        1. INCREASE IN DEMAND FOR ELECTRIC VEHICLES
        2. STRATEGIC INITIATIVES BY MAJOR PLAYERS
        3. GOVERNMENT POLICIES AND
    11. SUBSIDIES
      1. DRIVERS IMPACT ANALYSIS
      2. RESTRAINTS
        1. HIGH
    12. CAPITAL COSTS OF E-BUS
      1. DEMAND FOR CNG AND LPG VEHICLES
        1. RESTRAINTS
    13. IMPACT ANALYSIS
      1. OPPORTUNITIES
        1. GROWTH IN DEMAND WITHIN FLEETS
      2. CHALLENGES
        1. LACK OF STANDARDS AND REGULATIONS ON CHARGING INFRASTRUCTURE
      3. COVID-19 IMPACT ANALYSIS
        1. ECONOMIC IMPACT ON THE AUTOMOTIVE INDUSTRY
        2. IMPACT ON AUTOMOTIVE PRODUCTION AND SALES
    14. AMERICAN HONDA
      1. FCA
        1. KIA
    15. IMPACT ON THE ELECTRIC BUS CHARGING INFRASTRUCTURE MARKET
      1. IMPACT ON
    16. SUPPLY CHAIN
      1. CASH FLOW CONSTRAINTS
        1. IMPACT ON WORLD TRADE
    17. MARKET FACTOR ANALYSIS
      1. PORTER’S FIVE FORCES MODEL
    18. THREAT OF NEW ENTRANTS
      1. BARGAINING POWER OF SUPPLIERS
        1. THREAT
    19. OF SUBSTITUTES
      1. BARGAINING POWER OF BUYERS
        1. INTENSITY OF RIVALRY
      2. SUPPLY CHAIN ANALYSIS
        1. DESIGN & DEVELOPMENT
        2. RAW MATERIAL/COMPONENT
    20. SUPPLY
      1. MANUFACTURE
        1. DISTRIBUTION/SUPPLY
        2. END-USER
      2. TECHNOLOGY TRENDS
        1. SOLAR-POWERED ELECTRIC VEHICLE CHARGING STATION
    21. GLOBAL ELECTRIC BUS CHARGING INFRASTRUCTURE MARKET, BY CHARGER TYPE
    22. OVERVIEW
      1. ELECTRIC BUS CHARGING INFRASTRUCTURE: MARKET ESTIMATES &
    23. FORECAST BY CHARGER TYPE, 2023–2032
      1. DC CHARGER
        1. DC
    24. CHARGER: MARKET ESTIMATES & FORECAST,2023–2032
      1. PANTOGRAPH
        1. PANTOGRAPH: MARKET ESTIMATES & FORECAST, 2023–2032
    25. GLOBAL
    26. ELECTRIC BUS CHARGING INFRASTRUCTURE MARKET, BY CHARGING METHOD
      1. OVERVIEW
        1. ELECTRIC BUS CHARGING INFRASTRUCTURE: MARKET ESTIMATES & FORECAST BY
    27. CHARGING METHOD, 2023–2032
    28. GLOBAL ELECTRIC BUS CHARGING INFRASTRUCTURE
    29. MARKET, BY REGION
      1. OVERVIEW
      2. NORTH AMERICA
        1. US
    30. CANADA
      1. MEXICO
      2. EUROPE
        1. GERMANY
        2. UK
    31. FRANCE
      1. NETHERLANDS
        1. ITALY
        2. SPAIN
        3. NORWAY
        4. REST OF EUROPE
      2. ASIA-PACIFIC
        1. CHINA
        2. JAPAN
        3. INDIA
        4. SOUTH KOREA
        5. AUSTRALIA
        6. REST OF ASIA-PACIFIC
      3. LATIN AMERICA
        1. BRAZIL
        2. CHILE
        3. COLOMBIA
    32. REST OF LATIN AMERICA
    33. COMPETITIVE LANDSCAPE
      1. COMPETITIVE OVERVIEW
      2. MARKET STRATEGY ANALYSIS
      3. MARKET SHARE ANALYSIS (EBUS CHARGING INFRASTRUCTURE),
      4. LIST OF EBUS CHARGING BRANDS
      5. COMPETITIVE BENCHMARKING
      6. KEY DEVELOPMENTS IN THE GLOBAL ELECTRIC BUS CHARGING INFRASTRUCTURE MARKET
        1. KEY DEVELOPMENTS: MERGERS & ACQUISITIONS
        2. KEY DEVELOPMENTS:
    34. CONTRACTS & AGREEMENTS
      1. KEY DEVELOPMENTS: PARTNERSHIP
        1. KEY
    35. DEVELOPMENTS: EXPANSION
      1. KEY DEVELOPMENTS: PRODUCT DEVELOPMENTS
    36. KEY DEVELOPMENTS: JOINT VENTURE
      1. KEY DEVELOPMENTS: COLLABORATION
    37. KEY DEVELOPMENTS: PROJECT
      1. COMPETITOR DASHBOARD
    38. COMPANY PROFILES
      1. SIEMENS AG
        1. COMPANY OVERVIEW
        2. FINANCIAL OVERVIEW
        3. PRODUCTS OFFERED
        4. KEY DEVELOPMENTS
        5. SWOT ANALYSIS
        6. KEY STRATEGIES
      2. SCHUNK GROUP
        1. COMPANY OVERVIEW
    39. FINANCIAL OVERVIEW
      1. PRODUCTS OFFERED
        1. KEY DEVELOPMENTS
        2. SWOT ANALYSIS
        3. KEY STRATEGIES
      2. ABB
        1. COMPANY
    40. OVERVIEW
      1. FINANCIAL OVERVIEW
        1. PRODUCTS OFFERED
    41. KEY DEVELOPMENTS
      1. SWOT ANALYSIS
        1. KEY STRATEGIES
    42. BOMBARDIER INC
      1. COMPANY OVERVIEW
        1. FINANCIAL OVERVIEW
    43. PRODUCTS OFFERED
      1. KEY DEVELOPMENTS
        1. SWOT ANALYSIS
    44. KEY STRATEGIES
      1. KEMPOWER OY
        1. COMPANY OVERVIEW
        2. FINANCIAL
    45. OVERVIEW
      1. PRODUCTS OFFERED
        1. EY DEVELOPMENTS
        2. SWOT
    46. ANALYSIS
      1. KEY STRATEGIES
      2. DAIMLER AG
        1. COMPANY OVERVIEW
        2. FINANCIAL OVERVIEW
        3. PRODUCTS OFFERED
        4. KEY DEVELOPMENTS
        5. SWOT ANALYSIS
        6. KEY STRATEGIES
      3. PROTERRA
    47. COMPANY OVERVIEW
      1. FINANCIAL OVERVIEW
        1. PRODUCTS OFFERED
        2. KEY DEVELOPMENTS
        3. SWOT ANALYSIS
        4. KEY STRATEGIES
      2. CHARGEPOINT, INC
        1. COMPANY OVERVIEW
        2. FINANCIAL OVERVIEW
        3. PRODUCTS OFFERED
        4. KEY DEVELOPMENTS
        5. SWOT ANALYSIS
        6. KEY STRATEGIES
      3. EFACEC
        1. COMPANY OVERVIEW
    48. FINANCIAL OVERVIEW
      1. PRODUCTS OFFERED
        1. KEY DEVELOPMENTS
        2. SWOT ANALYSIS
        3. KEY STRATEGIES
      2. SHIJIAZHUANG TONHE
    49. ELECTRONICS TECHNOLOGIES CO., LTD
      1. COMPANY OVERVIEW
        1. FINANCIAL
    50. OVERVIEW
      1. PRODUCTS OFFERED
        1. KEY DEVELOPMENTS
    51. SWOT ANALYSIS
      1. KEY STRATEGIES
      2. KEHUA HENGSHENG CO., LTD
        1. COMPANY OVERVIEW
        2. FINANCIAL OVERVIEW
        3. PRODUCTS
    52. OFFERED
      1. KEY DEVELOPMENTS
        1. SWOT ANALYSIS
        2. KEY
    53. STRATEGIES
      1. XCHARGE, INC
        1. COMPANY OVERVIEW
        2. FINANCIAL
    54. OVERVIEW
      1. PRODUCTS OFFERED
        1. KEY DEVELOPMENTS
    55. SWOT ANALYSIS
      1. KEY STRATEGIES
      2. ALPITRONIC GMBH
    56. COMPANY OVERVIEW
      1. FINANCIAL OVERVIEW
        1. PRODUCTS OFFERED
        2. KEY DEVELOPMENTS
        3. SWOT ANALYSIS
        4. KEY STRATEGIES
      2. JEMA ENERGY
        1. COMPANY OVERVIEW
        2. FINANCIAL OVERVIEW
        3. PRODUCTS OFFERED
        4. KEY DEVELOPMENTS
        5. SWOT ANALYSIS
        6. KEY STRATEGIES
      3. EKOENERGETYKA
        1. COMPANY OVERVIEW
        2. FINANCIAL OVERVIEW
        3. PRODUCTS OFFERED
        4. KEY DEVELOPMENTS
        5. SWOT ANALYSIS
        6. KEY STRATEGIES
    57. APPENDIX
      1. REFERENCES
      2. RELATED REPORTS
    58. BY CHARGER TYPE, 2023–2032 (USD MILLION)
    59. & FORECAST, 2023–2032 (USD MILLION)
    60. & FORECAST, 2023–2032 (USD MILLION)
    61. INFRASTRUCTURE MARKET ESTIMATES & FORECAST, BY CHARGING METHOD, 2023–2032
    62. (USD MILLION)
    63. REGION, 2023–2032 (USD MILLION)
    64. INFRASTRUCTURE MARKET, BY COUNTRY, 2023–2032 (USD MILLION)
    65. AMERICA: ELECTRIC BUS CHARGING INFRASTRUCTURE MARKET, BY CHARGER TYPE, 2023–2032
    66. (USD MILLION)
    67. BY CHARGING METHOD, 2023–2032 (USD MILLION)
    68. CHARGING INFRASTRUCTURE MARKET, BY CHARGER TYPE, 2023–2032 (USD MILLION)
    69. –2032 (USD MILLION)
    70. MARKET, BY CHARGER TYPE, 2023–2032 (USD MILLION)
    71. BUS CHARGING INFRASTRUCTURE MARKET, BY CHARGING METHOD, 2023–2032 (USD MILLION)
    72. –2032 (USD MILLION)
    73. MARKET, BY CHARGING METHOD, 2023–2032 (USD MILLION)
    74. ELECTRIC BUS CHARGING INFRASTRUCTURE MARKET, BY COUNTRY, 2023–2032 (USD MILLION)
    75. –2032 (USD MILLION)
    76. MARKET, BY CHARGING METHOD, 2023–2032 (USD MILLION)
    77. ELECTRIC BUS CHARGING INFRASTRUCTURE MARKET, BY CHARGER TYPE, 2023–2032 (USD
    78. MILLION)
    79. CHARGING METHOD, 2023–2032 (USD MILLION)
    80. INFRASTRUCTURE MARKET, BY CHARGER TYPE, 2023–2032 (USD MILLION)
    81. UK: ELECTRIC BUS CHARGING INFRASTRUCTURE MARKET, BY CHARGING METHOD, 2023–2032
    82. (USD MILLION)
    83. BY CHARGER TYPE, 2023–2032 (USD MILLION)
    84. CHARGING INFRASTRUCTURE MARKET, BY CHARGING METHOD, 2023–2032 (USD MILLION)
    85. TYPE, 2023–2032 (USD MILLION)
    86. INFRASTRUCTURE MARKET, BY CHARGING METHOD, 2023–2032 (USD MILLION)
    87. ITALY: ELECTRIC BUS CHARGING INFRASTRUCTURE MARKET, BY CHARGER TYPE, 2023–2032
    88. (USD MILLION)
    89. BY CHARGING METHOD, 2023–2032 (USD MILLION)
    90. BUS CHARGING INFRASTRUCTURE MARKET, BY CHARGER TYPE, 2023–2032 (USD MILLION)
    91. –2032 (USD MILLION)
    92. MARKET, BY CHARGER TYPE, 2023–2032 (USD MILLION)
    93. BUS CHARGING INFRASTRUCTURE MARKET, BY CHARGING METHOD, 2023–2032 (USD MILLION)
    94. TYPE, 2023–2032 (USD MILLION)
    95. INFRASTRUCTURE MARKET, BY CHARGING METHOD, 2023–2032 (USD MILLION)
    96. ASIA-PACIFIC: ELECTRIC BUS CHARGING INFRASTRUCTURE MARKET, BY COUNTRY, 2023–2032
    97. (USD MILLION)
    98. BY CHARGER TYPE, 2023–2032 (USD MILLION)
    99. BUS CHARGING INFRASTRUCTURE MARKET, BY CHARGING METHOD, 2023–2032 (USD MILLION)
    100. –2032 (USD MILLION)
    101. MARKET, BY CHARGING METHOD, 2023–2032 (USD MILLION)
    102. BUS CHARGING INFRASTRUCTURE MARKET, BY CHARGER TYPE, 2023–2032 (USD MILLION)
    103. –2032 (USD MILLION)
    104. MARKET, BY CHARGER TYPE, 2023–2032 (USD MILLION)
    105. BUS CHARGING INFRASTRUCTURE MARKET, BY CHARGING METHOD, 2023–2032 (USD MILLION)
    106. TYPE, 2023–2032 (USD MILLION)
    107. INFRASTRUCTURE MARKET, BY CHARGING METHOD, 2023–2032 (USD MILLION)
    108. AUSTRALIA: ELECTRIC BUS CHARGING INFRASTRUCTURE MARKET, BY CHARGER TYPE, 2023–2032
    109. (USD MILLION)
    110. BY CHARGING METHOD, 2023–2032 (USD MILLION)
    111. ELECTRIC BUS CHARGING INFRASTRUCTURE MARKET, BY CHARGER TYPE, 2023–2032 (USD
    112. MILLION)
    113. MARKET, BY CHARGING METHOD, 2023–2032 (USD MILLION)
    114. ELECTRIC BUS CHARGING INFRASTRUCTURE MARKET, BY COUNTRY, 2023–2032 (USD MILLION)
    115. TYPE, 2023–2032 (USD MILLION)
    116. INFRASTRUCTURE MARKET, BY CHARGING METHOD, 2023–2032 (USD MILLION)
    117. BRAZIL: ELECTRIC BUS CHARGING INFRASTRUCTURE MARKET, BY CHARGER TYPE, 2023–2032
    118. (USD MILLION)
    119. BY CHARGING METHOD, 2023–2032 (USD MILLION)
    120. BUS CHARGING INFRASTRUCTURE MARKET, BY CHARGER TYPE, 2023–2032 (USD MILLION)
    121. –2032 (USD MILLION)
    122. MARKET, BY CHARGER TYPE, 2023–2032 (USD MILLION)
    123. BUS CHARGING INFRASTRUCTURE MARKET, BY CHARGING METHOD, 2023–2032 (USD MILLION)
    124. CHARGER TYPE, 2023–2032 (USD MILLION)
    125. ELECTRIC BUS CHARGING INFRASTRUCTURE MARKET, BY CHARGING METHOD, 2023–2032
    126. (USD MILLION)
    127. KEY DEVELOPMENTS: CONTRACTS & AGREEMENTS
    128. PARTNERSHIP
    129. PRODUCT DEVELOPMENTS
    130. KEY DEVELOPMENTS: COLLABORATION
    131. COMPETITOR DASHBOARD
    132. SIEMENS AG: KEY DEVELOPMENTS
    133. ABBS: PRODUCTS OFFERED
    134. INC: PRODUCTS OFFERED
    135. KEMPOWER OY: KEY DEVELOPMENTS
    136. DAIMLER AG: KEY DEVELOPMENTS
    137. PROTERRA: KEY DEVELOPMENTS
    138. TECHNOLOGIES CO., LTD: PRODUCTS OFFERED
    139. TECHNOLOGIES CO., LTD: KEY DEVELOPMENTS
    140. PRODUCTS OFFERED
    141. GMBHS: PRODUCTS OFFERED
    142. JEMA ENERGY: KEY DEVELOPMENTS
    143. JEMA ENERGY: KEY DEVELOPMENTS
    144. MARKET SYNOPSIS
    145. ANALYSIS, BY CHARGER TYPE
    146. MARKET ANALYSIS, BY CHARGING METHOD
    147. MARKET ANALYSIS, BY REGION
    148. MARKET: STRUCTURE
    149. APPROACHES
    150. MARKET
    151. IMPACT ANALYSIS: ELECTRIC BUS CHARGING INFRASTRUCTURE MARKET
    152. IMPACT ANALYSIS: GLOBAL ELECTRIC BUS CHARGING INFRASTRUCTURE MARKET
    153. PORTER’S FIVE FORCES ANALYSIS: GLOBAL ELECTRIC VEHICLE CHARGING STATION
    154. MARKET
    155. MARKET
    156. TYPE, 2020 (% SHARE)
    157. MARKET, BY CHARGER TYPE, 2018 TO 2032 (USD MILLION)
    158. BUS CHARGING INFRASTRUCTURE MARKET, BY CHARGING METHOD, 2020 (% SHARE)
    159. GLOBAL ELECTRIC BUS CHARGING INFRASTRUCTURE MARKET, BY CHARGING METHOD, 2018
    160. TO 2032 (USD MILLION)
    161. MARKET, BY REGION, 2020 (% SHARE)
    162. MARKET, BY REGION, 2023–2032 (USD MILLION)
    163. BUS CHARGING INFRASTRUCTURE MARKET SHARE, BY COUNTRY, 2020 (% SHARE)
    164. EUROPE: ELECTRIC BUS CHARGING INFRASTRUCTURE MARKET SHARE, BY COUNTRY, 2020 (%
    165. SHARE)
    166. SHARE, BY COUNTRY, 2020 (% SHARE)
    167. INFRASTRUCTURE MARKET SHARE, BY COUNTRY, 2020 (% SHARE)
    168. EBUS CHARGING INFRASTRUCTURE: MAJOR PLAYERS MARKET SHARE ANALYSIS, 2020 (%)
    169. EUROPE EBUS CHARGING INFRASTRUCTURE: MAJOR PLAYERS MARKET SHARE ANALYSIS, 2020
    170. SHARE ANALYSIS, 2020 (%)
    171. MAJOR PLAYERS MARKET SHARE ANALYSIS, 2020 (%)
    172. COMPETITORS
    173. SIEMENS AG: SWOT ANALYSIS
    174. SNAPSHOT
    175. SWOT ANALYSIS
    176. DAIMLER AG: SWOT ANALYSIS
    177. CHARGEPOINT, INC: SWOT ANALYSIS
    178. TECHNOLOGIES CO., LTD: FINANCIAL OVERVIEW SNAPSHOT
    179. ELECTRONICS TECHNOLOGIES CO., LTD: SWOT ANALYSIS
    180. CO., LTD: SWOT ANALYSIS
    181. ALPITRONIC GMBHS: SWOT ANALYSIS
    182. EKOENERGETYKA: SWOT ANALYSIS'

    Electric Bus Charging Infrastructure Market Segmentation

    Market Segmentation Overview

    • Detailed segmentation data will be available in the full report
    • Comprehensive analysis by multiple parameters
    • Regional and country-level breakdowns
    • Market size forecasts by segment
    Report Infographic
    Free Sample Request

    Kindly complete the form below to receive a free sample of this Report

    Customer Strories

    “I am very pleased with how market segments have been defined in a relevant way for my purposes (such as "Portable Freezers & refrigerators" and "last-mile"). In general the report is well structured. Thanks very much for your efforts.”

    Victoria Milne Founder
    Case Study

    Chemicals and Materials