info@marketresearchfuture.com   📞  +1 (855) 661-4441(US)   📞  +44 1720 412 167(UK)
Certified Global Research Member
Isomar fd.webp Wcrc 57.webp
Key Questions Answered
  • Global Market Outlook
  • In-depth analysis of global and regional trends
  • Analyze and identify the major players in the market, their market share, key developments, etc.
  • To understand the capability of the major players based on products offered, financials, and strategies.
  • Identify disrupting products, companies, and trends.
  • To identify opportunities in the market.
  • Analyze the key challenges in the market.
  • Analyze the regional penetration of players, products, and services in the market.
  • Comparison of major players financial performance.
  • Evaluate strategies adopted by major players.
  • Recommendations
Why Choose Market Research Future?
  • Vigorous research methodologies for specific market.
  • Knowledge partners across the globe
  • Large network of partner consultants.
  • Ever-increasing/ Escalating data base with quarterly monitoring of various markets
  • Trusted by fortune 500 companies/startups/ universities/organizations
  • Large database of 5000+ markets reports.
  • Effective and prompt pre- and post-sales support.

Data Visualization Tool Market Research Report: By Deployment Type (On-Premise, Cloud-Based, Hybrid), By Organization Size (Small and Medium-Sized Enterprises (SMEs), Large Enterprises), By Vertical (IT and Telecommunications, Manufacturing, Retail, Healthcare, Banking and Financial Services), By Functionality (Data Exploration and Analysis, Dashboarding and Reporting, Data Storytelling), By Data Source (Structured Data, Semi-Structured Data, Unstructured Data) and By Regional (North America, Europe, South America, Asia Pacific, Middle East


ID: MRFR/ICT/28215-HCR | 128 Pages | Author: Aarti Dhapte| October 2024

Data Visualization Tool Market Overview


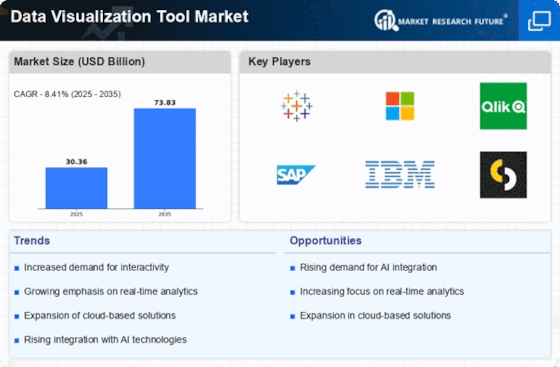
As per MRFR analysis, the Data Visualization Tool Market Size was estimated at 23.83 (USD Billion) in 2022.


The Data Visualization Tool Market Industry is expected to grow from 25.83(USD Billion) in 2023 to 53.4 (USD Billion) by 2032. The Data Visualization Tool Market CAGR (growth rate) is expected to be around 8.41% during the forecast period (2024 - 2032).


Key Data Visualization Tool Market Trends Highlighted


The Data Visualization Tool Market is witnessing significant growth due to increasing data generation across various industries. Key drivers include the need for businesses to effectively analyze and present complex data, rising adoption of cloud-based data visualization tools, and advancements in artificial intelligence (AI) and machine learning (ML). Opportunities lie in the expansion of mobile data visualization and the integration of data visualization tools with augmented reality (AR) and virtual reality (VR) technologies. Recent trends indicate a shift towards interactive and dynamic visualizations, the use of storytelling and narrative techniques, and the emergence of self-service data visualization platforms. These trends emphasize the growing importance of data visualization tools in empowering businesses to make data-driven decisions and effectively communicate insights.


Data Visualization Tool Market Overview


Source: Primary Research, Secondary Research, MRFR Database and Analyst Review


Data Visualization Tool Market Drivers


Growing Volume and Complexity of Data


The exponential growth in data volume and complexity in recent years has made it increasingly challenging for organizations to effectively analyze and derive meaningful insights from their data. Data visualization tools provide a solution to this problem by simplifying data analysis, enabling users to quickly and easily identify patterns, trends, and outliers. The growing demand for data visualization tools is expected to continue as organizations seek to gain a competitive advantage by leveraging data-driven insights.


According to surveys, the global data visualization market size is projected to grow from USD 8.93 billion in 2023 to USD 18.30 billion by 2030, at a CAGR of 10.2%. The growth in the adoption of data visualization tools is attributed to factors such as the increasing adoption of cloud computing and big data analytics, the growing need to improve data-driven decision-making, and the rising demand for data visualization tools across various industries, including healthcare, retail, and manufacturing.The growing volume and complexity of data is a major driver of growth in the Data Visualization Tool Market Industry. Traditional methods of data analysis are no longer sufficient to handle the vast amounts of data that organizations are now collecting. Data visualization tools provide a way to quickly and easily visualize data, making it easier to identify trends and patterns. This can help organizations make better decisions and improve their overall performance.


Here are some specific examples of how the growing volume and complexity of data is driving the growth of the Data Visualization Tool Market Industry: The healthcare industry is generating increasingly large amounts of data, such as patient records, medical images, and genomic data. Data visualization tools are being used to help healthcare providers make sense of this data and improve patient care. The retail industry is also generating large amounts of data, such as customer purchase data and loyalty program data.Data visualization tools are being used to help retailers understand their customers' behavior and improve their marketing and merchandising strategies. The manufacturing industry is using data visualization tools to improve their production processes and quality control. By visualizing data from sensors and other sources, manufacturers can identify inefficiencies and improve their overall performance.


Increasing Adoption of Cloud Computing and Big Data Analytics


The increasing adoption of cloud computing and big data analytics is another key driver of growth in the Data Visualization Tool Market Industry. Cloud computing provides a scalable and cost-effective way to store and process large amounts of data. Big data analytics tools can then be used to analyze this data and extract meaningful insights. Data visualization tools play a vital role in cloud computing and big data analytics ecosystem. They provide a way to quickly and easily visualize data, making it easier to identify trends and patterns. This can help organizations make better decisions and improve their overall performance.


Rising Demand for Data-Driven Decision-Making


Organizations are increasingly realizing the importance of data-driven decision-making. Data visualization tools provide a way to quickly and easily visualize data, making it easier for decision-makers to understand the data and make informed decisions. The rising demand for data-driven decision-making is a major driver of growth in the Data Visualization Tool Market Industry. Organizations are increasingly realizing that they need to use data to make better decisions. Data visualization tools provide a way to quickly and easily visualize data, making it easier for decision-makers to understand the data and make informed decisions.


Data Visualization Tool Market Segment Insights


Data Visualization Tool Market Deployment Type Insights


The Data Visualization Tool Market is segmented by deployment type into on-premise, cloud-based, and hybrid. Among these segments, the cloud-based segment is expected to hold the largest market share in 2023 and is projected to continue its dominance throughout the forecast period. The growth of the cloud-based segment can be attributed to the increasing adoption of cloud computing by businesses of all sizes. Cloud-based data visualization tools offer several advantages over on-premise solutions, such as scalability, flexibility, and cost-effectiveness.


The on-premise segment is expected to account for a significant market share during the forecast period. On-premise solutions provide businesses with greater control over their data and security, which is a key concern for many organizations. However, the high upfront costs associated with on-premise solutions can be a barrier to entry for some businesses. The hybrid segment is expected to experience steady growth over the forecast period. Hybrid solutions offer businesses the flexibility to deploy their data visualization tools in a combination of on-premise and cloud environments.


This allows businesses to take advantage of the benefits of both deployment types. Overall, the Data Visualization Tool Market is expected to grow significantly over the forecast period, driven by the increasing adoption of data visualization tools by businesses of all sizes. The cloud-based segment is expected to continue to lead the market, but the on-premise and hybrid segments are also expected to experience healthy growth.


Data Visualization Tool Market Deployment Type Insights


Source: Primary Research, Secondary Research, MRFR Database and Analyst Review


Data Visualization Tool Market Organization Size Insights


The Data Visualization Tool Market is segmented by organization size into Small and Medium-Sized Enterprises (SMEs) and Large Enterprises. The SME segment held the largest market share in 2023, accounting for over 60% of the global market revenue. This is attributed to the increasing adoption of data visualization tools by SMEs to gain insights into their data and make informed decisions. The large enterprise segment is expected to grow at a faster CAGR during the forecast period, owing to the increasing need for advanced data visualization capabilities to handle large and complex datasets.


Data Visualization Tool Market Vertical Insights


The IT and Telecommunications vertical held the largest share of the Data Visualization Tool Market in 2023, accounting for over 25% of the revenue. The increasing adoption of data visualization tools by IT and telecom companies to analyze and visualize complex data, monitor network performance, and optimize customer experience is driving the growth of this segment. The Manufacturing vertical is also witnessing significant growth, with a market share of over 20% in 2023. Data visualization tools help manufacturing companies improve production efficiency, optimize supply chains, and make data-driven decisions.


The Retail vertical is another key segment, with a market share of over 15% in 2023. Retailers are increasingly using data visualization tools to analyze customer behavior, optimize product placement, and personalize marketing campaigns. The Healthcare vertical is also growing rapidly, with a market share of over 10% in 2023. Data visualization tools help healthcare providers analyze patient data, track disease patterns, and improve patient outcomes. The Banking and Financial Services vertical is another important segment, with a market share of over 10% in 2023.


Data visualization tools are used by banks and financial institutions to analyze financial data, identify trends, and make informed investment decisions.


Data Visualization Tool Market Functionality Insights


The functionality segment of the Data Visualization Tool Market is expected to grow from $11.36 billion in 2023 to $24.12 billion by 2032, at a CAGR of 8.7%. The key insights and overview of the functionality segment include Data Exploration and Analysis: This functionality allows users to explore and analyze data to identify trends, patterns, and insights. It is the most important functionality for data analysts and data scientists. Dashboarding and Reporting: This functionality allows users to create interactive dashboards and reports that provide real-time insights into data.


It is essential for business users and executives. Data Storytelling: This functionality allows users to create compelling data visualizations that tell a story and communicate insights effectively. It is becoming increasingly important as businesses look to communicate data insights to a wider audience. Overall, the functionality segment of the Data Visualization Tool Market is expected to continue to grow rapidly as businesses increasingly rely on data to make decisions.


Data Visualization Tool Market Data Source Insights


The Data Visualization Tool Market is segmented by Data Source into Structured Data, Semi-Structured Data, and Unstructured Data. Structured Data: Structured data is highly organized and easy to analyze, making it the most commonly used data type for data visualization. In 2023, the structured data segment held the largest market share of 45.3% and is projected to reach USD 24.15 billion by 2032, exhibiting a CAGR of 8.07%. Semi-Structured Data: Semi-structured data is partially organized, often in a hierarchical or tabular format. It requires some preprocessing before it can be used for data visualization.


The semi-structured data segment is expected to witness significant growth, reaching USD 14.62 billion by 2032 at a CAGR of 9.23%. Unstructured Data: Unstructured data is the most challenging data type to visualize due to its lack of organization. It includes text, images, and videos. The unstructured data segment is projected to grow rapidly, reaching USD 14.63 billion by 2032 at a CAGR of 10.12%. The growing volume and complexity of data, along with the increasing need for data-driven decision-making, are key factors driving the growth of the data visualization tool market.


Data Visualization Tool Market Regional Insights


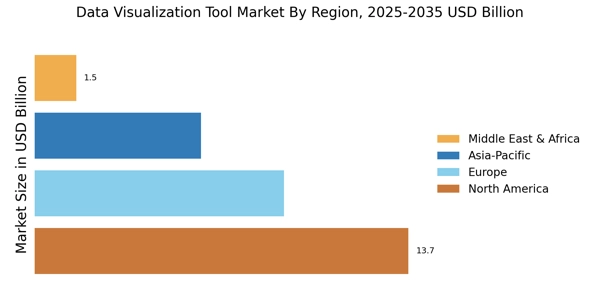
The Data Visualization Tool Market is segmented into North America, Europe, APAC, South America, and MEA. North America held the largest market share in 2023, accounting for 38.4% of the global revenue. The region is home to a large number of technology companies and early adopters of data visualization tools. Europe is the second-largest market, with a share of 31.2% in 2023. The region has a strong presence of data visualization vendors and a growing demand for data-driven insights. APAC is expected to be the fastest-growing market, with a CAGR of 10.2% from 2023 to 2032.


The region is witnessing a surge in data generation and a growing need for data visualization tools to make sense of complex data. South America and MEA are expected to have a steady growth rate, with CAGRs of 6.7% and 5.9%, respectively, from 2023 to 2032.


Data Visualization Tool Market Regional Insights


Source: Primary Research, Secondary Research, MRFR Database and Analyst Review


Data Visualization Tool Market Key Players And Competitive Insights


Major players in the Data Visualization Tool Market industry are constantly innovating and introducing new features to stay ahead in the competition. Leading Data Visualization Tool Market players are investing heavily in research and development to enhance the capabilities of their products. They are also focusing on developing strategic partnerships and collaborations to expand their market reach. The Data Visualization Tool Market development is driven by the increasing demand for data-driven insights and the need for businesses to make informed decisions. The competitive landscape of the Data Visualization Tool Market is characterized by the presence of both established players and emerging vendors.


One of the leading companies in the Data Visualization Tool Market is Tableau Software. Tableau offers a wide range of data visualization tools that are used by businesses of all sizes. The company's products are known for their ease of use and powerful features. Tableau has a strong global presence and a large customer base. The company is continuously investing in new product development and customer support to maintain its leadership position in the market.


A competitor company in the Data Visualization Tool Market is Microsoft. Microsoft offers a suite of data visualization tools as part of its Microsoft Power BI platform. Microsoft Power BI is a cloud-based platform that provides a wide range of features for data visualization, data analysis, and reporting. The platform is used by businesses of all sizes and is known for its scalability and flexibility. Microsoft is investing heavily in the development of Microsoft Power BI and is expanding its reach through strategic partnerships.


Key Companies in the Data Visualization Tool Market Include


  • Google


  • Qlik


  • TIBCO Software Inc.


  • Salesforce


  • SAS Institute


  • IBM


  • Alteryx


  • Logz.io


  • MicroStrategy


  • Infor


  • Oracle


  • Datadog


  • SAP


  • Microsoft


  • Tableau Software


Data Visualization Tool Market Industry Developments


The Data Visualization Tool Market is projected to reach USD 53.4 billion by 2032, exhibiting a CAGR of 8.41% from 2024 to 2032. The rising demand for data-driven insights, increasing adoption of cloud-based solutions, and growing awareness of the benefits of data visualization are key factors driving market growth. Recent news developments include the acquisition of Tableau by Salesforce in 2019, strengthening Salesforce's position in the data visualization market. Additionally, Microsoft's Power BI platform has gained significant traction, offering advanced data visualization capabilities and integration with other Microsoft products.


Key industry players include Tableau, Microsoft, Qlik, SAP, and IBM, who are continuously investing in innovation and expanding their product offerings. Strategic partnerships and acquisitions are common in the market, as companies seek to enhance their capabilities and expand their market presence.


Data Visualization Tool Market Segmentation Insights


  • Data Visualization Tool Market Deployment Type Outlook


    • On-Premise


    • Cloud-Based


    • Hybrid


  • Data Visualization Tool Market Organization Size Outlook


    • Small and Medium-Sized Enterprises (SMEs)


    • Large Enterprises


  • Data Visualization Tool Market Vertical Outlook


    • IT and Telecommunications


    • Manufacturing


    • Retail


    • Healthcare


    • Banking and Financial Services


  • Data Visualization Tool Market Functionality Outlook


    • Data Exploration and Analysis


    • Dashboarding and Reporting


    • Data Storytelling


  • Data Visualization Tool Market Data Source Outlook


    • Structured Data


    • Semi-Structured Data


    • Unstructured Data


  • Data Visualization Tool Market Regional Outlook


    • North America


    • Europe


    • South America


    • Asia Pacific


    • Middle East and Africa


Report Attribute/Metric Details
Market Size 2022 23.83(USD Billion)
Market Size 2023 25.83(USD Billion)
Market Size 2032 53.4(USD Billion)
Compound Annual Growth Rate (CAGR) 8.41% (2024 - 2032)
Report Coverage Revenue Forecast, Competitive Landscape, Growth Factors, and Trends
Base Year 2023
Market Forecast Period 2024 - 2032
Historical Data 2019 - 2023
Market Forecast Units USD Billion
Key Companies Profiled Google, Qlik, TIBCO Software Inc., Salesforce, SAS Institute, IBM, Alteryx, Logz.io, MicroStrategy, Infor, Oracle, Datadog, SAP, Microsoft, Tableau Software
Segments Covered Deployment Type, Organization Size, Vertical, Functionality, Data Source, Regional
Key Market Opportunities Demand for realtime analytics Cloudbased deployment Advanced visualization techniques Integration with AIML Growing adoption in healthcare and life sciences
Key Market Dynamics Increased cloud adoption Growing demand for realtime data insights Burgeoning adoption in BFSI sector
Countries Covered North America, Europe, APAC, South America, MEA


Frequently Asked Questions (FAQ) :

The Data Visualization Tool Market is anticipated to reach an overall valuation of 25.83 Billion USD in 2023.

The Data Visualization Tool Market is projected to expand to a CAGR of 8.41% from 2023 to 2032.

The Data Visualization Tool Market is estimated to reach an overall valuation of 53.4 Billion USD by 2032.

North America is anticipated to account for the largest market share in the Data Visualization Tool Market in 2023.

The Business Intelligence and Analytics segment is projected to exhibit the highest growth rate in the Data Visualization Tool Market from 2023 to 2032.

Some of the prominent players in the Data Visualization Tool Market include Tableau, Microsoft, Google, IBM, and SAP.

The Asia-Pacific region is estimated to account for a market size of approximately 6.5 Billion USD in the Data Visualization Tool Market in 2023.

The Middle East and Africa region is projected to expand at a CAGR of 9.2% in the Data Visualization Tool Market from 2023 to 2032.

The Banking, Financial Services, and Insurance (BFSI) industry is anticipated to be a major contributor to the growth of the Data Visualization Tool Market.

Some of the emerging trends in the Data Visualization Tool Market include the adoption of cloud-based solutions and the increasing use of artificial intelligence and machine learning.

Leading companies partner with us for data-driven Insights
client_1 client_2 client_3 client_4 client_5 client_6 client_7 client_8 client_9 client_10
Kindly complete the form below to receive a free sample of this Report
Please fill in Business Email for Quick Response

We do not share your information with anyone. However, we may send you emails based on your report interest from time to time. You may contact us at any time to opt-out.

Purchase Option
Single User $ 4,950
Multiuser License $ 5,950
Enterprise User $ 7,250
Compare Licenses
Tailored for You
  • Dedicated Research on any specifics segment or region.
  • Focused Research on specific players in the market.
  • Custom Report based only on your requirements.
  • Flexibility to add or subtract any chapter in the study.
  • Historic data from 2014 and forecasts outlook till 2040.
  • Flexibility of providing data/insights in formats (PDF, PPT, Excel).
  • Provide cross segmentation in applicable scenario/markets.