• Cat-intel
  • MedIntelliX
  • Resources
  • About Us
  • Request Free Sample ×

    Kindly complete the form below to receive a free sample of this Report

    Leading companies partner with us for data-driven Insights

    clients tt-cursor

    Dangerous Hazardous Goods Logistics Market

    ID: MRFR/PNT/8621-CR
    111 Pages
    Snehal Singh
    August 2022

    Dangerous/Hazardous Goods Logistics Market Research Report Information By Type of Goods (Flammable Liquids, Compressed Gases, Corrosives, Oxidizing Substances, Others), Service Type (Transportation, Warehousing & Distribution, Value Added Services), Destination (Domestic, International), End-use Industry (Industrial, Healthcare/Medical, Others), And By Region (North America, Europe, Asia-Pacific, Rest of World) - Forecast Till 2030

    Share:
    Download PDF ×

    We do not share your information with anyone. However, we may send you emails based on your report interest from time to time. You may contact us at any time to opt-out.

    Purchase Options
    $ 4,950.0
    $ 5,950.0
    $ 7,250.0
    Table of Contents

    Dangerous Hazardous Goods Logistics Market Summary

    As per Market Research Future Analysis, the global dangerous/hazardous goods logistics market was valued at USD 200.97 billion in 2021 and is projected to grow from USD 212.87 billion in 2022 to USD 351.09 billion by 2030, with a CAGR of 6.45% during the forecast period (2024-2030). The market is driven by stringent regulations for transporting hazardous materials, increased demand from the oil and gas industry, and the rise in medical waste management due to the COVID-19 pandemic. The market is segmented by type of goods, service type, and end-use industry, with transportation logistics being the largest segment valued at USD 123.08 billion in 2022. The Asia-Pacific region, particularly China, holds a significant share of the market, while North America is also a key player.

    Key Market Trends & Highlights

    The dangerous/hazardous goods logistics market is witnessing significant growth driven by regulatory changes and industry demands.

    • Market size in 2022: USD 212.87 billion; projected to reach USD 351.09 billion by 2030.
    • Transportation logistics segment valued at USD 123.08 billion in 2022.
    • Asia-Pacific market valued at USD 69.50 billion in 2022, with China dominating.
    • CAGR of 6.45% expected during the forecast period (2024-2030).

    Market Size & Forecast

    2021 Market Size USD 200.97 Billion
    2022 Market Size USD 212.87 Billion
    2030 Market Size USD 351.09 Billion
    CAGR (2024-2030) 6.45%

    Major Players

    Key players include Linde plc, Yara International, CATL, Panasonic, Saudi Aramco, BASF SE, Shell plc, LG Chem, Ceva Logistics, Bolloré Logistics, DHL, DSV, and others.

    Dangerous Hazardous Goods Logistics Market Trends

      • The transport and storage of hazardous materials are governed by strict restrictions.

    In order to safely carry and store dangerous materials including explosives, radioactive materials, flammables, and biohazardous waste, workers must undergo extensive training. Therefore, additional safety measures, cautious handling, and adequate packing are required while transporting hazardous items. The pipeline, rail, highway, air, and marine transport of hazardous items are subject to additional safety requirements and standards. New strict policies have been adopted by international organizations, domestic institutions, aviation and shipping divisions, and others to improve the handling of dangerous cargo.

    Strict recommendations for safer dangerous product management have been issued by international and domestic organizations, institutions, and aviation and shipping departments, for safer movement of dangerous goods in shipping. The implementation of these policies is anticipated to propel the expansion of the hazardous products logistics market over the forecast period. Fueling the market expansion are factors such as the growing oil and gas industry, more government rules and regulations regarding the transit of hazardous items, and an uptick in the shipping of nuclear medications, virus samples, and related products during the COVID-19 pandemic.

    To give just one example, the International Maritime Dangerous Goods (IMDG) Code was created by the International Maritime Organization (IMO). To improve and standardize the safe transportation of dangerous products and avoid environmental damage, the International Marine Dangerous Goods Regulation (IMDG Code) has been designed as an international code for the maritime transport of packed dangerous goods and hazardous cargo handling.

    The market for hazardous goods logistics is expanding as a result of an uptick in the necessity of hazardous waste management for ecological preservation. Additionally, governments in several nations have enacted tough regulations against the improper handling, storage, and transportation of toxic waste.

    For these reasons, the hazardous waste management and, by extension, hazardous goods logistics, market is expected to expand at a rapid rate. During the forecast period, the hazardous goods logistics market is expected to grow due to factors like strict rules and regulations for transporting and storing hazardous goods, a rise in digitization, an increase in the use of drones for delivering hazardous goods, and a rise in the oil and gas industry. The hazardous products logistics sector is also poised to benefit from the rising demand for medical waste management and the growing popularity of nuclear power.

    Dangerous Hazardous Goods Logistics Market Drivers

    Market Segment Insights

    Dangerous/hazardous goods logistics Market: Type of Goods Insights

     dangerous/hazardous goods logistics market segmentation based on the type of goods consists of flammable liquids, compressed gases, corrosives, oxidizing substances and others. The market is being propelled by an uptick in the transport of combustible liquids.

    Because of the booming chemical industry, recent market statistics indicate that the proportion of hazardous materials in total freight is increasing rapidly. Two-thirds of all hazardous goods carriers also transport flammable petroleum liquids including kerosene, gasoline, LPG, naphtha, etc. Accidents involving the shipping of such substances are more common than with other types of goods. Fire, explosion, injury, loss of property, and damage to the environment are just some of the terrible outcomes that can come from being involved in a traffic accident. Most of the need is attributable to the transportation of flammable liquids.

    In Europe, for instance, flammable liquids will account for more than half of risky goods transportation by road in 2021, followed by compressed gasses and corrosives.

    In 2021, 57% of all Class 3 flammable liquid-carrying rail tank cars in the United States were built by the new DOT-117 or DOT-117R standards. There were no phase-out dates in 2021. In 2023, ethanol transport restrictions will apply to all DOT-111 and CPC-1232 tank vehicles, which is the next major deadline. This is poised to keep the US dangerous/hazardous goods logistics market poised for revenue growth opportunities in the future.

    Figure 2:  dangerous/hazardous goods logistics market, by Type of Goods, 2022 & 2030 (USD Billion)

    dangerous/hazardous goods logistics market, by Type of Goods, 2022 & 2030 (USD Billion)

    Source: Secondary Research, Primary Research, Market Research Future Database and Analyst Review

    Dangerous/hazardous goods logistics Service Type: Market Insights

    The dangerous/hazardous goods logistics market data is segmented into three subsets based on service type: transportation, warehousing & distribution and value-added services. By far the most popular service category is transportation logistics which is valued at USD 123.08 billion in 2022. Medical, nuclear power, oil and gas, and the petrochemical industries are only a few examples of the widespread usage of hazardous materials in a developing or advanced economy. used. Transporting dangerous commodities safely requires the right vehicles, the right equipment, and the right people.

    Transport companies transporting hazardous materials must adhere to standard practices for the security of their vehicles and ships. Other federal agencies' rules on hazardous products, workplace safety, and environmental protection are also included. During the market forecast period, the hazardous products logistics market stands to benefit enormously from increasingly stringent government restrictions. The US Department of Transportation's (DOT) Pipeline and Hazardous Materials Safety Administration (PHMSA) is in charge of formulating and implementing national standards for the safe transportation of hazardous materials.

    When transporting dangerous commodities to, from, or within the United States, it is imperative that you adhere to the Hazardous Materials Regulations (HMR: 49 CFR Part 100–185).

    To ease trade and ensure the safe and efficient movement of dangerous products, the United Nations Model Regulations on the Carriage of Dangerous Goods serve as a basis for the development of standardized regulations for all forms of transport. Every two years, there is a brand new edition. Labels or marks designed specifically for transporting dangerous commodities on cargo ships must be affixed to the harmful items. More importantly, it helps make transportation safer.

    Figure 2:  dangerous/hazardous goods logistics market, by Service Type, 2022 & 2030 (USD Billion)

    dangerous/hazardous goods logistics market, by Service Type, 2022 & 2030 (USD Billion)

    Source: Secondary Research, Primary Research, Market Research Future Database and Analyst Review

    Dangerous/hazardous goods logistics End-Use Industry: Market Insights

    The dangerous/hazardous goods logistics Market may be divided into three types of end-users: industrial, medical and others. Out of these medical accounts for the largest market share out of all the three end-users. Worldwide, hospitals and other healthcare facilities produce considerable amounts of potentially infectious and dangerous waste daily. Biomedical waste and hospital waste pose substantial risks to both human and environmental health if disposed of or exposed to them without proper precautions being taken. Become. An increase in medical waste was also produced because of the pandemic's effects on the manufacturing of testing kits, transportation, testing, and waste disposal.

    The World Health Organization (WHO) estimated in February 2022 that between March 2020 and November 2021, 87,000 tons of personal protective equipment (PPE) was purchased and transported to support countries' urgent COVID-19 response needs through a joint UN emergency operation. The logistics of transport are crucial in the management of biomedical waste. To get rid of their trash, hospitals often use outside companies. Whether by train, tanker, truck, barge, or any other means, biomedical waste transportation entails moving the material from one location to another.

    There has been a rise in the need for hazardous waste transportation as people become more aware of the dangers that toxic waste poses to both the environment and human health. As a result, the increasing need for biological waste treatment creates promising new avenues for the development of the hazardous products logistics industry.

    The Nagaland Health Project (NHP), for instance, convened a conference at the district level in September 2022 to discuss the rollout of universal biomedical waste management (BMWM) at the Kifia District Hospital.

    Dangerous/hazardous goods logistics Regional Market Outlook

    By Region, the study segments the market into North America, Europe, Asia-Pacific and the Rest of the World. The North America dangerous/hazardous goods logistics market accounted for USD 69.50 billion in 2022 and is expected to exhibit a 6.45% market CAGR during the study period.

    Figure 3:  DANGEROUS/HAZARDOUS GOODS LOGISTICS MARKET SHARE BY REGION 2022 (%)

    DANGEROUS/HAZARDOUS GOODS LOGISTICS MARKET SHARE BY REGION 2022 (%)

    Source: Secondary Research, Primary Research, Market Research Future Database and Analyst Review

    In 2022, the Asia Pacific dangerous/hazardous goods logistics market was valued at USD 69.50 billion, with China’s dangerous/hazardous goods logistics market taking up more than half of the total. In the wake of a dramatic shift in the United States, oil consumption around the world has risen. Large-scale petrochemical developments lessen the gasoline demand. For instance, due to rising domestic demand for petrochemicals, more hazardous goods like oil and gas are being shipped throughout the country via trucking services.

    The U.S. is expected to be the world's biggest oil producer within the next five years, according to the International Energy Agency, surpassing both Russia and Saudi Arabia in that time. In the end, shipping companies are what the oil and gas sector needs to get its goods to customers all over the world. The market for hazardous goods logistics should expand as a result of these market trends. When transporting hazardous materials, it is important to use a label or other identifying indicator on the cargo carriers. In addition, this would greatly improve transit security.

    Dangerous materials must be packaged by applicable laws and guidelines.  Thereby, US dangerous/hazardous goods logistics market is poised to remain one of the most attractive regions for manufacturers to target.

    Approximately 23,700 companies and generators produced 34.9 million tons of hazardous waste in the United States in 2019, as reported by the Environmental Protection Agency (EPA). Industrialization's rising waste output poses a serious problem. Toxic, chemical and combustible materials are all examples of hazardous waste. In addition, when exposed to other components, chemically reactive components can release toxic vapours. Due to their significant impact on the environment, appropriate disposal of these items is essential.

    Europe dangerous/hazardous goods logistics market is valued at USD 53.35 billion, with Germany dangerous/hazardous goods logistics market accounting for nearly one-fifth of the total market. As a result, the expansion of the market should be spurred by the increased demand for transporting dangerous commodities by these standards. The high price of transportation and the presence of possible dangers are seen as threats that will slow the expansion of the market. In addition, new market participants entering the hazardous goods logistics sector and transitioning to nuclear energy necessitate a vehicle, which creates an opening for expansion.

    Regional Insights

    Industry Developments

    Market Segmentation

    Dangerous/hazardous goods logistics Regional Outlook

    North America
    • US
    • Canada

    Dangerous/hazardous goods logistics Destination Outlook

    • Domestic
    • International

    Dangerous/hazardous goods logistics Service Type Outlook

    • Transportation
    • Warehousing & Distribution
    • Value Added Services

    Dangerous/hazardous goods logistics Type of Goods Outlook

    • Flammable Liquids
    • Compressed Gases
    • Corrosives
    • Oxidizing Substances
    • Others

    Dangerous/hazardous goods logistics Regional Market Outlook

    • Ceva Logistics (Switzerland)
    • Bollore Logistics (France)
    • DHL (Germany)
    • DSV (Denmark)
    • DB Schenker (Germany)
    • Hellmann Worldwide Logistics (Germany)
    • DGD Transport (US)
    • Toll Group (Australia)
    • YRC Worldwide Inc. (US)
    • United Parcel Service (US)
    • GEODIS (France)
    • Rhenus Logistics (Germany)
    • Agility Logistics (Kuwait)
    • Kuehne + Nagel (Switzerland)
    • XPO Logistics (US)

    Dangerous/hazardous goods logistics End-use Industry Outlook

    • Industrial
    • Healthcare/Medical
    • Others

    Report Scope

    Report Attribute/Metric Details
    Market Size 2021 USD 200.97 billion
    Market Size 2022 USD 212.87 billion
    Market Size 2030 USD 351.09 billion
    Compound Annual Growth Rate (CAGR) 6.45% (2024-2030)
    Base Year 2021
    Forecast Period 2024-2030
    Historical Data 2019 & 2020
    Forecast Units Value (USD Billion)
    Report Coverage Revenue Forecast, Competitive Landscape, Growth Factors, and Trends
    Segments Covered Type of Goods, Service Type, End-use Industry and Region
    Geographies Covered North America, Europe, Asia Pacific, Rest of the World (Latin America and Middle East & Africa)
    Key Countries Covered U.S., Canada, Mexico, Germany, France, UK, Italy, Spain, China, Japan, India, and South Korea.
    Key Companies Profiled Ceva Logistics, Bollore Logistics, DHL, DSV, DB Schenker, Hellmann Worldwide Logistics, DGD Transport, Toll Group, YRC Worldwide Inc., United Parcel Service, GEODIS, Rhenus Logistics, Agility Logistics, Kuehne + Nagel and XPO Logistics.
    Key Market Opportunities Increased use of technology in the dangerous/hazardous goods logistics industry.
    Key Market Dynamics The need for healthcare waste management services is growing. Increased use of technology in the dangerous/hazardous goods logistics industry Transport and storage of hazardous materials are subject to strict laws.

    Market Highlights

    Author
    Snehal Singh
    Assistant Manager - Research

    High acumen in analyzing complex macro & micro markets with more than 6 years of work experience in the field of market research. By implementing her analytical skills in forecasting and estimation into market research reports, she has expertise in Packaging, Construction, and Equipment domains. She handles a team size of 20-25 resources and ensures smooth running of the projects, associated marketing activities, and client servicing.

    Leave a Comment

    FAQs

    How much is the dangerous/hazardous goods logistics market worth?

    The dangerous/hazardous goods logistics market is pegged at USD 212.87 billion in 2022.

    How Big is the U.S. dangerous/hazardous goods logistics market?

    US dangerous/hazardous goods logistics market is valued at USD 53.26 billion in 2022.

    What is the growth rate of the dangerous/hazardous goods logistics market?

    The dangerous/hazardous goods logistics market is poised to grow at 6.45% CAGR during 2024-2030.

    Which region held the largest market share in the dangerous/hazardous goods logistics market?

    Asia Pacific region held the largest market share in the dangerous/hazardous goods logistics market and was valued at USD 69.53 billion in 2022.

    Who are the key players in the dangerous/hazardous goods logistics market?

    Ceva Logistics, Bollore Logistics, DHL, DSV, DB Schenker, Hellmann Worldwide Logistics, DGD Transport, Toll Group, YRC Worldwide Inc., United Parcel Service, GEODIS, Rhenus Logistics, Agility Logistics, Kuehne + Nagel and XPO Logistics.

    Which application led the dangerous/hazardous goods logistics market?

    Usage of Dangerous/hazardous goods logistics for transporting flammable liquids is poised to drive the market, with a moderate CAGR during 2024-2030

    Which service type is poised to hold the largest market share in the dangerous/hazardous goods logistics market?

    Transportation is poised to hold an upper hand when it comes to dangerous/hazardous goods logistics across markets across diverse geographies.

    1. 'TABLE OF CONTENTS
    2. EXECUTIVE SUMMARY
      1. MARKET ATTRACTIVENESS
    3. ANALYSIS
    4. GLOBAL DANGEROUS/HAZARDOUS GOODS LOGISTICS MARKET, BY DESTINATION
      1. GLOBAL DANGEROUS/HAZARDOUS
    5. GOODS LOGISTICS MARKET, BY SERVICE TYPE
      1. GLOBAL DANGEROUS/HAZARDOUS GOODS LOGISTICS MARKET,
    6. BY CONTAINER TYPE
    7. MARKET INTRODUCTION
    8. DEFINITION
    9. SCOPE OF THE STUDY
    10. MARKET STRUCTURE
    11. RESEARCH METHODOLOGY
    12. RESEARCH PROCESS
    13. PRIMARY RESEARCH
    14. SECONDARY RESEARCH
    15. MARKET SIZE ESTIMATION
    16. TOP DOWN & BOTTOM UP APPROACH
      1. FORECAST MODEL
      2. LIST OF ASSUMPTIONS
    17. MARKET DYNAMICS
      1. INTRODUCTION
      2. DRIVERS
        1. SIGNIFICANT DEMAND FOR FLAMMABLE LIQUIDS ACROSS
    18. GEOGRAPHIES
    19. STRONG GROWTH OF PHARMACEUTICAL AND MEDICAL INDUSTRY
      1. DRIVERS IMPACT ANALYSIS
      2. RESTRAINTS
        1. STRINGENT REGULATIONS PERTAINING TO SHIPPING
    20. DANGEROUS GOODS
    21. RESTRAINTS IMPACT ANALYSIS
      1. OPPORTUNITIES
        1. GROWING ELECTRIC VEHICLE INDUSTRY GROWTH
      2. IMPACT ANALYSIS OF COVID-19 ON DANGEROUS/HAZARDOUS
    22. GOODS LOGISTICS MARKET
    23. COVID-19 IMPACT ON THE LOGISTIC INDUSTRY
      1. ECONOMIC IMPACT
        1. IMPACT OF DANGEROUS/HAZARDOUS GOODS LOGISTICS
    24. MARKET
    25. IMPACT ON SUPPLY CHAIN OF DANGEROUS/HAZARDOUS GOODS LOGISTICS
      1. CASH FLOW CONSTRAINTS
        1. IMPACT ON SHIPMENTS/MARKET
    26. DEMAND
    27. IMPACT ON WORLD TRADE
    28. MARKET FACTOR ANALYSIS
    29. SUPPLY/VALUE CHAIN ANALYSIS
      1. DANGEROUS PRODUCT MANUFACTURERS
        1. LOGISTIC COMPANIES
        2. CUSTOMERS (END USERS)
      2. PORTER’S FIVE FORCES MODEL
        1. THREAT OF NEW ENTRANTS
        2. BARGAINING POWER
    30. OF SUPPLIERS
    31. BARGAINING POWER OF BUYERS
      1. THREAT OF SUBSTITUTES
        1. INTENSITY OF RIVALRY
    32. GLOBAL DANGEROUS/HAZARDOUS GOODS LOGISTICS MARKET,
    33. BY DESTINATION
    34. OVERVIEW
    35. GLOBAL DANGEROUS/HAZARDOUS GOODS LOGISTICS MARKET ESTIMATES & FORECAST BY DESTINATION,
    36. 2030 (USD BILLION)
      1. DOMESTIC
        1. DOMESTIC: DANGEROUS/HAZARDOUS GOODS LOGISTICS MARKET ESTIMATES
    37. & FORECAST BY REGION, 2019-2030
      1. INTERNATIONAL
        1. INTERNATIONAL: DANGEROUS/HAZARDOUS GOODS LOGISTICS
    38. MARKET ESTIMATES & FORECAST BY REGION, 2019-2030
    39. GLOBAL DANGEROUS/HAZARDOUS GOODS LOGISTICS MARKET,
    40. SERVICE TYPE
    41. OVERVIEW
    42. GLOBAL DANGEROUS/HAZARDOUS GOODS LOGISTICS MARKET ESTIMATES & FORECAST SERVICE
    43. TYPE, 2019-2030 (USD BILLION)
      1. TRANSPORTATION
        1. TRANSPORTATION: DANGEROUS/HAZARDOUS GOODS LOGISTICS MARKET ESTIMATES
    44. & FORECAST BY REGION, 2019-2030
      1. WAREHOUSING AND DISTRIBUTION
        1. WAREHOUSING AND DISTRIBUTION: DANGEROUS/HAZARDOUS
    45. GOODS LOGISTICS MARKET ESTIMATES & FORECAST BY REGION, 2019-2030
      1. VALUE-ADDED SERVICES
        1. VALUE-ADDED SERVICES:
    46. DANGEROUS/HAZARDOUS GOODS LOGISTICS MARKET ESTIMATES & FORECAST BY REGION, 2019-2030
    47. GLOBAL DANGEROUS/HAZARDOUS
    48. GOODS LOGISTICS MARKET, BY CONTAINER TYPE
      1. OVERVIEW
        1. GLOBAL DANGEROUS/HAZARDOUS GOODS LOGISTICS
    49. MARKET ESTIMATES & FORECAST BY CONTAINER TYPE, 2019-2030 (USD BILLION)
      1. INSULATED CONTAINERS
        1. INSULATED CONTAINERS:
    50. DANGEROUS/HAZARDOUS GOODS LOGISTICS MARKET ESTIMATES & FORECAST BY REGION, 2019-2030
      1. BOLSTER SHIPPING
    51. CONTAINERS
    52. BOLSTER SHIPPING CONTAINERS: DANGEROUS/HAZARDOUS GOODS LOGISTICS MARKET ESTIMATES
    53. & FORECAST BY REGION, 2019-2030
      1. REFRIGERATED CONTAINERS
        1. REFRIGERATED CONTAINERS: DANGEROUS/HAZARDOUS
    54. GOODS LOGISTICS MARKET ESTIMATES & FORECAST BY REGION, 2019-2030
      1. OTHERS
        1. OTHERS: DANGEROUS/HAZARDOUS
    55. GOODS LOGISTICS MARKET ESTIMATES & FORECAST BY REGION, 2019-2030
    56. GLOBAL DANGEROUS/HAZARDOUS
    57. GOODS LOGISTICS MARKET, BY REGION
      1. OVERVIEW
      2. NORTH AMERICA
        1. U.S.
        2. CANADA
        3. MEXICO
      3. EUROPE
        1. GERMANY
        2. UK
    58. FRANCE
    59. SPAIN
    60. ITALY
    61. RUSSIA
    62. REST OF EUROPE
    63. ASIA PACIFIC
    64. CHINA
    65. JAPAN
    66. INDIA
    67. AUSTRALIA
    68. REST OF ASIA PACIFIC
    69. SOUTH AMERICA
    70. BRAZIL
    71. ARGENTINA
    72. REST OF SOUTH AMERICA
    73. MIDDLE EAST & AFRICA
      1. SAUDI ARABIA
        1. UAE
    74. SOUTH AFRICA
    75. REST OF MIDDLE EAST & AFRICA
    76. COMPETITIVE LANDSCAPE
      1. COMPETITIVE ANALYSIS
      2. COMPETITIVE DASHBOARD
      3. MARKET SHARE ANALYSIS
      4. COMPETITIVE BENCHMARKING
      5. THE LEADING PLAYER IN TERMS OF NUMBER OF DEVELOPMENTS
    77. IN GLOBAL DANGEROUS/HAZARDOUS GOODS LOGISTICS MARKET
      1. KEY DEVELOPMENTS & GROWTH STRATEGIES
        1. SERVICE LAUNCH
        2. AGREEMENT
        3. EXPANSION
        4. PARTNERSHIP
    78. COMPANY PROFILES
      1. CEVA LOGISTICS AG
        1. COMPANY OVERVIEW
        2. FINANCIAL OVERVIEW
        3. PRODUCTS OFFERINGS
        4. KEY DEVELOPMENTS
        5. SWOT ANALYSIS
        6. KEY STRATEGIES
      2. BOLLORÉ LOGISTICS
        1. COMPANY OVERVIEW
        2. FINANCIAL OVERVIEW
        3. PRODUCTS OFFERINGS
        4. KEY DEVELOPMENTS
        5. SWOT ANALYSIS
        6. KEY STRATEGIES
      3. DHL
        1. COMPANY OVERVIEW
        2. FINANCIAL OVERVIEW
        3. PRODUCTS OFFERINGS
        4. KEY DEVELOPMENTS
        5. SWOT ANALYSIS
        6. KEY STRATEGIES
      4. DSV
        1. COMPANY OVERVIEW
        2. FINANCIAL OVERVIEW
        3. PRODUCTS OFFERINGS
        4. KEY DEVELOPMENTS
        5. SWOT ANALYSIS
        6. KEY STRATEGIES
      5. DB SCHENKER
        1. COMPANY OVERVIEW
        2. FINANCIAL OVERVIEW
        3. PRODUCTS OFFERINGS
        4. KEY DEVELOPMENTS
        5. SWOT ANALYSIS
        6. KEY STRATEGIES
      6. TOLL HOLDINGS LIMITED
        1. COMPANY OVERVIEW
        2. FINANCIAL OVERVIEW
        3. PRODUCTS OFFERINGS
        4. KEY DEVELOPMENTS
        5. SWOT ANALYSIS
        6. KEY STRATEGIES
      7. SUTTONS GROUP
        1. COMPANY OVERVIEW
        2. FINANCIAL OVERVIEW
        3. PRODUCTS OFFERINGS
        4. KEY DEVELOPMENTS
        5. SWOT ANALYSIS
        6. KEY STRATEGIES
      8. ELLMANN
        1. COMPANY OVERVIEW
        2. FINANCIAL OVERVIEW
        3. PRODUCTS OFFERINGS
        4. KEY DEVELOPMENTS
        5. SWOT ANALYSIS
        6. KEY STRATEGIES
      9. DGD TRANSPORT
        1. COMPANY OVERVIEW
        2. FINANCIAL OVERVIEW
        3. PRODUCTS OFFERINGS
        4. KEY DEVELOPMENTS
        5. SWOT ANALYSIS
        6. KEY STRATEGIES
      10. YRC WORLDWIDE INC.
        1. COMPANY OVERVIEW
        2. FINANCIAL OVERVIEW
        3. PRODUCTS OFFERINGS
        4. KEY DEVELOPMENTS
        5. SWOT ANALYSIS
        6. KEY STRATEGIES
      11. GEODIS
        1. COMPANY OVERVIEW
        2. FINANCIAL OVERVIEW
        3. PRODUCTS OFFERINGS
        4. KEY DEVELOPMENTS
        5. SWOT ANALYSIS
        6. KEY STRATEGIES
      12. EASTREX LOGISTICS
    79. SDN BHD
    80. COMPANY OVERVIEW
    81. FINANCIAL OVERVIEW
    82. PRODUCTS OFFERINGS
    83. KEY DEVELOPMENTS
    84. SWOT ANALYSIS
    85. KEY STRATEGIES
    86. RHENUS GROUP
    87. COMPANY OVERVIEW
    88. FINANCIAL OVERVIEW
    89. PRODUCTS OFFERINGS
    90. KEY DEVELOPMENTS
    91. SWOT ANALYSIS
    92. KEY STRATEGIES
    93. AGILITY
    94. COMPANY OVERVIEW
    95. FINANCIAL OVERVIEW
    96. PRODUCTS OFFERINGS
    97. KEY DEVELOPMENTS
    98. SWOT ANALYSIS
    99. KEY STRATEGIES
    100. SGS SA
    101. COMPANY OVERVIEW
    102. FINANCIAL OVERVIEW
    103. PRODUCTS OFFERINGS
    104. KEY DEVELOPMENTS
    105. SWOT ANALYSIS
    106. KEY STRATEGIES
    107. REFERENCES
    108. GOODS LOGISTICS MARKET ESTIMATES & FORECAST, BY DESTINATION, 2019-2030 (USD
    109. BILLION)
    110. DANGEROUS/HAZARDOUS GOODS LOGISTICS MARKET ESTIMATES & FORECAST, BY REGION,
    111. 2030 (USD BILLION)
    112. FORECAST, BY REGION, 2019-2030 (USD BILLION)
    113. MARKET ESTIMATES & FORECAST, SERVICE TYPE, 2019-2030 (USD BILLION)
    114. GOODS LOGISTICS MARKET ESTIMATES & FORECAST, BY TRANSPORTATION, BY REGION, 2019-2030
    115. (USD BILLION)
    116. DANGEROUS/HAZARDOUS GOODS LOGISTICS MARKET ESTIMATES & FORECAST, BY WAREHOUSING
    117. AND DISTRIBUTION, BY REGION, 2019-2030 (USD BILLION)
    118. ESTIMATES & FORECAST, BY VALUE-ADDED SERVICES, BY REGION, 2019-2030 (USD BILLION)
    119. GOODS LOGISTICS MARKET ESTIMATES & FORECAST, BY CONTAINER TYPE, 2019-2030 (USD
    120. BILLION)
    121. DANGEROUS/HAZARDOUS GOODS LOGISTICS MARKET ESTIMATES & FORECAST, BY INSULATED
    122. CONTAINERS, BY REGION, 2019-2030 (USD BILLION)
    123. ESTIMATES & FORECAST, BY BOLSTER SHIPPING CONTAINERS, BY REGION, 2019-2030 (USD
    124. BILLION)
    125. DANGEROUS/HAZARDOUS GOODS LOGISTICS MARKET ESTIMATES & FORECAST, BY HCV,
    126. BY REGION, 2019-2030 (USD BILLION)
    127. & FORECAST, BY OTHERS, BY REGION, 2019-2030 (USD BILLION)
    128. GOODS LOGISTICS MARKET, BY REGION, 2019-2030 (USD BILLION)
    129. LOGISTICS MARKET, BY COUNTRY, 2019-2030 (USD BILLION)
    130. LOGISTICS MARKET, BY DESTINATION, 2019-2030 (USD BILLION)
    131. LOGISTICS MARKET, SERVICE TYPE, 2019-2030 (USD BILLION)
    132. LOGISTICS MARKET, BY CONTAINER TYPE, 2019-2030 (USD BILLION)
    133. MARKET, BY DESTINATION, 2019-2030 (USD BILLION)
    134. MARKET, SERVICE TYPE, 2019-2030 (USD BILLION)
    135. MARKET, BY CONTAINER TYPE, 2019-2030 (USD BILLION)
    136. MARKET, BY DESTINATION, 2019-2030 (USD BILLION)
    137. MARKET, SERVICE TYPE, 2019-2030 (USD BILLION)
    138. MARKET, BY CONTAINER TYPE, 2019-2030 (USD BILLION)
    139. MARKET, BY DESTINATION, 2019-2030 (USD BILLION)
    140. MARKET, SERVICE TYPE, 2019-2030 (USD BILLION)
    141. MARKET, BY CONTAINER TYPE, 2019-2030 (USD BILLION)
    142. MARKET, BY COUNTRY, 2019-2030 (USD BILLION)
    143. MARKET, BY DESTINATION, 2019-2030 (USD BILLION)
    144. MARKET, SERVICE TYPE, 2019-2030 (USD BILLION)
    145. MARKET, BY CONTAINER TYPE, 2019-2030 (USD BILLION)
    146. MARKET, BY DESTINATION, 2019-2030 (USD BILLION)
    147. MARKET, SERVICE TYPE, 2019-2030 (USD BILLION)
    148. MARKET, BY CONTAINER TYPE, 2019-2030 (USD BILLION)
    149. MARKET, BY DESTINATION, 2019-2030 (USD BILLION)
    150. MARKET, SERVICE TYPE, 2019-2030 (USD BILLION)
    151. MARKET, BY CONTAINER TYPE, 2019-2030 (USD BILLION)
    152. MARKET, BY DESTINATION, 2019-2030 (USD BILLION)
    153. MARKET, SERVICE TYPE, 2019-2030 (USD BILLION)
    154. MARKET, BY CONTAINER TYPE, 2019-2030 (USD BILLION)
    155. MARKET, BY DESTINATION, 2019-2030 (USD BILLION)
    156. MARKET, SERVICE TYPE, 2019-2030 (USD BILLION)
    157. MARKET, BY CONTAINER TYPE, 2019-2030 (USD BILLION)
    158. MARKET, BY DESTINATION, 2019-2030 (USD BILLION)
    159. MARKET, SERVICE TYPE, 2019-2030 (USD BILLION)
    160. MARKET, BY CONTAINER TYPE, 2019-2030 (USD BILLION)
    161. MARKET, BY DESTINATION, 2019-2030 (USD BILLION)
    162. MARKET, SERVICE TYPE, 2019-2030 (USD BILLION)
    163. MARKET, BY CONTAINER TYPE, 2019-2030 (USD BILLION)
    164. LOGISTICS MARKET, BY DESTINATION, 2019-2030 (USD BILLION)
    165. LOGISTICS MARKET, SERVICE TYPE, 2019-2030 (USD BILLION)
    166. LOGISTICS MARKET, BY CONTAINER TYPE, 2019-2030 (USD BILLION)
    167. LOGISTICS MARKET, BY COUNTRY, 2019-2030 (USD BILLION)
    168. LOGISTICS MARKET, BY DESTINATION, 2019-2030 (USD BILLION)
    169. LOGISTICS MARKET, SERVICE TYPE, 2019-2030 (USD BILLION)
    170. LOGISTICS MARKET, BY CONTAINER TYPE, 2019-2030 (USD BILLION)
    171. MARKET, BY DESTINATION, 2019-2030 (USD BILLION)
    172. MARKET, SERVICE TYPE, 2019-2030 (USD BILLION)
    173. MARKET, BY CONTAINER TYPE, 2019-20'

    Dangerous/Hazardous Goods Logistics Type of Goods Outlook (USD Million, 2019-2030)

    • Flammable Liquids
    • Compressed Gases
    • Corrosives
    • Oxidizing Substances
    • Others

    Dangerous/Hazardous Goods Logistics Service Type Outlook (USD Million, 2019-2030)

    • Transportation
    • Warehousing & Distribution
    • Value Added Services

    Dangerous/Hazardous Goods Logistics Destination Outlook (USD Million, 2019-2030)

    • Domestic
    • International

    Dangerous/Hazardous Goods Logistics End-use Industry Outlook (USD Million, 2019-2030)

    • Industrial
    • Healthcare/Medical
    • Others

    Dangerous/Hazardous Goods Logistics Regional Outlook (USD Million, 2019-2030)

    • North America Outlook (USD Million, 2019-2030)

      • North America Dangerous/Hazardous Goods Logistics by Type of Goods
        • Flammable Liquids
        • Compressed Gases
        • Corrosives
        • Oxidizing Substances
        • Others
      • North America Dangerous/Hazardous Goods Logistics by Service Type
        • Transportation
        • Warehousing & Distribution
        • Value Added Services
      • North America Dangerous/Hazardous Goods Logistics by Destination
        • Domestic
        • International
      • North America Dangerous/Hazardous Goods Logistics by End-use Industry
        • Industrial
        • Healthcare/Medical
        • Others
      • US Outlook (USD Million, 2019-2030)

      • US Dangerous/Hazardous Goods Logistics by Type of Goods
        • Domestic
        • International
      • US Dangerous/Hazardous Goods Logistics by Service Type
        • Transportation
        • Warehousing & Distribution
        • Value Added Services
      • US Dangerous/Hazardous Goods Logistics by Destination
        • Domestic
        • International
      • US Dangerous/Hazardous Goods Logistics by End-use Industry
        • Industrial
        • Healthcare/Medical
        • Others
      • Canada Outlook (USD Million, 2019-2030)

      • Canada Dangerous/Hazardous Goods Logistics by Type of Goods
        • Flammable Liquids
        • Compressed Gases
        • Corrosives
        • Oxidizing Substances
        • Others
      • Canada Dangerous/Hazardous Goods Logistics by Service Type
        • Transportation
        • Warehousing & Distribution
        • Value Added Services
      • Canada Dangerous/Hazardous Goods Logistics by Destination
        • Domestic
        • International
      • Canada Dangerous/Hazardous Goods Logistics by End-use Industry
        • Industrial
        • Healthcare/Medical
        • Others
      • Mexico Outlook (USD Million, 2019-2030)

      • Mexico Dangerous/Hazardous Goods Logistics by Type of Goods

        • Flammable Liquids
        • Compressed Gases
        • Corrosives
        • Oxidizing Substances
        • Others
      • Mexico Dangerous/Hazardous Goods Logistics by Service Type

        • Transportation
        • Warehousing & Distribution
        • Value Added Services
      • Mexico Dangerous/Hazardous Goods Logistics by Destination

        • Domestic
        • International
      • Mexico Dangerous/Hazardous Goods Logistics by End-use Industry
        • Industrial
        • Healthcare/Medical
        • Others
    • Europe Outlook (USD Million, 2019-2030)

      • Europe Dangerous/Hazardous Goods Logistics by Type of Goods
        • Flammable Liquids
        • Compressed Gases
        • Corrosives
        • Oxidizing Substances
        • Others
      • Europe Dangerous/Hazardous Goods Logistics by Service Type
        • Transportation
        • Warehousing & Distribution
        • Value Added Services
      • Europe Dangerous/Hazardous Goods Logistics by Destination
        • Domestic
        • International
      • Europe Dangerous/Hazardous Goods Logistics by End-use Industry
        • Industrial
        • Healthcare/Medical
        • Others
      • Germany Outlook (USD Million, 2019-2030)

      • Germany Dangerous/Hazardous Goods Logistics by Type of Goods
        • Flammable Liquids
        • Compressed Gases
        • Corrosives
        • Oxidizing Substances
        • Others
      • Germany Dangerous/Hazardous Goods Logistics by Service Type
        • Transportation
        • Warehousing & Distribution
        • Value Added Services
      • Germany Dangerous/Hazardous Goods Logistics by Destination
        • Domestic
        • International
      • Germany Dangerous/Hazardous Goods Logistics by End-use Industry
        • Industrial
        • Healthcare/Medical
        • Others
      • France Outlook (USD Million, 2019-2030)

      • France Dangerous/Hazardous Goods Logistics by Type of Goods
        • Flammable Liquids
        • Compressed Gases
        • Corrosives
        • Oxidizing Substances
        • Others
      • France Dangerous/Hazardous Goods Logistics by Service Type
        • Transportation
        • Warehousing & Distribution
        • Value Added Services
      • France Dangerous/Hazardous Goods Logistics by Destination
        • Domestic
        • International
      • France Dangerous/Hazardous Goods Logistics by End-use Industry
        • Industrial
        • Healthcare/Medical
        • Others
      • UK Outlook (USD Million, 2019-2030)

      • UK Dangerous/Hazardous Goods Logistics by Type of Goods
        • Flammable Liquids
        • Compressed Gases
        • Corrosives
        • Oxidizing Substances
        • Others
      • UK Dangerous/Hazardous Goods Logistics by Service Type
        • Transportation
        • Warehousing & Distribution
        • Value Added Services
      • UK Dangerous/Hazardous Goods Logistics by Destination
        • Domestic
        • International
      • UK Dangerous/Hazardous Goods Logistics by End-use Industry
        • Industrial
        • Healthcare/Medical
        • Others
      • Italy Outlook (USD Million, 2019-2030)

      • Italy Dangerous/Hazardous Goods Logistics by Type of Goods
        • Flammable Liquids
        • Compressed Gases
        • Corrosives
        • Oxidizing Substances
        • Others
      • Italy Dangerous/Hazardous Goods Logistics by Service Type
        • Transportation
        • Warehousing & Distribution
        • Value Added Services
      • Italy Dangerous/Hazardous Goods Logistics by Destination
        • Domestic
        • International
      • Italy Dangerous/Hazardous Goods Logistics by End-use Industry
        • Industrial
        • Healthcare/Medical
        • Others
      • Spain Outlook (USD Million, 2019-2030)

      • Spain Dangerous/Hazardous Goods Logistics by Type of Goods
        • Flammable Liquids
        • Compressed Gases
        • Corrosives
        • Oxidizing Substances
        • Others
      • Spain Dangerous/Hazardous Goods Logistics by Service Type
        • Transportation
        • Warehousing & Distribution
        • Value Added Services
      • Spain Dangerous/Hazardous Goods Logistics by Destination
        • Domestic
        • International
      • Spain Dangerous/Hazardous Goods Logistics by End-use Industry
        • Industrial
        • Healthcare/Medical
        • Others
      • Rest Of Europe Outlook (USD Million, 2019-2030)

      • Rest of Europe Dangerous/Hazardous Goods Logistics by Type of Goods
        • Flammable Liquids
        • Compressed Gases
        • Corrosives
        • Oxidizing Substances
        • Others
      • Rest of Europe Dangerous/Hazardous Goods Logistics by Service Type
        • Transportation
        • Warehousing & Distribution
        • Value Added Services
      • Rest of Europe Dangerous/Hazardous Goods Logistics by Destination
        • Domestic
        • International
      • Rest of Europe Dangerous/Hazardous Goods Logistics by End-use Industry
        • Industrial
        • Healthcare/Medical
        • Others
    • Asia-Pacific Outlook (USD Million, 2019-2030)

      • Asia-Pacific Dangerous/Hazardous Goods Logistics by Type of Goods
        • Flammable Liquids
        • Compressed Gases
        • Corrosives
        • Oxidizing Substances
        • Others
      • Asia-Pacific Dangerous/Hazardous Goods Logistics by Service Type
        • Transportation
        • Warehousing & Distribution
        • Value Added Services
      • Asia-Pacific Dangerous/Hazardous Goods Logistics by Destination
        • Domestic
        • International
      • Asia Pacific Dangerous/Hazardous Goods Logistics by End-use Industry
        • Industrial
        • Healthcare/Medical
        • Others
      • China Outlook (USD Million, 2019-2030)

      • China Dangerous/Hazardous Goods Logistics by Type of Goods
        • Flammable Liquids
        • Compressed Gases
        • Corrosives
        • Oxidizing Substances
        • Others
      • China Dangerous/Hazardous Goods Logistics by Service Type
        • Transportation
        • Warehousing & Distribution
        • Value Added Services
      • China Dangerous/Hazardous Goods Logistics by Destination
        • Domestic
        • International
      • China Dangerous/Hazardous Goods Logistics by End-use Industry
        • Industrial
        • Healthcare/Medical
        • Others
      • Japan Outlook (USD Million, 2019-2030)

      • Japan Dangerous/Hazardous Goods Logistics by Type of Goods
        • Flammable Liquids
        • Compressed Gases
        • Corrosives
        • Oxidizing Substances
        • Others
      • Japan Dangerous/Hazardous Goods Logistics by Service Type
        • Transportation
        • Warehousing & Distribution
        • Value Added Services
      • Japan Dangerous/Hazardous Goods Logistics by Destination
        • Domestic
        • International
      • Japan Dangerous/Hazardous Goods Logistics by End-use Industry
        • Industrial
        • Healthcare/Medical
        • Others
      • India Outlook (USD Million, 2019-2030)

      • India Dangerous/Hazardous Goods Logistics by Type of Goods
        • Flammable Liquids
        • Compressed Gases
        • Corrosives
        • Oxidizing Substances
        • Others
      • India Dangerous/Hazardous Goods Logistics by Service Type
        • Transportation
        • Warehousing & Distribution
        • Value Added Services
      • India Dangerous/Hazardous Goods Logistics by Destination
        • Domestic
        • International
      • India Dangerous/Hazardous Goods Logistics by End-use Industry
        • Industrial
        • Healthcare/Medical
        • Others
      • South Korea Outlook (USD Million, 2019-2030)

      • South Korea Dangerous/Hazardous Goods Logistics by Type of Goods
        • Flammable Liquids
        • Compressed Gases
        • Corrosives
        • Oxidizing Substances
        • Others
      • South Korea Dangerous/Hazardous Goods Logistics by Service Type
        • Transportation
        • Warehousing & Distribution
        • Value Added Services
      • South Korea Dangerous/Hazardous Goods Logistics by Destination
        • Domestic
        • International
      • South Korea Dangerous/Hazardous Goods Logistics by End-use Industry
        • Industrial
        • Healthcare/Medical
        • Others
      • Rest of Asia-Pacific Outlook (USD Million, 2019-2030)

      • Rest of Asia-Pacific Dangerous/Hazardous Goods Logistics by Type of Goods
        • Flammable Liquids
        • Compressed Gases
        • Corrosives
        • Oxidizing Substances
        • Others
      • Rest of Asia-Pacific Dangerous/Hazardous Goods Logistics by Service Type
        • Transportation
        • Warehousing & Distribution
        • Value Added Services
      • Rest of Asia-Pacific Dangerous/Hazardous Goods Logistics by Destination
        • Domestic
        • International
      • Rest of Asia Pacific Dangerous/Hazardous Goods Logistics by End-use Industry
        • Industrial
        • Healthcare/Medical
        • Others
    • Rest of World Outlook (USD Million, 2019-2030)

      • Latin America Dangerous/Hazardous Goods Logistics by Type of Goods
        • Flammable Liquids
        • Compressed Gases
        • Corrosives
        • Oxidizing Substances
        • Others
      • Latin America Dangerous/Hazardous Goods Logistics by Service Type
        • Transportation
        • Warehousing & Distribution
        • Value Added Services
      • Latin America Dangerous/Hazardous Goods Logistics by Destination
        • Domestic
        • International
      • Latin America Dangerous/Hazardous Goods Logistics by End-use Industry
        • Industrial
        • Healthcare/Medical
        • Others
      • Middle East & Africa Outlook (USD Million, 2019-2030)

      • Middle East & Africa Dangerous/Hazardous Goods Logistics by Type of Goods
        • Flammable Liquids
        • Compressed Gases
        • Corrosives
        • Oxidizing Substances
        • Others
      • Middle East & Africa Dangerous/Hazardous Goods Logistics by Service Type
        • Transportation
        • Warehousing & Distribution
        • Value Added Services
      • Middle East & Africa Dangerous/Hazardous Goods Logistics by Destination
        • Domestic
        • International
      • Middle East & Africa Dangerous/Hazardous Goods Logistics by End-use Industry
        • Industrial
        • Healthcare/Medical
        • Others
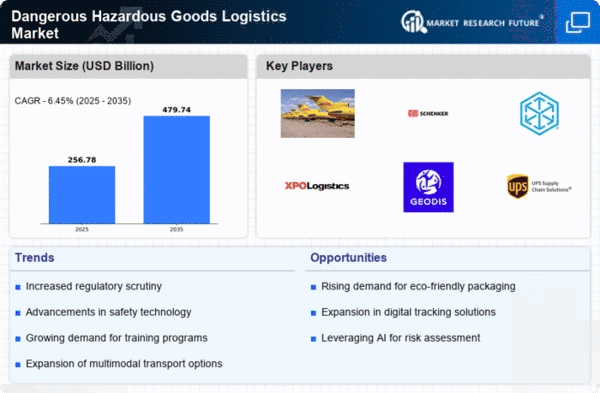
    Dangerous-Hazardous Goods Logistics Market Research Report—Global Forecast till 2030 Infographic
    Free Sample Request

    Kindly complete the form below to receive a free sample of this Report

    Customer Strories

    “I am very pleased with how market segments have been defined in a relevant way for my purposes (such as "Portable Freezers & refrigerators" and "last-mile"). In general the report is well structured. Thanks very much for your efforts.”

    Victoria Milne Founder
    Case Study

    Chemicals and Materials