• Cat-intel
  • MedIntelliX
  • Resources
  • About Us
  • Request Free Sample ×

    Kindly complete the form below to receive a free sample of this Report

    Leading companies partner with us for data-driven Insights

    clients tt-cursor

    Canada Virtual Network Functions Market

    ID: MRFR/ICT/60602-HCR
    200 Pages
    Aarti Dhapte
    September 2025

    Canada Virtual Network Functions Market Research Report By Component (Solutions, Orchestration and Automation, Services), By Functions (Compute, Storage, Network), By Application (Virtual Appliance, Core Network), By Organization Size (SMEs, Large Enterprises) and By End-User (Service Provider, Data Centers, Enterprises)-Forecast to 2035

    Share:
    Download PDF ×

    We do not share your information with anyone. However, we may send you emails based on your report interest from time to time. You may contact us at any time to opt-out.

    Canada Virtual Network Functions Market Research Report-Forecast to 2035 Infographic
    Purchase Options
    $ 4,950.0
    $ 5,950.0
    $ 7,250.0
    Table of Contents

    Canada Virtual Network Functions Market Summary

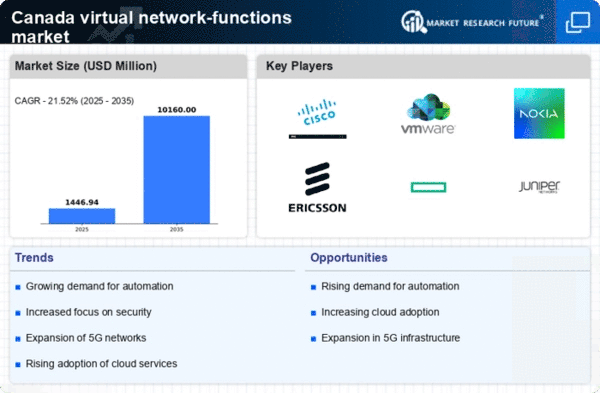
    The Canada Virtual Network Functions market is projected to grow significantly from 1.59 USD Billion in 2024 to 6.43 USD Billion by 2035.

    Key Market Trends & Highlights

    Canada Virtual Network Functions Key Trends and Highlights

    • The market is expected to experience a compound annual growth rate of 13.54 percent from 2025 to 2035.
    • By 2035, the market valuation is anticipated to reach 6.43 USD Billion, indicating robust growth potential.
    • In 2024, the market is valued at 1.59 USD Billion, reflecting a strong foundation for future expansion.
    • Growing adoption of cloud technologies due to increasing demand for flexible network solutions is a major market driver.

    Market Size & Forecast

    2024 Market Size 1.59 (USD Billion)
    2035 Market Size 6.43 (USD Billion)
    CAGR (2025-2035) 13.54%

    Major Players

    F5 Networks, Hewlett Packard Enterprise, Juniper Networks, Nokia, Mavenir, Netcracker Technology, Cisco Systems, Amdocs, Ericsson, Oracle, IBM, Ciena, VMware

    Canada Virtual Network Functions Market Trends

    The Canada Virtual Network Functions Market is growing quickly because more and more businesses need to go digital. The move from traditional networking to software-based solutions has picked up speed as Canadian firms continue to use cloud computing and virtualization. The main reason for this is the requirement for better operational efficiency, lower costs, and better scalability that virtual network functions provide.

    This change has also been helped by government programs that encourage digital innovation and the upgrade of infrastructure. In Canada, there are chances to look into the expanding use of 5G technology, which will make virtual network functions work better and give people faster and more dependable connections.

    The growing trend of working from home makes it even more important to have flexible and dynamic networking solutions. This is a good thing for virtual network functions to grow. There is also much room for small and medium-sized businesses to use these technologies, which will help the market grow even more. Recent trends show that industries, including telecommunications, healthcare, and finance, are aggressively looking into virtualization to make services better and improve the consumer experience.

    Because of this, the Canada Virtual Network Functions Market is ready to keep changing, with new ideas and the flexibility to adapt to suit the needs of its many industries.

    Canada Virtual Network Functions Market Drivers

    Market Segment Insights

    Get more detailed insights about Canada Virtual Network Functions Market Research Report-Forecast to 2035

    Regional Insights

    Key Players and Competitive Insights

    The Canada Virtual Network Functions Market is experiencing significant growth driven by advancements in networking technologies and the increasing demand for flexibility and scalability in IT infrastructure. A variety of stakeholders, including telecommunications service providers, enterprises, and cloud service providers, are adopting virtual network functions to enhance their service offerings and reduce operational costs. The competitive landscape in this market is characterized by the presence of several prominent players, each vying for market share through innovative solutions and strategic partnerships.

    As organizations prioritize network agility and digital transformation, the ability to offer robust, efficient, and scalable virtual network functions is becoming a key differentiator among competitors.F5 Networks has established itself as a formidable player in the Canada Virtual Network Functions Market, primarily focusing on application services and security within virtualized environments. The company's offerings are centered around advanced application delivery and security solutions that allow organizations to manage their applications efficiently in a cloud-native architecture.

    With a strong emphasis on performance optimization and robust security measures, F5 Networks is well-positioned in the Canadian market. The company’s strengths lie in its ability to provide comprehensive solutions that encompass load balancing, application firewall capabilities, and secure access services, allowing businesses to navigate the complexities of modern IT infrastructures effectively. As the demand for secure and efficient applications continues to rise, F5 Networks' commitment to innovation and customer satisfaction further solidifies its position in the competitive landscape.

    Hewlett Packard Enterprise (HPE) is another major player in the Canada Virtual Network Functions Market, offering a diverse range of products and services tailored for virtualized networking environments. HPE’s strengths include its extensive portfolio of networking hardware, software, and integrated solutions that support the deployment of virtual network functions seamlessly across various platforms.

    The company has been actively expanding its footprint in Canada through strategic mergers and acquisitions, enhancing its capabilities to provide comprehensive networking solutions. Key products include its network virtualization software and integrated systems designed to facilitate the deployment of virtual network functions in both on-premise and cloud environments.

    HPE's significant investment in research and development further supports its market presence, enabling it to adapt to the evolving needs of customers seeking innovative networking solutions. By leveraging its established brand and strong partner ecosystem, HPE continues to gain traction in the Canada Virtual Network Functions Market, providing organizations with reliable and scalable networking solutions.

    Key Companies in the Canada Virtual Network Functions Market market include

    Industry Developments

    The Canada Virtual Network Functions Market has seen significant developments recently, particularly with companies like F5 Networks, Hewlett Packard Enterprise, and Cisco Systems expanding their presence. In September 2023, it was reported that VMware launched a new suite of Cloud Networking solutions aimed at enhancing security and performance for Canadian enterprises.

    Additionally, in August 2023, Juniper Networks announced enhancements to its Contrail Networking platform, which is expected to boost operational efficiencies for Canadian service providers. Growth in market valuation has also been notable, with Mavenir reporting a 25% increase in revenues for Q2 2023 compared to the previous year, signaling robust demand for Virtual Network Functions.

    Over the last few years, the market has witnessed a surge in demand for cloud-based solutions, driven by increasing digital transformation initiatives across various sectors in Canada, reflecting the growing trend towards virtualization.

    Market Segmentation

    Virtual Network Functions Market End-User Outlook

    • Service Provider
    • Data Centers
    • Enterprises

    Virtual Network Functions Market Component Outlook

    • Compute
    • Storage
    • Network

    Virtual Network Functions Market Functions Outlook

    • Virtual Appliance
    • Core Network

    Virtual Network Functions Market Application Outlook

    • SMEs
    • Large Enterprises

    Virtual Network Functions Market Organization Size Outlook

    • Service Provider
    • Data Centers
    • Enterprises

    Report Scope


    Report Attribute/Metric Source: Details
    MARKET SIZE 2023 1.32(USD Billion)
    MARKET SIZE 2024 1.59(USD Billion)
    MARKET SIZE 2035 6.43(USD Billion)
    COMPOUND ANNUAL GROWTH RATE (CAGR) 13.564% (2025 - 2035)
    REPORT COVERAGE Revenue Forecast, Competitive Landscape, Growth Factors, and Trends
    BASE YEAR 2024
    MARKET FORECAST PERIOD 2025 - 2035
    HISTORICAL DATA 2019 - 2024
    MARKET FORECAST UNITS USD Billion
    KEY COMPANIES PROFILED F5 Networks, Hewlett Packard Enterprise, Juniper Networks, ZTE, Nokia, Mavenir, Netcracker Technology, Cisco Systems, Amdocs, Ericsson, Oracle, IBM, Ciena, Huawei Technologies, VMware
    SEGMENTS COVERED Component, Functions, Application, Organization Size, End-User
    KEY MARKET OPPORTUNITIES 5G network infrastructure expansion, Increasing demand for cloud services, Integration of AI and automation, Rising cybersecurity concerns, Growth in IoT applications
    KEY MARKET DYNAMICS growing demand for cloud services, increase in network virtualization, shift towards 5G technology, need for cost-effective solutions, rising cybersecurity concerns
    COUNTRIES COVERED Canada

    Market Highlights

    Author
    Aarti Dhapte
    Team Lead - Research

    She holds an experience of about 6+ years in Market Research and Business Consulting, working under the spectrum of Information Communication Technology, Telecommunications and Semiconductor domains. Aarti conceptualizes and implements a scalable business strategy and provides strategic leadership to the clients. Her expertise lies in market estimation, competitive intelligence, pipeline analysis, customer assessment, etc.

    Leave a Comment

    FAQs

    What is the projected market size for the Canada Virtual Network Functions Market in 2024?

    The projected market size for the Canada Virtual Network Functions Market in 2024 is expected to be valued at 1.59 billion USD.

    What is the expected market value for the Canada Virtual Network Functions Market by 2035?

    By 2035, the Canada Virtual Network Functions Market is expected to reach a value of 6.43 billion USD.

    What is the Compound Annual Growth Rate (CAGR) for the Canada Virtual Network Functions Market from 2025 to 2035?

    The expected CAGR for the Canada Virtual Network Functions Market from 2025 to 2035 is 13.564 percent.

    Which component is anticipated to hold the largest market value in 2035?

    By 2035, the Solutions component is anticipated to hold the largest market value at 2.87 billion USD.

    What is the market size for Orchestration and Automation in the Canada Virtual Network Functions Market in 2024?

    The market size for Orchestration and Automation in 2024 is valued at 0.47 billion USD.

    Which key players are leading the Canada Virtual Network Functions Market?

    Key players in the market include Cisco Systems, Ericsson, Huawei Technologies, and VMware.

    How much is the Services segment valued at in 2024 for the Canada Virtual Network Functions Market?

    The Services segment is valued at 0.4 billion USD in 2024.

    What are the growth prospects for the Canada Virtual Network Functions Market in terms of opportunities?

    The market presents significant growth opportunities due to increasing demand for network automation and flexibility.

    What impact does digital transformation have on the Canada Virtual Network Functions Market?

    Digital transformation is driving innovation and growth in the Canada Virtual Network Functions Market as businesses adopt virtual technologies.

    What is the projected market size for the Orchestration and Automation segment by 2035?

    The projected market size for the Orchestration and Automation segment by 2035 is expected to reach 1.92 billion USD.

    1. EXECUTIVE
    2. SUMMARY
    3. Market Overview
    4. Key Findings
    5. Market Segmentation
    6. Competitive Landscape
    7. Challenges and Opportunities
    8. Future Outlook
    9. MARKET INTRODUCTION
    10. Definition
    11. Scope of the study
    12. Research Objective
    13. Assumption
    14. Limitations
    15. RESEARCH
    16. METHODOLOGY
    17. Overview
    18. Data
    19. Mining
    20. Secondary Research
    21. Primary
    22. Research
    23. Primary Interviews and Information Gathering
    24. Process
    25. Breakdown of Primary Respondents
    26. Forecasting
    27. Model
    28. Market Size Estimation
    29. Bottom-Up
    30. Approach
    31. Top-Down Approach
    32. Data
    33. Triangulation
    34. Validation
    35. MARKET
    36. DYNAMICS
    37. Overview
    38. Drivers
    39. Restraints
    40. Opportunities
    41. MARKET FACTOR ANALYSIS
    42. Value chain Analysis
    43. Porter's
    44. Five Forces Analysis
    45. Bargaining Power of Suppliers
    46. Bargaining
    47. Power of Buyers
    48. Threat of New Entrants
    49. Threat
    50. of Substitutes
    51. Intensity of Rivalry
    52. COVID-19
    53. Impact Analysis
    54. Market Impact Analysis
    55. Regional
    56. Impact
    57. Opportunity and Threat Analysis
    58. Canada
    59. Virtual Network Functions Market, BY Component (USD Billion)
    60. Solutions
    61. Orchestration
    62. and Automation
    63. Services
    64. Canada
    65. Virtual Network Functions Market, BY Functions (USD Billion)
    66. Compute
    67. Storage
    68. Network
    69. Canada
    70. Virtual Network Functions Market, BY Application (USD Billion)
    71. Virtual
    72. Appliance
    73. Core Network
    74. Canada
    75. Virtual Network Functions Market, BY Organization Size (USD Billion)
    76. SMEs
    77. Large
    78. Enterprises
    79. Canada Virtual
    80. Network Functions Market, BY End-User (USD Billion)
    81. Service
    82. Provider
    83. Data Centers
    84. Enterprises
    85. Competitive Landscape
    86. Overview
    87. Competitive
    88. Analysis
    89. Market share Analysis
    90. Major
    91. Growth Strategy in the Virtual Network Functions Market
    92. Competitive
    93. Benchmarking
    94. Leading Players in Terms of Number of Developments
    95. in the Virtual Network Functions Market
    96. Key developments
    97. and growth strategies
    98. New Product Launch/Service Deployment
    99. Merger
    100. & Acquisitions
    101. Joint Ventures
    102. Major
    103. Players Financial Matrix
    104. Sales and Operating Income
    105. Major
    106. Players R&D Expenditure. 2023
    107. Company
    108. Profiles
    109. F5 Networks
    110. Financial
    111. Overview
    112. Products Offered
    113. Key
    114. Developments
    115. SWOT Analysis
    116. Key
    117. Strategies
    118. Hewlett Packard Enterprise
    119. Financial
    120. Overview
    121. Products Offered
    122. Key
    123. Developments
    124. SWOT Analysis
    125. Key
    126. Strategies
    127. Juniper Networks
    128. Financial
    129. Overview
    130. Products Offered
    131. Key
    132. Developments
    133. SWOT Analysis
    134. Key
    135. Strategies
    136. ZTE
    137. Financial
    138. Overview
    139. Products Offered
    140. Key
    141. Developments
    142. SWOT Analysis
    143. Key
    144. Strategies
    145. Nokia
    146. Financial
    147. Overview
    148. Products Offered
    149. Key
    150. Developments
    151. SWOT Analysis
    152. Key
    153. Strategies
    154. Mavenir
    155. Financial
    156. Overview
    157. Products Offered
    158. Key
    159. Developments
    160. SWOT Analysis
    161. Key
    162. Strategies
    163. Netcracker Technology
    164. Financial
    165. Overview
    166. Products Offered
    167. Key
    168. Developments
    169. SWOT Analysis
    170. Key
    171. Strategies
    172. Cisco Systems
    173. Financial
    174. Overview
    175. Products Offered
    176. Key
    177. Developments
    178. SWOT Analysis
    179. Key
    180. Strategies
    181. Amdocs
    182. Financial
    183. Overview
    184. Products Offered
    185. Key
    186. Developments
    187. SWOT Analysis
    188. Key
    189. Strategies
    190. Ericsson
    191. Financial
    192. Overview
    193. Products Offered
    194. Key
    195. Developments
    196. SWOT Analysis
    197. Key
    198. Strategies
    199. Oracle
    200. Financial
    201. Overview
    202. Products Offered
    203. Key
    204. Developments
    205. SWOT Analysis
    206. Key
    207. Strategies
    208. IBM
    209. Financial
    210. Overview
    211. Products Offered
    212. Key
    213. Developments
    214. SWOT Analysis
    215. Key
    216. Strategies
    217. Ciena
    218. Financial
    219. Overview
    220. Products Offered
    221. Key
    222. Developments
    223. SWOT Analysis
    224. Key
    225. Strategies
    226. Huawei Technologies
    227. Financial
    228. Overview
    229. Products Offered
    230. Key
    231. Developments
    232. SWOT Analysis
    233. Key
    234. Strategies
    235. VMware
    236. Financial
    237. Overview
    238. Products Offered
    239. Key
    240. Developments
    241. SWOT Analysis
    242. Key
    243. Strategies
    244. References
    245. Related
    246. Reports
    247. LIST
    248. OF ASSUMPTIONS
    249. Canada Virtual Network Functions Market
    250. SIZE ESTIMATES & FORECAST, BY COMPONENT, 2019-2035 (USD Billions)
    251. Canada
    252. Virtual Network Functions Market SIZE ESTIMATES & FORECAST, BY FUNCTIONS, 2019-2035
    253. (USD Billions)
    254. Canada Virtual Network Functions Market
    255. SIZE ESTIMATES & FORECAST, BY APPLICATION, 2019-2035 (USD Billions)
    256. Canada
    257. Virtual Network Functions Market SIZE ESTIMATES & FORECAST, BY ORGANIZATION
    258. SIZE, 2019-2035 (USD Billions)
    259. Canada Virtual Network
    260. Functions Market SIZE ESTIMATES & FORECAST, BY END-USER, 2019-2035 (USD Billions)
    261. PRODUCT
    262. LAUNCH/PRODUCT DEVELOPMENT/APPROVAL
    263. ACQUISITION/PARTNERSHIP
    264. LIST
    265. Of figures
    266. MARKET SYNOPSIS
    267. CANADA
    268. VIRTUAL NETWORK FUNCTIONS MARKET ANALYSIS BY COMPONENT
    269. CANADA
    270. VIRTUAL NETWORK FUNCTIONS MARKET ANALYSIS BY FUNCTIONS
    271. CANADA
    272. VIRTUAL NETWORK FUNCTIONS MARKET ANALYSIS BY APPLICATION
    273. CANADA
    274. VIRTUAL NETWORK FUNCTIONS MARKET ANALYSIS BY ORGANIZATION SIZE
    275. CANADA
    276. VIRTUAL NETWORK FUNCTIONS MARKET ANALYSIS BY END-USER
    277. KEY
    278. BUYING CRITERIA OF VIRTUAL NETWORK FUNCTIONS MARKET
    279. RESEARCH
    280. PROCESS OF MRFR
    281. DRO ANALYSIS OF VIRTUAL NETWORK FUNCTIONS
    282. MARKET
    283. DRIVERS IMPACT ANALYSIS: VIRTUAL NETWORK FUNCTIONS
    284. MARKET
    285. RESTRAINTS IMPACT ANALYSIS: VIRTUAL NETWORK FUNCTIONS
    286. MARKET
    287. SUPPLY / VALUE CHAIN: VIRTUAL NETWORK FUNCTIONS
    288. MARKET
    289. VIRTUAL NETWORK FUNCTIONS MARKET, BY COMPONENT,
    290. (% SHARE)
    291. VIRTUAL NETWORK FUNCTIONS MARKET, BY COMPONENT,
    292. TO 2035 (USD Billions)
    293. VIRTUAL NETWORK FUNCTIONS
    294. MARKET, BY FUNCTIONS, 2025 (% SHARE)
    295. VIRTUAL NETWORK
    296. FUNCTIONS MARKET, BY FUNCTIONS, 2019 TO 2035 (USD Billions)
    297. VIRTUAL
    298. NETWORK FUNCTIONS MARKET, BY APPLICATION, 2025 (% SHARE)
    299. VIRTUAL
    300. NETWORK FUNCTIONS MARKET, BY APPLICATION, 2019 TO 2035 (USD Billions)
    301. VIRTUAL
    302. NETWORK FUNCTIONS MARKET, BY ORGANIZATION SIZE, 2025 (% SHARE)
    303. VIRTUAL
    304. NETWORK FUNCTIONS MARKET, BY ORGANIZATION SIZE, 2019 TO 2035 (USD Billions)
    305. VIRTUAL
    306. NETWORK FUNCTIONS MARKET, BY END-USER, 2025 (% SHARE)
    307. VIRTUAL
    308. NETWORK FUNCTIONS MARKET, BY END-USER, 2019 TO 2035 (USD Billions)
    309. BENCHMARKING
    310. OF MAJOR COMPETITORS

    Canada Virtual Network Functions Market Segmentation

    • Virtual Network Functions Market By Component (USD Billion, 2019-2035)

      • Solutions
      • Orchestration and Automation
      • Services


    • Virtual Network Functions Market By Functions (USD Billion, 2019-2035)

      • Compute
      • Storage
      • Network


    • Virtual Network Functions Market By Application (USD Billion, 2019-2035)

      • Virtual Appliance
      • Core Network


    • Virtual Network Functions Market By Organization Size (USD Billion, 2019-2035)

      • SMEs
      • Large Enterprises


    • Virtual Network Functions Market By End-User (USD Billion, 2019-2035)

      • Service Provider
      • Data Centers
      • Enterprises


    Report Infographic
    Free Sample Request

    Kindly complete the form below to receive a free sample of this Report

    Customer Strories

    “I am very pleased with how market segments have been defined in a relevant way for my purposes (such as "Portable Freezers & refrigerators" and "last-mile"). In general the report is well structured. Thanks very much for your efforts.”

    Victoria Milne Founder
    Case Study

    Chemicals and Materials