• Cat-intel
  • MedIntelliX
  • Resources
  • About Us
  • Request Free Sample ×

    Kindly complete the form below to receive a free sample of this Report

    Leading companies partner with us for data-driven Insights

    clients tt-cursor

    Automotive Data Logger Market

    ID: MRFR/AM/5213-CR
    154 Pages
    Swapnil Palwe
    May 2022

    Automotive Data Logger Market Research Report Information Based on Channel (CAN & CAN FD, LIN, FlexRay, Ethernet), By Connection Type (USB, SD Card, Bluetooth/Wi-Fi, Cellular Modem), By Application (On-Board Diagnostics, ADAS & Safety, Fleet Management, Automotive Insurance), By End-Market (OEMs, Service Stations, Regulatory Bodies) And By Region (North America, Europe, Asia-Pacific, And Rest Of The World) –Market Forecast Till 2032

    Share:
    Download PDF ×

    We do not share your information with anyone. However, we may send you emails based on your report interest from time to time. You may contact us at any time to opt-out.

    Automotive Data Logger Market Research Report—Global Forecast till 2032 Infographic
    Purchase Options
    $ 4,950.0
    $ 5,950.0
    $ 7,250.0

    Automotive Data Logger Market Summary

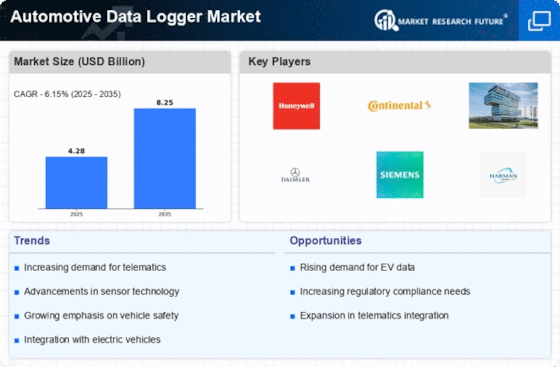
    As per Market Research Future Analysis, the Global Automotive Data Logger Market was valued at USD 4 Billion in 2023 and is projected to reach USD 6.9 Billion by 2032, growing at a CAGR of 6.15% from 2024 to 2032. The market is driven by increased consumer demand for high-performance vehicles and the rising complexity of electronic architectures in modern automobiles. Key applications include fleet management, on-board diagnostics, and ADAS & safety, with the CAN & CAN FD channel segment leading the market. North America holds the largest market share, followed by Europe and Asia-Pacific, which is expected to grow at the fastest rate.

    Key Market Trends & Highlights

    The Automotive Data Logger Market is witnessing significant growth due to technological advancements and regulatory demands.

    • Market Size in 2023: USD 4 Billion.
    • Projected Market Size by 2032: USD 6.9 Billion.
    • CAGR from 2024 to 2032: 6.15%.
    • Fleet management segment dominated the application market.

    Market Size & Forecast

    2023 Market Size USD 4 Billion
    2024 Market Size USD 4.28 Billion
    2032 Market Size USD 6.9 Billion

    Major Players

    Key companies include National Instruments, TI Tech Computertechnik AGr, Xilinx, Intrepid Control Systems, Dewesoft d.o.o., Robert Bosch GmbH, Delphi Technologies, Vector Informatik GmbH, Continental Automotive GmbH, and Harman International.

    Automotive Data Logger Market Trends

      • The increasing complexity of electronic architecture in modern vehicles drives market growth

    The increasingly complex electronic architecture in modern vehicles is driving the market CAGR for Automotive Data Logger. Modern automobiles are now outfitted with a plethora of sensors that improve the driving experience, aid in efficient fuel consumption, reduce accidents/mishaps that result in severe injuries/deaths, and provide a variety of other benefits that are embedded with advanced software solutions enabling predictive maintenance, automated driving assistance systems, vehicle monitoring, in-vehicle connectivity (via CAN), navigation system, parking assistance. These trends are changing away from the traditional mechanical and electrical design approach and towards the future-proof connected automotive experience.

    Furthermore, the growing demand for integrated systems to connect and control vehicles via smartphones, advanced infotainment systems, stringent government telematics policies, and increased adoption from original equipment manufacturers (OEMs) are some of the other factors driving demand for automotive data logger solutions. Thus, during the study period, the more complicated electrical architecture in current automobiles is likely to boost the growth of the automotive data logger market.

    In addition, Klas' TRX D8 in-car storage and computation system is a ruggedized device intended specifically for logging the large amounts of data produced during autonomous vehicle drive testing. Furthermore, with the rise of self-driving cars, the UK government and technology businesses have spent $520 million in R&D and testing of connected and self-driving vehicles in 2020. Similarly, the United States government is developing a national policy for self-driving cars and has pledged to investing $4 billion over the next ten years to speed the development and deployment of safe vehicle automation through real-world pilot projects.

    The increasing complexity of automotive systems and the growing emphasis on vehicle safety and performance monitoring are driving the demand for advanced data logging solutions in the automotive sector.

    U.S. Department of Transportation

    Automotive Data Logger Market Drivers

    Market Growth Projections

    The Global Automotive Data Logger Market Industry is poised for substantial growth, with projections indicating a market value of 4.28 USD Billion in 2024 and an anticipated increase to 8.25 USD Billion by 2035. This growth trajectory reflects a compound annual growth rate of 6.15% from 2025 to 2035, driven by various factors such as technological advancements, regulatory compliance, and the rising demand for vehicle safety. The market's expansion is indicative of the automotive industry's ongoing transformation, as manufacturers increasingly rely on data-driven insights to enhance vehicle performance and safety.

    Growing Electric Vehicle Adoption

    The rise in electric vehicle (EV) adoption significantly influences the Global Automotive Data Logger Market Industry. As governments promote sustainable transportation, the demand for EVs is expected to escalate, necessitating advanced data logging solutions to monitor battery performance, energy consumption, and overall vehicle efficiency. Data loggers play a crucial role in optimizing EV performance and ensuring compliance with environmental regulations. The increasing focus on reducing carbon emissions is likely to drive the market, as manufacturers seek to enhance the efficiency of their electric models. This shift towards electrification is anticipated to contribute to the market's growth trajectory in the coming years.

    Increasing Demand for Vehicle Safety

    The Global Automotive Data Logger Market Industry experiences a surge in demand driven by heightened safety regulations and consumer awareness regarding vehicle safety. Governments worldwide are implementing stringent safety standards, necessitating the use of data loggers to monitor vehicle performance and ensure compliance. For instance, the National Highway Traffic Safety Administration in the United States mandates the use of data recording devices in new vehicles. This trend is expected to contribute significantly to the market's growth, as the industry anticipates a market value of 4.28 USD Billion in 2024, with projections indicating a rise to 8.25 USD Billion by 2035.

    Advancements in Automotive Technology

    Technological advancements in the automotive sector are propelling the Global Automotive Data Logger Market Industry forward. Innovations such as advanced driver-assistance systems (ADAS) and autonomous vehicles require sophisticated data logging solutions to capture and analyze vast amounts of data. These technologies enhance vehicle performance and safety, thereby increasing the demand for data loggers. As manufacturers integrate more complex systems into vehicles, the need for reliable data collection becomes paramount. This trend is likely to sustain a compound annual growth rate of 6.15% from 2025 to 2035, reflecting the industry's commitment to leveraging data for improved vehicle functionality.

    Integration of IoT in Automotive Systems

    The integration of Internet of Things (IoT) technology within automotive systems is transforming the Global Automotive Data Logger Market Industry. IoT-enabled data loggers facilitate real-time data collection and analysis, allowing manufacturers and consumers to monitor vehicle performance remotely. This connectivity enhances predictive maintenance, reduces downtime, and improves overall vehicle reliability. As the automotive industry increasingly embraces IoT solutions, the demand for sophisticated data logging devices is expected to rise. This trend aligns with the broader digital transformation within the sector, indicating a potential for sustained growth as manufacturers adapt to new technological paradigms.

    Regulatory Compliance and Data Management

    Regulatory compliance is a critical driver for the Global Automotive Data Logger Market Industry. Governments are enforcing regulations that require manufacturers to maintain accurate records of vehicle performance and safety data. Data loggers serve as essential tools for compliance, enabling manufacturers to collect and manage data effectively. This necessity for adherence to regulations is likely to bolster the market, as companies invest in data logging solutions to avoid penalties and ensure product safety. As the regulatory landscape evolves, the demand for reliable data management systems will likely increase, further propelling the growth of the automotive data logger market.

    Market Segment Insights

    Automotive Data Logger Based on channel Insights

    The Automotive Data Logger Market segmentation, based on based on channel includes CAN & CAN FD, LIN, FlexRay, Ethernet. In 2022, the CAN & CAN FD segment dominated the market. CAN is a serial networking technology designed for embedded systems such as automotive vehicles. With a data transfer speed of up to 1 megabit per second, it provides quick connectivity between microcontrollers to satisfy real-time requirements. CAN and CAN FD allow automobile OEMs and consumers to gather and retrieve data logs from their vehicles for subsequent use.

    Automotive Data Logger Channel Type Insights

    The Automotive Data Logger Market is divided into channel types such as USB, SD card, Bluetooth/Wi-Fi, and cellular modem. Cellular modems had a significant market share. Cellular modems can be set in a variety of ways once connected to a device, such as a laptop. To visit the home page, one frequent option is to use the dedicated IP address. This page is password protected for your security. Several parameters can be altered at this point. These settings control how the modem works, network security, power options, the number of devices that can connect, which band to utilise, and personalisation.

    Figure 1:Automotive Data Logger Market, by Channel Type, 2022 & 2032 (USD Billion)

    Automotive Data Logger Market, by Channel Type, 2022 & 2032

    Source: Secondary Research, Primary Research, Market Research Future Database and Analyst Review

    Automotive Data Logger Application Insights

    The Automotive Data Logger Market segmentation, based on application, includes on-board diagnostics, ADAS & safety, fleet management, automotive insurance. Fleet management dominated the market. Fleet management is an administrative technique that allows businesses to organise and coordinate work vehicles with the goal of increasing efficiency, lowering expenses, and complying with government laws. While vehicle tracking is the most typical application, fleet management also includes monitoring and documenting mechanical diagnostics and driver behaviour.

    Automotive Data Logger End-Market Insights

    The Automotive Data Logger Market segmentation, based on end-market, includes OEMs, service stations, regulatory bodies. The category of regulatory bodies will grow tremendously because of the industry’s priority to manufacture self-driving cars and environment-friendly vehicles. Therefore, the older regulation needs to be updated and many new laws should be created. So, for this, the governing bodies need to understand the working of the latest vehicles properly, and for that data, loggers are broadly utilized at the test centers of regulatory bodies.

    Regional Insights

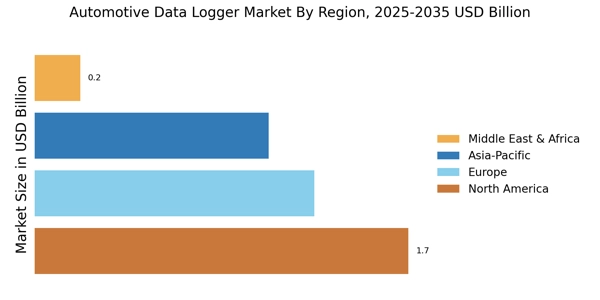
    By region, the study provides the market insights into North America, Europe, Asia-Pacific and Rest of the World. Over the projection period, the North American data logger market accounted for the highest revenue share compared to other regional markets. The growing popularity of the logistics industry in the United States is encouraging service providers to increase the quality of their offerings in order to get a competitive advantage over other market participants. The increased rate of automation adoption in sectors in the United States is predicted to drive demand for data logger services.

    Further, the major countries studied in the market report are The US, Canada, German, France, the UK, Italy, Spain, China, Japan, India, Australia, South Korea, and Brazil.

    Figure 2: AUTOMOTIVE DATA LOGGER MARKET SHARE BY REGION 2022 (USD Billion)

    AUTOMOTIVE DATA LOGGER MARKET SHARE BY REGION 2022

    Source: Secondary Research, Primary Research, Market Research Future Database and Analyst Review

    Europe’s Automotive Data Logger Market accounts for the second-largest market share because of the extraordinarily high resumption of investments and manufacturing processes in the automotive sector. Further, the German Automotive Data Logger Market held the largest market share, and the UK Automotive Data Logger Market was the fastest-growing market in the European region

    The Asia-Pacific Automotive Data Logger Market is expected to grow at the fastest CAGR from 2023 to 2032. This is due to the rise in the awareness regarding the advantages of data generated by the machines in the region. Moreover, China’s Automotive Data Logger Market held the largest market share, and the Indian Automotive Data Logger Market was the fastest-growing market in the Asia-Pacific region.

    Key Players and Competitive Insights

    Leading market players are investing heavily in R&D to expand their product lines, which will help the Automotive Data Logger Market, grow even more. Market participants are also undertaking a variety of strategic activities to expand their global footprint, with important market developments including new product launches, contractual agreements, mergers and acquisitions, higher investments, and collaboration with other organizations. To expand and survive in a more competitive and rising market climate, Automotive Data logger industry must offer cost-effective items.

    Manufacturing locally to minimize operational costs is one of the key business tactics used by manufacturers in the global Automotive Data Logger industry to benefit clients and increase the market sector. In recent years, the Automotive Data Logger industry has offered some of the most significant advantages to medicine. Major players in the Automotive Data Logger Market, including National Instruments (the U.S.), TI Tech Computertechnik AGr (Austria), Xilinx (the U.S.), Intrepid Control Systems, Inc. (the U.S.), Dewesoft d.o.o. (Slovenia) and others, are attempting to increase market demand by investing in R&D operations.

    Vector Informatik creates software tools and components for electronic system networking based on serial bus systems such as CAN, LIN, FlexRay, MOST, Ethernet, AFDX, ARINC 429,[5] and SAE J1708, as well as CAN-based protocols such as SAE J1939, SAE J1587, ISO 11783, NMEA 2000, ARINC 825,[5] CANaerospace,[5] CANopen and others. Vector Informatik GmbH has its headquarters in Stuttgart, Germany. Braunschweig, Munich, Hamburg, and Regensburg are among the subsidiaries, as are foreign subsidiaries in Brazil, China, France, Italy, England, India, Japan, South Korea, Austria, Sweden, and the United States. 

    Vector Informatik also includes Vector Consulting Services GmbH, a consulting firm specialising in technical product development optimisation. These companies are together known as the Vector Group. In March 2022, Vector Informatik bought 100% of the assets of Gimpel Software LLC, a manufacturer of static analysis software based in the United States.

    Harman International Industries, also known as Harman (stylised in all-uppercase as HARMAN), is an American audio electronics manufacturer. The company has been an autonomous subsidiary of Samsung Electronics since 2017. Harman is headquartered in Stamford, Connecticut, and has significant operations in the Americas, Europe, and Asia. AKG, AMX, Arcam, Bang & Olufsen Automotive, Becker, BSS Audio, Crown, dbx, Harman Kardon, Infinity, JBL, Lexicon, Mark Levinson, Martin, Revel, Soundcraft, and Studer are among the brands that Harman sells. In March 2021, TowerSec, an automotive cyber-security firm, was acquired by Harman.

    This acquisition expanded Harman's capabilities in the emerging subject of vehicle cyber-security. This was demonstrated by the later unveiling of the company's '5+1 security architecture', which included TowerSec's 'ECU shield' technology.

    Key Companies in the Automotive Data Logger Market market include

    Industry Developments

    • Q2 2024: Bosch Launches Next-Generation Automotive Data Logger for Electric and Autonomous Vehicles Bosch announced the release of its new high-speed automotive data logger designed specifically for electric and autonomous vehicle testing, featuring real-time analytics and cloud integration.
    • Q1 2024: Vector Informatik Unveils AI-Enabled Automotive Ethernet Data Logger Vector Informatik introduced a next-generation automotive Ethernet data logger with integrated AI capabilities, enabling high-speed data capture and real-time analytics for autonomous vehicle development.
    • Q3 2024: Continental and NVIDIA Announce Partnership to Develop Advanced Data Logging Solutions for Connected Cars Continental and NVIDIA entered a strategic partnership to co-develop advanced automotive data logging systems leveraging NVIDIA’s AI platform for enhanced vehicle diagnostics and safety compliance.
    • Q2 2024: National Instruments Expands Automotive Data Logger Portfolio with New Modular Platform National Instruments launched a new modular automotive data logger platform aimed at supporting the growing needs of electric vehicle manufacturers for scalable and flexible data acquisition.
    • Q1 2025: Racelogic Opens New Manufacturing Facility for Automotive Data Loggers in the UK Racelogic inaugurated a new state-of-the-art manufacturing facility in Buckingham, UK, to increase production capacity for its automotive data logging products amid rising global demand.
    • Q2 2025: Xylon Launches Data Logger for In-Vehicle AI Training and Validation Xylon introduced a new automotive data logger designed for in-vehicle AI training and validation, supporting high-bandwidth sensor data capture for autonomous driving applications.
    • Q1 2024: Intrepid Control Systems Announces Launch of Wireless Automotive Data Logger Intrepid Control Systems released a wireless automotive data logger supporting multi-channel high-speed interfaces, targeting OEMs and Tier 1 suppliers developing next-generation vehicles.
    • Q3 2024: Valeo Acquires Minority Stake in Automotive Data Logger Startup RoadSense Valeo acquired a minority stake in RoadSense, a startup specializing in cloud-synchronized automotive data logging systems, to accelerate its digital transformation and connected vehicle strategy.
    • Q2 2025: Dewesoft Launches Cloud-Connected Data Logger for Electric Vehicle Testing Dewesoft announced the launch of a new cloud-connected automotive data logger tailored for electric vehicle testing, enabling remote diagnostics and over-the-air updates.
    • Q1 2025: Renesas Electronics Appoints New Head of Automotive Data Logger Division Renesas Electronics named Dr. Yuki Tanaka as the new head of its automotive data logger division, signaling a renewed focus on advanced data acquisition solutions for next-generation vehicles.
    • Q4 2024: Aptiv Secures Major Contract to Supply Data Loggers for European EV Manufacturer Aptiv won a multi-year contract to supply advanced automotive data loggers to a leading European electric vehicle manufacturer, supporting fleet-wide diagnostics and compliance.
    • Q2 2024: Kvaser Introduces CAN FD Data Logger for Automotive OEMs Kvaser launched a new CAN FD automotive data logger designed for OEMs, offering high-speed data acquisition and robust storage for vehicle development and validation.

    Future Outlook

    Automotive Data Logger Market Future Outlook

    The Automotive Data Logger Market is projected to grow at a 6.15% CAGR from 2024 to 2035, driven by advancements in vehicle technology, regulatory requirements, and increased demand for data analytics.

    New opportunities lie in:

    • Develop integrated data logging solutions for electric vehicles to enhance performance monitoring.
    • Leverage AI-driven analytics to provide predictive maintenance insights for fleet operators.
    • Expand into emerging markets by offering cost-effective data logging solutions tailored to local regulations.

    By 2035, the market is expected to achieve substantial growth, reflecting evolving automotive technologies and data utilization.

    Market Segmentation

    Report Scope

    Report Attribute/Metric Details
    Market Size 2023 USD 4 Billion
    Market Size 2024 USD 4.28 Billion
    Market Size 2032 USD 6.9 Billion
    Compound Annual Growth Rate (CAGR) 6.15% (2024-2032)
    Base Year 2023
    Market Forecast Period 2023-2032
    Historical Data 2018- 2022
    Market Forecast Units Value (USD Billion)
    Report Coverage Revenue Forecast, Market Competitive Landscape, Growth Factors, and Trends
    Segments Covered Based on Channel, Connection Type, Application, End-Market, and Region
    Geographies Covered North America, Europe, Asia Pacific, and the Rest of the World
    Countries Covered The US, Canada, German, France, the UK, Italy, Spain, China, Japan, India, Australia, South Korea, and Brazil
    Key Companies Profiled Robert Bosch GmbH (Germany), Delphi Technologies (the U.K.), Vector Informatik GmbH (Germany), Continental Automotive GmbH (Germany), Harman International (the U.S.), Racelogic (the U.K). National Instruments (the U.S.), TI Tech Computertechnik AGr (Austria), Xilinx (the U.S.), Intrepid Control Systems, Inc. (the U.S.), Dewesoft d.o.o. (Slovenia), HEM Data Corporation (the U.S.), Danlaw Technologies India Limited (India), MEN Micro Inc. (the U.S.).
    Key Market Opportunities Increased use of technologically innovative solutions in the automobile industry.
    Key Market Dynamics In current vehicles, complex electronic architecture is used.

    Market Highlights

    Author
    Swapnil Palwe
    Team Lead - Research

    With a technical background as Bachelor's in Mechanical Engineering, with MBA in Operations Management , Swapnil has 6+ years of experience in market research, consulting and analytics with the tasks of data mining, analysis, and project execution. He is the POC for our clients, for their consulting projects running under the Automotive/A&D domain. Swapnil has worked on major projects in verticals such as Aerospace & Defense, Automotive and many other domain projects. He has worked on projects for fortune 500 companies' syndicate and consulting projects along with several government projects.

    Leave a Comment

    FAQs

    How much is the Automotive Data Logger Market?

    The Automotive Data Logger Market size was valued at USD 3.8 Billion in 2022.

    What is the growth rate of the Automotive Data Logger Market?

    The global market is projected to grow at a CAGR of 6.15% during the forecast period, 2023-2032.

    Which region held the largest market share in the Automotive Data Logger Market?

    North America had the largest share of the global market

    Who are the key players in the Automotive Data Logger Market?

    The key players in the market are National Instruments (the U.S.), TI Tech Computertechnik AGr (Austria), Xilinx (the U.S.), Intrepid Control Systems, Inc. (the U.S.), Dewesoft d.o.o. (Slovenia).

    Which application led the Automotive Data Logger Market?

    The Fleet management category dominated the market in 2022.

    Which End-Market had the largest market share in the Automotive Data Logger Market?

    The regulatory bodies had the largest share of the global market.

    1. EXECUTIVE SUMMARY 18
    2. MARKET INTRODUCTION 21
      1. DEFINITION 21
      2. SCOPE OF THE STUDY 21
      3. LIST OF ASSUMPTIONS
      4. MARKET STRUCTURE 22
      5. MARKET ATTRACTIVENESS ANALYSIS 23
    3. GLOBAL AUTOMOTIVE DATA LOGGER MARKET, BY CHANNEL 24
      1. GLOBAL AUTOMOTIVE DATA
    4. LOGGER MARKET, BY CONNECTION TYPE 25
      1. GLOBAL AUTOMOTIVE DATA LOGGER MARKET,
    5. BY APPLICATION 26
      1. GLOBAL AUTOMOTIVE DATA LOGGER MARKET, BY END MARKET 27
      2. KEY BUYING CRITERIA 27
    6. MARKET INSIGHTS 28
    7. RESEARCH METHODOLOGY
    8. MARKET DYNAMICS 37
      1. DRIVERS 37
        1. INCREASINGLY COMPLEX
    9. ELECTRONIC ARCHITECTURE IN MODERN VEHICLES 37
      1. ADOPTION OF DATA LOGGING
    10. SOLUTION APPLICATIONS IN THE AUTOMOTIVE INDUSTRY 37
      1. RESTRAINT 37
    11. LACK OF TRAINED WORKFORCE 37
      1. OPPORTUNITY 38
        1. INCREASING ELECTRIC
    12. VEHICLE PRODUCTION AND AUTONOMOUS VEHICLE TESTING 38
      1. IMPACT OF COVID-19
        1. IMPACT ON THE OVERALL AUTOMOTIVE DATA LOGGER INDUSTRY 38
    13. ECONOMIC IMPACT 38
      1. IMPACT ON THE SUPPLY CHAIN OF AUTOMOTIVE DATA LOGGERS
        1. PRICE VARIATION OF KEY RAW MATERIALS 38
    14. SHUTDOWN 38
      1. CASH FLOW CONSTRAINTS 38
        1. IMPACT ON IMPORT/EXPORT
        2. IMPACT ON MARKET DEMAND FOR AUTOMOTIVE DATA LOGGERS 39
    15. IMPACT DUE TO RESTRICTIONS/LOCKDOWNS 39
      1. CONSUMER SENTIMENTS 39
    16. IMPACT ON PRICING OF AUTOMOTIVE DATA LOGGERS 39
    17. MARKET FACTOR ANALYSIS 40
      1. VALUE CHAIN ANALYSIS 40
        1. HARDWARE PROVIDER 40
        2. SOFTWARE
    18. PROVIDER 40
      1. SYSTEM INTEGRATORS/RESELLER 41
        1. END USERS 41
      2. PORTER’S FIVE FORCES MODEL 41
        1. THREAT OF NEW ENTRANTS 42
        2. BARGAINING POWER OF SUPPLIERS 42
        3. THREAT OF SUBSTITUTES 42
        4. BARGAINING POWER OF BUYERS 42
        5. INTENSITY OF RIVALRY 43
    19. STORAGE VOLUME ANALYSIS 43
    20. GLOBAL AUTOMOTIVE DATA LOGGER MARKET, BY CHANNEL
      1. OVERVIEW 44
        1. GLOBAL AUTOMOTIVE DATA LOGGER MARKET, BY CHANNEL,
    21. –2030 (USD MILLION) 45
      1. CAN & CAN FD 45
        1. LIN
    22. GLOBAL AUTOMOTIVE DATA
    23. LOGGER MARKET, BY CONNECTION TYPE 47
      1. OVERVIEW 47
        1. GLOBAL AUTOMOTIVE
    24. DATA LOGGER MARKET, BY CONNECTION TYPE, 2022–2030 (USD MILLION) 48
    25. USB 48
      1. SD CARD 48
        1. BLUETOOTH/WI-FI 48
        2. CELLULAR MODEM
    26. GLOBAL AUTOMOTIVE DATA LOGGER MARKET, BY APPLICATION 49
      1. OVERVIEW
        1. GLOBAL AUTOMOTIVE DATA LOGGER MARKET, BY APPLICATION, 2022–2030
    27. (USD MILLION) 50
      1. ON-BOARD DIAGNOSTICS 50
        1. ADAS & SAFETY
        2. FLEET MANAGEMENT 50
        3. AUTOMOTIVE INSURANCE 50
    28. GLOBAL
    29. AUTOMOTIVE DATA LOGGER MARKET, BY END MARKET 51
      1. OVERVIEW 51
    30. GLOBAL AUTOMOTIVE DATA LOGGER MARKET, BY END MARKET, 2022–2030 (USD MILLION)
      1. OEMS 52
        1. SERVICE STATIONS 52
        2. REGULATORY MANAGEMENT
    31. GLOBAL AUTOMOTIVE DATA LOGGER MARKET, BY REGION 53
      1. OVERVIEW
        1. GLOBAL AUTOMOTIVE DATA LOGGER MARKET, BY REGION, 2022–2030
    32. (USD MILLION) 53
      1. GLOBAL AUTOMOTIVE DATA LOGGER MARKET, BY REGION, 2022–2030
    33. (USD MILLION) 54
      1. NORTH AMERICA 55
        1. NORTH AMERICA MARKET, BY
    34. COUNTRY, 2022–2030 (USD MILLION) 56
      1. NORTH AMERICA MARKET, BY CHANNEL,
    35. –2030 (USD MILLION) 56
      1. NORTH AMERICA MARKET, BY CONNECTION
    36. TYPE, 2022–2030 (USD MILLION) 57
      1. NORTH AMERICA MARKET, BY APPLICATION,
    37. –2030 (USD MILLION) 58
      1. NORTH AMERICA MARKET, BY END MARKET,
    38. –2030 (USD MILLION) 59
      1. US 60
        1. US MARKET, BY CHANNEL,
    39. –2030 (USD MILLION) 60
      1. US MARKET, BY CONNECTION TYPE, 2022–2030
    40. (USD MILLION) 60
      1. US MARKET, BY APPLICATION, 2022–2030 (USD MILLION)
        1. US MARKET, BY END MARKET, 2022–2030 (USD MILLION) 61
    41. CANADA 62
      1. CANADA MARKET, BY CHANNEL, 2022–2030 (USD MILLION)
        1. CANADA MARKET, BY CONNECTION TYPE, 2022–2030 (USD MILLION)
    42. MEXICO 64
      1. MEXICO MARKET, BY CHANNEL, 2022–2030 (USD MILLION)
        1. MEXICO MARKET, BY CONNECTION TYPE, 2022–2030 (USD MILLION)
    43. EUROPE 66
      1. EUROPE MARKET, BY COUNTRY, 2022–2030 (USD MILLION) 67
        1. EUROPE MARKET, BY CHANNEL, 2022–2030 (USD MILLION) 67
    44. EUROPE MARKET, BY CONNECTION TYPE, 2022–2030 (USD MILLION) 68
    45. EUROPE MARKET, BY APPLICATION, 2022–2030 (USD MILLION) 69
      1. EUROPE
    46. MARKET, BY END MARKET, 2022–2030 (USD MILLION) 70
      1. GERMANY 71
        1. GERMANY MARKET, BY CHANNEL, 2022–2030 (USD MILLION) 71
    47. GERMANY MARKET, BY CONNECTION TYPE, 2022–2030 (USD MILLION) 71
    48. GERMANY MARKET, BY APPLICATION, 2022–2030 (USD MILLION) 72
      1. GERMANY
    49. MARKET, BY END MARKET, 2022–2030 (USD MILLION) 72
      1. REST OF EUROPE
        1. REST OF EUROPE MARKET, BY CHANNEL, 2022–2030 (USD MILLION)
    50. MILLION) 73
      1. REST OF EUROPE MARKET, BY APPLICATION, 2022–2030
    51. (USD MILLION) 74
      1. REST OF EUROPE MARKET, BY END MARKET, 2022–2030
    52. (USD MILLION) 74
      1. SWEDEN 75
        1. SWEDEN MARKET, BY CHANNEL,
    53. –2030 (USD MILLION) 75
      1. SWEDEN MARKET, BY CONNECTION TYPE,
    54. –2030 (USD MILLION) 75
      1. SWEDEN MARKET, BY APPLICATION, 2022–2030
    55. (USD MILLION) 76
      1. SWEDEN MARKET, BY END MARKET, 2022–2030 (USD
    56. MILLION) 76
      1. UK 77
        1. UK MARKET, BY CHANNEL, 2022–2030
    57. (USD MILLION) 77
      1. UK MARKET, BY CONNECTION TYPE, 2022–2030 (USD
    58. MILLION) 77
      1. UK MARKET, BY APPLICATION, 2022–2030 (USD MILLION)
        1. UK MARKET, BY END MARKET, 2022–2030 (USD MILLION) 78
    59. FRANCE 79
      1. FRANCE MARKET, BY CHANNEL, 2022–2030 (USD MILLION)
        1. FRANCE MARKET, BY CONNECTION TYPE, 2022–2030 (USD MILLION)
    60. ITALY 81
      1. ITALY MARKET, BY CHANNEL, 2022–2030 (USD MILLION)
        1. ITALY MARKET, BY CONNECTION TYPE, 2022–2030 (USD MILLION)
    61. ASIA-PACIFIC 83
      1. ASIA-PACIFIC MARKET, BY COUNTRY, 2022–2030 (USD
    62. MILLION) 84
      1. ASIA-PACIFIC MARKET, BY CHANNEL, 2022–2030 (USD MILLION)
        1. ASIA-PACIFIC MARKET, BY CONNECTION TYPE, 2022–2030 (USD MILLION)
        2. ASIA-PACIFIC MARKET, BY APPLICATION, 2022–2030 (USD MILLION)
        3. ASIA-PACIFIC MARKET, BY END MARKET, 2022–2030 (USD MILLION)
        4. CHINA 88
    63. (USD MILLION) 88
      1. CHINA MARKET, BY CONNECTION TYPE, 2022–2030
    64. (USD MILLION) 88
      1. CHINA MARKET, BY APPLICATION, 2022–2030 (USD
    65. MILLION) 89
      1. CHINA MARKET, BY END MARKET, 2022–2030 (USD MILLION)
        1. REST OF ASIA-PACIFIC 90
    66. BY CHANNEL, 2022–2030 (USD MILLION) 90
      1. REST OF ASIA-PACIFIC
    67. MARKET, BY CONNECTION TYPE, 2022–2030 (USD MILLION) 90
      1. REST
    68. OF ASIA-PACIFIC MARKET, BY APPLICATION, 2022–2030 (USD MILLION) 91
    69. REST OF ASIA-PACIFIC MARKET, BY END MARKET, 2022–2030 (USD MILLION) 91
      1. JAPAN 92
        1. JAPAN MARKET, BY CHANNEL, 2022–2030 (USD MILLION)
    70. INDIA 94
      1. INDIA MARKET, BY CHANNEL, 2022–2030 (USD MILLION) 94
        1. INDIA MARKET, BY CONNECTION TYPE, 2022–2030 (USD MILLION) 94
    71. INDIA MARKET, BY END MARKET, 2022–2030 (USD MILLION) 95
      1. MIDDLE EAST
    72. & AFRICA 96
      1. MIDDLE EAST & AFRICA MARKET, BY CHANNEL, 2022–2030
    73. (USD MILLION) 96
      1. MIDDLE EAST & AFRICA MARKET, BY CONNECTION TYPE,
    74. –2030 (USD MILLION) 96
      1. MIDDLE EAST & AFRICA MARKET, BY
    75. APPLICATION, 2022–2030 (USD MILLION) 97
      1. MIDDLE EAST & AFRICA
    76. MARKET, BY END MARKET, 2022–2030 (USD MILLION) 97
      1. SOUTH AMERICA
        1. SOUTH AMERICA MARKET, BY COUNTRY, 2022–2030 (USD MILLION) 99
        2. SOUTH AMERICA MARKET, BY CHANNEL, 2022–2030 (USD MILLION) 99
    77. SOUTH AMERICA MARKET, BY CONNECTION TYPE, 2022–2030 (USD MILLION) 100
    78. SOUTH AMERICA MARKET, BY APPLICATION, 2022–2030 (USD MILLION) 100
    79. SOUTH AMERICA MARKET, BY END MARKET, 2022–2030 (USD MILLION) 101
    80. REST OF SOUTH AMERICA 101
      1. REST OF SOUTH AMERICA MARKET, BY CHANNEL,
    81. –2030 (USD MILLION) 101
      1. REST OF SOUTH AMERICA MARKET, BY
    82. CONNECTION TYPE, 2022–2030 (USD MILLION) 102
      1. REST OF SOUTH AMERICA
    83. MARKET, BY APPLICATION, 2022–2030 (USD MILLION) 102
      1. REST OF
    84. SOUTH AMERICA MARKET, BY END MARKET, 2022–2030 (USD MILLION) 103
    85. ARGENTINA 103
      1. ARGENTINA MARKET, BY CHANNEL, 2022–2030 (USD MILLION)
        1. ARGENTINA MARKET, BY CONNECTION TYPE, 2022–2030 (USD MILLION)
        2. BRAZIL 105
    86. (USD MILLION) 105
      1. BRAZIL MARKET, BY CONNECTION TYPE, 2022–2030
    87. (USD MILLION) 105
      1. BRAZIL MARKET, BY APPLICATION, 2022–2030 (USD
    88. MILLION) 106
      1. BRAZIL MARKET, BY END MARKET, 2022–2030 (USD MILLION)
    89. COMPETITVE LANDSCAPE 107
      1. COMPETITIVE BENCHMARKING 108
    90. VENDOR SHARE ANALYSIS 109
      1. RECENT DEVELOPMENTS 109
        1. PARTNERSHIPS/AGREEMENTS/CONTRACTS/COLLABORATIONS
        2. ACQUISITIONS 109
        3. BUSINESS EXPANSIONS 110
    91. PRODUCT LAUNCHES/DEVELOPMENTS 110
    92. COMPANY PROFILES 111
      1. APTIV PLC
        1. COMPANY OVERVIEW 111
        2. FINANCIAL OVERVIEW 112
    93. PRODUCTS/SOLUTIONS/SERVICES OFFERED 112
      1. KEY DEVELOPMENTS 112
    94. SWOT ANALYSIS 113
      1. KEY STRATEGIES 113
      2. VECTOR INFORMATIK GMBH
        1. COMPANY OVERVIEW 114
        2. FINANCIAL OVERVIEW 114
    95. PRODUCTS/SOLUTIONS/SERVICES OFFERED 114
      1. KEY DEVELOPMENTS 114
    96. KEY STRATEGIES 114
      1. CONTINENTAL AG 115
        1. COMPANY OVERVIEW 115
        2. FINANCIAL OVERVIEW 116
        3. PRODUCTS/SOLUTIONS/SERVICES OFFERED
        4. KEY DEVELOPMENTS 117
        5. SWOT ANALYSIS 117
        6. KEY
    97. STRATEGIES 117
      1. RACELOGIC 118
        1. COMPANY OVERVIEW 118
    98. FINANCIAL OVERVIEW 118
      1. PRODUCTS/SOLUTIONS/SERVICES OFFERED 118
    99. KEY DEVELOPMENTS 118
      1. KEY STRATEGIES 118
      2. IPETRONIK GMBH &
    100. CO. KG 119
      1. COMPANY OVERVIEW 119
        1. PRODUCTS/SOLUTIONS/SERVICES
    101. OFFERED 119
      1. KEY DEVELOPMENTS 119
        1. KEY STRATEGIES 119
    102. NATIONAL INSTRUMENTS CORPORATION 120
      1. COMPANY OVERVIEW 120
    103. FINANCIAL OVERVIEW 120
      1. PRODUCTS OFFERED 121
        1. KEY DEVELOPMENTS
        2. SWOT ANALYSIS 121
        3. KEY STRATEGIES 122
      2. TTTECH
    104. GROUP 123
      1. COMPANY OVERVIEW 123
        1. FINANCIAL OVERVIEW 123
        2. PRODUCTS OFFERED 123
        3. KEY DEVELOPMENTS 123
        4. KEY STRATEGIES
      2. XILINX, INC. 124
        1. COMPANY OVERVIEW 124
        2. FINANCIAL
    105. OVERVIEW 125
      1. PRODUCTS OFFERED 125
        1. KEY DEVELOPMENTS 126
        2. SWOT ANALYSIS 126
        3. KEY STRATEGIES 126
      2. INTREPID CONTROL
    106. SYSTEMS, INC. 127
      1. COMPANY OVERVIEW 127
        1. FINANCIAL OVERVIEW
        2. PRODUCTS OFFERED 127
        3. KEY DEVELOPMENTS 127
    107. KEY STRATEGIES 127
      1. SAMSUNG ELECTRONICS. CO., LTD. (HARMAN) 128
    108. COMPANY OVERVIEW 128
      1. FINANCIAL OVERVIEW 128
        1. PRODUCTS OFFERED
        2. KEY DEVELOPMENTS 129
        3. SWOT ANALYSIS 129
    109. KEY STRATEGIES 129
      1. HORIBA, LTD 130
        1. COMPANY OVERVIEW 130
        2. FINANCIAL OVERVIEW 130
        3. PRODUCTS OFFERED 131
    110. KEY DEVELOPMENTS 131
      1. SWOT ANALYSIS 131
        1. KEY STRATEGIES
      2. INFLUX TECHNOLOGY 132
        1. COMPANY OVERVIEW 132
    111. FINANCIAL OVERVIEW 132
      1. PRODUCTS/SOLUTIONS/SERVICES OFFERED 132
    112. KEY DEVELOPMENTS 132
      1. DEWESOFT D.O.O. 133
        1. COMPANY OVERVIEW
        2. FINANCIAL OVERVIEW 133
        3. PRODUCTS/SOLUTIONS/SERVICES
    113. OFFERED 133
      1. KEY DEVELOPMENTS 133
      2. AUTEL 134
    114. COMPANY OVERVIEW 134
      1. FINANCIAL OVERVIEW 134
        1. PRODUCTS OFFERED
        2. KEY DEVELOPMENTS 134
      2. DANLAW, INC. 136
        1. COMPANY
    115. OVERVIEW 136
      1. FINANCIAL OVERVIEW 136
        1. PRODUCTS OFFERED 136
        2. KEY DEVELOPMENTS 136
      2. TRANSTRON, INC. 137
        1. COMPANY
    116. OVERVIEW 137
      1. FINANCIAL OVERVIEW 137
        1. PRODUCTS OFFERED 137
        2. KEY DEVELOPMENTS 137
    117. SYNOPSIS 20
    118. LOGGER MARKET, BY CHANNEL, 2022–2030 (USD MILLION) 45
    119. AUTOMOTIVE DATA LOGGER MARKET, BY CONNECTION TYPE, 2022–2030 (USD MILLION)
    120. (USD MILLION) 50
    121. –2030 (USD MILLION) 52
    122. BY REGION, 2022–2030 (USD MILLION) 54
    123. COUNTRY, 2022–2030 (USD MILLION) 56
    124. CHANNEL, 2022–2030 (USD MILLION) 56
    125. CONNECTION TYPE, 2022–2030 (USD MILLION) 57
    126. BY APPLICATION, 2022–2030 (USD MILLION) 58
    127. BY END MARKET, 2022–2030 (USD MILLION) 59
    128. –2030 (USD MILLION) 60
    129. (USD MILLION) 60
    130. CANADA MARKET, BY CHANNEL, 2022–2030 (USD MILLION) 62
    131. MARKET, BY CONNECTION TYPE, 2022–2030 (USD MILLION) 62
    132. MARKET, BY APPLICATION, 2022–2030 (USD MILLION) 63
    133. BY END MARKET, 2022–2030 (USD MILLION) 63
    134. CHANNEL, 2022–2030 (USD MILLION) 64
    135. TYPE, 2022–2030 (USD MILLION) 64
    136. –2030 (USD MILLION) 65
    137. (USD MILLION) 65
    138. EUROPE MARKET, BY END MARKET, 2022–2030 (USD MILLION) 70
    139. GERMANY MARKET, BY CHANNEL, 2022–2030 (USD MILLION) 71
    140. MARKET, BY CONNECTION TYPE, 2022–2030 (USD MILLION) 71
    141. MARKET, BY APPLICATION, 2022–2030 (USD MILLION) 72
    142. BY END MARKET, 2022–2030 (USD MILLION) 72
    143. BY CHANNEL, 2022–2030 (USD MILLION) 73
    144. BY CONNECTION TYPE, 2022–2030 (USD MILLION) 73
    145. MARKET, BY APPLICATION, 2022–2030 (USD MILLION) 74
    146. MARKET, BY END MARKET, 2022–2030 (USD MILLION) 74
    147. BY CHANNEL, 2022–2030 (USD MILLION) 75
    148. TYPE, 2022–2030 (USD MILLION) 75
    149. –2030 (USD MILLION) 76
    150. (USD MILLION) 76
    151. UK MARKET, BY END MARKET, 2022–2030 (USD MILLION) 78
    152. MARKET, BY CHANNEL, 2022–2030 (USD MILLION) 79
    153. BY CONNECTION TYPE, 2022–2030 (USD MILLION) 79
    154. BY APPLICATION, 2022–2030 (USD MILLION) 80
    155. END MARKET, 2022–2030 (USD MILLION) 80
    156. –2030 (USD MILLION) 81
    157. –2030 (USD MILLION) 81
    158. (USD MILLION) 82
    159. MILLION) 82
    160. MILLION) 84
    161. MILLION) 85
    162. (USD MILLION) 86
    163. (USD MILLION) 87
    164. (USD MILLION) 87
    165. REST OF ASIA-PACIFIC MARKET, BY CHANNEL, 2022–2030 (USD MILLION) 90
    166. MILLION) 90
    167. (USD MILLION) 91
    168. (USD MILLION) 91
    169. INDIA MARKET, BY CHANNEL, 2022–2030 (USD MILLION) 94
    170. MARKET, BY CONNECTION TYPE, 2022–2030 (USD MILLION) 94
    171. MARKET, BY APPLICATION, 2022–2030 (USD MILLION) 95
    172. BY END MARKET, 2022–2030 (USD MILLION) 95
    173. AFRICA MARKET, BY CHANNEL, 2022–2030 (USD MILLION) 96
    174. EAST & AFRICA MARKET, BY CONNECTION TYPE, 2022–2030 (USD MILLION) 96
    175. MILLION) 97
    176. (USD MILLION) 97
    177. (USD MILLION) 99
    178. (USD MILLION) 99
    179. (USD MILLION) 100
    180. (USD MILLION) 100
    181. (USD MILLION) 101
    182. (USD MILLION) 101
    183. –2030 (USD MILLION) 102
    184. APPLICATION, 2022–2030 (USD MILLION) 102
    185. MARKET, BY END MARKET, 2022–2030 (USD MILLION) 103
    186. MARKET, BY CHANNEL, 2022–2030 (USD MILLION) 103
    187. BY CONNECTION TYPE, 2022–2030 (USD MILLION) 104
    188. BY APPLICATION, 2022–2030 (USD MILLION) 104
    189. BY END MARKET, 2022–2030 (USD MILLION) 104
    190. CHANNEL, 2022–2030 (USD MILLION) 105
    191. TYPE, 2022–2030 (USD MILLION) 105
    192. –2030 (USD MILLION) 106
    193. (USD MILLION) 106
    194. PRODUCT LAUNCHES/DEVELOPMENTS 110
    195. OFFERED 112
    196. AG: PRODUCTS/SOLUTIONS/SERVICES OFFERED 116
    197. RACELOGIC: KEY DEVELOPMENTS 118
    198. PRODUCTS/SOLUTIONS/SERVICES OFFERED 119
    199. PRODUCTS/SOLUTIONS OFFERED 121
    200. KEY DEVELOPMENTS 121
    201. TTTECH GROUP: KEY DEVELOPMENTS 123
    202. SYSTEMS, INC.: PRODUCTS OFFERED 127
    203. PRODUCTS OFFERED 129
    204. PRODUCTS/SOLUTIONS/SERVICES OFFERED 132
    205. AUTEL: PRODUCTS OFFERED 134
    206. DANLAW, INC.: PRODUCTS OFFERED 136
    207. KEY DEVELOPMENTS 137
    208. DATA LOGGER MARKET: MARKET STRUCTURE 22
    209. GLOBAL AUTOMOTIVE DATA LOGGER MARKET 23
    210. MARKET, BY CHANNEL, 2022 VS 2030 (USD MILLION) 24
    211. DATA LOGGER MARKET, BY CONNECTION TYPE, 2022 VS 2030 (USD MILLION) 25
    212. GLOBAL AUTOMOTIVE DATA LOGGER MARKET, BY APPLICATION, 2022 VS 2030 (USD MILLION)
    213. (USD MILLION) 27
    214. CRITERIA 27
    215. (%), BY COUNTRY (2019 & 2026) 28
    216. & MARKET SHARE (%), BY COUNTRY (2019 & 2026) 28
    217. AUTOMOTIVE DATA LOGGER MARKET SIZE (USD MILLION) & MARKET SHARE (%), BY COUNTRY
    218. VALUE CHAIN ANALYSIS: GLOBAL AUTOMOTIVE DATA LOGGER MARKET 40
    219. PORTER'S FIVE FORCES ANALYSIS: AUTOMOTIVE DATA LOGGER MARKET 41
    220. AUTOMOTIVE DATA LOGGER MARKET, BY CHANNEL, 2019 (% SHARE) 44
    221. AUTOMOTIVE DATA LOGGER MARKET, BY CHANNEL, 2022 VS 2030 (USD MILLION) 44
    222. GLOBAL AUTOMOTIVE DATA LOGGER MARKET, BY CONNECTION TYPE, 2019 (% SHARE) 47
    223. (USD MILLION) 47
    224. (% SHARE) 49
    225. VS 2030 (USD MILLION) 49
    226. BY END MARKET, 2019 (% SHARE) 51
    227. BY END MARKET, 2022 VS 2030 (USD MILLION) 51
    228. LOGGER MARKET, BY REGION, 2019 (% SHARE) 53
    229. LOGGER MARKET, BY REGION, 2022–2030 (USD MILLION) 53
    230. AMERICA MARKET, BY COUNTRY, 2019 (% SHARE) 55
    231. BY COUNTRY, 2022–2030 (USD MILLION) 55
    232. BY CHANNEL, 2022–2030 (USD MILLION) 56
    233. BY CONNECTION TYPE, 2022 VS 2030 (USD MILLION) 57
    234. BY APPLICATION, 2022 VS 2030 (USD MILLION) 58
    235. BY END MARKET, 2022 VS 2030 (USD MILLION) 59
    236. (% SHARE) 66
    237. MILLION) 66
    238. ASIA-PACIFIC MARKET, BY COUNTRY, 2019 (% SHARE) 83
    239. MARKET, BY COUNTRY, 2022–2030 (USD MILLION) 83
    240. MARKET, BY CHANNEL, 2022–2030 (USD MILLION) 84
    241. MARKET, BY CONNECTION TYPE, 2022 VS 2030 (USD MILLION) 85
    242. MARKET, BY APPLICATION, 2022 VS 2030 (USD MILLION) 86
    243. MARKET, BY END MARKET, 2022 VS 2030 (USD MILLION) 87
    244. MARKET, BY COUNTRY, 2019 (% SHARE) 98
    245. –2030 (USD MILLION) 98
    246. COMPETITIVE BENCHMARKING 108
    247. SWOT ANALYSIS 113

    Automotive Data Logger Market Segmentation

    Automotive Data Logger Market Based on Channel Outlook (USD Billion, 2018-2032)

    • CAN & CAN FD
    • LIN
    • FlexRay
    • Ethernet

    Automotive Data Logger Market by Connection Type Outlook (USD Billion, 2018-2032)

    • USB
    • SD Card
    • Bluetooth/Wi-Fi
    • Cellular Modem

    Automotive Data Logger Market by Application Outlook (USD Billion, 2018-2032)

    • On-Board Diagnostics
    • ADAS & Safety
    • Fleet Management
    • Automotive Insurance

    Automotive Data Logger Market by End-Market Outlook (USD Billion, 2018-2032)

    • OEMs
    • Service Stations
    • Regulatory Bodies

    Automotive Data Logger Market Based on Channel (USD Billion, 2018-2032)

    • North America Automotive Data Logger Market Outlook (USD Billion, 2018-2032)

      • North America By Based on Channel

        • CAN & CAN FD,
        • LIN
        • FlexRay
        • Ethernet
      • North America By Connection Type

        • USB
        • SD Card
        • Bluetooth/Wi-Fi
        • Cellular Modem
      • North America By Application

        • On-Board Diagnostics
        • ADAS & Safety
        • Fleet Management
        • Automotive Insurance
      • North America By End-Market

        • OEMs
        • Service Stations
        • Regulatory Bodies
      • US Outlook (USD Billion, 2018-2032)

      • US By Based on Channel

        • CAN & CAN FD,
        • LIN
        • FlexRay
        • Ethernet
      • US By Connection Type

        • USB
        • SD Card
        • Bluetooth/Wi-Fi
        • Cellular Modem
      • US By Application

        • On-Board Diagnostics
        • ADAS & Safety
        • Fleet Management
        • Automotive Insurance
      • US By End-Market

        • OEMs
        • Service Stations
        • Regulatory Bodies
      • CANADA Outlook (USD Billion, 2018-2032)

      • CANADA By Based on Channel

        • CAN & CAN FD,
        • LIN
        • FlexRay
        • Ethernet
      • CANADA By Connection Type

        • USB
        • SD Card
        • Bluetooth/Wi-Fi
        • Cellular Modem
      • CANADA By Application

        • On-Board Diagnostics
        • ADAS & Safety
        • Fleet Management
        • Automotive Insurance
      • CANADA By End-Market

        • OEMs
        • Service Stations
        • Regulatory Bodies
    • Europe Automotive Data Logger Market Outlook (USD Billion, 2018-2032)

      • Europe By Based on Channel

        • CAN & CAN FD,
        • LIN
        • FlexRay
        • Ethernet
      • Europe By Connection Type

        • USB
        • SD Card
        • Bluetooth/Wi-Fi
        • Cellular Modem
      • Europe By Application

        • On-Board Diagnostics
        • ADAS & Safety
        • Fleet Management
        • Automotive Insurance
      • Europe By End-Market

        • OEMs
        • Service Stations
        • Regulatory Bodies
      • Germany Outlook (USD Billion, 2018-2032)

      • Germany By Based on Channel

        • CAN & CAN FD,
        • LIN
        • FlexRay
        • Ethernet
      • Germany By Connection Type

        • USB
        • SD Card
        • Bluetooth/Wi-Fi
        • Cellular Modem
      • Germany By Application

        • On-Board Diagnostics
        • ADAS & Safety
        • Fleet Management
        • Automotive Insurance
      • Germany By End-Market

        • OEMs
        • Service Stations
        • Regulatory Bodies
      • France Outlook (USD Billion, 2018-2032)

      • France By Based on Channel

        • CAN & CAN FD,
        • LIN
        • FlexRay
        • Ethernet
      • France By Connection Type

        • USB
        • SD Card
        • Bluetooth/Wi-Fi
        • Cellular Modem
      • France By Application

        • On-Board Diagnostics
        • ADAS & Safety
        • Fleet Management
        • Automotive Insurance
      • France By End-Market

        • OEMs
        • Service Stations
        • Regulatory Bodies
      • UK Outlook (USD Billion, 2018-2032)

      • UK By Based on Channel

        • CAN & CAN FD,
        • LIN
        • FlexRay
        • Ethernet
      • UK By Connection Type

        • USB
        • SD Card
        • Bluetooth/Wi-Fi
        • Cellular Modem
      • UK By Application

        • On-Board Diagnostics
        • ADAS & Safety
        • Fleet Management
        • Automotive Insurance
      • UK By End-Market

        • OEMs
        • Service Stations
        • Regulatory Bodies
      • ITALY Outlook (USD Billion, 2018-2032)

      • ITALY By Based on Channel

        • CAN & CAN FD,
        • LIN
        • FlexRay
        • Ethernet
      • ITALY By Connection Type

        • USB
        • SD Card
        • Bluetooth/Wi-Fi
        • Cellular Modem
      • ITALY By Application

        • On-Board Diagnostics
        • ADAS & Safety
        • Fleet Management
        • Automotive Insurance
      • ITALY By End-Market

        • OEMs
        • Service Stations
        • Regulatory Bodies
      • SPAIN Outlook (USD Billion, 2018-2032)

      • Spain By Based on Channel

        • CAN & CAN FD,
        • LIN
        • FlexRay
        • Ethernet
      • Spain By Connection Type

        • USB
        • SD Card
        • Bluetooth/Wi-Fi
        • Cellular Modem
      • Spain By Application

        • On-Board Diagnostics
        • ADAS & Safety
        • Fleet Management
        • Automotive Insurance
      • Spain By End-Market

        • OEMs
        • Service Stations
        • Regulatory Bodies
      • Rest Of Europe Outlook (USD Billion, 2018-2032)

      • Rest Of Europe By Based on Channel

        • CAN & CAN FD,
        • LIN
        • FlexRay
        • Ethernet
      • REST OF EUROPE By Connection Type

        • USB
        • SD Card
        • Bluetooth/Wi-Fi
        • Cellular Modem
      • REST OF EUROPE By Application

        • On-Board Diagnostics
        • ADAS & Safety
        • Fleet Management
        • Automotive Insurance
      • REST OF EUROPE By End-Market

        • OEMs
        • Service Stations
        • Regulatory Bodies
    • Asia-Pacific Automotive Data Logger Market Outlook (USD Billion, 2018-2032)

      • Asia-Pacific By Based on Channel

        • CAN & CAN FD,
        • LIN
        • FlexRay
        • Ethernet
      • Asia-Pacific By Connection Type

        • USB
        • SD Card
        • Bluetooth/Wi-Fi
        • Cellular Modem
      • Asia-Pacific By Application

        • On-Board Diagnostics
        • ADAS & Safety
        • Fleet Management
        • Automotive Insurance
      • Asia-Pacific By End-Market

        • OEMs
        • Service Stations
        • Regulatory Bodies
      • China Outlook (USD Billion, 2018-2032)

      • China By Based on Channel

        • CAN & CAN FD,
        • LIN
        • FlexRay
        • Ethernet
      • China By Connection Type

        • USB
        • SD Card
        • Bluetooth/Wi-Fi
        • Cellular Modem
      • China By Application

        • On-Board Diagnostics
        • ADAS & Safety
        • Fleet Management
        • Automotive Insurance
      • China By End-Market

        • OEMs
        • Service Stations
        • Regulatory Bodies
      • Japan Outlook (USD Billion, 2018-2032)

      • Japan By Based on Channel

        • CAN & CAN FD,
        • LIN
        • FlexRay
        • Ethernet
      • Japan By Connection Type

        • USB
        • SD Card
        • Bluetooth/Wi-Fi
        • Cellular Modem
      • Japan By Application

        • On-Board Diagnostics
        • ADAS & Safety
        • Fleet Management
        • Automotive Insurance
      • Japan By End-Market

        • OEMs
        • Service Stations
        • Regulatory Bodies
      • India Outlook (USD Billion, 2018-2032)

      • India By Based on Channel

        • CAN & CAN FD,
        • LIN
        • FlexRay
        • Ethernet
      • India By Connection Type

        • USB
        • SD Card
        • Bluetooth/Wi-Fi
        • Cellular Modem
      • India By Application

        • On-Board Diagnostics
        • ADAS & Safety
        • Fleet Management
        • Automotive Insurance
      • India By End-Market

        • OEMs
        • Service Stations
        • Regulatory Bodies
      • Australia Outlook (USD Billion, 2018-2032)

      • Australia By Based on Channel

        • CAN & CAN FD,
        • LIN
        • FlexRay
        • Ethernet
      • Australia By Connection Type

        • USB
        • SD Card
        • Bluetooth/Wi-Fi
        • Cellular Modem
      • Australia By Application

        • On-Board Diagnostics
        • ADAS & Safety
        • Fleet Management
        • Automotive Insurance
      • Australia By End-Market

        • OEMs
        • Service Stations
        • Regulatory Bodies
      • Rest of Asia-Pacific Outlook (USD Billion, 2018-2032)

      • Rest of Asia-Pacific By Based on Channel

        • CAN & CAN FD,
        • LIN
        • FlexRay
        • Ethernet
      • Rest of Asia-Pacific By Connection Type

        • USB
        • SD Card
        • Bluetooth/Wi-Fi
        • Cellular Modem
      • Rest of Asia-Pacific By Application

        • On-Board Diagnostics
        • ADAS & Safety
        • Fleet Management
        • Automotive Insurance
      • Rest of Asia-Pacific By End-Market

        • OEMs
        • Service Stations
        • Regulatory Bodies
    • Rest of the World Automotive Data Logger Market Outlook (USD Billion, 2018-2032)

      • Rest of the World By Based on Channel

        • CAN & CAN FD,
        • LIN
        • FlexRay
        • Ethernet
      • Rest of the World By Connection Type

        • USB
        • SD Card
        • Bluetooth/Wi-Fi
        • Cellular Modem
      • Rest of the World By Application

        • On-Board Diagnostics
        • ADAS & Safety
        • Fleet Management
        • Automotive Insurance
      • Rest of the World By End-Market

        • OEMs
        • Service Stations
        • Regulatory Bodies
      • Middle East Outlook (USD Billion, 2018-2032)

      • Middle East By Based on Channel

        • CAN & CAN FD,
        • LIN
        • FlexRay
        • Ethernet.
      • Middle East By Connection Type

        • USB
        • SD Card
        • Bluetooth/Wi-Fi
        • Cellular Modem
      • Middle East By Application

        • On-Board Diagnostics
        • ADAS & Safety
        • Fleet Management
        • Automotive Insurance
      • Middle East By End-Market

        • OEMs
        • Service Stations
        • Regulatory Bodies
      • Africa Outlook (USD Billion, 2018-2032)

      • Africa By Based on Channel

        • CAN & CAN FD,
        • LIN
        • FlexRay
        • Ethernet
      • Africa By Connection Type

        • USB
        • SD Card
        • Bluetooth/Wi-Fi
        • Cellular Modem
      • Africa By Application

        • On-Board Diagnostics
        • ADAS & Safety
        • Fleet Management
        • Automotive Insurance
      • Africa By End-Market

        • OEMs
        • Service Stations
        • Regulatory Bodies
      • Latin America Outlook (USD Billion, 2018-2032)

      • Latin America By Based on Channel

        • CAN & CAN FD,
        • LIN
        • FlexRay
        • Ethernet
      • Latin America By Connection Type

        • USB
        • SD Card
        • Bluetooth/Wi-Fi
        • Cellular Modem
      • Latin America By Application

        • On-Board Diagnostics
        • ADAS & Safety
        • Fleet Management
        • Automotive Insurance
      • Latin America By End-Market

        • OEMs
        • Service Stations
        • Regulatory Bodies
    Automotive Data Logger Market Research Report—Global Forecast till 2032 Infographic
    Free Sample Request

    Kindly complete the form below to receive a free sample of this Report

    Customer Strories

    “I am very pleased with how market segments have been defined in a relevant way for my purposes (such as "Portable Freezers & refrigerators" and "last-mile"). In general the report is well structured. Thanks very much for your efforts.”

    Victoria Milne Founder
    Case Study

    Chemicals and Materials