• Cat-intel
  • MedIntelliX
  • Resources
  • About Us
  • Request Free Sample ×

    Kindly complete the form below to receive a free sample of this Report

    Leading companies partner with us for data-driven Insights

    clients tt-cursor

    Automotive Counter Shaft Market

    ID: MRFR/AM/25827-HCR
    128 Pages
    Aarti Dhapte
    September 2025

    Automotive Counter Shaft Market Research Report By Vehicle Type (Passenger Cars, Light Commercial Vehicles, Heavy Commercial Vehicles, Two-Wheelers), By Transmission Type (Manual Transmission, Automatic Transmission, Continuously Variable Transmission), By Material (Steel, Aluminum, Carbon Fiber), By Size (Small (under 300mm), Medium (300-500mm), Large (over 500mm)) and By Regional (North America, Europe, South America, Asia Pacific, Middle East and Africa) - Forecast to 2034

    Share:
    Download PDF ×

    We do not share your information with anyone. However, we may send you emails based on your report interest from time to time. You may contact us at any time to opt-out.

    Automotive Counter Shaft Market Research Report- Global Forecast till 2034 Infographic
    Purchase Options
    $ 4,950.0
    $ 5,950.0
    $ 7,250.0
    Table of Contents

    Automotive Counter Shaft Market Summary

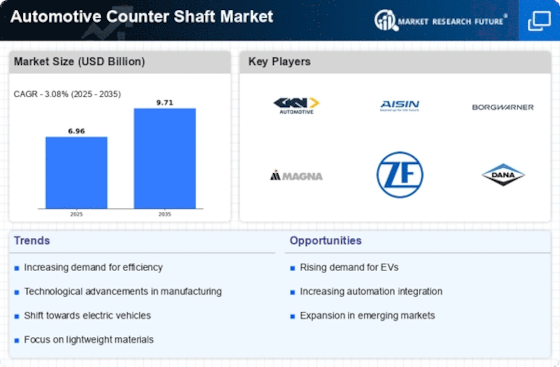
    The Global Automotive Counter Shaft Market is projected to grow from 6.96 USD Billion in 2024 to 9.78 USD Billion by 2035.

    Key Market Trends & Highlights

    Automotive Counter Shaft Key Trends and Highlights

    • The market is expected to experience a compound annual growth rate (CAGR) of 3.14% from 2025 to 2035.
    • By 2035, the market valuation is anticipated to reach 9.78 USD Billion, indicating robust growth.
    • In 2024, the market is valued at 6.96 USD Billion, laying a solid foundation for future expansion.
    • Growing adoption of advanced transmission systems due to increasing demand for fuel efficiency is a major market driver.

    Market Size & Forecast

    2024 Market Size 6.96 (USD Billion)
    2035 Market Size 9.78 (USD Billion)
    CAGR (2025-2035) 3.14%

    Major Players

    Aisin Seiki Co., Ltd., Schaeffler AG, NSK, ZF, Tenneco, TI Automotive, AAM, GKN Driveline, JTEKT, Dana

    Automotive Counter Shaft Market Trends

    The Automotive Counter Shaft Market is driven by the rising demand for lightweight and fuel-efficient vehicles, stricter emission regulations, and increasing adoption of advanced transmission technologies. The growing popularity of electric vehicles and hybrid vehicles is expected to further boost market growth. Key market trends include advancements in lightweight materials and innovative manufacturing techniques, which enable the production of highly efficient counter shafts. Additionally, the implementation of Industry 4.0 technologies, such as automation and data analytics, is expected to enhance production efficiency and reduce manufacturing costs.

    The ongoing advancements in automotive technology and the increasing demand for fuel-efficient vehicles appear to be driving the evolution of counter shafts, which are integral to enhancing vehicle performance and efficiency.

    U.S. Department of Energy

    Automotive Counter Shaft Market Drivers

    Market Trends and Projections

    Growing Demand for Fuel Efficiency

    The Global Automotive Counter Shaft Market Industry is witnessing an increasing demand for fuel-efficient vehicles, driven by rising fuel prices and environmental concerns. Automotive manufacturers are focusing on enhancing the efficiency of their powertrains, which directly influences the design and functionality of counter shafts. As a result, the market is projected to reach 6.96 USD Billion in 2024, reflecting the industry's commitment to sustainability. The integration of advanced materials and manufacturing techniques in counter shaft production contributes to weight reduction and improved performance, aligning with global trends towards greener automotive solutions.

    Increase in Vehicle Production and Sales

    The Global Automotive Counter Shaft Market Industry is significantly influenced by the rising production and sales of vehicles worldwide. As emerging economies continue to expand their automotive sectors, the demand for counter shafts is expected to surge. The market is anticipated to reach 9.78 USD Billion by 2035, driven by the increasing number of vehicles on the road. This trend is further supported by government initiatives promoting vehicle ownership and infrastructure development, which collectively bolster the automotive supply chain and, consequently, the demand for essential components like counter shafts.

    Shift Towards Electric and Hybrid Vehicles

    The shift towards electric and hybrid vehicles is reshaping the Global Automotive Counter Shaft Market Industry. As consumers increasingly favor eco-friendly transportation options, automotive manufacturers are adapting their designs to accommodate electric drivetrains. This transition necessitates the development of specialized counter shafts that can handle unique torque and power requirements. Consequently, the market is poised for growth, as manufacturers invest in the production of counter shafts tailored for electric and hybrid applications, ensuring compatibility with the evolving automotive landscape.

    Regulatory Compliance and Emission Standards

    Regulatory compliance and stringent emission standards are critical drivers in the Global Automotive Counter Shaft Market Industry. Governments worldwide are implementing regulations aimed at reducing vehicular emissions, compelling manufacturers to innovate and enhance their products. Counter shafts, being integral to the powertrain, must meet these evolving standards, which often involves adopting advanced technologies and materials. This regulatory landscape not only fosters innovation but also ensures that the automotive industry aligns with global sustainability goals, thereby influencing the demand for high-performance counter shafts that comply with these regulations.

    Technological Advancements in Automotive Engineering

    Technological innovations in automotive engineering play a pivotal role in shaping the Global Automotive Counter Shaft Market Industry. The advent of electric and hybrid vehicles necessitates the development of specialized counter shafts that can withstand different operational conditions. As manufacturers invest in research and development, the market is expected to grow at a CAGR of 3.14% from 2025 to 2035. This growth is indicative of the industry's adaptation to new technologies, such as lightweight materials and precision manufacturing processes, which enhance the durability and efficiency of counter shafts in modern vehicles.

    Market Segment Insights

    Automotive Counter Shaft Market Vehicle Type Insights  

    Global Automotive Counter Shaft Market Vehicle Type Passenger Cars Light Commercial Vehicles Heavy Commercial Vehicles Two-Wheelers Among these segments, the market share of the passenger cars  segment is expected to be highest in 2023, owing to the increasing production and sale of passenger cars across the globe.

    The Light Commercial Vehicles segment share is expected to grow with a significant CAGR, due to the increasing demand of commercial vehicles for the purpose of transportation and logistics. The Heavy Commercial Vehicles  segment share is expected to grow steadily, owing to the increasing activities of infrastructure and construction across the globe.The Two-Wheelers segment share is likely to grow with a moderate growth, due to the rising application of two-wheelers in several emerging nations.

    Market Size: In terms of value, the market in the passenger cars  segment is estimated to be worth USD 2.62 Billion on 2023 and is projected to reach USD 3.29 Billion on 2032, registering a CAGR of 3.2%. The market in the Light Commercial Vehicles  segment was estimated at USD 1.89 Billion in 2023 and is projected to reach USD 2.41 Billion on 2032, expanding at a CAGR of 3.3%.

    The market in the Heavy Commercial Vehicles  segment is estimated to be worth USD 1.34 Billion on 2023 and is projected to reach USD 1.71 Billion on 2032, at a CAGR of 3.1%.The Two-Wheelers  segment was estimated at USD 0.70 Billion in 2023 and is projected to reach USD 0.89 Billion by 2032, at a CAGR of 3.0%.

    Market Growth: The growth of the Global Automotive Counter Shaft Market is influenced by several factors, such as increasing production of vehicles, rising demand for commercial vehicles, growth in infrastructure and construction activities, and increasing application of two-wheelers in several emerging nations. Some of the major market are exhibiting the introduction of technological advancements and innovations as one of the key growth factors.For instance, companies are concentrating on the manufacturing of counter shaft materials that are lightweight and strong in nature.

    Automotive Counter Shaft Market Transmission Type Insights  

    The Global Automotive Counter Shaft Market is Segmented by Transmission Type into Manual Transmission, Automatic Transmission, and Continuously Variable Transmission. In 2023, the Automatic Transmission segment is anticipated to hold the largest market share as the transmission type is increasingly being adopted in passenger cars and commercial vehicles. Continuous innovation and advancements in the automatic transmission market, allowing automotive manufacturers to offer more fuel-efficient and comfortable driving vehicles, are driving the segment’s growth.

    In addition to this, increasing consumer interest in fuel-efficient automatic vehicles is further propelling the adoption of automatic transmissions. Automatic Transmission is expected to display a growth rate of 3.6% during the forecast period. The Manual Transmission segment is anticipated to display a growth rate of 2.7% during the forecast period. This growth is primarily due to the cost-effective nature and the simplicity of design of manual transmissions.

    However, the rising popularity of automatic transmissions is anticipated to have a negative impact on the growth prospects of the segment.The Continuously Variable Transmission  segment is anticipated to display a significant growth rate during the forecast period. The growth can be attributable to the capability of the transmission type to provide a smooth and efficient driving experience. The segment growth is further propelled by the increasing adoption of hybrid and electric vehicles.

    Automotive Counter Shaft Market Material Insights  

    The Global Automotive Counter Shaft Market is segmented by Material into Steel, Aluminum, and Carbon Fiber. Steel is the most widely used material in the production of automotive counter shafts, due to its high strength, durability, and relatively low cost. However, Aluminum is increasingly being used as a substitute for steel in automotive counter shafts, as it offers advantages such as lighter weight and improved fuel efficiency. Carbon Fiber is also being used in the production of automotive counter shafts, due to its high strength-to-weight ratio and excellent fatigue resistance.

    The Global Automotive Counter Shaft Market is expected to witness significant growth in the coming years, driven by the increasing demand for lightweight and fuel-efficient vehicles. The market is also expected to benefit from the growing adoption of electric vehicles, which require high-performance counter shafts.

    Automotive Counter Shaft Market Size Insights  

    The global automotive counter shaft market is segmented by size into small (under 300mm), medium (300-500mm), and large (over 500mm). The medium segment is expected to hold the largest market share in 2023, accounting for around 40% of the global revenue. This is due to the increasing demand for mid-sized vehicles, such as sedans and SUVs. The large segment is expected to grow at the highest CAGR of 3.5% from 2023 to 2032, due to the rising demand for heavy-duty vehicles, such as trucks and buses.

    The small segment is expected to account for the smallest market share in 2023, but it is expected to grow at a steady CAGR of 2.5% over the forecast period.

    Get more detailed insights about Automotive Counter Shaft Market Research Report- Global Forecast till 2034

    Regional Insights

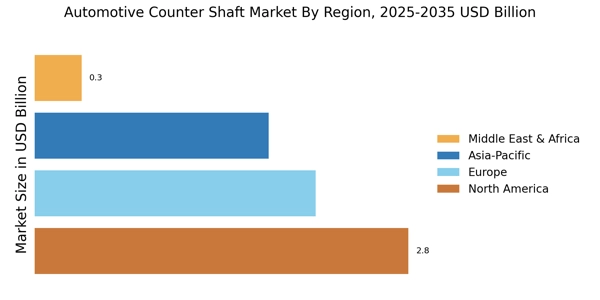
    The Global Automotive Counter Shaft Market exhibits significant regional variations in market dynamics and growth prospects. North America, with its well-established automotive industry and growing demand for high-performance vehicles, is projected to remain a key market for automotive counter shafts.

    In 2023, the regional market is valued at approximately USD 2.5 billion and is anticipated to reach USD 3.0 billion by 2032, exhibiting a CAGR of 2.7%. Europe, another mature automotive market, is expected to witness steady growth in the counter shaft market, driven by increasing production of passenger cars and commercial vehicles.The market value in Europe is estimated to climb from USD 1.8 billion in 2023 to USD 2.2 billion by 2032, registering a CAGR of 2.5%.

    The APAC region, with its rapidly expanding automotive sector and rising middle class, is poised for robust growth in the automotive counter shaft market.

    The regional market is projected to advance from USD 1.5 billion in 2023 to USD 2.1 billion by 2032, exhibiting a CAGR of 3.2%. South America and MEA, while accounting for a smaller share of the global market, are expected to witness moderate growth in the coming years, driven by increasing vehicle production and urbanization.

    Automotive Counter Shaft Market Regional

    Source: Primary Research, Secondary Research, Market Research Future Database and Analyst Review

    Key Players and Competitive Insights

    Automotive Counter Shaft Market is a major industry and thus, the players here try to gain a competitive advantage by developing innovative products. Furthermore, leading Automotive Counter Shaft Market players focus on global expansion through mergers and acquisitions and establishing partnerships and joint ventures.

    The development of the Automotive Counter Shaft Market is primarily driven by the increased demand for fuel-efficient and lightweight vehicles and the rise in popularity of electric and hybrid vehicles. The Automotive Counter Shaft Market Competitive Landscape will continue to be tough for any manufacturer due to the need to establish itself and win customers on the market through the development of innovative and efficient products.

    Finally, Aisin Seiki Co., Ltd., is one of the largest and most influential companies on the Global Automotive Counter Shaft Market, offering a diverse range of automotive components such as counter shafts, gears, and transmissions. The company has several manufacturing facilities in Japan, North America, Europe, and Asia and is known to offer high-quality products featuring advanced technologies. Schaeffler AG is a competitor company on the Global Automotive Counter Shaft Market that also offers a wide range of automotive components; it is a global supplier of bearings, clutches, and transmissions.

    Key Companies in the Automotive Counter Shaft Market market include

    Industry Developments

    The global automotive counter shaft market is projected to reach USD 9.42 billion by 2034, exhibiting a CAGR of 3.82% during the forecast period. Rising demand for lightweight and fuel-efficient vehicles, coupled with increasing production of passenger cars and light commercial vehicles, is driving market growth. Growing adoption of advanced transmission systems, such as dual-clutch transmissions (DCTs) and continuously variable transmissions (CVTs), is further fueling demand for counter shafts. The market is witnessing strategic partnerships and collaborations among key players to develop and manufacture innovative counter shaft solutions.

    For instance, in 2023, Schaeffler and GKN Automotive announced a partnership to develop and produce a new generation of counter shafts for electric vehicles.

    Future Outlook

    Automotive Counter Shaft Market Future Outlook

    The Automotive Counter Shaft Market is projected to grow at a 3.14% CAGR from 2024 to 2035, driven by advancements in automotive technology, increasing vehicle production, and demand for fuel-efficient systems.

    New opportunities lie in:

    • Invest in lightweight materials to enhance fuel efficiency and performance.
    • Develop advanced manufacturing techniques to reduce production costs and improve quality.
    • Explore partnerships with electric vehicle manufacturers to supply specialized counter shafts.

    By 2035, the market is expected to exhibit robust growth, reflecting evolving automotive technologies and consumer demands.

    Market Segmentation

    Automotive Counter Shaft Market Size Outlook

    • North America
    • Europe
    • South America
    • Asia Pacific
    • Middle East and Africa

    Automotive Counter Shaft Market Material Outlook

    • Small (under 300mm)
    • Medium (300-500mm)
    • Large (over 500mm)

    Automotive Counter Shaft Market Regional Outlook

    • North America
    • Europe
    • South America
    • Asia Pacific
    • Middle East and Africa

    Automotive Counter Shaft Market Vehicle Type Outlook

    • Manual Transmission
    • Automatic Transmission
    • Continuously Variable Transmission

    Automotive Counter Shaft Market Transmission Type Outlook

    • Steel
    • Aluminum
    • Carbon Fiber

    Report Scope

    Report Attribute/Metric Details
    Market Size 2024  6.96 (USD Billion)
    Market Size 2025  7.17 (USD Billion)
    Market Size 2034  9.42 (USD Billion)
    Compound Annual Growth Rate (CAGR)  3.82% (2025 - 2034)
    Report Coverage Revenue Forecast, Competitive Landscape, Growth Factors, and Trends
    Base Year 2024
    Market Forecast Period 2025 - 2034
    Historical Data 2019 - 2023
    Market Forecast Units USD Billion
    Key Companies Profiled NSK, ZF, Tenneco, Schaeffler, TI Automotive, AAM, GKN Driveline, JTEKT, Dana
    Segments Covered Vehicle Type, Transmission Type, Material, Size, Regional
    Key Market Opportunities Electrified Vehicles Growth Growing Demand for Automatic Transmissions Innovations in Material Technology Rising Automotive Production Expansion in Emerging Markets
    Key Market Dynamics Increased demand for lightweight vehicles Growing preference for automatic transmissions Advancements in manufacturing technology Escalating need for fuel efficiency Rising popularity of electric and hybrid vehicles
    Countries Covered North America, Europe, APAC, South America, MEA

    Market Highlights

    Author
    Aarti Dhapte
    Team Lead - Research

    She holds an experience of about 6+ years in Market Research and Business Consulting, working under the spectrum of Information Communication Technology, Telecommunications and Semiconductor domains. Aarti conceptualizes and implements a scalable business strategy and provides strategic leadership to the clients. Her expertise lies in market estimation, competitive intelligence, pipeline analysis, customer assessment, etc.

    Leave a Comment

    FAQs

    What is the market size of the Global Automotive Counter Shaft Market?

    The Automotive Counter Shaft Market is valued at approximately USD 6.96 Billion in 2024 and is projected to grow at a steady CAGR of 3.82% during the forecast period of 2025-2034 to reach an estimated value of USD 9.42 Billion by 2034.

    Which region is expected to hold the largest market share in the Global Automotive Counter Shaft Market?

    Asia-Pacific is anticipated to dominate the Automotive Counter Shaft Market throughout the forecast period, owing to the presence of major automotive manufacturing hubs such as China, Japan, and India.

    What are the key growth drivers of the Global Automotive Counter Shaft Market?

    Rising demand for fuel-efficient and lightweight vehicles, increasing production of electric vehicles, and growing adoption of advanced transmission systems are the primary growth drivers of the Automotive Counter Shaft Market.

    Which application segment is expected to account for the highest market share in the Global Automotive Counter Shaft Market?

    The passenger car segment is projected to capture the largest market share in the Automotive Counter Shaft Market, driven by the growing demand for personal mobility and the increasing production of passenger cars worldwide.

    Who are the key competitors in the Global Automotive Counter Shaft Market?

    Some of the prominent players in the Automotive Counter Shaft Market include Aisin Seiki Co., Ltd., BorgWarner Inc., Dana Incorporated, Hitachi Automotive Systems, Ltd., JTEKT Corporation, and ZF Friedrichshafen AG.

    What are the challenges faced by the Global Automotive Counter Shaft Market?

    Fluctuating raw material prices, intense competition, and technological advancements pose key challenges to the growth of the Automotive Counter Shaft Market.

    What are the current trends in the Global Automotive Counter Shaft Market?

    The increasing adoption of lightweight materials, integration of sensors and electronics, and development of multi-speed transmissions are emerging trends in the Automotive Counter Shaft Market.

    What is the forecast for the Global Automotive Counter Shaft Market?

    The Automotive Counter Shaft Market is projected to continue its growth trajectory, driven by the rising demand for fuel-efficient vehicles and the increasing production of electric and hybrid vehicles.

    What are the key opportunities for growth in the Global Automotive Counter Shaft Market?

    Expansion into emerging markets, technological advancements, and collaborations with automotive manufacturers present significant opportunities for growth in the Automotive Counter Shaft Market.

    What are the key challenges for growth in the Global Automotive Counter Shaft Market?

    Economic fluctuations, supply chain disruptions, and regulatory changes pose potential challenges to the growth of the Automotive Counter Shaft Market.

    1. 'TABLE OF CONTENTS
    2. EXECUTIVE SUMMARY
      1. Market Overview
      2. Key Findings
      3. Market Segmentation
      4. Competitive Landscape
      5. Challenges and Opportunities
      6. Future Outlook
    3. MARKET INTRODUCTION
      1. Definition
      2. Scope of the study
        1. Research
    4. Objective
      1. Assumption
        1. Limitations
    5. RESEARCH METHODOLOGY
      1. Overview
      2. Data Mining
      3. Secondary Research
    6. Primary Research
      1. Primary Interviews and Information Gathering Process
        1. Breakdown of Primary Respondents
      2. Forecasting Model
    7. Market Size Estimation
      1. Bottom-Up Approach
        1. Top-Down Approach
      2. Data Triangulation
      3. Validation
    8. MARKET DYNAMICS
      1. Overview
      2. Drivers
      3. Restraints
      4. Opportunities
    9. MARKET FACTOR ANALYSIS
      1. Value chain Analysis
      2. Porter''s
    10. Five Forces Analysis
      1. Bargaining Power of Suppliers
        1. Bargaining
    11. Power of Buyers
      1. Threat of New Entrants
        1. Threat of Substitutes
        2. Intensity of Rivalry
      2. COVID-19 Impact Analysis
    12. Market Impact Analysis
      1. Regional Impact
        1. Opportunity and
    13. Threat Analysis
    14. AUTOMOTIVE COUNTER SHAFT MARKET, BY VEHICLE TYPE (USD BILLION)
      1. Passenger Cars
      2. Light Commercial Vehicles
      3. Heavy
    15. Commercial Vehicles
      1. Two-Wheelers
    16. AUTOMOTIVE COUNTER SHAFT MARKET,
    17. BY TRANSMISSION TYPE (USD BILLION)
      1. Manual Transmission
      2. Automatic
    18. Transmission
      1. Continuously Variable Transmission
    19. AUTOMOTIVE COUNTER
    20. SHAFT MARKET, BY MATERIAL (USD BILLION)
      1. Steel
      2. Aluminum
      3. Carbon Fiber
    21. AUTOMOTIVE COUNTER SHAFT MARKET, BY SIZE (USD BILLION)
      1. Small (under 300mm)
      2. Medium (300-500mm)
      3. Large (over
    22. mm)
    23. AUTOMOTIVE COUNTER SHAFT MARKET, BY REGIONAL (USD BILLION)
      1. North America
        1. US
        2. Canada
      2. Europe
        1. Germany
        2. UK
        3. France
        4. Russia
        5. Italy
        6. Spain
        7. Rest of Europe
      3. APAC
        1. China
        2. India
        3. Japan
        4. South
    24. Korea
      1. Malaysia
        1. Thailand
        2. Indonesia
        3. Rest of APAC
      2. South America
        1. Brazil
    25. Mexico
      1. Argentina
        1. Rest of South America
      2. MEA
        1. GCC Countries
        2. South Africa
        3. Rest of MEA
    26. COMPETITIVE LANDSCAPE
      1. Overview
      2. Competitive Analysis
      3. Market share Analysis
      4. Major Growth Strategy in the Automotive
    27. Counter Shaft Market
      1. Competitive Benchmarking
      2. Leading Players
    28. in Terms of Number of Developments in the Automotive Counter Shaft Market
    29. Key developments and growth strategies
      1. New Product Launch/Service
    30. Deployment
      1. Merger & Acquisitions
        1. Joint Ventures
      2. Major Players Financial Matrix
        1. Sales and Operating Income
        2. Major Players R&D Expenditure. 2023
    31. COMPANY PROFILES
      1. NSK
        1. Financial Overview
        2. Products Offered
        3. Key Developments
        4. SWOT Analysis
        5. Key Strategies
      2. ZF
        1. Financial Overview
        2. Products Offered
        3. Key Developments
        4. SWOT Analysis
        5. Key Strategies
      3. Tenneco
        1. Financial Overview
        2. Products Offered
        3. Key Developments
        4. SWOT Analysis
        5. Key Strategies
      4. Schaeffler
        1. Financial Overview
        2. Products Offered
        3. Key Developments
        4. SWOT Analysis
        5. Key Strategies
      5. TI Automotive
        1. Financial Overview
        2. Products
    32. Offered
      1. Key Developments
        1. SWOT Analysis
    33. Key Strategies
      1. AAM
        1. Financial Overview
        2. Products
    34. Offered
      1. Key Developments
        1. SWOT Analysis
    35. Key Strategies
      1. GKN Driveline
        1. Financial Overview
    36. Products Offered
      1. Key Developments
        1. SWOT Analysis
        2. Key Strategies
      2. JTEKT
        1. Financial Overview
        2. Products Offered
        3. Key Developments
        4. SWOT Analysis
        5. Key Strategies
      3. Dana
        1. Financial Overview
        2. Products Offered
        3. Key Developments
        4. SWOT Analysis
        5. Key Strategies
    37. APPENDIX
      1. References
    38. Related Reports
    39. FORECAST, BY VEHICLE TYPE, 2019-2032 (USD BILLIONS)
    40. AUTOMOTIVE COUNTER SHAFT MARKET SIZE ESTIMATES & FORECAST, BY TRANSMISSION TYPE,
    41. 2032 (USD BILLIONS)
    42. SIZE ESTIMATES & FORECAST, BY MATERIAL, 2019-2032 (USD BILLIONS)
    43. NORTH AMERICA AUTOMOTIVE COUNTER SHAFT MARKET SIZE ESTIMATES & FORECAST,
    44. BY SIZE, 2019-2032 (USD BILLIONS)
    45. SHAFT MARKET SIZE ESTIMATES & FORECAST, BY REGIONAL, 2019-2032 (USD BILLIONS)
    46. BY VEHICLE TYPE, 2019-2032 (USD BILLIONS)
    47. MARKET SIZE ESTIMATES & FORECAST, BY TRANSMISSION TYPE, 2019-2032 (USD BILLIONS)
    48. BY MATERIAL, 2019-2032 (USD BILLIONS)
    49. MARKET SIZE ESTIMATES & FORECAST, BY SIZE, 2019-2032 (USD BILLIONS)
    50. US AUTOMOTIVE COUNTER SHAFT MARKET SIZE ESTIMATES & FORECAST, BY REGIONAL,
    51. 2032 (USD BILLIONS)
    52. SIZE ESTIMATES & FORECAST, BY VEHICLE TYPE, 2019-2032 (USD BILLIONS)
    53. CANADA AUTOMOTIVE COUNTER SHAFT MARKET SIZE ESTIMATES & FORECAST, BY TRANSMISSION
    54. TYPE, 2019-2032 (USD BILLIONS)
    55. SIZE ESTIMATES & FORECAST, BY MATERIAL, 2019-2032 (USD BILLIONS)
    56. CANADA AUTOMOTIVE COUNTER SHAFT MARKET SIZE ESTIMATES & FORECAST, BY SIZE,
    57. 2032 (USD BILLIONS)
    58. SIZE ESTIMATES & FORECAST, BY REGIONAL, 2019-2032 (USD BILLIONS)
    59. EUROPE AUTOMOTIVE COUNTER SHAFT MARKET SIZE ESTIMATES & FORECAST, BY VEHICLE
    60. TYPE, 2019-2032 (USD BILLIONS)
    61. SIZE ESTIMATES & FORECAST, BY TRANSMISSION TYPE, 2019-2032 (USD BILLIONS)
    62. BY MATERIAL, 2019-2032 (USD BILLIONS)
    63. SHAFT MARKET SIZE ESTIMATES & FORECAST, BY SIZE, 2019-2032 (USD BILLIONS)
    64. BY REGIONAL, 2019-2032 (USD BILLIONS)
    65. SHAFT MARKET SIZE ESTIMATES & FORECAST, BY VEHICLE TYPE, 2019-2032 (USD BILLIONS)
    66. BY TRANSMISSION TYPE, 2019-2032 (USD BILLIONS)
    67. COUNTER SHAFT MARKET SIZE ESTIMATES & FORECAST, BY MATERIAL, 2019-2032 (USD
    68. BILLIONS)
    69. & FORECAST, BY SIZE, 2019-2032 (USD BILLIONS)
    70. COUNTER SHAFT MARKET SIZE ESTIMATES & FORECAST, BY REGIONAL, 2019-2032 (USD
    71. BILLIONS)
    72. FORECAST, BY VEHICLE TYPE, 2019-2032 (USD BILLIONS)
    73. COUNTER SHAFT MARKET SIZE ESTIMATES & FORECAST, BY TRANSMISSION TYPE, 2019-2032
    74. (USD BILLIONS)
    75. & FORECAST, BY MATERIAL, 2019-2032 (USD BILLIONS)
    76. COUNTER SHAFT MARKET SIZE ESTIMATES & FORECAST, BY SIZE, 2019-2032 (USD BILLIONS)
    77. BY REGIONAL, 2019-2032 (USD BILLIONS)
    78. SHAFT MARKET SIZE ESTIMATES & FORECAST, BY VEHICLE TYPE, 2019-2032 (USD BILLIONS)
    79. BY TRANSMISSION TYPE, 2019-2032 (USD BILLIONS)
    80. COUNTER SHAFT MARKET SIZE ESTIMATES & FORECAST, BY MATERIAL, 2019-2032 (USD
    81. BILLIONS)
    82. & FORECAST, BY SIZE, 2019-2032 (USD BILLIONS)
    83. COUNTER SHAFT MARKET SIZE ESTIMATES & FORECAST, BY REGIONAL, 2019-2032 (USD
    84. BILLIONS)
    85. & FORECAST, BY VEHICLE TYPE, 2019-2032 (USD BILLIONS)
    86. AUTOMOTIVE COUNTER SHAFT MARKET SIZE ESTIMATES & FORECAST, BY TRANSMISSION TYPE,
    87. 2032 (USD BILLIONS)
    88. SIZE ESTIMATES & FORECAST, BY MATERIAL, 2019-2032 (USD BILLIONS)
    89. RUSSIA AUTOMOTIVE COUNTER SHAFT MARKET SIZE ESTIMATES & FORECAST, BY SIZE,
    90. 2032 (USD BILLIONS)
    91. SIZE ESTIMATES & FORECAST, BY REGIONAL, 2019-2032 (USD BILLIONS)
    92. ITALY AUTOMOTIVE COUNTER SHAFT MARKET SIZE ESTIMATES & FORECAST, BY VEHICLE
    93. TYPE, 2019-2032 (USD BILLIONS)
    94. SIZE ESTIMATES & FORECAST, BY TRANSMISSION TYPE, 2019-2032 (USD BILLIONS)
    95. BY MATERIAL, 2019-2032 (USD BILLIONS)
    96. MARKET SIZE ESTIMATES & FORECAST, BY SIZE, 2019-2032 (USD BILLIONS)
    97. ITALY AUTOMOTIVE COUNTER SHAFT MARKET SIZE ESTIMATES & FORECAST, BY REGIONAL,
    98. 2032 (USD BILLIONS)
    99. ESTIMATES & FORECAST, BY VEHICLE TYPE, 2019-2032 (USD BILLIONS)
    100. SPAIN AUTOMOTIVE COUNTER SHAFT MARKET SIZE ESTIMATES & FORECAST, BY TRANSMISSION
    101. TYPE, 2019-2032 (USD BILLIONS)
    102. SIZE ESTIMATES & FORECAST, BY MATERIAL, 2019-2032 (USD BILLIONS)
    103. SPAIN AUTOMOTIVE COUNTER SHAFT MARKET SIZE ESTIMATES & FORECAST, BY SIZE,
    104. 2032 (USD BILLIONS)
    105. ESTIMATES & FORECAST, BY REGIONAL, 2019-2032 (USD BILLIONS)
    106. REST OF EUROPE AUTOMOTIVE COUNTER SHAFT MARKET SIZE ESTIMATES & FORECAST, BY
    107. VEHICLE TYPE, 2019-2032 (USD BILLIONS)
    108. COUNTER SHAFT MARKET SIZE ESTIMATES & FORECAST, BY TRANSMISSION TYPE, 2019-2032
    109. (USD BILLIONS)
    110. ESTIMATES & FORECAST, BY MATERIAL, 2019-2032 (USD BILLIONS)
    111. REST OF EUROPE AUTOMOTIVE COUNTER SHAFT MARKET SIZE ESTIMATES & FORECAST, BY
    112. SIZE, 2019-2032 (USD BILLIONS)
    113. SHAFT MARKET SIZE ESTIMATES & FORECAST, BY REGIONAL, 2019-2032 (USD BILLIONS)
    114. BY VEHICLE TYPE, 2019-2032 (USD BILLIONS)
    115. SHAFT MARKET SIZE ESTIMATES & FORECAST, BY TRANSMISSION TYPE, 2019-2032 (USD
    116. BILLIONS)
    117. FORECAST, BY MATERIAL, 2019-2032 (USD BILLIONS)
    118. COUNTER SHAFT MARKET SIZE ESTIMATES & FORECAST, BY SIZE, 2019-2032 (USD BILLIONS)
    119. BY REGIONAL, 2019-2032 (USD BILLIONS)
    120. MARKET SIZE ESTIMATES & FORECAST, BY VEHICLE TYPE, 2019-2032 (USD BILLIONS)
    121. BY TRANSMISSION TYPE, 2019-2032 (USD BILLIONS)
    122. COUNTER SHAFT MARKET SIZE ESTIMATES & FORECAST, BY MATERIAL, 2019-2032 (USD
    123. BILLIONS)
    124. FORECAST, BY SIZE, 2019-2032 (USD BILLIONS)
    125. SHAFT MARKET SIZE ESTIMATES & FORECAST, BY REGIONAL, 2019-2032 (USD BILLIONS)
    126. BY VEHICLE TYPE, 2019-2032 (USD BILLIONS)
    127. SHAFT MARKET SIZE ESTIMATES & FORECAST, BY TRANSMISSION TYPE, 2019-2032 (USD
    128. BILLIONS)
    129. FORECAST, BY MATERIAL, 2019-2032 (USD BILLIONS)
    130. COUNTER SHAFT MARKET SIZE ESTIMATES & FORECAST, BY SIZE, 2019-2032 (USD BILLIONS)
    131. BY REGIONAL, 2019-2032 (USD BILLIONS)
    132. MARKET SIZE ESTIMATES & FORECAST, BY VEHICLE TYPE, 2019-2032 (USD BILLIONS)
    133. BY TRANSMISSION TYPE, 2019-2032 (USD BILLIONS)
    134. COUNTER SHAFT MARKET SIZE ESTIMATES & FORECAST, BY MATERIAL, 2019-2032 (USD
    135. BILLIONS)
    136. FORECAST, BY SIZE, 2019-2032 (USD BILLIONS)
    137. SHAFT MARKET SIZE ESTIMATES & FORECAST, BY REGIONAL, 2019-2032 (USD BILLIONS)
    138. FORECAST, BY VEHICLE TYPE, 2019-2032 (USD BILLIONS)
    139. AUTOMOTIVE COUNTER SHAFT MARKET SIZE ESTIMATES & FORECAST, BY TRANSMISSION TYPE,
    140. 2032 (USD BILLIONS)
    141. SIZE ESTIMATES & FORECAST, BY MATERIAL, 2019-2032 (USD BILLIONS)
    142. SOUTH KOREA AUTOMOTIVE COUNTER SHAFT MARKET SIZE ESTIMATES & FORECAST, BY
    143. SIZE, 2019-2032 (USD BILLIONS)
    144. MARKET SIZE ESTIMATES & FORECAST, BY REGIONAL, 2019-2032 (USD BILLIONS)
    145. BY VEHICLE TYPE, 2019-2032 (USD BILLIONS)
    146. SHAFT MARKET SIZE ESTIMATES & FORECAST, BY TRANSMISSION TYPE, 2019-2032 (USD
    147. BILLIONS)
    148. & FORECAST, BY MATERIAL, 2019-2032 (USD BILLIONS)
    149. COUNTER SHAFT MARKET SIZE ESTIMATES & FORECAST, BY SIZE, 2019-2032 (USD BILLIONS)
    150. BY REGIONAL, 2019-2032 (USD BILLIONS)
    151. SHAFT MARKET SIZE ESTIMATES & FORECAST, BY VEHICLE TYPE, 2019-2032 (USD BILLIONS)
    152. BY TRANSMISSION TYPE, 2019-2032 (USD BILLIONS)
    153. COUNTER SHAFT MARKET SIZE ESTIMATES & FORECAST, BY MATERIAL, 2019-2032 (USD
    154. BILLIONS)
    155. & FORECAST, BY SIZE, 2019-2032 (USD BILLIONS)
    156. COUNTER SHAFT MARKET SIZE ESTIMATES & FORECAST, BY REGIONAL, 2019-2032 (USD
    157. BILLIONS)
    158. & FORECAST, BY VEHICLE TYPE, 2019-2032 (USD BILLIONS)
    159. AUTOMOTIVE COUNTER SHAFT MARKET SIZE ESTIMATES & FORECAST, BY TRANSMISSION TYPE,
    160. 2032 (USD BILLIONS)
    161. SIZE ESTIMATES & FORECAST, BY MATERIAL, 2019-2032 (USD BILLIONS)
    162. INDONESIA AUTOMOTIVE COUNTER SHAFT MARKET SIZE ESTIMATES & FORECAST, BY
    163. SIZE, 2019-2032 (USD BILLIONS)
    164. MARKET SIZE ESTIMATES & FORECAST, BY REGIONAL, 2019-2032 (USD BILLIONS)
    165. BY VEHICLE TYPE, 2019-2032 (USD BILLIONS)
    166. COUNTER SHAFT MARKET SIZE ESTIMATES & FORECAST, BY TRANSMISSION TYPE, 2019-2032
    167. (USD BILLIONS)
    168. ESTIMATES & FORECAST, BY MATERIAL, 2019-2032 (USD BILLIONS)
    169. REST OF APAC AUTOMOTIVE COUNTER SHAFT MARKET SIZE ESTIMATES & FORECAST, BY SIZE,
    170. 2032 (USD BILLIONS)
    171. MARKET SIZE ESTIMATES & FORECAST, BY REGIONAL, 2019-2032 (USD BILLIONS)
    172. FORECAST, BY VEHICLE TYPE, 2019-2032 (USD BILLIONS)
    173. AUTOMOTIVE COUNTER SHAFT MARKET SIZE ESTIMATES & FORECAST, BY TRANSMISSION TYPE,
    174. 2032 (USD BILLIONS)
    175. MARKET SIZE ESTIMATES & FORECAST, BY MATERIAL, 2019-2032 (USD BILLIONS)
    176. FORECAST, BY SIZE, 2019-2032 (USD BILLIONS)
    177. COUNTER SHAFT MARKET SIZE ESTIMATES & FORECAST, BY REGIONAL, 2019-2032 (USD
    178. BILLIONS)
    179. & FORECAST, BY VEHICLE TYPE, 2019-2032 (USD BILLIONS)
    180. AUTOMOTIVE COUNTER SHAFT MARKET SIZE ESTIMATES & FORECAST, BY TRANSMISSION TYPE,
    181. 2032 (USD BILLIONS)
    182. SIZE ESTIMATES & FORECAST, BY MATERIAL, 2019-2032 (USD BILLIONS)
    183. BRAZIL AUTOMOTIVE COUNTER SHAFT MARKET SIZE ESTIMATES & FORECAST, BY SIZE,
    184. 2032 (USD BILLIONS)
    185. SIZE ESTIMATES & FORECAST, BY REGIONAL, 2019-2032 (USD BILLIONS)
    186. MEXICO AUTOMOTIVE COUNTER SHAFT MARKET SIZE ESTIMATES & FORECAST, BY VEHICLE
    187. TYPE, 2019-2032 (USD BILLIONS)
    188. MARKET SIZE ESTIMATES & FORECAST, BY TRANSMISSION TYPE, 2019-2032 (USD BILLIONS)
    189. BY MATERIAL, 2019-2032 (USD BILLIONS)
    190. SHAFT MARKET SIZE ESTIMATES & FORECAST, BY SIZE, 2019-2032 (USD BILLIONS)
    191. BY REGIONAL, 2019-2032 (USD BILLIONS)
    192. SHAFT MARKET SIZE ESTIMATES & FORECAST, BY VEHICLE TYPE, 2019-2032 (USD BILLIONS)
    193. FORECAST, BY TRANSMISSION TYPE, 2019-2032 (USD BILLIONS)
    194. AUTOMOTIVE COUNTER SHAFT MARKET SIZE ESTIMATES & FORECAST, BY MATERIAL, 2019-2032
    195. (USD BILLIONS)
    196. & FORECAST, BY SIZE, 2019-2032 (USD BILLIONS)
    197. COUNTER SHAFT MARKET SIZE ESTIMATES & FORECAST, BY REGIONAL, 2019-2032 (USD
    198. BILLIONS)
    199. SIZE ESTIMATES & FORECAST, BY VEHICLE TYPE, 2019-2032 (USD BILLIONS)
    200. REST OF SOUTH AMERICA AUTOMOTIVE COUNTER SHAFT MARKET SIZE ESTIMATES &
    201. FORECAST, BY TRANSMISSION TYPE, 2019-2032 (USD BILLIONS)
    202. SOUTH AMERICA AUTOMOTIVE COUNTER SHAFT MARKET SIZE ESTIMATES & FORECAST, BY
    203. MATERIAL, 2019-2032 (USD BILLIONS)
    204. COUNTER SHAFT MARKET SIZE ESTIMATES & FORECAST, BY SIZE, 2019-2032 (USD BILLIONS)
    205. & FORECAST, BY REGIONAL, 2019-2032 (USD BILLIONS)
    206. COUNTER SHAFT MARKET SIZE ESTIMATES & FORECAST, BY VEHICLE TYPE, 2019-2032 (USD
    207. BILLIONS)
    208. FORECAST, BY TRANSMISSION TYPE, 2019-2032 (USD BILLIONS)
    209. COUNTER SHAFT MARKET SIZE ESTIMATES & FORECAST, BY MATERIAL, 2019-2032 (USD
    210. BILLIONS)
    211. FORECAST, BY SIZE, 2019-2032 (USD BILLIONS)
    212. SHAFT MARKET SIZE ESTIMATES & FORECAST, BY REGIONAL, 2019-2032 (USD BILLIONS)
    213. FORECAST, BY VEHICLE TYPE, 2019-2032 (USD BILLIONS)
    214. AUTOMOTIVE COUNTER SHAFT MARKET SIZE ESTIMATES & FORECAST, BY TRANSMISSION TYPE,
    215. 2032 (USD BILLIONS)
    216. MARKET SIZE ESTIMATES & FORECAST, BY MATERIAL, 2019-2032 (USD BILLIONS)
    217. FORECAST, BY SIZE, 2019-2032 (USD BILLIONS)
    218. COUNTER SHAFT MARKET SIZE ESTIMATES & FORECAST, BY REGIONAL, 2019-2032 (USD
    219. BILLIONS)
    220. & FORECAST, BY VEHICLE TYPE, 2019-2032 (USD BILLIONS)
    221. AFRICA AUTOMOTIVE COUNTER SHAFT MARKET SIZE ESTIMATES & FORECAST, BY TRANSMISSION
    222. TYPE, 2019-2032 (USD BILLIONS)
    223. SHAFT MARKET SIZE ESTIMATES & FORECAST, BY MATERIAL, 2019-2032 (USD BILLIONS)
    224. FORECAST, BY SIZE, 2019-2032 (USD BILLIONS)
    225. COUNTER SHAFT MARKET SIZE ESTIMATES & FORECAST, BY REGIONAL, 2019-2032 (USD
    226. BILLIONS)
    227. & FORECAST, BY VEHICLE TYPE, 2019-2032 (USD BILLIONS)
    228. OF MEA AUTOMOTIVE COUNTER SHAFT MARKET SIZE ESTIMATES & FORECAST, BY TRANSMISSION
    229. TYPE, 2019-2032 (USD BILLIONS)
    230. MARKET SIZE ESTIMATES & FORECAST, BY MATERIAL, 2019-2032 (USD BILLIONS)
    231. BY SIZE, 2019-2032 (USD BILLIONS)
    232. SHAFT MARKET SIZE ESTIMATES & FORECAST, BY REGIONAL, 2019-2032 (USD BILLIONS)
    233. NORTH AMERICA AUTOMOTIVE COUNTER SHAFT MARKET ANALYSIS
    234. COUNTER SHAFT MARKET ANALYSIS BY VEHICLE TYPE
    235. SHAFT MARKET ANALYSIS BY TRANSMISSION TYPE
    236. SHAFT MARKET ANALYSIS BY MATERIAL
    237. ANALYSIS BY SIZE
    238. REGIONAL
    239. TYPE
    240. TYPE
    241. CANADA AUTOMOTIVE COUNTER SHAFT MARKET ANALYSIS BY REGIONAL
    242. EUROPE AUTOMOTIVE COUNTER SHAFT MARKET ANALYSIS
    243. COUNTER SHAFT MARKET ANALYSIS BY VEHICLE TYPE
    244. COUNTER SHAFT MARKET ANALYSIS BY TRANSMISSION TYPE
    245. COUNTER SHAFT MARKET ANALYSIS BY MATERIAL
    246. SHAFT MARKET ANALYSIS BY SIZE
    247. MARKET ANALYSIS BY REGIONAL
    248. ANALYSIS BY VEHICLE TYPE
    249. BY TRANSMISSION TYPE
    250. BY MATERIAL
    251. FRANCE AUTOMOTIVE COUNTER SHAFT MARKET ANALYSIS BY VEHICLE TYPE
    252. FRANCE AUTOMOTIVE COUNTER SHAFT MARKET ANALYSIS BY TRANSMISSION TYPE
    253. FRANCE AUTOMOTIVE COUNTER SHAFT MARKET ANALYSIS BY MATERIAL
    254. FRANCE AUTOMOTIVE COUNTER SHAFT MARKET ANALYSIS BY SIZE
    255. AUTOMOTIVE COUNTER SHAFT MARKET ANALYSIS BY REGIONAL
    256. COUNTER SHAFT MARKET ANALYSIS BY VEHICLE TYPE
    257. COUNTER SHAFT MARKET ANALYSIS BY TRANSMISSION TYPE
    258. COUNTER SHAFT MARKET ANALYSIS BY MATERIAL
    259. SHAFT MARKET ANALYSIS BY SIZE
    260. ANALYSIS BY REGIONAL
    261. BY VEHICLE TYPE
    262. BY TRANSMISSION TYPE
    263. BY MATERIAL
    264. SPAIN AUTOMOTIVE COUNTER SHAFT MARKET ANALYSIS BY REGIONAL
    265. REST OF EUROPE AUTOMOTIVE COUNTER SHAFT MARKET ANALYSIS BY VEHICLE TYPE
    266. REST OF EUROPE AUTOMOTIVE COUNTER SHAFT MARKET ANALYSIS BY TRANSMISSION TYPE
    267. CHINA AUTOMOTIVE COUNTER SHAFT MARKET ANALYSIS BY VEHICLE TYPE
    268. CHINA AUTOMOTIVE COUNTER SHAFT MARKET ANALYSIS BY TRANSMISSION TYPE
    269. CHINA AUTOMOTIVE COUNTER SHAFT MARKET ANALYSIS BY MATERIAL
    270. CHINA AUTOMOTIVE COUNTER SHAFT MARKET ANALYSIS BY SIZE
    271. COUNTER SHAFT MARKET ANALYSIS BY REGIONAL
    272. SHAFT MARKET ANALYSIS BY VEHICLE TYPE
    273. SHAFT MARKET ANALYSIS BY TRANSMISSION TYPE
    274. SHAFT MARKET ANALYSIS BY MATERIAL
    275. MARKET ANALYSIS BY SIZE
    276. BY REGIONAL
    277. TYPE
    278. TYPE
    279. JAPAN AUTOMOTIVE COUNTER SHAFT MARKET ANALYSIS BY REGIONAL
    280. SOUTH KOREA AUTOMOTIVE COUNTER SHAFT MARKET ANALYSIS BY VEHICLE TYPE
    281. SOUTH KOREA AUTOMOTIVE COUNTER SHAFT MARKET ANALYSIS BY TRANSMISSION TYPE
    282. SOUTH KOREA AUTOMOTIVE COUNTER SHAFT MARKET ANALYSIS BY REGIONAL
    283. MALAYSIA AUTOMOTIVE COUNTER SHAFT MARKET ANALYSIS BY VEHICLE TYPE
    284. MALAYSIA AUTOMOTIVE COUNTER SHAFT MARKET ANALYSIS BY TRANSMISSION TYPE
    285. MALAYSIA AUTOMOTIVE COUNTER SHAFT MARKET ANALYSIS BY MATERIAL
    286. MALAYSIA AUTOMOTIVE COUNTER SHAFT MARKET ANALYSIS BY SIZE
    287. AUTOMOTIVE COUNTER SHAFT MARKET ANALYSIS BY REGIONAL
    288. COUNTER SHAFT MARKET ANALYSIS BY VEHICLE TYPE
    289. COUNTER SHAFT MARKET ANALYSIS BY TRANSMISSION TYPE
    290. COUNTER SHAFT MARKET ANALYSIS BY MATERIAL
    291. SHAFT MARKET ANALYSIS BY SIZE
    292. MARKET ANALYSIS BY REGIONAL
    293. MARKET ANALYSIS BY VEHICLE TYPE
    294. MARKET ANALYSIS BY TRANSMISSION TYPE
    295. SHAFT MARKET ANALYSIS BY MATERIAL
    296. SHAFT MARKET ANALYSIS BY SIZE
    297. MARKET ANALYSIS BY REGIONAL
    298. MARKET ANALYSIS BY VEHICLE TYPE
    299. SHAFT MARKET ANALYSIS BY TRANSMISSION TYPE
    300. COUNTER SHAFT MARKET ANALYSIS BY MATERIAL
    301. COUNTER SHAFT MARKET ANALYSIS BY SIZE
    302. SHAFT MARKET ANALYSIS BY REGIONAL
    303. SHAFT MARKET ANALYSIS
    304. BY VEHICLE TYPE
    305. BY TRANSMISSION TYPE
    306. BY MATERIAL
    307. SIZE
    308. TYPE
    309. MEXICO AUTOMOTIVE COUNTER SHAFT MARKET ANALYSIS BY REGIONAL
    310. ARGENTINA AUTOMOTIVE COUNTER SHAFT MARKET ANALYSIS BY VEHICLE TYPE
    311. ARGENTINA AUTOMOTIVE COUNTER SHAFT MARKET ANALYSIS BY TRANSMISSION TYPE
    312. ARGENTINA AUTOMOTIVE COUNTER SHAFT MARKET ANALYSIS BY REGIONAL
    313. REST OF SOUTH AMERICA AUTOMOTIVE COUNTER SHAFT MARKET ANALYSIS BY VEHICLE TYPE
    314. BY TRANSMISSION TYPE
    315. SHAFT MARKET ANALYSIS BY MATERIAL
    316. COUNTER SHAFT MARKET ANALYSIS BY SIZE
    317. COUNTER SHAFT MARKET ANALYSIS BY REGIONAL
    318. SHAFT MARKET ANALYSIS
    319. ANALYSIS BY VEHICLE TYPE
    320. MARKET ANALYSIS BY TRANSMISSION TYPE
    321. COUNTER SHAFT MARKET ANALYSIS BY MATERIAL
    322. COUNTER SHAFT MARKET ANALYSIS BY SIZE
    323. COUNTER SHAFT MARKET ANALYSIS BY REGIONAL
    324. COUNTER SHAFT MARKET ANALYSIS BY VEHICLE TYPE
    325. COUNTER SHAFT MARKET ANALYSIS BY TRANSMISSION TYPE
    326. AUTOMOTIVE COUNTER SHAFT MARKET ANALYSIS BY MATERIAL
    327. AUTOMOTIVE COUNTER SHAFT MARKET ANALYSIS BY SIZE
    328. AUTOMOTIVE COUNTER SHAFT MARKET ANALYSIS BY REGIONAL
    329. AUTOMOTIVE COUNTER SHAFT MARKET ANALYSIS BY VEHICLE TYPE
    330. OF MEA AUTOMOTIVE COUNTER SHAFT MARKET ANALYSIS BY TRANSMISSION TYPE
    331. REST OF MEA AUTOMOTIVE COUNTER SHAFT MARKET ANALYSIS BY MATERIAL
    332. REST OF MEA AUTOMOTIVE COUNTER SHAFT MARKET ANALYSIS BY SIZE
    333. REST OF MEA AUTOMOTIVE COUNTER SHAFT MARKET ANALYSIS BY REGIONAL
    334. KEY BUYING CRITERIA OF AUTOMOTIVE COUNTER SHAFT MARKET
    335. PROCESS OF MRFR
    336. RESTRAINTS IMPACT ANALYSIS: AUTOMOTIVE COUNTER SHAFT MARKET
    337. SUPPLY / VALUE CHAIN: AUTOMOTIVE COUNTER SHAFT MARKET
    338. COUNTER SHAFT MARKET, BY VEHICLE TYPE, 2024 (% SHARE)
    339. COUNTER SHAFT MARKET, BY VEHICLE TYPE, 2019 TO 2032 (USD Billions)
    340. AUTOMOTIVE COUNTER SHAFT MARKET, BY TRANSMISSION TYPE, 2024 (% SHARE)
    341. AUTOMOTIVE COUNTER SHAFT MARKET, BY TRANSMISSION TYPE, 2019 TO 2032 (USD Billions)
    342. AUTOMOTIVE COUNTER SHAFT MARKET, BY SIZE, 2019 TO 2032 (USD Billions)
    343. AUTOMOTIVE COUNTER SHAFT MARKET, BY REGIONAL, 2024 (% SHARE)
    344. AUTOMOTIVE COUNTER SHAFT MARKET, BY REGIONAL, 2019 TO 2032 (USD Billions)
    345. BENCHMARKING OF MAJOR COMPETITORS'

    Automotive Counter Shaft Market Segmentation

    Market Segmentation Overview

    • Detailed segmentation data will be available in the full report
    • Comprehensive analysis by multiple parameters
    • Regional and country-level breakdowns
    • Market size forecasts by segment
    Report Infographic
    Free Sample Request

    Kindly complete the form below to receive a free sample of this Report

    Customer Strories

    “I am very pleased with how market segments have been defined in a relevant way for my purposes (such as "Portable Freezers & refrigerators" and "last-mile"). In general the report is well structured. Thanks very much for your efforts.”

    Victoria Milne Founder
    Case Study

    Chemicals and Materials