• Cat-intel
  • MedIntelliX
  • Resources
  • About Us
  • Request Free Sample ×

    Kindly complete the form below to receive a free sample of this Report

    Leading companies partner with us for data-driven Insights

    clients tt-cursor

    Attack Simulation Proactive Market

    ID: MRFR/ICT/33500-HCR
    100 Pages
    Aarti Dhapte
    September 2025

    Attack Simulation Proactive Market Research Report: By Deployment Type (On-Premises, Cloud-Based, Hybrid), By Simulation Type (Penetration Testing, Phishing Simulation, Red Teaming), By End User (Government, BFSI, Healthcare, IT Telecom, Retail), By Organization Size (Small Enterprises, Medium Enterprises, Large Enterprises) and By Regional (North America, Europe, South America, Asia Pacific, Middle East and Africa) - Forecast to 2034

    Share:
    Download PDF ×

    We do not share your information with anyone. However, we may send you emails based on your report interest from time to time. You may contact us at any time to opt-out.

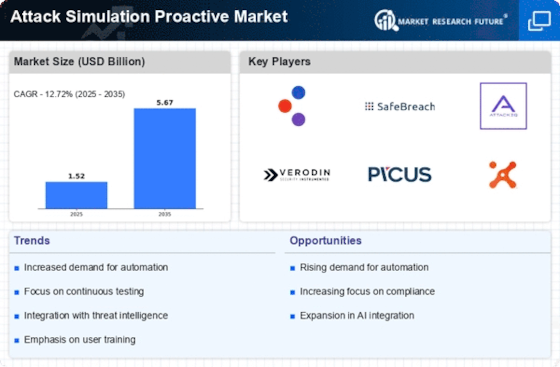
    Attack Simulation Proactive Market Research Report - Forecast To 2034 Infographic
    Purchase Options
    $ 4,950.0
    $ 5,950.0
    $ 7,250.0
    Table of Contents

    Attack Simulation Proactive Market Summary

    The Global Attack Simulation Proactive Market is projected to grow significantly from 1.51 USD Billion in 2024 to 5.94 USD Billion by 2035.

    Key Market Trends & Highlights

    Attack Simulation Proactive Key Trends and Highlights

    • The market is expected to experience a compound annual growth rate (CAGR) of 13.26% from 2025 to 2035.
    • By 2035, the market valuation is anticipated to reach 5.94 USD Billion, indicating robust growth potential.
    • In 2024, the market is valued at 1.51 USD Billion, reflecting the increasing demand for proactive security measures.
    • Growing adoption of attack simulation technologies due to the rising need for enhanced cybersecurity is a major market driver.

    Market Size & Forecast

    2024 Market Size 1.51 (USD Billion)
    2035 Market Size 5.94 (USD Billion)
    CAGR (2025-2035) 13.26%

    Major Players

    Fortinet, Rapid7, Check Point Software Technologies, FireEye, Trend Micro, IBM, McAfee, Palo Alto Networks, Darktrace, CrowdStrike, Sophos, Splunk, SentinelOne, AT and T Cybersecurity, Cisco

    Attack Simulation Proactive Market Trends

    The Attack Simulation Proactive Market is significantly driven by the growing need for cybersecurity solutions across various sectors. As organizations increasingly face sophisticated cyber threats, there is a rising demand for proactive measures to strengthen their security posture. This need stems from the increasing frequency and complexity of cyberattacks that can lead to severe financial and reputational damage. Companies are motivated to invest in attack simulation technologies to identify vulnerabilities before they can be exploited, enhancing their overall security strategies.

    The increasing sophistication of cyber threats necessitates a proactive approach to security, with attack simulation emerging as a critical tool for organizations to enhance their defensive capabilities.

    U.S. Department of Homeland Security

    Attack Simulation Proactive Market Drivers

    Increasing Cybersecurity Threats

    The Global Attack Simulation Proactive Market Industry is experiencing heightened demand due to the escalating frequency and sophistication of cyber threats. Organizations are increasingly recognizing the necessity of proactive measures to safeguard their digital assets. For instance, the global cost of cybercrime is projected to reach 10.5 trillion USD annually by 2025, underscoring the urgency for effective simulation tools. As a result, the market is expected to grow from 1.51 USD Billion in 2024 to 5.94 USD Billion by 2035, reflecting a compound annual growth rate of 13.26% from 2025 to 2035.

    Market Segment Insights

    Attack Simulation Proactive Market Deployment Type Insights

    The Attack Simulation Proactive Market is witnessing a significant evolution in its Deployment Type segment, reflecting a noteworthy shift in preferences among organizations aiming to enhance their cybersecurity posture. As of 2023, the market valuation for this segment reaches 1.19 USD Billion, with a projected growth trajectory that is expected to lead the market towards 3.5 USD Billion by 2032, highlighting a promising outlook. The Deployment Type is intricately divided into three primary categories: On-Premises, Cloud-Based, and Hybrid solutions.

    In 2023, the On-Premises segment holds a substantial market value of 0.48 USD Billion and is projected to grow to 1.5 USD Billion by 2032. Its importance lies in the higher control and security it offers to organizations, which often favor maintaining sensitive data within their own infrastructure. On the other hand, the Cloud-Based segment is equally significant, valued at 0.54 USD Billion in 2023 and expected to reach 1.6 USD Billion by 2032. This deployment type benefits from scalability, cost-effectiveness, and advanced features that many organizations find appealing as they increasingly adopt cloud technologies to streamline operations.

    Additionally, the Hybrid segment, while accounting for a smaller share of the market at 0.17 USD Billion in 2023 and anticipated to grow to 0.4 USD Billion in 2032, showcases the versatility that organizations require. Its growing adoption suggests a trend towards solutions that combine both cloud benefits and on-premises control, providing a balanced approach to cybersecurity challenges. The significant market valuations illustrate how each Deployment Type caters to diverse organizational needs, driven by the ongoing demand for robust cybersecurity strategies.

    Factors such as increasing cyber threats, regulatory compliance requirements, and the necessity for proactive security measures are propelling growth across these deployment categories. The preferability for On-Premises and Cloud-Based solutions indicates a relatively balanced interest, but Cloud-Based solutions dominate due to their ability to offer innovative features and flexibility. Overall, the Attack Simulation Proactive Market segmentation in Deployment Type underscores a critical aspect of how businesses are equipping themselves to counteract the evolving landscape of cyber threats effectively, with each category contributing uniquely to achieving proactive security postures.

    Attack Simulation Proactive Market type insights

    Source: Primary Research, Secondary Research, Market Research Future Database and Analyst Review

    Attack Simulation Proactive Market Simulation Type Insights

    The Attack Simulation Proactive Market, valued at 1.19 billion USD in 2023, is projected to witness significant growth by 2032. The market growth is bolstered by increasing cybersecurity threats and the need for organizations to test and enhance their security measures. Among the various simulation types, penetration testing remains a crucial component as it allows organizations to identify vulnerabilities by simulating real-world attacks, ultimately fortifying their defenses.

    Phishing simulation is also gaining traction, reflecting the rise in sophisticated phishing attacks that target sensitive data.It enables organizations to train employees to recognize and respond to phishing attempts, thereby reducing the risk of breaches. Additionally, red teaming is important, as it provides a holistic assessment of an organization's security posture by employing creative tactics that mimic adversary behaviors.

    The dynamics of the Attack Simulation Proactive Market segmentation highlight the necessity for comprehensive strategies to counter emerging threats and emphasize the opportunities present for service providers in enhancing IT security infrastructures.The Attack, Simulation Proactive Market statistics indicate a growing recognition of these simulation types, driving companies to invest in proactive measures against cyber threats.

    Attack Simulation Proactive Market End User Insights

    The Attack Simulation Proactive Market saw a valuation of 1.19 billion USD in 2023, reflecting the increasing need for advanced cyber defense strategies across various sectors. The market experiences significant demand from diverse end users such as Government, BFSI, Healthcare, IT Telecom, and Retail. The Government sector prioritizes security to protect sensitive data and maintain public safety, while BFSI plays a crucial role due to the financial implications of cyber threats, often dominating the market with its substantial investment in cybersecurity solutions.In Healthcare, the growing digitization of medical records necessitates robust security measures to safeguard patient information.

    The IT Telecom sector serves as a backbone for digital communication, making it essential to stay ahead of potential cyber risks. Retail, on the other hand, has increasingly become a target for cyber attacks, pushing companies to enhance their security infrastructures. Overall, these end users drive the Attack Simulation Proactive Market statistics, significantly impacting market growth trends.

    Attack Simulation Proactive Market Organization Size Insights

    The Attack Simulation Proactive Market is experiencing significant growth, particularly when examining the Organization Size segmentation. In 2023, this market is expected to achieve a valuation of 1.19 billion USD, reflecting the growing demand for advanced cybersecurity measures. Small Enterprises are gaining traction in this market due to their increasing awareness of cybersecurity risks, leading them to adopt proactive measures against potential threats.

    Regional Insights

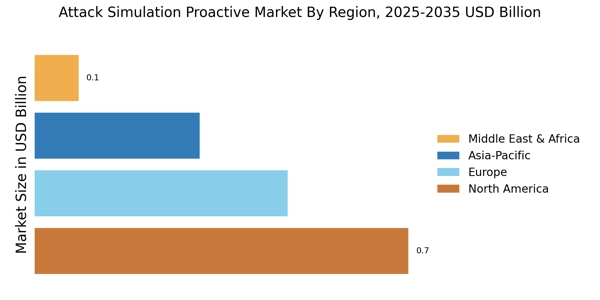
    The Attack Simulation Proactive Market is projected to reach a valuation of 1.19 USD Billion in 2023, with a significant growth trajectory. North America holds a majority holding in this market at 0.5 USD Billion and is expected to grow to 1.45 USD Billion by 2032, showcasing its dominance due to advanced technologies and high investment in cybersecurity. Europe follows with a notable share valued at 0.35 USD Billion in 2023 and is anticipated to rise to 1.0 USD Billion, reflecting the region's commitment to enhancing cyber resilience.

    The APAC market, though smaller at 0.25 USD Billion in 2023, is poised for growth, reaching 0.75 USD Billion, driven by increasing digitalization and cyber threats.South America and MEA represent the emerging markets in this sector, valued at 0.05 USD Billion and 0.04 USD Billion respectively in 2023, with both regions expected to grow to 0.15 USD Billion by 2032. This diversification demonstrates the growing awareness and necessity for proactive security measures across various regions as organizations aim to identify and mitigate potential vulnerabilities effectively.

    Attack Simulation Proactive Market regional insights

    Source: Primary Research, Secondary Research, Market Research Future Database and Analyst Review

    Key Players and Competitive Insights

    The Attack Simulation Proactive Market is rapidly evolving as organizations increasingly recognize the importance of cybersecurity and proactive threat management. With the rising sophistication of cyber-attacks, the demand for robust attack simulation solutions has surged, leading to a competitive landscape filled with innovative vendors. This market is characterized by continuous advancements in technology, strategic partnerships, and an emphasis on predictive analytics, enabling companies to simulate potential threats and enhance their security posture. As businesses strive to address vulnerabilities and prepare for potential breaches, they are turning to these solutions to improve their security frameworks and maintain compliance with regulatory standards.

    This has created a dynamic environment where companies are vying for market share by offering comprehensive and effective attack simulation capabilities.Fortinet stands out in the Attack Simulation Proactive Market primarily due to its strong technological foundations and comprehensive approach to cybersecurity. 

    The company leverages its extensive experience and expertise in network security to enhance its attack simulation offerings, ensuring they are in sync with the latest threat landscape. Fortinet’s integrated security platform facilitates seamless execution and assessment of simulated attacks, enabling organizations to identify weaknesses in their defenses efficiently. Additionally, the company's commitment to providing actionable insights and real-time analytics further strengthens its market position.

    This dedication to continual innovation and user-centric solutions fosters a resilient cybersecurity environment, making Fortinet an attractive option for enterprises looking to bolster their proactive security measures.Rapid7 is also a significant player in the Attack Simulation Proactive Market, recognized for its forward-thinking approach and an array of integrated solutions. 

    Rapid7 offers a suite of products that empower organizations to conduct realistic attack simulations while prioritizing user experience and ease of use. The company’s focus on collaboration and community-driven intelligence allows clients to benefit from shared insights and emerging trends in the threat landscape, which enhances the efficacy of its simulation tools. Moreover, Rapid7 invests heavily in research and development to stay ahead of the curve in cybersecurity trends and effectively cater to its clients' evolving needs.

    By providing comprehensive visibility into potential vulnerabilities and offering tailored recommendations, Rapid7 contributes positively to organizations’ proactive security strategies, making its solutions highly valued in the market.

    Key Companies in the Attack Simulation Proactive Market market include

    Industry Developments

    Future Outlook

    Attack Simulation Proactive Market Future Outlook

    The Attack Simulation Proactive Market is poised for growth at 13.26% CAGR from 2024 to 2035, driven by increasing cyber threats and demand for advanced security solutions.

    New opportunities lie in:

    • Develop AI-driven simulation tools for real-time threat analysis.
    • Expand services to include regulatory compliance training for enterprises.
    • Create partnerships with cloud service providers for integrated security solutions.

    By 2035, the market is expected to achieve substantial growth, solidifying its role in cybersecurity.

    Market Segmentation

    Attack Simulation Proactive Market End User Outlook

    • Small Enterprises
    • Medium Enterprises
    • Large Enterprises

    Attack Simulation Proactive Market Regional Outlook

    • North America
    • Europe
    • South America
    • Asia Pacific
    • Middle East and Africa

    Attack Simulation Proactive Market Deployment Type Outlook

    • Penetration Testing
    • Phishing Simulation
    • Red Teaming

    Attack Simulation Proactive Market Simulation Type Outlook

    • Attack Simulation Proactive Market Government
    • BFSI
    • Healthcare
    • IT Telecom
    • Retail

    Attack Simulation Proactive Market Organization Size Outlook

    • North America
    • Europe
    • South America
    • Asia Pacific
    • Middle East and Africa

    Report Scope

    Attack Simulation Proactive Market Report Scope
    Report Attribute/Metric Details
    Market Size 2024 1.51 (USD Billion)
    Market Size 2025 1.71 (USD Billion)
    Market Size 2034 5.27 (USD Billion)
    Compound Annual Growth Rate (CAGR) 12.72% (2025 - 2034)
    Report Coverage Revenue Forecast, Competitive Landscape, Growth Factors, and Trends
    Base Year 2024
    Market Forecast Period 2025 - 2034
    Historical Data 2019 - 2023
    Market Forecast Units USD Billion
    Key Companies Profiled Fortinet, Rapid7, Check Point Software Technologies, FireEye, Trend Micro, IBM, McAfee, Palo Alto Networks, Darktrace, CrowdStrike, Sophos, Splunk, SentinelOne, AT and T Cybersecurity, Cisco
    Segments Covered Deployment Type, Simulation Type, End User, Organization Size, Regional
    Key Market Opportunities Increased cybersecurity awareness, Growing regulatory compliance demands, Rising sophistication of cyber threats, Expansion of cloud-based solutions, and Demand for employee training tools.
    Key Market Dynamics Growing cybersecurity threats, Increasing regulatory compliance, Rising demand for proactive defense, Advancements in AI technology, Enhanced training for security teams
    Countries Covered North America, Europe, APAC, South America, MEA

    Market Highlights

    Author
    Aarti Dhapte
    Team Lead - Research

    She holds an experience of about 6+ years in Market Research and Business Consulting, working under the spectrum of Information Communication Technology, Telecommunications and Semiconductor domains. Aarti conceptualizes and implements a scalable business strategy and provides strategic leadership to the clients. Her expertise lies in market estimation, competitive intelligence, pipeline analysis, customer assessment, etc.

    Leave a Comment

    FAQs

    What is the projected market size of the Global Attack Simulation Proactive Market by 2032?

    The Global Attack Simulation Proactive Market is expected to be valued at 5.27 billion USD by 2034

    What is the expected compound annual growth rate (CAGR) for the Global Attack Simulation Proactive Market from 2024 to 2032?

    The expected CAGR for the Global Attack Simulation Proactive Market is 12.7% from 2025 to 2034

    Which region is projected to have the largest market size in 2032 for the Global Attack Simulation Proactive Market?

    North America is projected to have the largest market size of 1.45 billion USD in 2032.

    What is the anticipated market value for the Cloud-Based deployment type in the Global Attack Simulation Proactive Market by 2032?

    The Cloud-Based deployment type is anticipated to be valued at 1.6 billion USD by 2032.

    Who are the major players in the Global Attack Simulation Proactive Market?

    Major players in the market include Fortinet, IBM, FireEye, and Palo Alto Networks, among others.

    What is the projected market size for the On-Premises segment by 2032?

    The On-Premises segment is projected to reach a market size of 1.5 billion USD by 2032.

    How is the market for Attack Simulation Proactive expected to grow in the APAC region by 2032?

    The APAC region is expected to grow to a market size of 0.75 billion USD by 2032.

    What is the expected market size for the Hybrid deployment type by 2032?

    The Hybrid deployment type is expected to achieve a market size of 0.4 billion USD by 2032.

    What are the growth drivers for the Global Attack Simulation Proactive Market?

    The growth drivers include increasing cybersecurity threats and the need for proactive security measures.

    What challenges does the Global Attack Simulation Proactive Market face moving forward?

    The Global Attack Simulation Proactive Market faces challenges such as the evolving nature of cyber threats and compliance issues.

    1. 'Table of Contents
    2. EXECUTIVE SUMMARY
    3. Market Overview
      1. Key Findings
      2. Market Segmentation
    4. Competitive Landscape
      1. Challenges and Opportunities
      2. Future Outlook
    5. MARKET INTRODUCTION
      1. Definition
      2. Scope of the study
        1. Research Objective
        2. Assumption
        3. Limitations
    6. RESEARCH METHODOLOGY
      1. Overview
    7. Data Mining
      1. Secondary Research
      2. Primary Research
    8. Primary Interviews and Information Gathering Process
      1. Breakdown of Primary
    9. Respondents
      1. Forecasting Model
      2. Market Size Estimation
    10. Bottom-Up Approach
      1. Top-Down Approach
      2. Data Triangulation
      3. Validation
    11. MARKET DYNAMICS
      1. Overview
      2. Drivers
      3. Restraints
      4. Opportunities
    12. MARKET FACTOR ANALYSIS
      1. Value chain Analysis
      2. Porter''s Five Forces
    13. Analysis
      1. Bargaining Power of Suppliers
        1. Bargaining Power
    14. of Buyers
      1. Threat of New Entrants
        1. Threat of Substitutes
        2. Intensity of Rivalry
      2. COVID-19 Impact Analysis
    15. Market Impact Analysis
      1. Regional Impact
        1. Opportunity and
    16. Threat Analysis
    17. Attack Simulation Proactive Market, BY
    18. Deployment Type (USD Billion)
      1. On-Premises
      2. Cloud-Based
      3. Hybrid
    19. Attack Simulation Proactive Market, BY Simulation Type (USD
    20. Billion)
      1. Penetration Testing
      2. Phishing Simulation
    21. Red Teaming
    22. Attack Simulation Proactive Market, BY End User (USD Billion)
      1. Government
      2. BFSI
      3. Healthcare
      4. IT Telecom
      5. Retail
    23. Attack Simulation Proactive Market, BY Organization Size
    24. (USD Billion)
      1. Small Enterprises
      2. Medium Enterprises
    25. Large Enterprises
    26. Attack Simulation Proactive Market, BY Regional (USD
    27. Billion)
      1. North America
        1. US
        2. Canada
    28. Europe
      1. Germany
        1. UK
        2. France
    29. Russia
      1. Italy
        1. Spain
        2. Rest of Europe
      2. APAC
        1. China
        2. India
        3. Japan
    30. South Korea
      1. Malaysia
        1. Thailand
        2. Indonesia
        3. Rest of APAC
      2. South America
        1. Brazil
    31. Mexico
      1. Argentina
        1. Rest of South America
      2. MEA
        1. GCC Countries
        2. South Africa
        3. Rest of MEA
    32. Competitive Landscape
      1. Overview
    33. Competitive Analysis
      1. Market share Analysis
      2. Major Growth
    34. Strategy in the Attack Simulation Proactive Market
      1. Competitive Benchmarking
      2. Leading Players in Terms of Number of Developments in the Attack Simulation
    35. Proactive Market
      1. Key developments and growth strategies
    36. New Product Launch/Service Deployment
      1. Merger Acquisitions
    37. Joint Ventures
      1. Major Players Financial Matrix
        1. Sales and
    38. Operating Income
      1. Major Players RD Expenditure. 2023
    39. Company
    40. Profiles
      1. Fortinet
        1. Financial Overview
        2. Products
    41. Offered
      1. Key Developments
        1. SWOT Analysis
    42. Key Strategies
      1. Rapid7
        1. Financial Overview
    43. Products Offered
      1. Key Developments
        1. SWOT Analysis
        2. Key Strategies
      2. Check Point Software Technologies
    44. Financial Overview
      1. Products Offered
        1. Key Developments
        2. SWOT Analysis
        3. Key Strategies
      2. FireEye
        1. Financial Overview
        2. Products Offered
        3. Key Developments
        4. SWOT Analysis
        5. Key Strategies
      3. Trend Micro
        1. Financial Overview
        2. Products Offered
        3. Key
    45. Developments
      1. SWOT Analysis
        1. Key Strategies
    46. IBM
      1. Financial Overview
        1. Products Offered
    47. Key Developments
      1. SWOT Analysis
        1. Key Strategies
    48. McAfee
      1. Financial Overview
        1. Products Offered
    49. Key Developments
      1. SWOT Analysis
        1. Key Strategies
    50. Palo Alto Networks
      1. Financial Overview
        1. Products Offered
        2. Key Developments
        3. SWOT Analysis
        4. Key Strategies
      2. Darktrace
        1. Financial Overview
        2. Products Offered
        3. Key Developments
        4. SWOT Analysis
        5. Key Strategies
      3. CrowdStrike
        1. Financial Overview
        2. Products
    51. Offered
      1. Key Developments
        1. SWOT Analysis
    52. Key Strategies
      1. Sophos
        1. Financial Overview
    53. Products Offered
      1. Key Developments
        1. SWOT Analysis
        2. Key Strategies
      2. Splunk
        1. Financial Overview
        2. Products Offered
        3. Key Developments
        4. SWOT
    54. Analysis
      1. Key Strategies
      2. SentinelOne
        1. Financial
    55. Overview
      1. Products Offered
        1. Key Developments
    56. SWOT Analysis
      1. Key Strategies
      2. AT and T Cybersecurity
        1. Financial Overview
        2. Products Offered
    57. Key Developments
      1. SWOT Analysis
        1. Key Strategies
      2. Cisco
        1. Financial Overview
        2. Products Offered
        3. Key Developments
        4. SWOT Analysis
        5. Key
    58. Strategies
    59. Appendix
      1. References
      2. Related Reports
    60. America Attack Simulation Proactive Market SIZE ESTIMATES & FORECAST, BY DEPLOYMENT
    61. TYPE, 2019-2032 (USD Billions)
    62. Market SIZE ESTIMATES & FORECAST, BY SIMULATION TYPE, 2019-2032 (USD Billions)
    63. FORECAST, BY END USER, 2019-2032 (USD Billions)
    64. Simulation Proactive Market SIZE ESTIMATES & FORECAST, BY ORGANIZATION SIZE,
    65. 2032 (USD Billions)
    66. Market SIZE ESTIMATES & FORECAST, BY REGIONAL, 2019-2032 (USD Billions)
    67. BY DEPLOYMENT TYPE, 2019-2032 (USD Billions)
    68. Proactive Market SIZE ESTIMATES & FORECAST, BY SIMULATION TYPE, 2019-2032 (USD
    69. Billions)
    70. FORECAST, BY END USER, 2019-2032 (USD Billions)
    71. Proactive Market SIZE ESTIMATES & FORECAST, BY ORGANIZATION SIZE, 2019-2032
    72. (USD Billions)
    73. & FORECAST, BY REGIONAL, 2019-2032 (USD Billions)
    74. Simulation Proactive Market SIZE ESTIMATES & FORECAST, BY DEPLOYMENT TYPE, 2019-2032
    75. (USD Billions)
    76. & FORECAST, BY SIMULATION TYPE, 2019-2032 (USD Billions)
    77. Attack Simulation Proactive Market SIZE ESTIMATES & FORECAST, BY END USER, 2019-2032
    78. (USD Billions)
    79. & FORECAST, BY ORGANIZATION SIZE, 2019-2032 (USD Billions)
    80. Attack Simulation Proactive Market SIZE ESTIMATES & FORECAST, BY REGIONAL, 2019-2032
    81. (USD Billions)
    82. & FORECAST, BY DEPLOYMENT TYPE, 2019-2032 (USD Billions)
    83. Attack Simulation Proactive Market SIZE ESTIMATES & FORECAST, BY SIMULATION
    84. TYPE, 2019-2032 (USD Billions)
    85. Market SIZE ESTIMATES & FORECAST, BY END USER, 2019-2032 (USD Billions)
    86. BY ORGANIZATION SIZE, 2019-2032 (USD Billions)
    87. Proactive Market SIZE ESTIMATES & FORECAST, BY REGIONAL, 2019-2032 (USD Billions)
    88. FORECAST, BY DEPLOYMENT TYPE, 2019-2032 (USD Billions)
    89. Simulation Proactive Market SIZE ESTIMATES & FORECAST, BY SIMULATION TYPE, 2019-2032
    90. (USD Billions)
    91. & FORECAST, BY END USER, 2019-2032 (USD Billions)
    92. Simulation Proactive Market SIZE ESTIMATES & FORECAST, BY ORGANIZATION SIZE,
    93. 2032 (USD Billions)
    94. SIZE ESTIMATES & FORECAST, BY REGIONAL, 2019-2032 (USD Billions)
    95. UK Attack Simulation Proactive Market SIZE ESTIMATES & FORECAST, BY DEPLOYMENT
    96. TYPE, 2019-2032 (USD Billions)
    97. SIZE ESTIMATES & FORECAST, BY SIMULATION TYPE, 2019-2032 (USD Billions)
    98. BY END USER, 2019-2032 (USD Billions)
    99. Market SIZE ESTIMATES & FORECAST, BY ORGANIZATION SIZE, 2019-2032 (USD Billions)
    100. BY REGIONAL, 2019-2032 (USD Billions)
    101. Market SIZE ESTIMATES & FORECAST, BY DEPLOYMENT TYPE, 2019-2032 (USD Billions)
    102. BY SIMULATION TYPE, 2019-2032 (USD Billions)
    103. Proactive Market SIZE ESTIMATES & FORECAST, BY END USER, 2019-2032 (USD Billions)
    104. BY ORGANIZATION SIZE, 2019-2032 (USD Billions)
    105. Proactive Market SIZE ESTIMATES & FORECAST, BY REGIONAL, 2019-2032 (USD Billions)
    106. BY DEPLOYMENT TYPE, 2019-2032 (USD Billions)
    107. Proactive Market SIZE ESTIMATES & FORECAST, BY SIMULATION TYPE, 2019-2032 (USD
    108. Billions)
    109. & FORECAST, BY END USER, 2019-2032 (USD Billions)
    110. Simulation Proactive Market SIZE ESTIMATES & FORECAST, BY ORGANIZATION SIZE,
    111. 2032 (USD Billions)
    112. SIZE ESTIMATES & FORECAST, BY REGIONAL, 2019-2032 (USD Billions)
    113. Italy Attack Simulation Proactive Market SIZE ESTIMATES & FORECAST, BY DEPLOYMENT
    114. TYPE, 2019-2032 (USD Billions)
    115. Market SIZE ESTIMATES & FORECAST, BY SIMULATION TYPE, 2019-2032 (USD Billions)
    116. BY END USER, 2019-2032 (USD Billions)
    117. Market SIZE ESTIMATES & FORECAST, BY ORGANIZATION SIZE, 2019-2032 (USD Billions)
    118. BY REGIONAL, 2019-2032 (USD Billions)
    119. Market SIZE ESTIMATES & FORECAST, BY DEPLOYMENT TYPE, 2019-2032 (USD Billions)
    120. BY SIMULATION TYPE, 2019-2032 (USD Billions)
    121. Proactive Market SIZE ESTIMATES & FORECAST, BY END USER, 2019-2032 (USD Billions)
    122. BY ORGANIZATION SIZE, 2019-2032 (USD Billions)
    123. Proactive Market SIZE ESTIMATES & FORECAST, BY REGIONAL, 2019-2032 (USD Billions)
    124. & FORECAST, BY DEPLOYMENT TYPE, 2019-2032 (USD Billions)
    125. of Europe Attack Simulation Proactive Market SIZE ESTIMATES & FORECAST, BY SIMULATION
    126. TYPE, 2019-2032 (USD Billions)
    127. Proactive Market SIZE ESTIMATES & FORECAST, BY END USER, 2019-2032 (USD Billions)
    128. & FORECAST, BY ORGANIZATION SIZE, 2019-2032 (USD Billions)
    129. of Europe Attack Simulation Proactive Market SIZE ESTIMATES & FORECAST, BY REGIONAL,
    130. 2032 (USD Billions)
    131. SIZE ESTIMATES & FORECAST, BY DEPLOYMENT TYPE, 2019-2032 (USD Billions)
    132. BY SIMULATION TYPE, 2019-2032 (USD Billions)
    133. Proactive Market SIZE ESTIMATES & FORECAST, BY END USER, 2019-2032 (USD Billions)
    134. BY ORGANIZATION SIZE, 2019-2032 (USD Billions)
    135. Proactive Market SIZE ESTIMATES & FORECAST, BY REGIONAL, 2019-2032 (USD Billions)
    136. BY DEPLOYMENT TYPE, 2019-2032 (USD Billions)
    137. Proactive Market SIZE ESTIMATES & FORECAST, BY SIMULATION TYPE, 2019-2032 (USD
    138. Billions)
    139. & FORECAST, BY END USER, 2019-2032 (USD Billions)
    140. Simulation Proactive Market SIZE ESTIMATES & FORECAST, BY ORGANIZATION SIZE,
    141. 2032 (USD Billions)
    142. SIZE ESTIMATES & FORECAST, BY REGIONAL, 2019-2032 (USD Billions)
    143. India Attack Simulation Proactive Market SIZE ESTIMATES & FORECAST, BY DEPLOYMENT
    144. TYPE, 2019-2032 (USD Billions)
    145. Market SIZE ESTIMATES & FORECAST, BY SIMULATION TYPE, 2019-2032 (USD Billions)
    146. BY END USER, 2019-2032 (USD Billions)
    147. Market SIZE ESTIMATES & FORECAST, BY ORGANIZATION SIZE, 2019-2032 (USD Billions)
    148. BY REGIONAL, 2019-2032 (USD Billions)
    149. Market SIZE ESTIMATES & FORECAST, BY DEPLOYMENT TYPE, 2019-2032 (USD Billions)
    150. BY SIMULATION TYPE, 2019-2032 (USD Billions)
    151. Proactive Market SIZE ESTIMATES & FORECAST, BY END USER, 2019-2032 (USD Billions)
    152. BY ORGANIZATION SIZE, 2019-2032 (USD Billions)
    153. Proactive Market SIZE ESTIMATES & FORECAST, BY REGIONAL, 2019-2032 (USD Billions)
    154. FORECAST, BY DEPLOYMENT TYPE, 2019-2032 (USD Billions)
    155. Attack Simulation Proactive Market SIZE ESTIMATES & FORECAST, BY SIMULATION
    156. TYPE, 2019-2032 (USD Billions)
    157. Market SIZE ESTIMATES & FORECAST, BY END USER, 2019-2032 (USD Billions)
    158. FORECAST, BY ORGANIZATION SIZE, 2019-2032 (USD Billions)
    159. Attack Simulation Proactive Market SIZE ESTIMATES & FORECAST, BY REGIONAL, 2019-2032
    160. (USD Billions)
    161. ESTIMATES & FORECAST, BY DEPLOYMENT TYPE, 2019-2032 (USD Billions)
    162. Malaysia Attack Simulation Proactive Market SIZE ESTIMATES & FORECAST, BY
    163. SIMULATION TYPE, 2019-2032 (USD Billions)
    164. Proactive Market SIZE ESTIMATES & FORECAST, BY END USER, 2019-2032 (USD Billions)
    165. FORECAST, BY ORGANIZATION SIZE, 2019-2032 (USD Billions)
    166. Attack Simulation Proactive Market SIZE ESTIMATES & FORECAST, BY REGIONAL, 2019-2032
    167. (USD Billions)
    168. ESTIMATES & FORECAST, BY DEPLOYMENT TYPE, 2019-2032 (USD Billions)
    169. Thailand Attack Simulation Proactive Market SIZE ESTIMATES & FORECAST, BY
    170. SIMULATION TYPE, 2019-2032 (USD Billions)
    171. Proactive Market SIZE ESTIMATES & FORECAST, BY END USER, 2019-2032 (USD Billions)
    172. FORECAST, BY ORGANIZATION SIZE, 2019-2032 (USD Billions)
    173. Attack Simulation Proactive Market SIZE ESTIMATES & FORECAST, BY REGIONAL, 2019-2032
    174. (USD Billions)
    175. ESTIMATES & FORECAST, BY DEPLOYMENT TYPE, 2019-2032 (USD Billions)
    176. Indonesia Attack Simulation Proactive Market SIZE ESTIMATES & FORECAST,
    177. BY SIMULATION TYPE, 2019-2032 (USD Billions)
    178. Proactive Market SIZE ESTIMATES & FORECAST, BY END USER, 2019-2032 (USD Billions)
    179. FORECAST, BY ORGANIZATION SIZE, 2019-2032 (USD Billions)
    180. Attack Simulation Proactive Market SIZE ESTIMATES & FORECAST, BY REGIONAL, 2019-2032
    181. (USD Billions)
    182. ESTIMATES & FORECAST, BY DEPLOYMENT TYPE, 2019-2032 (USD Billions)
    183. Rest of APAC Attack Simulation Proactive Market SIZE ESTIMATES & FORECAST,
    184. BY SIMULATION TYPE, 2019-2032 (USD Billions)
    185. Simulation Proactive Market SIZE ESTIMATES & FORECAST, BY END USER, 2019-2032
    186. (USD Billions)
    187. SIZE ESTIMATES & FORECAST, BY ORGANIZATION SIZE, 2019-2032 (USD Billions)
    188. FORECAST, BY REGIONAL, 2019-2032 (USD Billions)
    189. Simulation Proactive Market SIZE ESTIMATES & FORECAST, BY DEPLOYMENT TYPE, 2019-2032
    190. (USD Billions)
    191. SIZE ESTIMATES & FORECAST, BY SIMULATION TYPE, 2019-2032 (USD Billions)
    192. FORECAST, BY END USER, 2019-2032 (USD Billions)
    193. Simulation Proactive Market SIZE ESTIMATES & FORECAST, BY ORGANIZATION SIZE,
    194. 2032 (USD Billions)
    195. Market SIZE ESTIMATES & FORECAST, BY REGIONAL, 2019-2032 (USD Billions)
    196. BY DEPLOYMENT TYPE, 2019-2032 (USD Billions)
    197. Proactive Market SIZE ESTIMATES & FORECAST, BY SIMULATION TYPE, 2019-2032 (USD
    198. Billions)
    199. & FORECAST, BY END USER, 2019-2032 (USD Billions)
    200. Simulation Proactive Market SIZE ESTIMATES & FORECAST, BY ORGANIZATION SIZE,
    201. 2032 (USD Billions)
    202. SIZE ESTIMATES & FORECAST, BY REGIONAL, 2019-2032 (USD Billions)
    203. Mexico Attack Simulation Proactive Market SIZE ESTIMATES & FORECAST, BY
    204. DEPLOYMENT TYPE, 2019-2032 (USD Billions)
    205. Proactive Market SIZE ESTIMATES & FORECAST, BY SIMULATION TYPE, 2019-2032 (USD
    206. Billions)
    207. & FORECAST, BY END USER, 2019-2032 (USD Billions)
    208. Simulation Proactive Market SIZE ESTIMATES & FORECAST, BY ORGANIZATION SIZE,
    209. 2032 (USD Billions)
    210. SIZE ESTIMATES & FORECAST, BY REGIONAL, 2019-2032 (USD Billions)
    211. Argentina Attack Simulation Proactive Market SIZE ESTIMATES & FORECAST,
    212. BY DEPLOYMENT TYPE, 2019-2032 (USD Billions)
    213. Proactive Market SIZE ESTIMATES & FORECAST, BY SIMULATION TYPE, 2019-2032 (USD
    214. Billions)
    215. & FORECAST, BY END USER, 2019-2032 (USD Billions)
    216. Attack Simulation Proactive Market SIZE ESTIMATES & FORECAST, BY ORGANIZATION
    217. SIZE, 2019-2032 (USD Billions)
    218. Market SIZE ESTIMATES & FORECAST, BY REGIONAL, 2019-2032 (USD Billions)
    219. & FORECAST, BY DEPLOYMENT TYPE, 2019-2032 (USD Billions)
    220. of South America Attack Simulation Proactive Market SIZE ESTIMATES & FORECAST,
    221. BY SIMULATION TYPE, 2019-2032 (USD Billions)
    222. Attack Simulation Proactive Market SIZE ESTIMATES & FORECAST, BY END USER, 2019-2032
    223. (USD Billions)
    224. Market SIZE ESTIMATES & FORECAST, BY ORGANIZATION SIZE, 2019-2032 (USD Billions)
    225. & FORECAST, BY REGIONAL, 2019-2032 (USD Billions)
    226. Simulation Proactive Market SIZE ESTIMATES & FORECAST, BY DEPLOYMENT TYPE, 2019-2032
    227. (USD Billions)
    228. & FORECAST, BY SIMULATION TYPE, 2019-2032 (USD Billions)
    229. Attack Simulation Proactive Market SIZE ESTIMATES & FORECAST, BY END USER, 2019-2032
    230. (USD Billions)
    231. & FORECAST, BY ORGANIZATION SIZE, 2019-2032 (USD Billions)
    232. MEA Attack Simulation Proactive Market SIZE ESTIMATES & FORECAST, BY REGIONAL,
    233. 2032 (USD Billions)
    234. Market SIZE ESTIMATES & FORECAST, BY DEPLOYMENT TYPE, 2019-2032 (USD Billions)
    235. & FORECAST, BY SIMULATION TYPE, 2019-2032 (USD Billions)
    236. Countries Attack Simulation Proactive Market SIZE ESTIMATES & FORECAST, BY END
    237. USER, 2019-2032 (USD Billions)
    238. Proactive Market SIZE ESTIMATES & FORECAST, BY ORGANIZATION SIZE, 2019-2032
    239. (USD Billions)
    240. SIZE ESTIMATES & FORECAST, BY REGIONAL, 2019-2032 (USD Billions)
    241. South Africa Attack Simulation Proactive Market SIZE ESTIMATES & FORECAST,
    242. BY DEPLOYMENT TYPE, 2019-2032 (USD Billions)
    243. Simulation Proactive Market SIZE ESTIMATES & FORECAST, BY SIMULATION TYPE, 2019-2032
    244. (USD Billions)
    245. SIZE ESTIMATES & FORECAST, BY END USER, 2019-2032 (USD Billions)
    246. South Africa Attack Simulation Proactive Market SIZE ESTIMATES & FORECAST,
    247. BY ORGANIZATION SIZE, 2019-2032 (USD Billions)
    248. Simulation Proactive Market SIZE ESTIMATES & FORECAST, BY REGIONAL, 2019-2032
    249. (USD Billions)
    250. ESTIMATES & FORECAST, BY DEPLOYMENT TYPE, 2019-2032 (USD Billions)
    251. Rest of MEA Attack Simulation Proactive Market SIZE ESTIMATES & FORECAST,
    252. BY SIMULATION TYPE, 2019-2032 (USD Billions)
    253. Simulation Proactive Market SIZE ESTIMATES & FORECAST, BY END USER, 2019-2032
    254. (USD Billions)
    255. ESTIMATES & FORECAST, BY ORGANIZATION SIZE, 2019-2032 (USD Billions)
    256. Rest of MEA Attack Simulation Proactive Market SIZE ESTIMATES & FORECAST,
    257. BY REGIONAL, 2019-2032 (USD Billions)
    258. MARKET ANALYSIS
    259. DEPLOYMENT TYPE
    260. SIMULATION TYPE
    261. END USER
    262. SIZE
    263. TYPE
    264. TYPE
    265. USER
    266. SIZE
    267. GERMANY ATTACK SIMULATION PROACTIVE MARKET ANALYSIS BY DEPLOYMENT TYPE
    268. GERMANY ATTACK SIMULATION PROACTIVE MARKET ANALYSIS BY SIMULATION TYPE
    269. GERMANY ATTACK SIMULATION PROACTIVE MARKET ANALYSIS BY END USER
    270. GERMANY ATTACK SIMULATION PROACTIVE MARKET ANALYSIS BY ORGANIZATION SIZE
    271. UK ATTACK SIMULATION PROACTIVE MARKET ANALYSIS BY ORGANIZATION SIZE
    272. UK ATTACK SIMULATION PROACTIVE MARKET ANALYSIS BY REGIONAL
    273. FRANCE ATTACK SIMULATION PROACTIVE MARKET ANALYSIS BY DEPLOYMENT TYPE
    274. FRANCE ATTACK SIMULATION PROACTIVE MARKET ANALYSIS BY SIMULATION TYPE
    275. FRANCE ATTACK SIMULATION PROACTIVE MARKET ANALYSIS BY END USER
    276. FRANCE ATTACK SIMULATION PROACTIVE MARKET ANALYSIS BY ORGANIZATION SIZE
    277. TYPE
    278. USER
    279. SIZE
    280. TYPE
    281. TYPE
    282. SIZE
    283. TYPE
    284. TYPE
    285. SIZE
    286. TYPE
    287. BY SIMULATION TYPE
    288. ANALYSIS BY END USER
    289. MARKET ANALYSIS BY ORGANIZATION SIZE
    290. PROACTIVE MARKET ANALYSIS BY REGIONAL
    291. MARKET ANALYSIS
    292. BY DEPLOYMENT TYPE
    293. BY SIMULATION TYPE
    294. BY END USER
    295. ORGANIZATION SIZE
    296. BY REGIONAL
    297. DEPLOYMENT TYPE
    298. BY SIMULATION TYPE
    299. BY END USER
    300. ORGANIZATION SIZE
    301. BY REGIONAL
    302. DEPLOYMENT TYPE
    303. BY SIMULATION TYPE
    304. BY END USER
    305. ORGANIZATION SIZE
    306. BY REGIONAL
    307. BY DEPLOYMENT TYPE
    308. ANALYSIS BY SIMULATION TYPE
    309. MARKET ANALYSIS BY END USER
    310. MARKET ANALYSIS BY ORGANIZATION SIZE
    311. PROACTIVE MARKET ANALYSIS BY REGIONAL
    312. PROACTIVE MARKET ANALYSIS BY DEPLOYMENT TYPE
    313. PROACTIVE MARKET ANALYSIS BY SIMULATION TYPE
    314. PROACTIVE MARKET ANALYSIS BY END USER
    315. PROACTIVE MARKET ANALYSIS BY ORGANIZATION SIZE
    316. SIMULATION PROACTIVE MARKET ANALYSIS BY REGIONAL
    317. SIMULATION PROACTIVE MARKET ANALYSIS BY DEPLOYMENT TYPE
    318. ATTACK SIMULATION PROACTIVE MARKET ANALYSIS BY SIMULATION TYPE
    319. THAILAND ATTACK SIMULATION PROACTIVE MARKET ANALYSIS BY END USER
    320. THAILAND ATTACK SIMULATION PROACTIVE MARKET ANALYSIS BY ORGANIZATION SIZE
    321. THAILAND ATTACK SIMULATION PROACTIVE MARKET ANALYSIS BY REGIONAL
    322. INDONESIA ATTACK SIMULATION PROACTIVE MARKET ANALYSIS BY DEPLOYMENT TYPE
    323. TYPE
    324. USER
    325. SIZE
    326. TYPE
    327. SIMULATION TYPE
    328. ANALYSIS BY END USER
    329. ANALYSIS BY ORGANIZATION SIZE
    330. MARKET ANALYSIS BY REGIONAL
    331. MARKET ANALYSIS
    332. BY DEPLOYMENT TYPE
    333. BY SIMULATION TYPE
    334. BY END USER
    335. BY ORGANIZATION SIZE
    336. ANALYSIS BY REGIONAL
    337. ANALYSIS BY DEPLOYMENT TYPE
    338. MARKET ANALYSIS BY SIMULATION TYPE
    339. MARKET ANALYSIS BY END USER
    340. MARKET ANALYSIS BY ORGANIZATION SIZE
    341. PROACTIVE MARKET ANALYSIS BY REGIONAL
    342. PROACTIVE MARKET ANALYSIS BY DEPLOYMENT TYPE
    343. SIMULATION PROACTIVE MARKET ANALYSIS BY SIMULATION TYPE
    344. ATTACK SIMULATION PROACTIVE MARKET ANALYSIS BY END USER
    345. ATTACK SIMULATION PROACTIVE MARKET ANALYSIS BY ORGANIZATION SIZE
    346. ARGENTINA ATTACK SIMULATION PROACTIVE MARKET ANALYSIS BY REGIONAL
    347. REST OF SOUTH AMERICA ATTACK SIMULATION PROACTIVE MARKET ANALYSIS BY DEPLOYMENT
    348. TYPE
    349. ANALYSIS BY SIMULATION TYPE
    350. PROACTIVE MARKET ANALYSIS BY END USER
    351. SIMULATION PROACTIVE MARKET ANALYSIS BY ORGANIZATION SIZE
    352. OF SOUTH AMERICA ATTACK SIMULATION PROACTIVE MARKET ANALYSIS BY REGIONAL
    353. MEA ATTACK SIMULATION PROACTIVE MARKET ANALYSIS
    354. ATTACK SIMULATION PROACTIVE MARKET ANALYSIS BY DEPLOYMENT TYPE
    355. GCC COUNTRIES ATTACK SIMULATION PROACTIVE MARKET ANALYSIS BY SIMULATION TYPE
    356. SIZE
    357. BY REGIONAL
    358. BY DEPLOYMENT TYPE
    359. ANALYSIS BY SIMULATION TYPE
    360. MARKET ANALYSIS BY END USER
    361. MARKET ANALYSIS BY ORGANIZATION SIZE
    362. PROACTIVE MARKET ANALYSIS BY REGIONAL
    363. PROACTIVE MARKET ANALYSIS BY DEPLOYMENT TYPE
    364. SIMULATION PROACTIVE MARKET ANALYSIS BY SIMULATION TYPE
    365. MEA ATTACK SIMULATION PROACTIVE MARKET ANALYSIS BY END USER
    366. OF MEA ATTACK SIMULATION PROACTIVE MARKET ANALYSIS BY ORGANIZATION SIZE
    367. REST OF MEA ATTACK SIMULATION PROACTIVE MARKET ANALYSIS BY REGIONAL
    368. KEY BUYING CRITERIA OF ATTACK SIMULATION PROACTIVE MARKET
    369. RESEARCH PROCESS OF MRFR
    370. MARKET
    371. ATTACK SIMULATION PROACTIVE MARKET, BY DEPLOYMENT TYPE, 2024 (% SHARE)
    372. (USD Billions)
    373. TYPE, 2024 (% SHARE)
    374. TYPE, 2019 TO 2032 (USD Billions)
    375. MARKET, BY END USER, 2024 (% SHARE)
    376. MARKET, BY END USER, 2019 TO 2032 (USD Billions)
    377. PROACTIVE MARKET, BY ORGANIZATION SIZE, 2024 (% SHARE)
    378. SIMULATION PROACTIVE MARKET, BY ORGANIZATION SIZE, 2019 TO 2032 (USD Billions)
    379. Billions)

    Attack Simulation Proactive Market Market Segmentation


    • Attack Simulation Proactive Market By Deployment Type (USD Billion, 2019-2032)

      • On-Premises
      • Cloud-Based
      • Hybrid

    • Attack Simulation Proactive Market By Simulation Type (USD Billion, 2019-2032)

      • Penetration Testing
      • Phishing Simulation
      • Red Teaming

    • Attack Simulation Proactive Market By End User (USD Billion, 2019-2032)

      • Government
      • BFSI
      • Healthcare
      • IT Telecom
      • Retail

    • Attack Simulation Proactive Market By Organization Size (USD Billion, 2019-2032)

      • Small Enterprises
      • Medium Enterprises
      • Large Enterprises

    • Attack Simulation Proactive Market By Regional (USD Billion, 2019-2032)

      • North America
      • Europe
      • South America
      • Asia Pacific
      • Middle East and Africa

    Attack Simulation Proactive Market Regional Outlook (USD Billion, 2019-2032)


    • North America Outlook (USD Billion, 2019-2032)

      • North America Attack Simulation Proactive Market by Deployment Type

        • On-Premises
        • Cloud-Based
        • Hybrid
      • North America Attack Simulation Proactive Market by Simulation Type

        • Penetration Testing
        • Phishing Simulation
        • Red Teaming
      • North America Attack Simulation Proactive Market by End User Type

        • Government
        • BFSI
        • Healthcare
        • IT Telecom
        • Retail
      • North America Attack Simulation Proactive Market by Organization Size Type

        • Small Enterprises
        • Medium Enterprises
        • Large Enterprises
      • North America Attack Simulation Proactive Market by Regional Type

        • US
        • Canada
      • US Outlook (USD Billion, 2019-2032)
      • US Attack Simulation Proactive Market by Deployment Type

        • On-Premises
        • Cloud-Based
        • Hybrid
      • US Attack Simulation Proactive Market by Simulation Type

        • Penetration Testing
        • Phishing Simulation
        • Red Teaming
      • US Attack Simulation Proactive Market by End User Type

        • Government
        • BFSI
        • Healthcare
        • IT Telecom
        • Retail
      • US Attack Simulation Proactive Market by Organization Size Type

        • Small Enterprises
        • Medium Enterprises
        • Large Enterprises
      • CANADA Outlook (USD Billion, 2019-2032)
      • CANADA Attack Simulation Proactive Market by Deployment Type

        • On-Premises
        • Cloud-Based
        • Hybrid
      • CANADA Attack Simulation Proactive Market by Simulation Type

        • Penetration Testing
        • Phishing Simulation
        • Red Teaming
      • CANADA Attack Simulation Proactive Market by End User Type

        • Government
        • BFSI
        • Healthcare
        • IT Telecom
        • Retail
      • CANADA Attack Simulation Proactive Market by Organization Size Type

        • Small Enterprises
        • Medium Enterprises
        • Large Enterprises
    • Europe Outlook (USD Billion, 2019-2032)

      • Europe Attack Simulation Proactive Market by Deployment Type

        • On-Premises
        • Cloud-Based
        • Hybrid
      • Europe Attack Simulation Proactive Market by Simulation Type

        • Penetration Testing
        • Phishing Simulation
        • Red Teaming
      • Europe Attack Simulation Proactive Market by End User Type

        • Government
        • BFSI
        • Healthcare
        • IT Telecom
        • Retail
      • Europe Attack Simulation Proactive Market by Organization Size Type

        • Small Enterprises
        • Medium Enterprises
        • Large Enterprises
      • Europe Attack Simulation Proactive Market by Regional Type

        • Germany
        • UK
        • France
        • Russia
        • Italy
        • Spain
        • Rest of Europe
      • GERMANY Outlook (USD Billion, 2019-2032)
      • GERMANY Attack Simulation Proactive Market by Deployment Type

        • On-Premises
        • Cloud-Based
        • Hybrid
      • GERMANY Attack Simulation Proactive Market by Simulation Type

        • Penetration Testing
        • Phishing Simulation
        • Red Teaming
      • GERMANY Attack Simulation Proactive Market by End User Type

        • Government
        • BFSI
        • Healthcare
        • IT Telecom
        • Retail
      • GERMANY Attack Simulation Proactive Market by Organization Size Type

        • Small Enterprises
        • Medium Enterprises
        • Large Enterprises
      • UK Outlook (USD Billion, 2019-2032)
      • UK Attack Simulation Proactive Market by Deployment Type

        • On-Premises
        • Cloud-Based
        • Hybrid
      • UK Attack Simulation Proactive Market by Simulation Type

        • Penetration Testing
        • Phishing Simulation
        • Red Teaming
      • UK Attack Simulation Proactive Market by End User Type

        • Government
        • BFSI
        • Healthcare
        • IT Telecom
        • Retail
      • UK Attack Simulation Proactive Market by Organization Size Type

        • Small Enterprises
        • Medium Enterprises
        • Large Enterprises
      • FRANCE Outlook (USD Billion, 2019-2032)
      • FRANCE Attack Simulation Proactive Market by Deployment Type

        • On-Premises
        • Cloud-Based
        • Hybrid
      • FRANCE Attack Simulation Proactive Market by Simulation Type

        • Penetration Testing
        • Phishing Simulation
        • Red Teaming
      • FRANCE Attack Simulation Proactive Market by End User Type

        • Government
        • BFSI
        • Healthcare
        • IT Telecom
        • Retail
      • FRANCE Attack Simulation Proactive Market by Organization Size Type

        • Small Enterprises
        • Medium Enterprises
        • Large Enterprises
      • RUSSIA Outlook (USD Billion, 2019-2032)
      • RUSSIA Attack Simulation Proactive Market by Deployment Type

        • On-Premises
        • Cloud-Based
        • Hybrid
      • RUSSIA Attack Simulation Proactive Market by Simulation Type

        • Penetration Testing
        • Phishing Simulation
        • Red Teaming
      • RUSSIA Attack Simulation Proactive Market by End User Type

        • Government
        • BFSI
        • Healthcare
        • IT Telecom
        • Retail
      • RUSSIA Attack Simulation Proactive Market by Organization Size Type

        • Small Enterprises
        • Medium Enterprises
        • Large Enterprises
      • ITALY Outlook (USD Billion, 2019-2032)
      • ITALY Attack Simulation Proactive Market by Deployment Type

        • On-Premises
        • Cloud-Based
        • Hybrid
      • ITALY Attack Simulation Proactive Market by Simulation Type

        • Penetration Testing
        • Phishing Simulation
        • Red Teaming
      • ITALY Attack Simulation Proactive Market by End User Type

        • Government
        • BFSI
        • Healthcare
        • IT Telecom
        • Retail
      • ITALY Attack Simulation Proactive Market by Organization Size Type

        • Small Enterprises
        • Medium Enterprises
        • Large Enterprises
      • SPAIN Outlook (USD Billion, 2019-2032)
      • SPAIN Attack Simulation Proactive Market by Deployment Type

        • On-Premises
        • Cloud-Based
        • Hybrid
      • SPAIN Attack Simulation Proactive Market by Simulation Type

        • Penetration Testing
        • Phishing Simulation
        • Red Teaming
      • SPAIN Attack Simulation Proactive Market by End User Type

        • Government
        • BFSI
        • Healthcare
        • IT Telecom
        • Retail
      • SPAIN Attack Simulation Proactive Market by Organization Size Type

        • Small Enterprises
        • Medium Enterprises
        • Large Enterprises
      • REST OF EUROPE Outlook (USD Billion, 2019-2032)
      • REST OF EUROPE Attack Simulation Proactive Market by Deployment Type

        • On-Premises
        • Cloud-Based
        • Hybrid
      • REST OF EUROPE Attack Simulation Proactive Market by Simulation Type

        • Penetration Testing
        • Phishing Simulation
        • Red Teaming
      • REST OF EUROPE Attack Simulation Proactive Market by End User Type

        • Government
        • BFSI
        • Healthcare
        • IT Telecom
        • Retail
      • REST OF EUROPE Attack Simulation Proactive Market by Organization Size Type

        • Small Enterprises
        • Medium Enterprises
        • Large Enterprises
    • APAC Outlook (USD Billion, 2019-2032)

      • APAC Attack Simulation Proactive Market by Deployment Type

        • On-Premises
        • Cloud-Based
        • Hybrid
      • APAC Attack Simulation Proactive Market by Simulation Type

        • Penetration Testing
        • Phishing Simulation
        • Red Teaming
      • APAC Attack Simulation Proactive Market by End User Type

        • Government
        • BFSI
        • Healthcare
        • IT Telecom
        • Retail
      • APAC Attack Simulation Proactive Market by Organization Size Type

        • Small Enterprises
        • Medium Enterprises
        • Large Enterprises
      • APAC Attack Simulation Proactive Market by Regional Type

        • China
        • India
        • Japan
        • South Korea
        • Malaysia
        • Thailand
        • Indonesia
        • Rest of APAC
      • CHINA Outlook (USD Billion, 2019-2032)
      • CHINA Attack Simulation Proactive Market by Deployment Type

        • On-Premises
        • Cloud-Based
        • Hybrid
      • CHINA Attack Simulation Proactive Market by Simulation Type

        • Penetration Testing
        • Phishing Simulation
        • Red Teaming
      • CHINA Attack Simulation Proactive Market by End User Type

        • Government
        • BFSI
        • Healthcare
        • IT Telecom
        • Retail
      • CHINA Attack Simulation Proactive Market by Organization Size Type

        • Small Enterprises
        • Medium Enterprises
        • Large Enterprises
      • INDIA Outlook (USD Billion, 2019-2032)
      • INDIA Attack Simulation Proactive Market by Deployment Type

        • On-Premises
        • Cloud-Based
        • Hybrid
      • INDIA Attack Simulation Proactive Market by Simulation Type

        • Penetration Testing
        • Phishing Simulation
        • Red Teaming
      • INDIA Attack Simulation Proactive Market by End User Type

        • Government
        • BFSI
        • Healthcare
        • IT Telecom
        • Retail
      • INDIA Attack Simulation Proactive Market by Organization Size Type

        • Small Enterprises
        • Medium Enterprises
        • Large Enterprises
      • JAPAN Outlook (USD Billion, 2019-2032)
      • JAPAN Attack Simulation Proactive Market by Deployment Type

        • On-Premises
        • Cloud-Based
        • Hybrid
      • JAPAN Attack Simulation Proactive Market by Simulation Type

        • Penetration Testing
        • Phishing Simulation
        • Red Teaming
      • JAPAN Attack Simulation Proactive Market by End User Type

        • Government
        • BFSI
        • Healthcare
        • IT Telecom
        • Retail
      • JAPAN Attack Simulation Proactive Market by Organization Size Type

        • Small Enterprises
        • Medium Enterprises
        • Large Enterprises
      • SOUTH KOREA Outlook (USD Billion, 2019-2032)
      • SOUTH KOREA Attack Simulation Proactive Market by Deployment Type

        • On-Premises
        • Cloud-Based
        • Hybrid
      • SOUTH KOREA Attack Simulation Proactive Market by Simulation Type

        • Penetration Testing
        • Phishing Simulation
        • Red Teaming
      • SOUTH KOREA Attack Simulation Proactive Market by End User Type

        • Government
        • BFSI
        • Healthcare
        • IT Telecom
        • Retail
      • SOUTH KOREA Attack Simulation Proactive Market by Organization Size Type

        • Small Enterprises
        • Medium Enterprises
        • Large Enterprises
      • MALAYSIA Outlook (USD Billion, 2019-2032)
      • MALAYSIA Attack Simulation Proactive Market by Deployment Type

        • On-Premises
        • Cloud-Based
        • Hybrid
      • MALAYSIA Attack Simulation Proactive Market by Simulation Type

        • Penetration Testing
        • Phishing Simulation
        • Red Teaming
      • MALAYSIA Attack Simulation Proactive Market by End User Type

        • Government
        • BFSI
        • Healthcare
        • IT Telecom
        • Retail
      • MALAYSIA Attack Simulation Proactive Market by Organization Size Type

        • Small Enterprises
        • Medium Enterprises
        • Large Enterprises
      • THAILAND Outlook (USD Billion, 2019-2032)
      • THAILAND Attack Simulation Proactive Market by Deployment Type

        • On-Premises
        • Cloud-Based
        • Hybrid
      • THAILAND Attack Simulation Proactive Market by Simulation Type

        • Penetration Testing
        • Phishing Simulation
        • Red Teaming
      • THAILAND Attack Simulation Proactive Market by End User Type

        • Government
        • BFSI
        • Healthcare
        • IT Telecom
        • Retail
      • THAILAND Attack Simulation Proactive Market by Organization Size Type

        • Small Enterprises
        • Medium Enterprises
        • Large Enterprises
      • INDONESIA Outlook (USD Billion, 2019-2032)
      • INDONESIA Attack Simulation Proactive Market by Deployment Type

        • On-Premises
        • Cloud-Based
        • Hybrid
      • INDONESIA Attack Simulation Proactive Market by Simulation Type

        • Penetration Testing
        • Phishing Simulation
        • Red Teaming
      • INDONESIA Attack Simulation Proactive Market by End User Type

        • Government
        • BFSI
        • Healthcare
        • IT Telecom
        • Retail
      • INDONESIA Attack Simulation Proactive Market by Organization Size Type

        • Small Enterprises
        • Medium Enterprises
        • Large Enterprises
      • REST OF APAC Outlook (USD Billion, 2019-2032)
      • REST OF APAC Attack Simulation Proactive Market by Deployment Type

        • On-Premises
        • Cloud-Based
        • Hybrid
      • REST OF APAC Attack Simulation Proactive Market by Simulation Type

        • Penetration Testing
        • Phishing Simulation
        • Red Teaming
      • REST OF APAC Attack Simulation Proactive Market by End User Type

        • Government
        • BFSI
        • Healthcare
        • IT Telecom
        • Retail
      • REST OF APAC Attack Simulation Proactive Market by Organization Size Type

        • Small Enterprises
        • Medium Enterprises
        • Large Enterprises
    • South America Outlook (USD Billion, 2019-2032)

      • South America Attack Simulation Proactive Market by Deployment Type

        • On-Premises
        • Cloud-Based
        • Hybrid
      • South America Attack Simulation Proactive Market by Simulation Type

        • Penetration Testing
        • Phishing Simulation
        • Red Teaming
      • South America Attack Simulation Proactive Market by End User Type

        • Government
        • BFSI
        • Healthcare
        • IT Telecom
        • Retail
      • South America Attack Simulation Proactive Market by Organization Size Type

        • Small Enterprises
        • Medium Enterprises
        • Large Enterprises
      • South America Attack Simulation Proactive Market by Regional Type

        • Brazil
        • Mexico
        • Argentina
        • Rest of South America
      • BRAZIL Outlook (USD Billion, 2019-2032)
      • BRAZIL Attack Simulation Proactive Market by Deployment Type

        • On-Premises
        • Cloud-Based
        • Hybrid
      • BRAZIL Attack Simulation Proactive Market by Simulation Type

        • Penetration Testing
        • Phishing Simulation
        • Red Teaming
      • BRAZIL Attack Simulation Proactive Market by End User Type

        • Government
        • BFSI
        • Healthcare
        • IT Telecom
        • Retail
      • BRAZIL Attack Simulation Proactive Market by Organization Size Type

        • Small Enterprises
        • Medium Enterprises
        • Large Enterprises
      • MEXICO Outlook (USD Billion, 2019-2032)
      • MEXICO Attack Simulation Proactive Market by Deployment Type

        • On-Premises
        • Cloud-Based
        • Hybrid
      • MEXICO Attack Simulation Proactive Market by Simulation Type

        • Penetration Testing
        • Phishing Simulation
        • Red Teaming
      • MEXICO Attack Simulation Proactive Market by End User Type

        • Government
        • BFSI
        • Healthcare
        • IT Telecom
        • Retail
      • MEXICO Attack Simulation Proactive Market by Organization Size Type

        • Small Enterprises
        • Medium Enterprises
        • Large Enterprises
      • ARGENTINA Outlook (USD Billion, 2019-2032)
      • ARGENTINA Attack Simulation Proactive Market by Deployment Type

        • On-Premises
        • Cloud-Based
        • Hybrid
      • ARGENTINA Attack Simulation Proactive Market by Simulation Type

        • Penetration Testing
        • Phishing Simulation
        • Red Teaming
      • ARGENTINA Attack Simulation Proactive Market by End User Type

        • Government
        • BFSI
        • Healthcare
        • IT Telecom
        • Retail
      • ARGENTINA Attack Simulation Proactive Market by Organization Size Type

        • Small Enterprises
        • Medium Enterprises
        • Large Enterprises
      • REST OF SOUTH AMERICA Outlook (USD Billion, 2019-2032)
      • REST OF SOUTH AMERICA Attack Simulation Proactive Market by Deployment Type

        • On-Premises
        • Cloud-Based
        • Hybrid
      • REST OF SOUTH AMERICA Attack Simulation Proactive Market by Simulation Type

        • Penetration Testing
        • Phishing Simulation
        • Red Teaming
      • REST OF SOUTH AMERICA Attack Simulation Proactive Market by End User Type

        • Government
        • BFSI
        • Healthcare
        • IT Telecom
        • Retail
      • REST OF SOUTH AMERICA Attack Simulation Proactive Market by Organization Size Type

        • Small Enterprises
        • Medium Enterprises
        • Large Enterprises
    • MEA Outlook (USD Billion, 2019-2032)

      • MEA Attack Simulation Proactive Market by Deployment Type

        • On-Premises
        • Cloud-Based
        • Hybrid
      • MEA Attack Simulation Proactive Market by Simulation Type

        • Penetration Testing
        • Phishing Simulation
        • Red Teaming
      • MEA Attack Simulation Proactive Market by End User Type

        • Government
        • BFSI
        • Healthcare
        • IT Telecom
        • Retail
      • MEA Attack Simulation Proactive Market by Organization Size Type

        • Small Enterprises
        • Medium Enterprises
        • Large Enterprises
      • MEA Attack Simulation Proactive Market by Regional Type

        • GCC Countries
        • South Africa
        • Rest of MEA
      • GCC COUNTRIES Outlook (USD Billion, 2019-2032)
      • GCC COUNTRIES Attack Simulation Proactive Market by Deployment Type

        • On-Premises
        • Cloud-Based
        • Hybrid
      • GCC COUNTRIES Attack Simulation Proactive Market by Simulation Type

        • Penetration Testing
        • Phishing Simulation
        • Red Teaming
      • GCC COUNTRIES Attack Simulation Proactive Market by End User Type

        • Government
        • BFSI
        • Healthcare
        • IT Telecom
        • Retail
      • GCC COUNTRIES Attack Simulation Proactive Market by Organization Size Type

        • Small Enterprises
        • Medium Enterprises
        • Large Enterprises
      • SOUTH AFRICA Outlook (USD Billion, 2019-2032)
      • SOUTH AFRICA Attack Simulation Proactive Market by Deployment Type

        • On-Premises
        • Cloud-Based
        • Hybrid
      • SOUTH AFRICA Attack Simulation Proactive Market by Simulation Type

        • Penetration Testing
        • Phishing Simulation
        • Red Teaming
      • SOUTH AFRICA Attack Simulation Proactive Market by End User Type

        • Government
        • BFSI
        • Healthcare
        • IT Telecom
        • Retail
      • SOUTH AFRICA Attack Simulation Proactive Market by Organization Size Type

        • Small Enterprises
        • Medium Enterprises
        • Large Enterprises
      • REST OF MEA Outlook (USD Billion, 2019-2032)
      • REST OF MEA Attack Simulation Proactive Market by Deployment Type

        • On-Premises
        • Cloud-Based
        • Hybrid
      • REST OF MEA Attack Simulation Proactive Market by Simulation Type

        • Penetration Testing
        • Phishing Simulation
        • Red Teaming
      • REST OF MEA Attack Simulation Proactive Market by End User Type

        • Government
        • BFSI
        • Healthcare
        • IT Telecom
        • Retail
      • REST OF MEA Attack Simulation Proactive Market by Organization Size Type

        • Small Enterprises
        • Medium Enterprises
        • Large Enterprises


    Report Infographic
    Free Sample Request

    Kindly complete the form below to receive a free sample of this Report

    Customer Strories

    “I am very pleased with how market segments have been defined in a relevant way for my purposes (such as "Portable Freezers & refrigerators" and "last-mile"). In general the report is well structured. Thanks very much for your efforts.”

    Victoria Milne Founder
    Case Study

    Chemicals and Materials