• Cat-intel
  • MedIntelliX
  • Resources
  • About Us
  • Request Free Sample ×

    Kindly complete the form below to receive a free sample of this Report

    Leading companies partner with us for data-driven Insights

    clients tt-cursor

    AR VR in Education Market

    ID: MRFR/ICT/9350-HCR
    141 Pages
    Shubham Munde
    September 2025

    Augmented and Virtual Reality in Education Market Research Report Information by Offering (Hardware (Sensors, Controllers, Cameras, and VR headset), Software, Services (Managed Services and Professional Services)) Devices (Interactive Whiteboards, Mobile Computing Devices, Head Mounted displays) Application (Classroom Learning, Corporate Learning Management, e-learning, Corporate (Telecommunications and IT, Healthcare, Retail and Ecommerce, Banking, Financial Services, and Insurance, Manufacturing) and Regions -Forecast till 2032

    Share:
    Download PDF ×

    We do not share your information with anyone. However, we may send you emails based on your report interest from time to time. You may contact us at any time to opt-out.

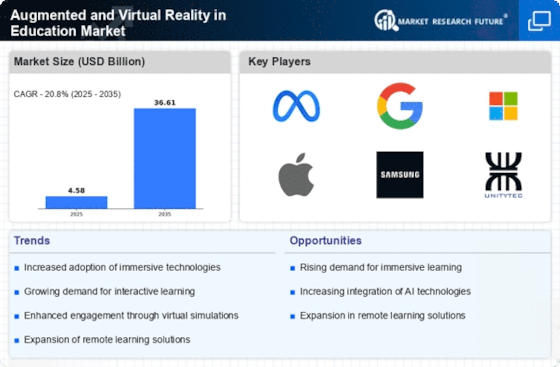
    Augmented and Virtual Reality in Education Market Research Report—Global Forecast till 2032 Infographic
    Purchase Options
    $ 4,950.0
    $ 5,950.0
    $ 7,250.0
    Table of Contents

    AR VR in Education Market Summary

    As per Market Research Future Analysis, the Augmented and Virtual Reality in Education Market is poised for significant growth, driven by the increasing adoption of digital technologies and the demand for interactive learning experiences. The market is expected to expand from USD 4.58 Billion in 2024 to USD 17.20 Billion by 2032, reflecting a robust CAGR of 20.80%. The integration of AR and VR in educational settings enhances student engagement and learning outcomes, with notable partnerships, such as Meta's collaboration with 15 US universities to promote VR classes. However, challenges like data security and privacy concerns remain critical issues that need addressing.

    Key Market Trends & Highlights

    The market is characterized by several key trends and developments.

    • Market Size in 2023: USD 3.79 Billion
    • Projected Market Size by 2032: USD 17.20 Billion
    • CAGR from 2024 to 2032: 20.80%
    • North America expected to dominate market share in 2024

    Market Size & Forecast

    2023 Market Size USD 3.79 Billion
    2024 Market Size USD 4.58 Billion
    2032 Market Size USD 17.20 Billion
    CAGR (2024-2032) 20.80%

    Major Players

    Key players include Dell, IBM, Saba Software, Oracle, Sony, Samsung Electronics, HTC, Google, Microsoft, and Avantis Education.

    AR VR in Education Market Trends

    The integration of augmented and virtual reality technologies in educational settings appears to enhance student engagement and improve learning outcomes, suggesting a transformative potential for pedagogical practices.

    U.S. Department of Education

    AR VR in Education Market Drivers

    Increased Adoption of Technology in Education

    The Global Augmented and Virtual Reality in Education Market Industry experiences a notable surge in the adoption of technology within educational institutions. Schools and universities increasingly integrate advanced technologies to enhance learning experiences. This trend is driven by the need for interactive and engaging educational tools that cater to diverse learning styles. As educational institutions recognize the benefits of immersive learning environments, investments in augmented and virtual reality solutions are expected to rise significantly. By 2024, the market is projected to reach 4.58 USD Billion, reflecting a growing commitment to modernizing educational practices through innovative technologies.

    Market Segment Insights

    Regional Insights

    Key Companies in the AR VR in Education Market market include

    Industry Developments

    • Q2 2024: Prisms VR raises $12.5M Series A to expand math education in US schools Prisms VR, a startup developing virtual reality math curriculum for K-12, secured $12.5 million in Series A funding to accelerate deployment of its VR learning platform in US school districts and expand its content library.
    • Q2 2024: Meta launches 'Meta Quest for Education' program to bring VR headsets to classrooms Meta announced a new initiative to distribute Meta Quest headsets and tailored educational content to select US and UK schools, aiming to integrate immersive VR experiences into STEM and history curricula.
    • Q2 2024: Microsoft partners with Pearson to deliver immersive AR/VR learning modules Microsoft and Pearson announced a strategic partnership to co-develop augmented and virtual reality modules for higher education, leveraging Microsoft HoloLens and Azure cloud services.
    • Q3 2024: Google unveils new AR Classroom tools for Chromebooks Google launched a suite of augmented reality tools for Chromebooks, enabling teachers to create interactive 3D lessons and students to explore virtual science labs and historical sites.
    • Q3 2024: Samsung launches 'Galaxy EduVR' headset for global education market Samsung introduced the Galaxy EduVR, a new virtual reality headset designed specifically for classroom use, featuring a curated library of educational content and teacher management tools.
    • Q3 2024: UK government awards £10m contract for VR-based teacher training The UK Department for Education awarded a £10 million contract to a consortium led by Immerse to develop and deploy VR-based teacher training programs across public schools.
    • Q4 2024: Lenovo and zSpace announce partnership to deliver AR/VR solutions to US schools Lenovo and zSpace formed a partnership to provide integrated AR/VR hardware and software packages to K-12 schools in the US, aiming to boost adoption of immersive learning technologies.
    • Q4 2024: Sony launches 'EduVerse' VR platform for universities Sony unveiled EduVerse, a virtual reality platform designed for higher education institutions, offering virtual classrooms, collaborative labs, and integration with existing learning management systems.
    • Q1 2025: Magic Leap secures $150M funding to expand AR education initiatives Magic Leap raised $150 million in new funding to accelerate the development and deployment of its augmented reality solutions for education, focusing on interactive STEM and medical training modules.
    • Q1 2025: Meta appoints new Head of Education Partnerships for global VR initiatives Meta announced the appointment of Dr. Lisa Chen as Head of Education Partnerships, tasked with expanding Meta's VR education programs and forging new collaborations with schools and universities worldwide.
    • Q2 2025: EON Reality opens new AR/VR education innovation center in Singapore EON Reality inaugurated a new innovation center in Singapore dedicated to developing and piloting AR/VR educational content for Southeast Asian schools and universities.
    • Q2 2025: Microsoft launches 'HoloLens for Schools' pilot program in Germany Microsoft began a pilot program deploying HoloLens devices and mixed reality curriculum in select German secondary schools, aiming to evaluate the impact of immersive technology on STEM education outcomes.

    Report Scope

    This study estimates revenue growth at global, regional, and country levels and offers an overview of the latest developments in each of the sub-sectors from 2023 to 2032. For this analysis, MRFR segmented the global Augmented and Virtual Reality in Education Market has been segmented based on offering, devices, deployment model, application and end users, and region.

    By Offering

      • Hardware
        • Sensors
        • Controllers
        • Cameras
        • VR Headset
        • Others
      • Software
      • Services
        • Managed Services
        • Professional Services

    Deployment Model

      • Cloud
      • On-premises

    Devices

      • Interactive Whiteboards
      • Mobile Computing Devices
      • Head Mounted displays
      • Gesture Tracing Device
        • Head up Displays
        • Handheld Devices
      • Projectors & Display Walls
      • Others

    Application

      • Classroom Learning
      • Corporate Learning Management
      • Certifications
      • e-learning
      • Virtual field trips
      • Student Recruitment
      • Others

    End Users

      • Academic
        • K-12
        • Higher Education
      • Corporate
        • Telecommunications and IT
        • Healthcare and Life Sciences
        • Retail and Ecommerce
        • Banking, Financial Services, and Insurance
        • Manufacturing
        • Government and Public Sector

    By Region

      • North America
      • Europe
      • Asia-Pacific
      • Middle East & Africa
      • South America

    Future Outlook

    AR VR in Education Market Future Outlook

    The Global Augmented and Virtual Reality in Education Market is projected to grow at an 18.75% CAGR from 2024 to 2035, driven by technological advancements and increasing demand for immersive learning experiences.

    New opportunities lie in:

    • Develop tailored AR/VR content for STEM education to enhance engagement and understanding.
    • Implement VR simulations for teacher training programs to improve pedagogical skills.
    • Create partnerships with educational institutions to integrate AR/VR into existing curricula.

    By 2035, the market is expected to be a pivotal component of educational innovation and delivery.

    Market Segmentation

    Devices

    • Others
    • Projectors & Display Walls
    • Gesture Tracing Device
    • Head up Displays
    • Handheld Devices
    • Head Mounted displays
    • Mobile Computing Devices
    • Interactive Whiteboards

    By Region

    • South America
    • Middle East & Africa
    • Asia-Pacific
    • Europe
    • North America

    End Users

    • Corporate
    • Telecommunications and IT
    • Healthcare and Life Sciences
    • Retail and Ecommerce
    • Banking, Financial Services, and Insurance
    • Manufacturing
    • Government and Public Sector
    • Academic
    • K-12
    • Higher Education

    Application

    • Others
    • Student Recruitment
    • Virtual field trips
    • e-learning
    • Certifications
    • Corporate Learning Management
    • Classroom Learning

    By Offering

    • Services
    • Managed Services
    • Professional Services
    • Software
    • Hardware
    • Sensors
    • Controllers
    • Cameras
    • VR Headset
    • Others

    Key Players

    • Edvance360
    • Oracle
    • Saba Software
    • IBM
    • Dell

    Deployment Model

    • On-premises
    • Cloud

    AR VR in Education Market Industry Developments

    • Q2 2024: Prisms VR raises $12.5M Series A to expand math education in US schools Prisms VR, a startup developing virtual reality math curriculum for K-12, secured $12.5 million in Series A funding to accelerate deployment of its VR learning platform in US school districts and expand its content library.
    • Q2 2024: Meta launches 'Meta Quest for Education' program to bring VR headsets to classrooms Meta announced a new initiative to distribute Meta Quest headsets and tailored educational content to select US and UK schools, aiming to integrate immersive VR experiences into STEM and history curricula.
    • Q2 2024: Microsoft partners with Pearson to deliver immersive AR/VR learning modules Microsoft and Pearson announced a strategic partnership to co-develop augmented and virtual reality modules for higher education, leveraging Microsoft HoloLens and Azure cloud services.
    • Q3 2024: Google unveils new AR Classroom tools for Chromebooks Google launched a suite of augmented reality tools for Chromebooks, enabling teachers to create interactive 3D lessons and students to explore virtual science labs and historical sites.
    • Q3 2024: Samsung launches 'Galaxy EduVR' headset for global education market Samsung introduced the Galaxy EduVR, a new virtual reality headset designed specifically for classroom use, featuring a curated library of educational content and teacher management tools.
    • Q3 2024: UK government awards £10m contract for VR-based teacher training The UK Department for Education awarded a £10 million contract to a consortium led by Immerse to develop and deploy VR-based teacher training programs across public schools.
    • Q4 2024: Lenovo and zSpace announce partnership to deliver AR/VR solutions to US schools Lenovo and zSpace formed a partnership to provide integrated AR/VR hardware and software packages to K-12 schools in the US, aiming to boost adoption of immersive learning technologies.
    • Q4 2024: Sony launches 'EduVerse' VR platform for universities Sony unveiled EduVerse, a virtual reality platform designed for higher education institutions, offering virtual classrooms, collaborative labs, and integration with existing learning management systems.
    • Q1 2025: Magic Leap secures $150M funding to expand AR education initiatives Magic Leap raised $150 million in new funding to accelerate the development and deployment of its augmented reality solutions for education, focusing on interactive STEM and medical training modules.
    • Q1 2025: Meta appoints new Head of Education Partnerships for global VR initiatives Meta announced the appointment of Dr. Lisa Chen as Head of Education Partnerships, tasked with expanding Meta's VR education programs and forging new collaborations with schools and universities worldwide.
    • Q2 2025: EON Reality opens new AR/VR education innovation center in Singapore EON Reality inaugurated a new innovation center in Singapore dedicated to developing and piloting AR/VR educational content for Southeast Asian schools and universities.
    • Q2 2025: Microsoft launches 'HoloLens for Schools' pilot program in Germany Microsoft began a pilot program deploying HoloLens devices and mixed reality curriculum in select German secondary schools, aiming to evaluate the impact of immersive technology on STEM education outcomes.

    Report Scope

    Report Attribute/Metric Details
    Market Size 2024 USD 4.58 Billion
    Market Size 2032 USD  17.20 Billion
    Compound Annual Growth Rate (CAGR) 20.80% (2024-2032)
    Base Year 2023
    Market Forecast Period 2024-2032
    Historical Data 2018- 2022
    Market Forecast Units Value (USD Billion)
    Report Coverage Revenue Forecast, Market Competitive Landscape, Growth Factors, and Trends
    Segments Covered Offering (Hardware (Sensors, Controllers, Cameras, VR Headset and Others), Software, Services (Managed Services, Professional Services) Devices (Interactive whiteboards, Mobile Computing Devices, Head Mounted displays, Gesture Tracing Device, Head up displays, handheld devices, Projectors & display walls, others) Deployment Model (Cloud, On-premises) Application (Classroom Learning, Corporate Learning Management, Certifications, e-learning, Virtual field trips, Student Recruitment, Others) End Users (Academic (K-12, Higher Education, Vocational), Corporate (IT & Telecommunication, BFSI, Healthcare & Life sciences, Retail & E-commerce, Government & Public Sector, Others))
    Geographies Covered North America, Europe, Asia Pacific, and the Rest of the World
    Countries Covered The US, Canada, Germany, France, UK, Italy, Spain, China, Japan, India, Australia, South Korea, and Brazil
    Key Companies Profiled  Sony • Samsung Electronics • HTC • Google • Microsoft • Panasonic • Hitachi • Barco • LG Electronics • Veative Labs • Cisco • Blackboard • Dell • IBM • Saba Software • Oracle • Edvance360 • Electa Communications • BrainCert • SKYPREP • Impero Software • WizIQ • BigBlueButton • Digital Samba • TutorRoom • Eon Reality Inc. • Facebook Technologies LLC • Varjo Technologies
    Key Market Opportunities Growing adoption of virtual trips
    Key Market Dynamics Increasing adoption of advanced technology products and devices and growing development in education sector

    Market Highlights

    Author
    Shubham Munde
    Research Analyst Level II

    With a technical background in information technology & semiconductors, Shubham has 4.5+ years of experience in market research and analytics with the tasks of data mining, analysis, and project execution. He is the POC for our clients, for their consulting projects running under the ICT/Semiconductor domain. Shubham holds a Bachelor’s in Information and Technology and a Master of Business Administration (MBA). Shubham has executed over 150 research projects for our clients under the brand name Market Research Future in the last 2 years. His core skill is building the research respondent relation for gathering the primary information from industry and market estimation for niche markets. He is having expertise in conducting secondary & primary research, market estimations, market projections, competitive analysis, analysing current market trends and market dynamics, deep-dive analysis on market scenarios, consumer behaviour, technological impact analysis, consulting, analytics, etc. He has worked on fortune 500 companies' syndicate and consulting projects along with several government projects. He has worked on the projects of top tech brands such as IBM, Google, Microsoft, AWS, Meta, Oracle, Cisco Systems, Samsung, Accenture, VMware, Schneider Electric, Dell, HP, Ericsson, and so many others. He has worked on Metaverse, Web 3.0, Zero-Trust security, cyber-security, blockchain, quantum computing, robotics, 5G technology, High-Performance computing, data centers, AI, automation, IT equipment, sensors, semiconductors, consumer electronics and so many tech domain projects.

    Leave a Comment

    FAQs

    What is the CAGR of the augmented and virtual reality in education market in the upcoming period?

    A 20.80% CAGR is expected to transform the market.

    Which region is a major driver in the augmented and virtual reality in education market?

    The North America regional market is projected to be the major driver of the market.

    What segments are utilized for better understanding the augmented and virtual reality in education market?

    The segments in the market are offering, devices, deployment model, application, and end users.

    Who are the contenders in the market for augmented and virtual reality in education market?

    The major contenders in the market are Eon Reality Inc., Facebook Technologies LLC AND Varjo Technologies Oy.

    1. 'TABLE OF CONTENTS
    2. EXECUTIVE SUMMARY
      1. Market Attractiveness
    3. Analysis
    4. Global Augmented and Virtual Reality in Education Market, by Offering
      1. Global Augmented
    5. and Virtual Reality in Education Market, by Devices
      1. Global Augmented and Virtual Reality in Education
    6. Market, by Deployment Model
      1. Global Augmented and Virtual Reality in Education Market, by
    7. Application
    8. Global Augmented and Virtual Reality in Education Market, by End Users
      1. Global Augmented
    9. and Virtual Reality in Education Market, by Region
    10. MARKET INTRODUCTION
      1. Definition
      2. Scope of the Study
      3. Market Structure
    11. RESEARCH METHODOLOGY
      1. Research Process
      2. Primary Research
      3. Secondary Research
      4. Market Size Estimation
      5. Forecast Model
      6. List of Assumptions
    12. MARKET DYNAMICS
      1. Introduction
      2. Drivers
        1. Increasing adoption of advanced technology
    13. products and devices and growing development in education sector
      1. Increasing penetration
    14. of internet of things (IoT) and adoption of connected devices
      1. Restraint
        1. High cost of products
        2. Data security
    15. and privacy concerns
    16. Opportunity
    17. Growing adoption of virtual trips
      1. Impact of COVID-19
        1. Impact of COVID-19 on corporate and academic
    18. MARKET FACTOR ANALYSIS
    19. Value Chain Analysis/Supply Chain Analysis
      1. Porter’s Five Forces Model
        1. Bargaining Power of Suppliers
        2. Bargaining Power
    20. of Buyers
    21. Threat of New Entrants
    22. Threat of Substitutes
    23. Intensity of Rivalry
    24. GLOBAL AUGMENTED AND VIRTUAL REALITY IN EDUCATION MARKET, BY OFFERING
      1. Introduction
        1. Hardware
        2. Software
        3. Services
    25. Services
    26. GLOBAL AUGMENTED AND VIRTUAL REALITY IN EDUCATION MARKET, BY DEVICES
      1. Introduction
      2. Interactive whiteboards
      3. Mobile Computing
    27. Devices
    28. Head Mounted displays
    29. Gesture Tracing Device
    30. Head up displays
    31. Handheld devices
    32. Projectors & display walls
      1. Others
    33. GLOBAL AUGMENTED AND VIRTUAL REALITY IN EDUCATION MARKET, BY DEPLOYMENT
    34. MODEL
    35. Introduction
    36. Cloud
    37. On-premises
    38. GLOBAL AUGMENTED AND VIRTUAL REALITY IN EDUCATION MARKET, BY APPLICATION
      1. Introduction
      2. Classroom Learning
      3. Corporate Learning
    39. Management
    40. Certifications
    41. e-learning
    42. Virtual field trips
    43. Student Recruitment
    44. Others
    45. GLOBAL AUGMENTED AND VIRTUAL REALITY IN EDUCATION MARKET, BY END USERS
      1. Introduction
      2. Academic
        1. K-12
        2. Higher Education
        3. Vocational
      3. Corporate
        1. IT & Telecommunication
        2. BFSI
        3. Healthcare &
    46. Life sciences
    47. Retail & E-commerce
      1. Government & Public Sector
        1. Others
    48. GLOBAL AUGMENTED AND VIRTUAL REALITY IN EDUCATION
    49. MARKET, BY REGION
    50. Introduction
    51. North America
    52. Market Size & Estimates, by Offering 2019–2027
      1. Market Size & Estimates, by Devices,
    53. Market Size & Estimates, by Deployment Model, 2019–2027
      1. Market Size & Estimates,
    54. by Application, 2019–2027
      1. Market Size & Estimates, by End Users, 2019–2027
        1. Market Size &
    55. Estimates, by Region, 2018–2026
      1. US
        1. Market Size & Estimates, by Offering 2019–2027
    56. & Estimates, by Devices, 2019–2027
      1. Market Size & Estimates, by Deployment
    57. Model, 2019–2027
    58. Market Size & Estimates, by Application, 2019–2027
      1. Market Size & Estimates, by End Users,
    59. Canada
    60. Market Size & Estimates, by Offering 2019–2027
      1. Market Size & Estimates, by Devices,
    61. Market Size & Estimates, by Deployment Model, 2019–2027
      1. Market Size & Estimates,
    62. by Application, 2019–2027
      1. Market Size & Estimates, by End Users, 2019–2027
        1. Mexico
    63. & Estimates, by Offering 2019–2027
      1. Market Size & Estimates, by Devices,
    64. Market Size & Estimates, by Deployment Model, 2019–2027
      1. Market Size & Estimates,
    65. by Application, 2019–2027
      1. Market Size & Estimates, by End Users, 2019–2027
      2. Europe
        1. Market Size &
    66. Estimates, by Offering 2019–2027
      1. Market Size & Estimates, by Devices, 2019–2027
        1. Market Size &
    67. Estimates, by Deployment Model, 2019–2027
      1. Market Size & Estimates, by Application,
    68. Market Size & Estimates, by End Users, 2019–2027
      1. Germany
        1. Market Size & Estimates, by Offering
    69. Market Size & Estimates, by Devices, 2019–2027
      1. Market Size & Estimates, by Deployment
    70. Model, 2019–2027
    71. Market Size & Estimates, by Application, 2019–2027
      1. Market Size & Estimates, by End Users,
    72. France
    73. Market Size & Estimates, by Offering 2019–2027
      1. Market Size & Estimates, by Devices,
    74. Market Size & Estimates, by Deployment Model, 2019–2027
      1. Market Size & Estimates,
    75. by Application, 2019–2027
      1. Market Size & Estimates, by End Users, 2019–2027
        1. UK
    76. & Estimates, by Offering 2019–2027
      1. Market Size & Estimates, by Devices,
    77. Market Size & Estimates, by Deployment Model, 2019–2027
      1. Market Size & Estimates,
    78. by Application, 2019–2027
      1. Market Size & Estimates, by End Users, 2019–2027
        1. Rest of Europe
    79. & Estimates, by Offering 2019–2027
      1. Market Size & Estimates, by Devices,
    80. Market Size & Estimates, by Deployment Model, 2019–2027
      1. Market Size & Estimates,
    81. by Application, 2019–2027
      1. Market Size & Estimates, by End Users, 2019–2027
      2. Asia-Pacific
        1. Market Size &
    82. Estimates, by Offering 2019–2027
      1. Market Size & Estimates, by Devices, 2019–2027
        1. Market Size &
    83. Estimates, by Deployment Model, 2019–2027
      1. Market Size & Estimates, by Application,
    84. Market Size & Estimates, by End Users, 2019–2027
      1. China
        1. Market Size & Estimates, by Offering
    85. Market Size & Estimates, by Devices, 2019–2027
      1. Market Size & Estimates, by Deployment
    86. Model, 2019–2027
    87. Market Size & Estimates, by Application, 2019–2027
      1. Market Size & Estimates, by End Users,
    88. Japan
    89. Market Size & Estimates, by Offering 2019–2027
      1. Market Size & Estimates, by Devices,
    90. Market Size & Estimates, by Deployment Model, 2019–2027
      1. Market Size & Estimates,
    91. by Application, 2019–2027
      1. Market Size & Estimates, by End Users, 2019–2027
        1. India
    92. & Estimates, by Offering 2019–2027
      1. Market Size & Estimates, by Devices,
    93. Market Size & Estimates, by Deployment Model, 2019–2027
      1. Market Size & Estimates,
    94. by Application, 2019–2027
      1. Market Size & Estimates, by End Users, 2019–2027
        1. Rest of Asia-Pacific
    95. & Estimates, by Offering 2019–2027
      1. Market Size & Estimates, by Devices,
    96. Market Size & Estimates, by Deployment Model, 2019–2027
      1. Market Size & Estimates,
    97. by Application, 2019–2027
      1. Market Size & Estimates, by End Users, 2019–2027
      2. Middle East &
    98. Africa
    99. Market Size & Estimates, by Offering 2019–2027
      1. Market Size & Estimates, by Devices,
    100. Market Size & Estimates, by Deployment Model, 2019–2027
      1. Market Size & Estimates,
    101. by Application, 2019–2027
      1. Market Size & Estimates, by End Users, 2019–2027
      2. South America
        1. Market Size
    102. & Estimates, by Offering 2019–2027
      1. Market Size & Estimates, by Devices,
    103. Market Size & Estimates, by Deployment Model, 2019–2027
      1. Market Size & Estimates,
    104. by Application, 2019–2027
      1. Market Size & Estimates, by End Users, 2019–2027
    105. COMPETITIVE LANDSCAPE
      1. Introduction
      2. Key Players Market
    106. Share Analysis, 2021 (%)
      1. Competitive Benchmarking
      2. Competitor Dashboard
      3. Major Growth Strategy in the Market
      4. Key Developments
    107. & Growth Strategies
      1. Product Developments
        1. Mergers & Acquisitions
        2. Contracts & Agreements
    108. COMPANY PROFILES
      1. Sony
        1. Company Overview
        2. Financial Overview
        3. Products Offered
        4. Key Developments
        5. SWOT Analysis
        6. Key Strategies
      2. Samsung Electronics
        1. Company Overview
        2. Financial Overview
        3. Products Offered
        4. Key Developments
        5. SWOT Analysis
        6. Key Strategies
      3. HTC
        1. Company Overview
        2. Financial Overview
        3. Products Offered
        4. Key Developments
        5. SWOT Analysis
        6. Key Strategies
      4. Google
        1. Company Overview
        2. Financial Overview
        3. Products Offered
        4. Key Developments
        5. SWOT Analysis
        6. Key Strategies
      5. Microsoft
        1. Company Overview
        2. Financial Overview
        3. Products Offered
        4. Key Developments
        5. SWOT Analysis
        6. Key Strategies
      6. Panasonic
        1. Company Overview
        2. Financial Overview
        3. Products Offered
        4. Key Developments
        5. SWOT Analysis
        6. Key Strategies
      7. Hitachi
        1. Company Overview
        2. Financial Overview
        3. Products Offered
        4. Key Developments
        5. SWOT Analysis
        6. Key Strategies
      8. Barco
        1. Company Overview
        2. Financial Overview
        3. Products Offered
        4. Key Developments
        5. SWOT Analysis
        6. Key Strategies
      9. LG Electronics
        1. Company Overview
        2. Financial Overview
        3. Products Offered
        4. Key Developments
        5. SWOT Analysis
        6. Key Strategies
      10. Veative Labs
        1. Company Overview
        2. Financial Overview
        3. Products Offered
        4. Key Developments
        5. SWOT Analysis
        6. Key Strategies
      11. Cisco
        1. Company Overview
        2. Financial Overview
        3. Products Offered
        4. Key Developments
        5. SWOT Analysis
        6. Key Strategies
      12. Blackboard
        1. Company Overview
        2. Financial Overview
        3. Products Offered
        4. Key Developments
        5. SWOT Analysis
        6. Key Strategies
      13. Dell
        1. Company Overview
        2. Financial Overview
        3. Products Offered
        4. Key Developments
        5. SWOT Analysis
        6. Key Strategies
      14. SIBM
        1. Company Overview
        2. Financial Overview
        3. Products Offered
        4. Key Developments
        5. SWOT Analysis
        6. Key Strategies
      15. Saba Software
        1. Company Overview
        2. Financial Overview
        3. Products Offered
        4. Key Developments
        5. SWOT Analysis
        6. Key Strategies
    109. APPENDIX
      1. Discussion Blueprint
    110. AND VIRTUAL REALITY IN EDUCATION MARKET, BY OFFERING, 2019–2027 (USD MILLION)
    111. AND VIRTUAL REALITY IN EDUCATION MARKET, BY DEPLOYMENT MODEL, 2019–2027 (USD
    112. MILLION)
    113. GLOBAL AUGMENTED AND VIRTUAL REALITY IN EDUCATION MARKET, BY DEVICES, 2019–2027
    114. (USD MILLION)
    115. GLOBAL AUGMENTED AND VIRTUAL REALITY IN EDUCATION MARKET, BY APPLICATION, 2019–2027
    116. (USD MILLION)
    117. GLOBAL AUGMENTED AND VIRTUAL REALITY IN EDUCATION MARKET, BY END USERS, 2019–2027
    118. (USD MILLION)
    119. GLOBAL AUGMENTED AND VIRTUAL REALITY IN EDUCATION MARKET, BY REGION, 2019–2027
    120. (USD MILLION)
    121. NORTH AMERICA: AUGMENTED AND VIRTUAL REALITY IN EDUCATION MARKET, BY COUNTRY,
    122. –2027 (USD MILLION)
    123. MARKET, BY OFFERING, 2019–2027 (USD MILLION)
    124. IN EDUCATION MARKET, BY DEPLOYMENT MODEL, 2019–2027 (USD MILLION)
    125. AUGMENTED AND VIRTUAL REALITY IN EDUCATION MARKET, BY DEVICES, 2019–2027 (USD
    126. MILLION)
    127. NORTH AMERICA: AUGMENTED AND VIRTUAL REALITY IN EDUCATION MARKET, BY APPLICATION,
    128. –2027 (USD MILLION)
    129. MARKET, BY END USERS, 2019–2027 (USD MILLION)
    130. MARKET, BY OFFERING, 2019–2027 (USD MILLION)
    131. MARKET, BY DEPLOYMENT MODEL, 2019–2027 (USD MILLION)
    132. MARKET, BY DEVICES, 2019–2027 (USD MILLION)
    133. MARKET, BY APPLICATION, 2019–2027 (USD MILLION)
    134. MARKET, BY END USERS, 2019–2027 (USD MILLION)
    135. EDUCATION MARKET, BY OFFERING, 2019–2027 (USD MILLION)
    136. EDUCATION MARKET, BY DEPLOYMENT MODEL, 2019–2027 (USD MILLION)
    137. VIRTUAL REALITY IN EDUCATION MARKET, BY DEVICES, 2019–2027 (USD MILLION)
    138. AND VIRTUAL REALITY IN EDUCATION MARKET, BY APPLICATION, 2019–2027 (USD MILLION)
    139. AND VIRTUAL REALITY IN EDUCATION MARKET, BY END USERS, 2019–2027 (USD MILLION)
    140. AND VIRTUAL REALITY IN EDUCATION MARKET, BY OFFERING, 2019–2027 (USD MILLION)
    141. AND VIRTUAL REALITY IN EDUCATION MARKET, BY DEPLOYMENT MODEL, 2019–2027 (USD
    142. MILLION)
    143. MEXICO: AUGMENTED AND VIRTUAL REALITY IN EDUCATION MARKET, BY DEVICES, 2019–2027
    144. (USD MILLION)
    145. MEXICO: AUGMENTED AND VIRTUAL REALITY IN EDUCATION MARKET, BY APPLICATION, 2019–2027
    146. (USD MILLION)
    147. MEXICO: AUGMENTED AND VIRTUAL REALITY IN EDUCATION MARKET, BY END USERS, 2019–2027
    148. (USD MILLION)
    149. EUROPE: AUGMENTED AND VIRTUAL REALITY IN EDUCATION MARKET, BY COUNTRY, 2019–2027
    150. (USD MILLION)
    151. EUROPE: AUGMENTED AND VIRTUAL REALITY IN EDUCATION MARKET, BY OFFERING, 2019–2027
    152. (USD MILLION)
    153. EUROPE: AUGMENTED AND VIRTUAL REALITY IN EDUCATION MARKET, BY DEPLOYMENT MODEL,
    154. –2027 (USD MILLION)
    155. BY DEVICES, 2019–2027 (USD MILLION)
    156. EDUCATION MARKET, BY APPLICATION, 2019–2027 (USD MILLION)
    157. VIRTUAL REALITY IN EDUCATION MARKET, BY END USERS, 2019–2027 (USD MILLION)
    158. AND VIRTUAL REALITY IN EDUCATION MARKET, BY OFFERING, 2019–2027 (USD MILLION)
    159. AND VIRTUAL REALITY IN EDUCATION MARKET, BY DEPLOYMENT MODEL, 2019–2027 (USD
    160. MILLION)
    161. UK: AUGMENTED AND VIRTUAL REALITY IN EDUCATION MARKET, BY DEVICES, 2019–2027
    162. (USD MILLION)
    163. UK: AUGMENTED AND VIRTUAL REALITY IN EDUCATION MARKET, BY APPLICATION, 2019–2027
    164. (USD MILLION)
    165. UK: AUGMENTED AND VIRTUAL REALITY IN EDUCATION MARKET, BY END USERS, 2019–2027
    166. (USD MILLION)
    167. AND VIRTUAL REALITY IN EDUCATION MARKET, BY OFFERING, 2019–2027 (USD MILLION)
    168. AND VIRTUAL REALITY IN EDUCATION MARKET, BY DEPLOYMENT MODEL, 2019–2027 (USD
    169. MILLION)
    170. GERMANY: AUGMENTED AND VIRTUAL REALITY IN EDUCATION MARKET, BY DEVICES, 2019–2027
    171. (USD MILLION)
    172. GERMANY: AUGMENTED AND VIRTUAL REALITY IN EDUCATION MARKET, BY APPLICATION, 2019–2027
    173. (USD MILLION)
    174. GERMANY: AUGMENTED AND VIRTUAL REALITY IN EDUCATION MARKET, BY END USERS, 2019–2027
    175. (USD MILLION)
    176. FRANCE: AUGMENTED AND VIRTUAL REALITY IN EDUCATION MARKET, BY OFFERING, 2019–2027
    177. (USD MILLION)
    178. FRANCE: AUGMENTED AND VIRTUAL REALITY IN EDUCATION MARKET, BY DEPLOYMENT MODEL,
    179. –2027 (USD MILLION)
    180. BY DEVICES, 2019–2027 (USD MILLION)
    181. EDUCATION MARKET, BY APPLICATION, 2019–2027 (USD MILLION)
    182. VIRTUAL REALITY IN EDUCATION MARKET, BY END USERS, 2019–2027 (USD MILLION)
    183. AUGMENTED AND VIRTUAL REALITY IN EDUCATION MARKET, BY OFFERING, 2019–2027
    184. (USD MILLION)
    185. REST OF EUROPE: AUGMENTED AND VIRTUAL REALITY IN EDUCATION MARKET, BY DEPLOYMENT
    186. MODEL, 2019–2027 (USD MILLION)
    187. EDUCATION MARKET, BY DEVICES, 2019–2027 (USD MILLION)
    188. IN EDUCATION MARKET, BY APPLICATION, 2019–2027 (USD MILLION)
    189. AND VIRTUAL REALITY IN EDUCATION MARKET, BY END USERS, 2019–2027 (USD MILLION)
    190. AUGMENTED AND VIRTUAL REALITY IN EDUCATION MARKET, BY COUNTRY, 2019–2027 (USD
    191. MILLION)
    192. ASIA-PACIFIC: AUGMENTED AND VIRTUAL REALITY IN EDUCATION MARKET, BY OFFERING,
    193. –2027 (USD MILLION)
    194. BY DEPLOYMENT MODEL, 2019–2027 (USD MILLION)
    195. IN EDUCATION MARKET, BY DEVICES, 2019–2027 (USD MILLION)
    196. AND VIRTUAL REALITY IN EDUCATION MARKET, BY APPLICATION, 2019–2027 (USD MILLION)
    197. AUGMENTED AND VIRTUAL REALITY IN EDUCATION MARKET, BY END USERS, 2019–2027
    198. (USD MILLION)
    199. CHINA: AUGMENTED AND VIRTUAL REALITY IN EDUCATION MARKET, BY OFFERING, 2019–2027
    200. (USD MILLION)
    201. CHINA: AUGMENTED AND VIRTUAL REALITY IN EDUCATION MARKET, BY DEPLOYMENT, 2019–2027
    202. (USD MILLION)
    203. CHINA: AUGMENTED AND VIRTUAL REALITY IN EDUCATION MARKET, BY APPLICATION, 2019–2027
    204. (USD MILLION)
    205. CHINA: AUGMENTED AND VIRTUAL REALITY IN EDUCATION MARKET, BY END USERS, 2019–2027
    206. (USD MILLION)
    207. CHINA: AUGMENTED AND VIRTUAL REALITY IN EDUCATION MARKET, BY DEVICES, 2019–2027
    208. (USD MILLION)
    209. INDIA: AUGMENTED AND VIRTUAL REALITY IN EDUCATION MARKET, BY OFFERING, 2019–2027
    210. (USD MILLION)
    211. INDIA: AUGMENTED AND VIRTUAL REALITY IN EDUCATION MARKET, BY DEPLOYMENT, 2019–2027
    212. (USD MILLION)
    213. INDIA: AUGMENTED AND VIRTUAL REALITY IN EDUCATION MARKET, BY APPLICATION, 2019–2027
    214. (USD MILLION)
    215. INDIA: AUGMENTED AND VIRTUAL REALITY IN EDUCATION MARKET, BY END USERS, 2019–2027
    216. (USD MILLION)
    217. INDIA: AUGMENTED AND VIRTUAL REALITY IN EDUCATION MARKET, BY DEVICES, 2019–2027
    218. (USD MILLION)
    219. JAPAN: AUGMENTED AND VIRTUAL REALITY IN EDUCATION MARKET, BY OFFERING, 2019–2027
    220. (USD MILLION)
    221. JAPAN: AUGMENTED AND VIRTUAL REALITY IN EDUCATION MARKET, BY DEPLOYMENT, 2019–2027
    222. (USD MILLION)
    223. JAPAN: AUGMENTED AND VIRTUAL REALITY IN EDUCATION MARKET, BY APPLICATION, 2019–2027
    224. (USD MILLION)
    225. JAPAN: AUGMENTED AND VIRTUAL REALITY IN EDUCATION MARKET, BY END USERS, 2019–2027
    226. (USD MILLION)
    227. JAPAN: AUGMENTED AND VIRTUAL REALITY IN EDUCATION MARKET, BY DEVICES, 2019–2027
    228. (USD MILLION)
    229. REST OF ASIA-PACIFIC: AUGMENTED AND VIRTUAL REALITY IN EDUCATION MARKET, BY OFFERING,
    230. –2027 (USD MILLION)
    231. MARKET, BY DEPLOYMENT, 2019–2027 (USD MILLION)
    232. REALITY IN EDUCATION MARKET, BY APPLICATION, 2019–2027 (USD MILLION)
    233. AUGMENTED AND VIRTUAL REALITY IN EDUCATION MARKET, BY END USERS, 2019–2027
    234. (USD MILLION)
    235. REST OF ASIA-PACIFIC: AUGMENTED AND VIRTUAL REALITY IN EDUCATION MARKET, BY DEVICES,
    236. –2027 (USD MILLION)
    237. REALITY IN EDUCATION MARKET, BY OFFERING, 2019–2027 (USD MILLION)
    238. & AFRICA: AUGMENTED AND VIRTUAL REALITY IN EDUCATION MARKET, BY DEPLOYMENT,
    239. –2027 (USD MILLION)
    240. EDUCATION MARKET, BY APPLICATION, 2019–2027 (USD MILLION)
    241. AUGMENTED AND VIRTUAL REALITY IN EDUCATION MARKET, BY END USERS, 2019–2027
    242. (USD MILLION)
    243. MIDDLE EAST & AFRICA: AUGMENTED AND VIRTUAL REALITY IN EDUCATION MARKET,
    244. BY DEVICES, 2019–2027 (USD MILLION)
    245. IN EDUCATION MARKET, BY OFFERING, 2019–2027 (USD MILLION)
    246. AND VIRTUAL REALITY IN EDUCATION MARKET, BY DEPLOYMENT, 2019–2027 (USD MILLION)
    247. AUGMENTED AND VIRTUAL REALITY IN EDUCATION MARKET, BY APPLICATION, 2019–2027
    248. (USD MILLION)
    249. SOUTH AMERICA: AUGMENTED AND VIRTUAL REALITY IN EDUCATION MARKET, BY END USERS,
    250. –2027 (USD MILLION)
    251. MARKET, BY DEVICES, 2019–2027 (USD MILLION)
    252. APPROACHES
    253. GLOBAL AUGMENTED AND VIRTUAL REALITY IN EDUCATION MARKET, BY OFFERING, 2019–2027
    254. (USD MILLION)
    255. GLOBAL AUGMENTED AND VIRTUAL REALITY IN EDUCATION MARKET, BY DEPLOYMENT, 2019–2027
    256. (USD MILLION)
    257. GLOBAL AUGMENTED AND VIRTUAL REALITY IN EDUCATION MARKET, BY APPLICATION, 2019–2027
    258. (USD MILLION)
    259. GLOBAL AUGMENTED AND VIRTUAL REALITY IN EDUCATION MARKET, BY REGION, 2019–2027
    260. (USD MILLION)
    261. NORTH AMERICA: AUGMENTED AND VIRTUAL REALITY IN EDUCATION MARKET, BY COUNTRY,
    262. –2027 (USD MILLION)
    263. MARKET, BY OFFERING, 2019–2027 (USD MILLION)
    264. IN EDUCATION MARKET, BY DEPLOYMENT, 2019–2027 (USD MILLION)
    265. AND VIRTUAL REALITY IN EDUCATION MARKET, BY APPLICATION, 2019–2027 (USD MILLION)
    266. AND VIRTUAL REALITY IN EDUCATION MARKET, BY COUNTRY, 2019–2027 (USD MILLION)
    267. AND VIRTUAL REALITY IN EDUCATION MARKET, BY OFFERING, 2019–2027 (USD MILLION)
    268. AND VIRTUAL REALITY IN EDUCATION MARKET, BY DEPLOYMENT, 2019–2027 (USD MILLION)
    269. AND VIRTUAL REALITY IN EDUCATION MARKET, BY APPLICATION, 2019–2027 (USD MILLION)
    270. AUGMENTED AND VIRTUAL REALITY IN EDUCATION MARKET, BY COUNTRY, 2019–2027 (USD
    271. MILLION)
    272. ASIA-PACIFIC: AUGMENTED AND VIRTUAL REALITY IN EDUCATION MARKET, BY OFFERING,
    273. –2027 (USD MILLION)
    274. MARKET, BY DEPLOYMENT, 2019–2027 (USD MILLION)
    275. IN EDUCATION MARKET, BY APPLICATION, 2019–2027 (USD MILLION)
    276. AUGMENTED AND VIRTUAL REALITY IN EDUCATION MARKET, BY OFFERING, 2019–2027
    277. (USD MILLION)
    278. MIDDLE EAST & AFRICA: AUGMENTED AND VIRTUAL REALITY IN EDUCATION MARKET,
    279. BY DEVICES, 2019–2027 (USD MILLION)
    280. VIRTUAL REALITY IN EDUCATION MARKET, BY DEPLOYMENT, 2019–2027 (USD MILLION)
    281. & AFRICA: AUGMENTED AND VIRTUAL REALITY IN EDUCATION MARKET, BY APPLICATION,
    282. –2027 (USD MILLION)
    283. MARKET, BY OFFERING, 2019–2027 (USD MILLION)
    284. IN EDUCATION MARKET, BY DEVICES, 2019–2027 (USD MILLION)
    285. AND VIRTUAL REALITY IN EDUCATION MARKET, BY DEPLOYMENT, 2019–2027 (USD MILLION)
    286. AUGMENTED AND VIRTUAL REALITY IN EDUCATION MARKET, BY APPLICATION, 2019–2027
    287. (USD MILLION)'

    Augmented and Virtual Reality in Education Market Segmentation

    Market Segmentation Overview

    • Detailed segmentation data will be available in the full report
    • Comprehensive analysis by multiple parameters
    • Regional and country-level breakdowns
    • Market size forecasts by segment
    Augmented and Virtual Reality in Education Market Research Report—Global Forecast till 2032 Infographic
    Free Sample Request

    Kindly complete the form below to receive a free sample of this Report

    Customer Strories

    “I am very pleased with how market segments have been defined in a relevant way for my purposes (such as "Portable Freezers & refrigerators" and "last-mile"). In general the report is well structured. Thanks very much for your efforts.”

    Victoria Milne Founder
    Case Study

    Chemicals and Materials