• Cat-intel
  • MedIntelliX
  • Resources
  • About Us
  • Request Free Sample ×

    Kindly complete the form below to receive a free sample of this Report

    Leading companies partner with us for data-driven Insights

    clients tt-cursor

    Material Handling Integration Market

    ID: MRFR/IA - E/29663-HCR
    100 Pages
    Snehal Singh
    September 2025

    Rapport d'étude de marché sur l'intégration de la manutention des matériaux par type d'intégration (intégration logicielle, intégration matérielle, intégration système), par secteur d'utilisation de l'utilisateur final (fabrication, vente au détail, aliments et boissons, pharmaceutique, automobile), par technologie (véhicules à guidage automatique (AGV), robotique, Solutions compatibles IoT, intelligence artificielle (IA)), par niveau d'automatisation des processus (manuel, semi-automatisé, entièrement automatisé), pa...

    Share:
    Download PDF ×

    We do not share your information with anyone. However, we may send you emails based on your report interest from time to time. You may contact us at any time to opt-out.

    Material Handling Integration Market Research Report — Global Forecast till 2034 Infographic
    Purchase Options
    $ 4 950,0
    $ 5 950,0
    $ 7 250,0
    Table of Contents

    Aperçu du marché mondial de l’intégration de la manutention

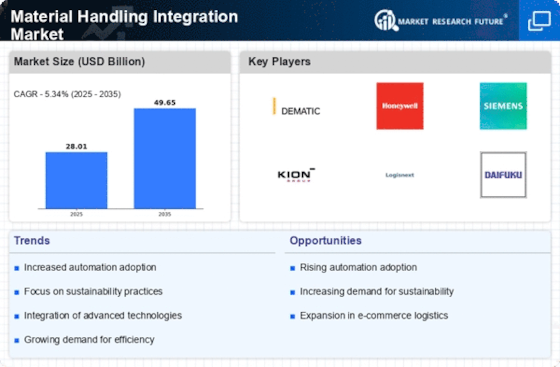
    Selon l'analyse MRFR, la taille du marché de l'intégration de la manutention des matériaux a été estimée à 23,96 (milliards USD) en 2022. L'industrie du marché de l'intégration de la manutention devrait passer de 25,24 (milliards USD) en 2023 à 40,3 (milliards USD) d'ici 2032. Le TCAC (taux de croissance) du marché de l’intégration de la manutention devrait être d’environ 5,34 % au cours de la période de prévision. (2024 - 2032).

    Les principales tendances du marché de l'intégration de la manutention mises en évidence

    Le marché de l’intégration de la manutention est fortement influencé par divers facteurs clés du marché qui façonnent sa trajectoire. L’automatisation croissante et le besoin croissant d’efficacité dans la gestion de la chaîne d’approvisionnement contribuent largement à cette croissance. Les entreprises s'efforcent continuellement d'optimiser leurs opérations, de réduire les coûts de main-d'œuvre et d'améliorer la productivité grâce à des solutions automatisées de manutention.

    En outre, l'essor du commerce électronique a entraîné une demande accrue de systèmes de logistique et d'entreposage sophistiqués, incitant les entreprises à investir dans des technologies avancées de manutention. L'accent mis sur les solutions de sécurité et d'ergonomie stimule également l'innovation, alors que les entreprises cherchent à minimiser les accidents du travail tout en maximisant l'efficacité opérationnelle.

    Au milieu de ces développements, plusieurs opportunités sont mûres pour l'exploration, en particulier dans des secteurs tels que la santé, les produits pharmaceutiques et l'alimentation et les boissons. Alors que les entreprises cherchent à moderniser leurs opérations, l'intégration de l'Internet des objets (IoT) et de l'intelligence artificielle (IA) dans les processus de manutention peut rationaliser les flux de travail, améliorer la gestion des stocks et fournir des analyses de données en temps réel. En outre, la durabilité reste une préoccupation urgente, encourageant les entreprises à adopter des pratiques respectueuses de l'environnement grâce à l'utilisation d'équipements de manutention électriques et économes en énergie.

    Les tendances récentes indiquent une évolution vers des robots collaboratifs et des véhicules à guidage automatique, améliorant considérablement la flexibilité et la réactivité des systèmes de manutention. De plus, alors que les entreprises accordent de plus en plus la priorité à une visibilité de bout en bout dans leurs chaînes d’approvisionnement, l’intégration de solutions logicielles avancées aux côtés du matériel devient de plus en plus répandue. Cette tendance transforme non seulement la logistique traditionnelle, mais ouvre également la voie à des approches innovantes en matière de manutention des matériaux, conduisant à terme le marché vers un avenir plus interconnecté et plus efficace.

    Aperçu du marché de l'intégration de la manutention

    Source : Recherche primaire, recherche secondaire, base de données MRFR et examen par les analystes

    Moteurs du marché de l'intégration de la manutention

    Demande accrue d'automatisation des processus de fabrication

    L'industrie du marché de l'intégration de la manutention connaît une croissance significative, tirée par la demande croissante d'automatisation dans divers processus de fabrication. Alors que les industries s’efforcent d’améliorer leur productivité et leur efficacité opérationnelle, il existe une forte tendance à adopter des solutions avancées de manutention intégrant des technologies d’automatisation. Cette intégration ne concerne pas seulement la rationalisation de la logistique, mais implique également l'optimisation de la gestion des entrepôts, du contrôle des stocks et des systèmes de transport.

    Le passage des processus manuels aux systèmes automatisés est essentiel pour répondre aux défis croissants liés aux attentes des clients, aux délais d'exécution plus rapides et à la minimisation des erreurs de manutention. De plus, les solutions automatisées offrent de meilleures mesures de sécurité en réduisant le besoin d'intervention humaine dans des environnements potentiellement dangereux.

    Les avancées technologiques en cours dans les domaines de la robotique, de l'intelligence artificielle et de l'Internet des objets (IoT) ouvrent la voie à des systèmes d'intégration de manutention plus intelligents et plus efficaces. Avec des coûts opérationnels inférieurs et une fiabilité accrue, les entreprises sont plus enclines à investir dans de tels systèmes, ce qui, à son tour, fait progresser considérablement le marché de l'intégration de la manutention.

    Croissance du commerce électronique et de la vente au détail en ligne

    L'essor du commerce électronique et de la vente au détail en ligne est un moteur important pour l'industrie du marché de l'intégration de la manutention. À mesure que les préférences des consommateurs se tournent vers les achats en ligne, il existe une augmentation notable de la demande de solutions de manutention efficaces capables de prendre en charge une exécution et une livraison rapides des commandes. Les détaillants doivent optimiser leurs opérations logistiques et d’entrepôt pour gérer efficacement le volume croissant de commandes. Cette évolution du commerce de détail nécessite la mise en œuvre de systèmes intégrés de manutention capables de traiter, trier et expédier rapidement les produits, ce qui en fait un facteur essentiel pour la croissance du marché.

    Focus sur l'optimisation de la chaîne d'approvisionnement

    Les entreprises se concentrent de plus en plus sur l’optimisation de leurs chaînes d’approvisionnement, ce qui constitue un moteur clé pour l’industrie du marché de l’intégration de la manutention des matériaux. La pandémie a mis en évidence les vulnérabilités des chaînes d’approvisionnement, incitant les entreprises à adopter des solutions intégrées de manutention qui améliorent la transparence et l’efficacité. En minimisant les retards et en améliorant l'allocation des ressources, les entreprises peuvent répondre avec plus de flexibilité aux demandes du marché, stimulant ainsi la demande de systèmes d'intégration avancés.

    Aperçu du segment de marché de l'intégration de la manutention des matériaux

    Intégration de la manutention des matériaux : informations sur le type d'intégration du marché

    Le marché de l'intégration de la manutention se caractérise par sa diversité en termes de types d'intégration, avec un accent particulier sur l'intégration logicielle, l'intégration matérielle et l'intégration système, chacune jouant un rôle crucial dans la structure globale du marché. En 2023, les revenus du marché de l'intégration de la manutention s'élèvent à environ 25,24 milliards USD, ce qui démontre une base solide pour la croissance de ce secteur.

    Parmi les différents types d'intégration, l'intégration logicielle est en tête avec une valorisation substantielle de 10,0 milliards de dollars, ce qui indique sa demande considérable alors que les organisations cherchent à améliorer leur efficacité opérationnelle grâce à des solutions logicielles sophistiquées qui gèrent les flux de travail, la synchronisation des données et la gestion de projet. La domination de l'intégration logicielle est principalement attribuée à la complexité croissante des opérations dans divers secteurs, nécessitant le partage de données en temps réel et la connectivité entre différents systèmes de manutention, stimulant ainsi la croissance de son marché.

    En suivant de près, l'intégration matérielle est évaluée à 7,5 milliards de dollars en 2023, et son importance réside dans l'incorporation physique de technologies qui facilitent le mouvement et le stockage des marchandises. L'intégration matérielle englobe une large gamme d'équipements tels que des convoyeurs, des véhicules à guidage automatique et des robots, qui constituent l'épine dorsale des systèmes de manutention. La nécessité d'une connexion physique et d'une compatibilité entre les différents composants matériels joue un rôle clé pour garantir l'efficacité opérationnelle et minimiser les temps d'arrêt, renforçant ainsi sa présence significative dans le paysage du marché.

    L'intégration de systèmes, évaluée à 7,74 milliards de dollars en 2023, se concentre sur la liaison complète de divers sous-systèmes en une seule unité cohérente. Ce type d'intégration est essentiel pour créer des flux de travail efficaces et optimiser les performances globales des systèmes de manutention. En rationalisant les processus et en éliminant les redondances, l'intégration de systèmes contribue à une productivité accrue que de nombreuses organisations recherchent activement.

    La segmentation du marché de l'intégration de la manutention reflète des distinctions claires au sein des types d'intégration, chacun contribuant de manière unique à la dynamique globale du secteur. Malgré les valorisations comparables de l'intégration matérielle et système, c'est l'intégration logicielle qui détient la majorité. Cela illustre une tendance selon laquelle les organisations donnent la priorité aux solutions intelligentes qui offrent flexibilité et adaptabilité dans la gestion des matériaux.

    Les tendances du marché mettent également en évidence une opportunité de croissance tirée par une automatisation accrue et une attention croissante portée aux solutions d'entreposage intelligentes, qui intègrent des technologies avancées telles que l'intelligence artificielle (IA) et l'Internet des objets (IoT) pour faciliter une prise de décision améliorée. capacités de fabrication. Cependant, il est essentiel de reconnaître les défis posés par les progrès technologiques et les coûts d'investissement qui peuvent empêcher certaines organisations de tirer pleinement parti de ces possibilités d'intégration, posant ainsi des limites potentielles à leur efficacité opérationnelle. En résumé, le marché de l'intégration de la manutention présente une interaction cruciale entre l'intégration des logiciels, du matériel et des systèmes, chaque segment offrant des avantages et des opportunités distincts qui contribuent à l'environnement de marché en plein essor.

    Intégration de la manutention des matériaux - Informations sur le type d'intégration du marché  

    Source : Recherche primaire, recherche secondaire, base de données MRFR et examen par les analystes

    Aperçu de l'industrie des utilisateurs finaux du marché de l'intégration de la manutention des matériaux

    Le marché de l'intégration de la manutention connaît une croissance significative, avec une valeur estimée à 25,24 milliards USD en 2023 et devrait atteindre des niveaux plus élevés d'ici 2032. L'industrie des utilisateurs finaux joue un rôle crucial dans cette expansion. Au sein de ce segment, l’industrie manufacturière est un acteur clé, motivée par les exigences croissantes en matière d’automatisation et d’efficacité. Le commerce de détail apparaît également comme un contributeur majeur, l'essor du commerce électronique alimentant la demande de solutions efficaces de manutention. De plus, le secteur de l'alimentation et des boissons met l'accent sur des normes strictes de conformité et de sécurité, renforçant ainsi le besoin de systèmes d'intégration avancés.

    L'industrie pharmaceutique souligne l'importance de la précision et de l'exactitude dans la manipulation des matériaux, en particulier pour les produits sensibles. Le secteur automobile, caractérisé par des chaînes d'assemblage complexes, nécessite des processus de manutention fluides pour maintenir la productivité. Collectivement, ces secteurs sont façonnés par des tendances telles que l'augmentation des coûts de main-d'œuvre et le besoin d'efficacité opérationnelle, révélant des opportunités de solutions innovantes qui améliorent la productivité et la sécurité des processus de manutention. Les données du marché de l'intégration de la manutention reflètent une industrie résiliente, prête à croître dans ces secteurs clés.

    Aperçu technologique du marché de l'intégration de la manutention des matériaux 

    Le marché de l'intégration de la manutention, axé sur le segment technologique, était évalué à 25,24 milliards de dollars en 2023 et devrait connaître une croissance constante. L'intégration des véhicules à guidage automatique (AGV) est devenue un facteur clé dans l'amélioration de l'efficacité opérationnelle en automatisant les tâches de transport dans les entrepôts et les unités de fabrication, jouant ainsi un rôle important dans le paysage du marché. La technologie robotique permet une précision et une polyvalence accrues dans la manipulation des matériaux, renforçant ainsi son importance dans la logistique moderne.

    Les solutions compatibles IoT offrent une analyse et une connectivité des données en temps réel, facilitant une prise de décision plus intelligente et optimisant la gestion des stocks. De plus, l’intelligence artificielle (IA) confère aux systèmes des capacités prédictives avancées, améliorant considérablement la productivité et l’allocation des ressources. Ensemble, ces technologies contribuent aux tendances croissantes en matière d’automatisation observées sur le marché de l’intégration de la manutention, améliorant ainsi la productivité tout en répondant aux pénuries de main-d’œuvre et aux défis opérationnels. Alors que les organisations cherchent à rationaliser leurs processus, l'intégration de ces technologies améliore non seulement l'efficacité mais ouvre également de nouvelles voies d'innovation et de développement.croissance dans la dynamique du marché.

    Intégration de la manutention des matériaux - Informations sur le niveau d'automatisation des processus du marché   

    Le marché de l'intégration de la manutention, en particulier au niveau de l'automatisation des processus, reflète une trajectoire de croissance robuste, avec un marché global évalué à 25,24 milliards de dollars en 2023 et démontre une augmentation notable prévue pour les années à venir. Ce segment est divisé en différents niveaux opérationnels, qui sont manuels, semi-automatisés et entièrement automatisés. La tendance croissante vers l’automatisation est motivée par la nécessité d’accroître l’efficacité et de réduire les coûts opérationnels. Les solutions entièrement automatisées améliorent considérablement la productivité et la précision, ce qui en fait un choix privilégié pour de nombreux secteurs, tandis que les systèmes semi-automatisés offrent une approche équilibrée aux entreprises en transition vers une automatisation complète.

    La manutention manuelle joue toujours un rôle essentiel dans les secteurs où la surveillance humaine est critique, représentant une part importante du marché. Les statistiques du marché de l’intégration de la manutention soulignent que la demande d’automatisation est stimulée par les progrès technologiques, associés à l’accent croissant mis sur la sécurité sur le lieu de travail et l’efficacité opérationnelle. Toutefois, des défis tels que les coûts d’investissement initiaux élevés et le besoin de main-d’œuvre qualifiée persistent. Dans l'ensemble, la segmentation au sein du niveau d'automatisation des processus souligne les divers besoins des entreprises qui s'efforcent d'optimiser leurs opérations de manutention, offrant ainsi de nombreuses opportunités de croissance au sein de l'industrie.

    Informations sur les applications du marché de l'intégration de la manutention des matériaux 

    Le marché de l'intégration de la manutention se concentre de manière significative sur le segment des applications, qui englobe des fonctions critiques vitales pour l'efficience et l'efficacité opérationnelles dans diverses industries. En 2023, le marché global est évalué à 25,24 milliards USD, reflétant une demande robuste tirée par la complexité croissante des chaînes d'approvisionnement et le besoin continu d'automatisation et de gestion optimisée des stocks. Dans ce paysage, la gestion des entrepôts joue un rôle majeur, garantissant une utilisation optimale de l'espace et des opérations logistiques rationalisées, tandis que la gestion des stocks est essentielle pour maintenir des niveaux de stock précis et minimiser les coûts, soulignant ainsi son importance dans l'amélioration de la rentabilité.

    L'exécution des commandes est un autre domaine crucial, ayant un impact direct sur la satisfaction des clients grâce à un traitement et une livraison efficaces des produits, présentant ainsi une opportunité de croissance significative. De plus, la gestion des transports améliore non seulement l'efficacité des livraisons, mais contribue également à la visibilité globale de la chaîne d'approvisionnement. Ces applications représentent collectivement un aspect dynamique du marché de l’intégration de la manutention, avec des tendances indiquant une poussée vers une plus grande automatisation et intégration de solutions technologiques pour relever les défis de l’industrie. La demande croissante pour ces applications continue de façonner le paysage du marché, influençant finalement les revenus du marché de l'intégration de la manutention ainsi que sa segmentation.

    Aperçu régional du marché de l'intégration de la manutention des matériaux 

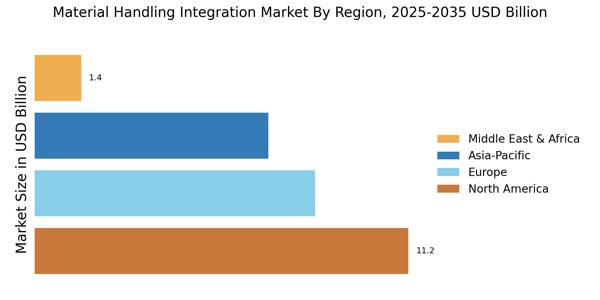
    Le marché de l'intégration de la manutention devrait atteindre des valorisations importantes dans diverses régions jusqu'en 2032. En 2023, l'Amérique du Nord détient une part majoritaire avec une valorisation de 10,0 milliards de dollars, soulignant sa domination sur le marché grâce à une logistique et une fabrication avancées. secteurs. L'Europe suit de près avec une valorisation de 7,5 milliards USD, bénéficiant de sa solide base industrielle et de ses avancées technologiques. La région Asie-Pacifique, évaluée à 5,0 milliards de dollars en 2023, présente un potentiel de croissance considérable, tiré par la demande croissante d'automatisation dans les économies émergentes.

    La région Moyen-Orient et Afrique, avec une valorisation de 1,74 milliard de dollars, indique une croissance constante à mesure que l'industrialisation augmente la demande de solutions de manutention. L’Amérique du Sud, bien que sa valorisation soit inférieure à 1,0 milliard de dollars, présente des opportunités uniques de croissance tirées par le développement des infrastructures. Chaque région contribue de manière unique aux revenus du marché de l'intégration de la manutention, l'Amérique du Nord et l'Europe étant les plus importantes, reflétant leurs infrastructures établies et leurs avancées technologiques, tandis que la région Asie-Pacifique est positionnée pour une croissance plus rapide.Aperçu régional du marché de l'intégration de la manutention des matériaux   

    Source : Recherche primaire, recherche secondaire, base de données MRFR et examen par les analystes

    Acteurs clés du marché de l’intégration de la manutention et perspectives concurrentielles

    Le marché de l'intégration de la manutention se caractérise par un paysage en évolution rapide, motivé par les progrès technologiques et l'automatisation croissante. Alors que les industries s’efforcent d’améliorer leur efficacité opérationnelle, l’intégration des systèmes de manutention est devenue un objectif stratégique pour les entreprises en quête d’avantages concurrentiels. Les principaux acteurs tirent parti de technologies avancées telles que la robotique, l’intelligence artificielle et l’Internet des objets (IoT) pour améliorer leur offre de produits, rationaliser leurs opérations et accroître la satisfaction de leurs clients. Cela a favorisé un environnement hautement compétitif dans lequel l’innovation et l’adaptabilité sont essentielles au succès. Le marché est témoin d'une vague de fusions, d'acquisitions et de partenariats stratégiques alors que les entreprises cherchent à consolider leurs positions et à étendre leurs capacités pour répondre aux diverses demandes des divers secteurs d'utilisateurs finaux.

    Daifuku se distingue sur le marché de l'intégration de la manutention des matériaux grâce à son portefeuille de produits robuste et à sa solide réputation en matière de qualité et de fiabilité. L'entreprise excelle dans la fourniture de solutions sur mesure qui répondent aux besoins spécifiques de divers secteurs, notamment la vente au détail, la fabrication et la logistique. Ses systèmes automatisés avancés, notamment des convoyeurs, des trieurs et des véhicules à guidage automatique, reflètent un engagement à tirer parti d'une technologie de pointe pour améliorer l'efficacité opérationnelle. La capacité de Daifuku à intégrer de manière transparente des systèmes complexes favorise un avantage concurrentiel, permettant aux entreprises d'améliorer leur flux de travail et de réduire leurs coûts opérationnels. La présence mondiale étendue de l'entreprise et ses solides relations avec ses clients renforcent encore sa position sur le marché, lui permettant de capitaliser sur les opportunités de croissance et de répondre efficacement à l'évolution de la dynamique du marché.

    Le groupe KION s'est imposé comme un acteur important sur le marché de l'intégration de la manutention grâce à sa suite complète de produits et de solutions adaptés à l'automatisation logistique. L'accent mis par l'entreprise sur l'innovation est évident dans l'accent mis sur la recherche et le développement, conduisant à la création de solutions intralogistiques sophistiquées comprenant des systèmes d'entrepôt automatisés et des logiciels avancés pour la gestion des chaînes d'approvisionnement. L'orientation stratégique du groupe KION sur la durabilité et l'efficacité énergétique l'a également positionné favorablement sur le marché alors que les industries accordent de plus en plus la priorité aux pratiques respectueuses de l'environnement. Sa forte présence sur le marché, ses solides performances financières et son engagement à améliorer l'expérience client grâce à une technologie de pointe renforcent encore sa position concurrentielle dans le domaine de l'intégration de la manutention. En conséquence, le groupe KION est prêt à capitaliser sur les tendances émergentes et à s'adapter à l'évolution des besoins des clients, s'assurant ainsi une position significative sur le marché.

    Les entreprises clés du marché de l'intégration de la manutention comprennent

    • Daifuku
    • Groupe KION
    • Solutions Bastian
    • Schneider Electric
    • SSI Schäfer
    • Siemens
    • Honeywell Intelligrated
    • Dématique
    • Groupe logistique TGW
    • Yale Materials Handling Corporation
    • Interroll
    • Groupe MHI
    • Mecalux
    • Vanderlande
    • Manipulation des matériaux HysterYale

    Développements de l'industrie du marché de l'intégration de la manutention

    Les développements récents sur le marché de l'intégration de la manutention indiquent un accent croissant sur l'automatisation et l'intégration technologique dans les secteurs de la logistique et de l'entreposage. Les entreprises adoptent de plus en plus la robotique avancée, l’intelligence artificielle et l’analyse des données pour améliorer leur efficacité et réduire leurs coûts opérationnels. Le marché a connu des investissements importants dans des solutions d'automatisation qui facilitent la gestion des stocks en temps réel et améliorent la visibilité de la chaîne d'approvisionnement. De plus, la durabilité dans les pratiques de manutention des matériaux est devenue une priorité, les organisations s'efforçant de minimiser l'impact environnemental en optimisant les flux de travail et en réduisant la consommation d'énergie.

    Les partenariats entre les entreprises technologiques et les fabricants d'équipements de manutention ont également gagné du terrain, visant à créer des systèmes plus intelligents et adaptables. À mesure que le secteur continue d’évoluer, la demande accrue de solutions intégrées simplifiant les processus logistiques complexes devrait stimuler la croissance du marché de 2024 à 2032, alors que les entreprises cherchent à rester compétitives dans un paysage économique en constante évolution. La transition vers des entrepôts intelligents, pilotée par les capacités de l'IoT, devrait révolutionner les pratiques traditionnelles et redéfinir davantage les stratégies de manutention dans divers secteurs.

    Aperçu de la segmentation du marché de l'intégration de la manutention

    • Perspectives du type d'intégration du marché de l'intégration de la manutention
      • Intégration logicielle
      • Intégration matérielle
      • Intégration du système
    • Perspectives de l'industrie des utilisateurs finaux du marché de l'intégration de la manutention
      • Fabrication
      • Commerce de détail
      • Nourriture et boissons
      • Pharmaceutique
      • Automobile
    • Perspectives technologiques du marché de l'intégration de la manutention
      • Véhicules à guidage automatique (AGV)
      • Robotique
      • Solutions compatibles IoT
      • Intelligence artificielle (IA)
    • Perspectives du niveau d'automatisation des processus du marché de l'intégration de la manutention des matériaux
      • Manuel
      • Semi-automatisé
      • Entièrement automatisé
    • Perspectives des applications du marché de l'intégration de la manutention
      • Gestion d'entrepôt
      • Gestion des stocks
      • Exécution des commandes
      • Gestion des transports
    • Perspectives régionales du marché de l'intégration de la manutention
      • Amérique du Nord
      • Europe
      • Amérique du Sud
      • Asie-Pacifique
      • Moyen-Orient et Afrique
    TABLE DES MATIÈRES 1. RÉSUMÉ EXÉCUTIF 1.1. Aperçu du marché 1.2. Principales conclusions 1.3. Segmentation du marché 1.4. Paysage concurrentiel 1.5. Défis et opportunités 1.6. Perspectives d'avenir 2. INTRODUCTION AU MARCHÉ 2.1. Définition 2.2. Périmètre de l'étude 2.2.1. Objectif de recherche 2.2.2. Hypothèse 2.2.3. Limites 3. METHODOLOGIE DE RECHERCHE 3.1. Présentation 3.2. Exploration de données 3.3. Recherche secondaire 3.4. Recherche primaire 3.4.1. Entretiens primaires et processus de collecte d'informations 3.4.2. Répartition des principaux répondants 3.5. Modèle de prévision 3.6. Estimation de la taille du marché 3.6.1. Approche ascendante 3.6.2. Approche descendante 3.7. Triangulation des données 3.8. Validation 4. DYNAMIQUE DU MARCHÉ 4.1. Présentation 4.2. Pilotes 4.3. Contraintes 4.4. Opportunités 5. ANALYSE DES FACTEURS DE MARCHÉ 5.1. Analyse de la chaîne de valeur 5.2. Analyse des cinq forces de Porter 5.2.1. Pouvoir de négociation des fournisseurs 5.2.2. Pouvoir de négociation des acheteurs 5.2.3. Menace des nouveaux entrants 5.2.4. Menace des remplaçants 5.2.5. Intensité de la rivalité 5.3. Analyse d'impact du COVID-19 5.3.1. Analyse d'impact sur le marché 5.3.2. Impact régional 5.3.3. Analyse des opportunités et des menaces 6. MARCHÉ DE L'INTÉGRATION DE LA MANUTENTION, PAR TYPE D'INTÉGRATION (MILLIARDS USD) 6.1. Intégration logicielle 6.2. Intégration matérielle 6.3. Intégration du système 7. MARCHÉ DE L'INTÉGRATION DE LA MANUTENTION, PAR INDUSTRIE DES UTILISATEURS FINAUX (MILLIARDS USD) 7.1. Fabrication 7.2. Vente au détail 7.3. Aliments et boissons 7.4. Pharmaceutique 7.5. Automobile 8. MARCHÉ DE L'INTÉGRATION DE LA MANUTENTION, PAR TECHNOLOGIE (MILLIARDS USD) 8.1. Véhicules à guidage automatique (AGV) 8.2. Robotique 8.3. Solutions compatibles IoT 8.4. Intelligence artificielle (IA) 9. MARCHÉ DE L'INTÉGRATION DE LA MANUTENTION, PAR NIVEAU D'AUTOMATISATION DES PROCESSUS (MILLIARDS USD) 9.1. Manuel 9.2. Semi-Automatisé 9.3. Entièrement automatisé 10. MARCHÉ DE L'INTÉGRATION DE LA MANUTENTION, PAR APPLICATION (MILLIARDS USD) 10.1. Gestion des entrepôts 10.2. Gestion des stocks 10.3. Exécution des commandes 10.4. Gestion des transports 11. MARCHÉ DE L'INTÉGRATION DE LA MANUTENTION, PAR RÉGIONAL (MILLIARDS USD) 11.1. Amérique du Nord 11.1.1. États-Unis 11.1.2. Canada 11.2. Europe 11.2.1. Allemagne 11.2.2. Royaume-Uni 11.2.3. France 11.2.4. Russie 11.2.5. Italie 11.2.6. Espagne 11.2.7. Reste de l'Europe 11.3. APAC 11.3.1. Chine 11.3.2. Inde 11.3.3. Japon 11.3.4. Corée du Sud 11.3.5. Malaisie 11.3.6. Thaïlande 11.3.7. Indonésie 11.3.8. Reste de l'APAC 11.4. Amérique du Sud 11.4.1. Brésil 11.4.2. Mexique 11.4.3. Argentine 11.4.4. Reste de l'Amérique du Sud 11.5. AME 11.5.1. Pays du CCG 11.5.2. Afrique du Sud 11.5.3. Reste du MEA 12. PAYSAGE CONCURRENTIEL 12.1. Présentation 12.2. Analyse concurrentielle 12.3. Analyse des parts de marché 12.4. Stratégie de croissance majeure sur le marché de l’intégration de la manutention 12.5. Analyse comparative concurrentielle 12.6. Acteurs de premier plan en termes de nombre d’évolutions sur le marché de l’intégration de la manutention 12.7. Développements clés et stratégies de croissance 12.7.1. Lancement de nouveaux produits/déploiement de services 12.7.2. Fusion & Acquisitions 12.7.3. Coentreprises 12.8. Matrice financière des principaux acteurs 12.8.1. Chiffre d'affaires et résultat opérationnel 12.8.2. Dépenses de R&D des principaux acteurs. 2023 13. PROFILS D'ENTREPRISE 13.1. Daifuku 13.1.1. Aperçu financier 13.1.2. Produits proposés 13.1.3. Développements clés 13.1.4. Analyse SWOT 13.1.5. Stratégies clés 13.2. Groupe KION 13.2.1. Aperçu financier 13.2.2. Produits proposés 13.2.3. Développements clés 13.2.4. Analyse SWOT 13.2.5. Stratégies clés 13.3. Solutions Bastiennes 13.3.1. Aperçu financier 13.3.2. Produits proposés 13.3.3. Développements clés 13.3.4. Analyse SWOT 13.3.5. Stratégies clés 13.4. Schneider Electric 13.4.1. Aperçu financier 13.4.2. Produits proposés 13.4.3. Développements clés 13.4.4. Analyse SWOT 13.4.5. Stratégies clés 13.5. SSI Schäfer 13.5.1. Aperçu financier 13.5.2. Produits proposés 13.5.3. Développements clés 13.5.4. Analyse SWOT 13.5.5. Stratégies clés 13.6. Siemens 13.6.1. Aperçu financier 13.6.2. Produits proposés 13.6.3. Développements clés 13.6.4. Analyse SWOT 13.6.5. Stratégies clés 13.7. Honeywell Intelligrated 13.7.1. Aperçu financier 13.7.2. Produits proposés 13.7.3. Développements clés 13.7.4. Analyse SWOT 13.7.5. Stratégies clés 13.8. Dématique 13.8.1. Aperçu financier 13.8.2. Produits proposés 13.8.3. Développements clés 13.8.4. Analyse SWOT 13.8.5. Stratégies clés 13.9. Groupe TGW Logistics 13.9.1. Aperçu financier 13.9.2. Produits proposés 13.9.3. Développements clés 13.9.4. Analyse SWOT 13.9.5. Stratégies clés 13.10. Yale Materials Handling Corporation 13.10.1. Aperçu financier 13.10.2. Produits offerts 13.10.3. Développements clés 13.10.4. Analyse SWOT 13.10.5. Stratégies clés 13.11. Interroll 13.11.1. Aperçu financier 13.11.2. Produits offerts 13.11.3. Développements clés 13.11.4. Analyse SWOT 13.11.5. Stratégies clés 13.12. Groupe MHI 13.12.1. Aperçu financier 13.12.2. Produits offerts 13.12.3. Développements clés 13.12.4. Analyse SWOT 13.12.5. Stratégies clés 13.13. Mecalux 13.13.1. Aperçu financier 13.13.2. Produits offerts 13.13.3. Développements clés 13.13.4. Analyse SWOT 13.13.5. Stratégies clés 13.14. Vanderlande 13.14.1. Aperçu financier 13.14.2. Produits offerts 13.14.3. Développements clés 13.14.4. Analyse SWOT 13.14.5. Stratégies clés 13.15. Manutention des matériaux HysterYale 13.15.1. Aperçu financier 13.15.2. Produits offerts 13.15.3. Développements clés 13.15.4. Analyse SWOT 13.15.5. Stratégies clés 14. ANNEXE 14.1. Références 14.2. Rapports connexes LISTE DES TABLEAUX TABLEAU 1. LISTE DES HYPOTHÈSES TABLEAU 2. ESTIMATIONS DE LA TAILLE DU MARCHÉ DE L'INTÉGRATION DE LA MANUTENTION EN AMÉRIQUE DU NORD & PRÉVISIONS, PAR TYPE D'INTÉGRATION, 2019-2032 (MILLIARDS USD) TABLEAU 3. ESTIMATIONS DE LA TAILLE ET DU MARCHÉ DE L'INTÉGRATION DE LA MANUTENTION EN AMÉRIQUE DU NORD PRÉVISIONS, PAR INDUSTRIE DES UTILISATEURS FINAUX, 2019-2032 (MILLIARDS USD) TABLEAU 4. ESTIMATIONS DE LA TAILLE ET DU MARCHÉ DE L'INTÉGRATION DE LA MANUTENTION EN AMÉRIQUE DU NORD PRÉVISIONS, PAR TECHNOLOGIE, 2019-2032 (MILLIARDS USD) TABLEAU 5. ESTIMATIONS DE LA TAILLE ET DU MARCHÉ DE L'INTÉGRATION DE LA MANUTENTION EN AMÉRIQUE DU NORD PRÉVISIONS, PAR NIVEAU D'AUTOMATISATION DES PROCESSUS, 2019-2032 (MILLIARDS USD) TABLEAU 6. ESTIMATIONS ET ESTIMATIONS DE LA TAILLE DU MARCHÉ DE L'INTÉGRATION DE LA MANUTENTION EN AMÉRIQUE DU NORD PRÉVISIONS, PAR APPLICATION, 2019-2032 (MILLIARDS USD) TABLEAU 7. ESTIMATIONS DE LA TAILLE ET DU MARCHÉ DE L'INTÉGRATION DE LA MANUTENTION EN AMÉRIQUE DU NORD PRÉVISIONS, PAR RÉGIONAL, 2019-2032 (MILLIARDS USD) TABLEAU 8. ESTIMATIONS DE LA TAILLE ET DU MARCHÉ DE L'INTÉGRATION DE LA MANUTENTION AUX ÉTATS-UNIS PRÉVISIONS, PAR TYPE D'INTÉGRATION, 2019-2032 (MILLIARDS USD) TABLEAU 9. ESTIMATIONS ET ESTIMATIONS DE LA TAILLE DU MARCHÉ DE L'INTÉGRATION DE LA MANUTENTION AUX ÉTATS-UNIS PRÉVISIONS, PAR INDUSTRIE DES UTILISATEURS FINAUX, 2019-2032 (MILLIARDS USD) TABLEAU 10. ESTIMATIONS ET ESTIMATIONS DE LA TAILLE DU MARCHÉ DE L'INTÉGRATION DE LA MANUTENTION AUX ÉTATS-UNIS PRÉVISIONS, PAR TECHNOLOGIE, 2019-2032 (MILLIARDS USD) TABLEAU 11. ESTIMATIONS ET ESTIMATIONS DE LA TAILLE DU MARCHÉ DE L'INTÉGRATION DE LA MANUTENTION AUX ÉTATS-UNIS PRÉVISIONS, PAR NIVEAU D'AUTOMATISATION DES PROCESSUS, 2019-2032 (MILLIARDS USD) TABLEAU 12. ESTIMATIONS ET ESTIMATIONS DE LA TAILLE DU MARCHÉ DE L'INTÉGRATION DE LA MANUTENTION AUX MATÉRIAUX AUX ÉTATS-UNIS PRÉVISIONS, PAR APPLICATION, 2019-2032 (MILLIARDS USD) TABLEAU 13. ESTIMATIONS ET ESTIMATIONS DE LA TAILLE DU MARCHÉ DE L'INTÉGRATION DE LA MANUTENTION AUX ÉTATS-UNIS PRÉVISIONS, PAR RÉGION, 2019-2032 (MILLIARDS USD) TABLEAU 14. ESTIMATIONS DE LA TAILLE ET DU MARCHÉ DE L'INTÉGRATION DE LA MANUTENTION AU CANADA PRÉVISIONS, PAR TYPE D'INTÉGRATION, 2019-2032 (MILLIARDS USD) TABLEAU 15. ESTIMATIONS DE LA TAILLE ET DU MARCHÉ DE L'INTÉGRATION DE LA MANUTENTION AU CANADA PRÉVISIONS, PAR INDUSTRIE DES UTILISATEURS FINAUX, 2019-2032 (MILLIARDS USD) TABLEAU 16. ESTIMATIONS DE LA TAILLE ET DU MARCHÉ DE L'INTÉGRATION DE LA MANUTENTION AU CANADA PRÉVISIONS, PAR TECHNOLOGIE, 2019-2032 (MILLIARDS USD) TABLEAU 17. ESTIMATIONS DE LA TAILLE ET DU MARCHÉ DE L'INTÉGRATION DE LA MANUTENTION AU CANADA PRÉVISIONS, PAR NIVEAU D'AUTOMATISATION DES PROCESSUS, 2019-2032 (MILLIARDS USD) TABLEAU 18. ESTIMATIONS DE LA TAILLE ET DU MARCHÉ DE L'INTÉGRATION DE LA MANUTENTION AU CANADA PRÉVISIONS, PAR APPLICATION, 2019-2032 (MILLIARDS USD) TABLEAU 19. ESTIMATIONS DE LA TAILLE ET DU MARCHÉ DE L'INTÉGRATION DE LA MANUTENTION AU CANADA PRÉVISIONS, PAR RÉGION, 2019-2032 (MILLIARDS USD) TABLEAU 20. ESTIMATIONS ET ESTIMATIONS DE LA TAILLE DU MARCHÉ DE L'INTÉGRATION DE LA MANUTENTION EN EUROPE PRÉVISIONS, PAR TYPE D'INTÉGRATION, 2019-2032 (MILLIARDS USD) TABLEAU 21. ESTIMATIONS ET ESTIMATIONS DE LA TAILLE DU MARCHÉ DE L'INTÉGRATION DE LA MANUTENTION EN EUROPE PRÉVISIONS, PAR INDUSTRIE DES UTILISATEURS FINAUX, 2019-2032 (MILLIARDS USD) TABLEAU 22. ESTIMATIONS ET ESTIMATIONS DE LA TAILLE DU MARCHÉ DE L'INTÉGRATION DE LA MANUTENTION EN EUROPE PRÉVISIONS, PAR TECHNOLOGIE, 2019-2032 (MILLIARDS USD) TABLEAU 23. ESTIMATIONS ET ESTIMATIONS DE LA TAILLE DU MARCHÉ DE L'INTÉGRATION DE LA MANUTENTION EN EUROPE PRÉVISIONS, PAR NIVEAU D'AUTOMATISATION DES PROCESSUS, 2019-2032 (MILLIARDS USD) TABLEAU 24. ESTIMATIONS ET ESTIMATIONS DE LA TAILLE DU MARCHÉ DE L'INTÉGRATION DE LA MANUTENTION EN EUROPE PRÉVISIONS, PAR APPLICATION, 2019-2032 (MILLIARDS USD) TABLEAU 25. ESTIMATIONS ET ESTIMATIONS DE LA TAILLE DU MARCHÉ DE L'INTÉGRATION DE LA MANUTENTION EN EUROPE PRÉVISIONS, PAR RÉGION, 2019-2032 (MILLIARDS USD) TABLEAU 26. ESTIMATIONS DE LA TAILLE ET DU MARCHÉ DE L'INTÉGRATION DE LA MANUTENTION EN ALLEMAGNE PRÉVISIONS, PAR TYPE D'INTÉGRATION, 2019-2032 (MILLIARDS USD) TABLEAU 27. ESTIMATIONS ET ESTIMATIONS DE LA TAILLE DU MARCHÉ DE L'INTÉGRATION DE LA MANUTENTION EN ALLEMAGNE PRÉVISIONS, PAR INDUSTRIE DES UTILISATEURS FINAUX, 2019-2032 (MILLIARDS USD) TABLEAU 28. ESTIMATIONS DE LA TAILLE ET DU MARCHÉ DE L'INTÉGRATION DE LA MANUTENTION EN ALLEMAGNE PRÉVISIONS, PAR TECHNOLOGIE, 2019-2032 (MILLIARDS USD) TABLEAU 29. ESTIMATIONS ET ESTIMATIONS DE LA TAILLE DU MARCHÉ DE L'INTÉGRATION DE LA MANUTENTION EN ALLEMAGNE PRÉVISIONS, PAR NIVEAU D'AUTOMATISATION DES PROCESSUS, 2019-2032 (MILLIARDS USD) TABLEAU 30. ESTIMATIONS ET ESTIMATIONS DE LA TAILLE DU MARCHÉ DE L'INTÉGRATION DE LA MANUTENTION EN ALLEMAGNE PRÉVISIONS, PAR APPLICATION, 2019-2032 (MILLIARDS USD) TABLEAU 31. ESTIMATIONS ET ESTIMATIONS DE LA TAILLE DU MARCHÉ DE L'INTÉGRATION DE LA MANUTENTION EN ALLEMAGNE PRÉVISIONS, PAR RÉGION, 2019-2032 (MILLIARDS USD) TABLEAU 32. ESTIMATIONS DE LA TAILLE ET DU MARCHÉ DE L'INTÉGRATION DE LA MANUTENTION AU ROYAUME-UNI PRÉVISIONS, PAR TYPE D'INTÉGRATION, 2019-2032 (MILLIARDS USD) TABLEAU 33. ESTIMATIONS DE LA TAILLE ET DU MARCHÉ DE L'INTÉGRATION DE LA MANUTENTION AU ROYAUME-UNI PRÉVISIONS, PAR INDUSTRIE DES UTILISATEURS FINAUX, 2019-2032 (MILLIARDS USD) TABLEAU 34. ESTIMATIONS DE LA TAILLE ET DU MARCHÉ DE L'INTÉGRATION DE LA MANUTENTION AU ROYAUME-UNI PRÉVISIONS, PAR TECHNOLOGIE, 2019-2032 (MILLIARDS USD) TABLEAU 35. ESTIMATIONS DE LA TAILLE ET DU MARCHÉ DE L'INTÉGRATION DE LA MANUTENTION AU ROYAUME-UNI PRÉVISIONS, PAR NIVEAU D'AUTOMATISATION DES PROCESSUS, 2019-2032 (MILLIARDS USD) TABLEAU 36. ESTIMATIONS DE LA TAILLE ET DU MARCHÉ DE L'INTÉGRATION DE LA MANUTENTION AU ROYAUME-UNI PRÉVISIONS, PAR APPLICATION, 2019-2032 (MILLIARDS USD) TABLEAU 37. ESTIMATIONS ET ESTIMATIONS DE LA TAILLE DU MARCHÉ DE L'INTÉGRATION DE LA MANUTENTION AU ROYAUME-UNI PRÉVISIONS, PAR RÉGIONAL, 2019-2032 (MILLIARDS USD) TABLEAU 38. ESTIMATIONS DE LA TAILLE ET DU MARCHÉ DE L'INTÉGRATION DE LA MANUTENTION EN FRANCE PRÉVISIONS, PAR TYPE D'INTÉGRATION, 2019-2032 (MILLIARDS USD) TABLEAU 39. ESTIMATIONS ET ESTIMATIONS DE LA TAILLE DU MARCHÉ DE L'INTÉGRATION DE LA MANUTENTION EN FRANCE PRÉVISIONS, PAR INDUSTRIE DES UTILISATEURS FINAUX, 2019-2032 (MILLIARDS USD) TABLEAU 40. ESTIMATIONS ET ESTIMATIONS DE LA TAILLE DU MARCHÉ DE L'INTÉGRATION DE LA MANUTENTION EN FRANCE PRÉVISION, PAR TECHNOLOGIE, 2019-2032 (MILLIARDS USD) TABLEAU 41. MANUTENTION EN FRANCEESTIMATIONS ET ESTIMATIONS DE LA TAILLE DU MARCHÉ DE LA TÉGRATION PRÉVISIONS, PAR NIVEAU D'AUTOMATISATION DES PROCESSUS, 2019-2032 (MILLIARDS USD) TABLEAU 42. ESTIMATIONS DE LA TAILLE ET DU MARCHÉ DE L'INTÉGRATION DE LA MANUTENTION EN FRANCE PRÉVISIONS, PAR APPLICATION, 2019-2032 (MILLIARDS USD) TABLEAU 43. ESTIMATIONS ET ESTIMATIONS DE LA TAILLE DU MARCHÉ DE L'INTÉGRATION DE LA MANUTENTION EN FRANCE PRÉVISIONS, PAR RÉGION, 2019-2032 (MILLIARDS USD) TABLEAU 44. ESTIMATIONS DE LA TAILLE ET DU MARCHÉ DE L'INTÉGRATION DE LA MANUTENTION EN RUSSIE PRÉVISIONS, PAR TYPE D'INTÉGRATION, 2019-2032 (MILLIARDS USD) TABLEAU 45. ESTIMATIONS ET ESTIMATIONS DE LA TAILLE DU MARCHÉ DE L'INTÉGRATION DE LA MANUTENTION EN RUSSIE PRÉVISIONS, PAR INDUSTRIE DES UTILISATEURS FINAUX, 2019-2032 (MILLIARDS USD) TABLEAU 46. ESTIMATIONS ET ESTIMATIONS DE LA TAILLE DU MARCHÉ DE L'INTÉGRATION DE LA MANUTENTION EN RUSSIE PRÉVISIONS, PAR TECHNOLOGIE, 2019-2032 (MILLIARDS USD) TABLEAU 47. ESTIMATIONS DE LA TAILLE ET DU MARCHÉ DE L'INTÉGRATION DE LA MANUTENTION EN RUSSIE PRÉVISIONS, PAR NIVEAU D'AUTOMATISATION DES PROCESSUS, 2019-2032 (MILLIARDS USD) TABLEAU 48. ESTIMATIONS DE LA TAILLE ET DU MARCHÉ DE L'INTÉGRATION DE LA MANUTENTION EN RUSSIE PRÉVISIONS, PAR APPLICATION, 2019-2032 (MILLIARDS USD) TABLEAU 49. ESTIMATIONS ET ESTIMATIONS DE LA TAILLE DU MARCHÉ DE L'INTÉGRATION DE LA MANUTENTION EN RUSSIE PRÉVISIONS, PAR RÉGIONAL, 2019-2032 (MILLIARDS USD) TABLEAU 50. ESTIMATIONS DE LA TAILLE ET DU MARCHÉ DE L'INTÉGRATION DE LA MANUTENTION EN ITALIE PRÉVISIONS, PAR TYPE D'INTÉGRATION, 2019-2032 (MILLIARDS USD) TABLEAU 51. ESTIMATIONS DE LA TAILLE ET DU MARCHÉ DE L'INTÉGRATION DE LA MANUTENTION EN ITALIE PRÉVISIONS, PAR INDUSTRIE DES UTILISATEURS FINAUX, 2019-2032 (MILLIARDS USD) TABLEAU 52. ESTIMATIONS DE LA TAILLE ET DU MARCHÉ DE L'INTÉGRATION DE LA MANUTENTION EN ITALIE PRÉVISIONS, PAR TECHNOLOGIE, 2019-2032 (MILLIARDS USD) TABLEAU 53. ESTIMATIONS DE LA TAILLE ET DU MARCHÉ DE L'INTÉGRATION DE LA MANUTENTION EN ITALIE PRÉVISIONS, PAR NIVEAU D'AUTOMATISATION DES PROCESSUS, 2019-2032 (MILLIARDS USD) TABLEAU 54. ESTIMATIONS DE LA TAILLE ET DU MARCHÉ DE L'INTÉGRATION DE LA MANUTENTION EN ITALIE PRÉVISIONS, PAR APPLICATION, 2019-2032 (MILLIARDS USD) TABLEAU 55. ESTIMATIONS DE LA TAILLE ET DU MARCHÉ DE L'INTÉGRATION DE LA MANUTENTION EN ITALIE PRÉVISIONS, PAR RÉGION, 2019-2032 (MILLIARDS USD) TABLEAU 56. ESTIMATIONS ET ESTIMATIONS DE LA TAILLE DU MARCHÉ DE L'INTÉGRATION DE LA MANUTENTION EN ESPAGNE PRÉVISIONS, PAR TYPE D'INTÉGRATION, 2019-2032 (MILLIARDS USD) TABLEAU 57. ESTIMATIONS ET ESTIMATIONS DE LA TAILLE DU MARCHÉ DE L'INTÉGRATION DE LA MANUTENTION EN ESPAGNE PRÉVISIONS, PAR INDUSTRIE DES UTILISATEURS FINAUX, 2019-2032 (MILLIARDS USD) TABLEAU 58. ESTIMATIONS DE LA TAILLE ET DU MARCHÉ DE L'INTÉGRATION DE LA MANUTENTION EN ESPAGNE PRÉVISIONS, PAR TECHNOLOGIE, 2019-2032 (MILLIARDS USD) TABLEAU 59. ESTIMATIONS DE LA TAILLE ET DU MARCHÉ DE L'INTÉGRATION DE LA MANUTENTION EN ESPAGNE PRÉVISIONS, PAR NIVEAU D'AUTOMATISATION DES PROCESSUS, 2019-2032 (MILLIARDS USD) TABLEAU 60. ESTIMATIONS DE LA TAILLE ET DU MARCHÉ DE L'INTÉGRATION DE LA MANUTENTION EN ESPAGNE PRÉVISIONS, PAR APPLICATION, 2019-2032 (MILLIARDS USD) TABLEAU 61. ESTIMATIONS ET ESTIMATIONS DE LA TAILLE DU MARCHÉ DE L'INTÉGRATION DE LA MANUTENTION EN ESPAGNE PRÉVISIONS, PAR RÉGIONAL, 2019-2032 (MILLIARDS USD) TABLEAU 62. RESTE DE L'EUROPE, ESTIMATIONS DE LA TAILLE DU MARCHÉ DE L'INTÉGRATION DE LA MANUTENTION ET AMP; PRÉVISIONS, PAR TYPE D'INTÉGRATION, 2019-2032 (MILLIARDS USD) TABLEAU 63. RESTE DE L'EUROPE ESTIMATIONS DE LA TAILLE DU MARCHÉ DE L'INTÉGRATION DE LA MANUTENTION ET AMP; PRÉVISIONS, PAR INDUSTRIE DES UTILISATEURS FINAUX, 2019-2032 (MILLIARDS USD) TABLEAU 64. RESTE DE L'EUROPE, ESTIMATIONS DE LA TAILLE DU MARCHÉ DE L'INTÉGRATION DE LA MANUTENTION ET AMP; PRÉVISIONS, PAR TECHNOLOGIE, 2019-2032 (MILLIARDS USD) TABLEAU 65. RESTE DE L'EUROPE ESTIMATIONS DE LA TAILLE DU MARCHÉ DE L'INTÉGRATION DE LA MANUTENTION ET PRÉVISIONS, PAR NIVEAU D'AUTOMATISATION DES PROCESSUS, 2019-2032 (MILLIARDS USD) TABLEAU 66. RESTE DE L'EUROPE, ESTIMATIONS DE LA TAILLE DU MARCHÉ DE L'INTÉGRATION DE LA MANUTENTION ET AMP; PRÉVISIONS, PAR APPLICATION, 2019-2032 (MILLIARDS USD) TABLEAU 67. RESTE DE L'EUROPE ESTIMATIONS DE LA TAILLE DU MARCHÉ DE L'INTÉGRATION DE LA MANUTENTION ET PRÉVISIONS, PAR RÉGIONAL, 2019-2032 (MILLIARDS USD) TABLEAU 68. ESTIMATIONS DE LA TAILLE ET DU MARCHÉ DE L'INTÉGRATION DE LA MANUTENTION APAC PRÉVISIONS, PAR TYPE D'INTÉGRATION, 2019-2032 (MILLIARDS USD) TABLEAU 69. ESTIMATIONS DE LA TAILLE ET DU MARCHÉ DE L'INTÉGRATION DE LA MANUTENTION APAC PRÉVISIONS, PAR INDUSTRIE DES UTILISATEURS FINAUX, 2019-2032 (MILLIARDS USD) TABLEAU 70. ESTIMATIONS ET ESTIMATIONS DE LA TAILLE DU MARCHÉ DE L'INTÉGRATION DE LA MANUTENTION EN APAC PRÉVISIONS, PAR TECHNOLOGIE, 2019-2032 (MILLIARDS USD) TABLEAU 71. ESTIMATIONS DE LA TAILLE ET DU MARCHÉ DE L'INTÉGRATION DE LA MANUTENTION APAC PRÉVISIONS, PAR NIVEAU D'AUTOMATISATION DES PROCESSUS, 2019-2032 (MILLIARDS USD) TABLEAU 72. ESTIMATIONS DE LA TAILLE DU MARCHÉ DE L'INTÉGRATION DE LA MANUTENTION DES MATÉRIAUX APAC & PRÉVISIONS, PAR APPLICATION, 2019-2032 (MILLIARDS USD) TABLEAU 73. ESTIMATIONS ET ESTIMATIONS DE LA TAILLE DU MARCHÉ DE L'INTÉGRATION DE LA MANUTENTION APAC PRÉVISIONS, PAR RÉGION, 2019-2032 (MILLIARDS USD) TABLEAU 74. ESTIMATIONS DE LA TAILLE ET DU MARCHÉ DE L'INTÉGRATION DE LA MANUTENTION EN CHINE PRÉVISIONS, PAR TYPE D'INTÉGRATION, 2019-2032 (MILLIARDS USD) TABLEAU 75. ESTIMATIONS ET ESTIMATIONS DE LA TAILLE DU MARCHÉ DE L'INTÉGRATION DE LA MANUTENTION EN CHINE PRÉVISIONS, PAR INDUSTRIE DES UTILISATEURS FINAUX, 2019-2032 (MILLIARDS USD) TABLEAU 76. ESTIMATIONS DE LA TAILLE ET DU MARCHÉ DE L'INTÉGRATION DE LA MANUTENTION EN CHINE EN CHINE PRÉVISIONS, PAR TECHNOLOGIE, 2019-2032 (MILLIARDS USD) TABLEAU 77. ESTIMATIONS ET ESTIMATIONS DE LA TAILLE DU MARCHÉ DE L'INTÉGRATION DE LA MANUTENTION EN CHINE PRÉVISIONS, PAR NIVEAU D'AUTOMATISATION DES PROCÉDÉS, 2019-2032 (MILLIARDS USD) TABLEAU 78. ESTIMATIONS DE LA TAILLE ET DU MARCHÉ DE L'INTÉGRATION DE LA MANUTENTION EN CHINE EN CHINE PRÉVISIONS, PAR APPLICATION, 2019-2032 (MILLIARDS USD) TABLEAU 79. ESTIMATIONS ET ESTIMATIONS DE LA TAILLE DU MARCHÉ DE L'INTÉGRATION DE LA MANUTENTION EN CHINE PRÉVISIONS, PAR RÉGION, 2019-2032 (MILLIARDS USD) TABLEAU 80. ESTIMATIONS DE LA TAILLE ET DU MARCHÉ DE L'INTÉGRATION DE LA MANUTENTION EN INDE PRÉVISIONS, PAR TYPE D'INTÉGRATION, 2019-2032 (MILLIARDS USD) TABLEAU 81. ESTIMATIONS DE LA TAILLE ET DU MARCHÉ DE L'INTÉGRATION DE LA MANUTENTION EN INDE PRÉVISIONS, PAR INDUSTRIE DES UTILISATEURS FINAUX, 2019-2032 (MILLIARDS USD) TABLEAU 82. ESTIMATIONS DE LA TAILLE ET DU MARCHÉ DE L'INTÉGRATION DE LA MANUTENTION EN INDE PRÉVISIONS, PAR TECHNOLOGIE, 2019-2032 (MILLIARDS USD) TABLEAU 83. ESTIMATIONS ET ESTIMATIONS DE LA TAILLE DU MARCHÉ DE L'INTÉGRATION DE LA MANUTENTION EN INDE PRÉVISIONS, PAR NIVEAU D'AUTOMATISATION DES PROCESSUS, 2019-2032 (MILLIARDS USD) TABLEAU 84. ESTIMATIONS DE LA TAILLE ET DU MARCHÉ DE L'INTÉGRATION DE LA MANUTENTION EN INDE PRÉVISIONS, PAR APPLICATION, 2019-2032 (MILLIARDS USD) TABLEAU 85. ESTIMATIONS ET ESTIMATIONS DE LA TAILLE DU MARCHÉ DE L'INTÉGRATION DE LA MANUTENTION EN INDE PRÉVISIONS, PAR RÉGION, 2019-2032 (MILLIARDS USD) TABLEAU 86. ESTIMATIONS DE LA TAILLE ET DU MARCHÉ DE L'INTÉGRATION DE LA MANUTENTION AU JAPON PRÉVISIONS, PAR TYPE D'INTÉGRATION, 2019-2032 (MILLIARDS USD) TABLEAU 87. ESTIMATIONS DE LA TAILLE ET DU MARCHÉ DE L'INTÉGRATION DE LA MANUTENTION AU JAPON PRÉVISIONS, PAR INDUSTRIE DES UTILISATEURS FINAUX, 2019-2032 (MILLIARDS USD) TABLEAU 88. ESTIMATIONS DE LA TAILLE DU MARCHÉ DE L'INTÉGRATION DE LA MANUTENTION AU JAPON & PRÉVISIONS, PAR TECHNOLOGIE, 2019-2032 (MILLIARDS USD) TABLEAU 89. ESTIMATIONS DE LA TAILLE ET DU MARCHÉ DE L'INTÉGRATION DE LA MANUTENTION AU JAPON PRÉVISIONS, PAR NIVEAU D'AUTOMATISATION DES PROCESSUS, 2019-2032 (MILLIARDS USD) TABLEAU 90. ESTIMATIONS DE LA TAILLE ET DU MARCHÉ DE L'INTÉGRATION DE LA MANUTENTION AU JAPON PRÉVISIONS, PAR APPLICATION, 2019-2032 (MILLIARDS USD) TABLEAU 91. ESTIMATIONS ET ESTIMATIONS DE LA TAILLE DU MARCHÉ DE L'INTÉGRATION DE LA MANUTENTION AU JAPON PRÉVISIONS, PAR RÉGION, 2019-2032 (MILLIARDS USD) TABLEAU 92. ESTIMATIONS DE LA TAILLE ET DU MARCHÉ DE L'INTÉGRATION DE LA MANUTENTION EN CORÉE DU SUD PRÉVISIONS, PAR TYPE D'INTÉGRATION, 2019-2032 (MILLIARDS USD) TABLEAU 93. ESTIMATIONS DE LA TAILLE ET DU MARCHÉ DE L'INTÉGRATION DE LA MANUTENTION EN CORÉE DU SUD PRÉVISIONS, PAR INDUSTRIE DES UTILISATEURS FINAUX, 2019-2032 (MILLIARDS USD) TABLEAU 94. ESTIMATIONS DE LA TAILLE ET DU MARCHÉ DE L'INTÉGRATION DE LA MANUTENTION EN CORÉE DU SUD PRÉVISIONS, PAR TECHNOLOGIE, 2019-2032 (MILLIARDS USD) TABLEAU 95. ESTIMATIONS ET ESTIMATIONS DE LA TAILLE DU MARCHÉ DE L'INTÉGRATION DE LA MANUTENTION EN CORÉE DU SUD PRÉVISIONS, PAR NIVEAU D'AUTOMATISATION DES PROCESSUS, 2019-2032 (MILLIARDS USD) TABLEAU 96. ESTIMATIONS DE LA TAILLE ET DU MARCHÉ DE L'INTÉGRATION DE LA MANUTENTION EN CORÉE DU SUD PRÉVISIONS, PAR APPLICATION, 2019-2032 (MILLIARDS USD) TABLEAU 97. ESTIMATIONS ET ESTIMATIONS DE LA TAILLE DU MARCHÉ DE L'INTÉGRATION DE LA MANUTENTION EN CORÉE DU SUD PRÉVISIONS, PAR RÉGION, 2019-2032 (MILLIARDS USD) TABLEAU 98. ESTIMATIONS ET ESTIMATIONS DE LA TAILLE DU MARCHÉ DE L'INTÉGRATION DE LA MANUTENTION EN MALAISIE PRÉVISIONS, PAR TYPE D'INTÉGRATION, 2019-2032 (MILLIARDS USD) TABLEAU 99. ESTIMATIONS ET ESTIMATIONS DE LA TAILLE DU MARCHÉ DE L'INTÉGRATION DE LA MANUTENTION EN MALAISIE PRÉVISIONS, PAR INDUSTRIE DES UTILISATEURS FINAUX, 2019-2032 (MILLIARDS USD) TABLEAU 100. ESTIMATIONS ET ESTIMATIONS DE LA TAILLE DU MARCHÉ DE L'INTÉGRATION DE LA MANUTENTION EN MALAISIE PRÉVISIONS, PAR TECHNOLOGIE, 2019-2032 (MILLIARDS USD) TABLEAU 101. ESTIMATIONS ET ESTIMATIONS DE LA TAILLE DU MARCHÉ DE L'INTÉGRATION DE LA MANUTENTION EN MALAISIE PRÉVISIONS, PAR NIVEAU D'AUTOMATISATION DES PROCESSUS, 2019-2032 (MILLIARDS USD) TABLEAU 102. ESTIMATIONS ET ESTIMATIONS DE LA TAILLE DU MARCHÉ DE L'INTÉGRATION DE LA MANUTENTION EN MALAISIE PRÉVISIONS, PAR APPLICATION, 2019-2032 (MILLIARDS USD) TABLEAU 103. ESTIMATIONS ET ESTIMATIONS DE LA TAILLE DU MARCHÉ DE L'INTÉGRATION DE LA MANUTENTION EN MALAISIE PRÉVISIONS, PAR RÉGION, 2019-2032 (MILLIARDS USD) TABLEAU 104. ESTIMATIONS ET ESTIMATIONS DE LA TAILLE DU MARCHÉ DE L'INTÉGRATION DE LA MANUTENTION EN THAÏLANDE PRÉVISIONS, PAR TYPE D'INTÉGRATION, 2019-2032 (MILLIARDS USD) TABLEAU 105. ESTIMATIONS ET ESTIMATIONS DE LA TAILLE DU MARCHÉ DE L'INTÉGRATION DE LA MANUTENTION EN THAÏLANDE PRÉVISIONS, PAR INDUSTRIE DES UTILISATEURS FINAUX, 2019-2032 (MILLIARDS USD) TABLEAU 106. ESTIMATIONS ET ESTIMATIONS DE LA TAILLE DU MARCHÉ DE L'INTÉGRATION DE LA MANUTENTION EN THAÏLANDE PRÉVISIONS, PAR TECHNOLOGIE, 2019-2032 (MILLIARDS USD) TABLEAU 107. ESTIMATIONS ET ESTIMATIONS DE LA TAILLE DU MARCHÉ DE L'INTÉGRATION DE LA MANUTENTION EN THAÏLANDE PRÉVISIONS, PAR NIVEAU D'AUTOMATISATION DES PROCESSUS, 2019-2032 (MILLIARDS USD) TABLEAU 108. ESTIMATIONS ET ESTIMATIONS DE LA TAILLE DU MARCHÉ DE L'INTÉGRATION DE LA MANUTENTION EN THAÏLANDE PRÉVISIONS, PAR APPLICATION, 2019-2032 (MILLIARDS USD) TABLEAU 109. ESTIMATIONS ET ESTIMATIONS DE LA TAILLE DU MARCHÉ DE L'INTÉGRATION DE LA MANUTENTION EN THAÏLANDE PRÉVISIONS, PAR RÉGION, 2019-2032 (MILLIARDS USD) TABLEAU 110. ESTIMATIONS ET ESTIMATIONS DE LA TAILLE DU MARCHÉ DE L'INTÉGRATION DE LA MANUTENTION EN INDONÉSIE PRÉVISIONS, PAR TYPE D'INTÉGRATION, 2019-2032 (MILLIARDS USD) TABLEAU 111. ESTIMATIONS ET ESTIMATIONS DE LA TAILLE DU MARCHÉ DE L'INTÉGRATION DE LA MANUTENTION EN INDONÉSIE PRÉVISIONS, PAR INDUSTRIE DES UTILISATEURS FINAUX, 2019-2032 (MILLIARDS USD) TABLEAU 112. ESTIMATIONS ET ESTIMATIONS DE LA TAILLE DU MARCHÉ DE L'INTÉGRATION DE LA MANUTENTION EN INDONÉSIE PRÉVISIONS, PAR TECHNOLOGIE, 2019-2032 (MILLIARDS USD) TABLEAU 113. ESTIMATIONS ET ESTIMATIONS DE LA TAILLE DU MARCHÉ DE L'INTÉGRATION DE LA MANUTENTION EN INDONÉSIE PRÉVISIONS, PAR NIVEAU D'AUTOMATISATION DES PROCESSUS, 2019-2032 (MILLIARDS USD) TABLEAU 114. ESTIMATIONS ET ESTIMATIONS DE LA TAILLE DU MARCHÉ DE L'INTÉGRATION DE LA MANUTENTION EN INDONÉSIE PRÉVISIONS, PAR APPLICATION, 2019-2032 (MILLIARDS USD) TABLEAU 115. ESTIMATIONS ET ESTIMATIONS DE LA TAILLE DU MARCHÉ DE L'INTÉGRATION DE LA MANUTENTION EN INDONÉSIE PRÉVISIONS, PAR RÉGIONAL, 2019-2032 (MILLIARDS USD) TABLEAU 116. RESTE DE L'INTÉGRATION DE LA MANUTENTION APAC ESTIMATIONS DE LA TAILLE DU MARCHÉ & PRÉVISIONS, PAR TYPE D'INTÉGRATION, 2019-2032 (MILLIARDS USD) TABLEAU 117. RESTE DE L'INTÉGRATION DE LA MANUTENTION APAC ESTIMATIONS DE LA TAILLE DU MARCHÉ & PRÉVISIONS, PAR INDUSTRIE DES UTILISATEURS FINAUX, 2019-2032 (MILLIARDS USD) TABLEAU 118. RESTE DE L'INTÉGRATION DE LA MANUTENTION DES MATÉRIAUX APAC ESTIMATIONS DE LA TAILLE DU MARCHÉ & PRÉVISIONS, PAR TECHNOLOGIE, 2019-2032 (MILLIARDS USD) TABLEAU 119. RESTE DE L'INTÉGRATION DE LA MANUTENTION APAC ESTIMATIONS DE LA TAILLE DU MARCHÉ & PRÉVISIONS, PAR NIVEAU D'AUTOMATISATION DES PROCESSUS, 2019-2032 (MILLIARDS USD) TABLEAU 120. RESTE DE L'INTÉGRATION DE LA MANUTENTION DES MATÉRIAUX APAC ESTIMATIONS DE LA TAILLE DU MARCHÉ & PRÉVISIONS, PAR APPLICATION, 2019-2032 (MILLIARDS USD) TABLEAU 121. RESTE DE L'INTÉGRATION DE LA MANUTENTION DES MATÉRIAUX APAC ESTIMATIONS DE LA TAILLE DU MARCHÉ & PRÉVISIONS, PAR RÉGION, 2019-2032 (MILLIARDS USD) TABLEAU 122. ESTIMATIONS ET ESTIMATIONS DE LA TAILLE DU MARCHÉ DE L'INTÉGRATION DE LA MANUTENTION EN AMÉRIQUE DU SUD PRÉVISIONS, PAR TYPE D'INTÉGRATION, 2019-2032 (MILLIARDS USD) TABLEAU 123. ESTIMATIONS ET ESTIMATIONS DE LA TAILLE DU MARCHÉ DE L'INTÉGRATION DE LA MANUTENTION EN AMÉRIQUE DU SUD PRÉVISIONS, PAR INDUSTRIE DES UTILISATEURS FINAUX, 2019-2032 (MILLIARDS USD) TABLEAU 124. ESTIMATIONS ET ESTIMATIONS DE LA TAILLE DU MARCHÉ DE L'INTÉGRATION DE LA MANUTENTION EN AMÉRIQUE DU SUD PRÉVISIONS, PAR TECHNOLOGIE, 2019-2032 (MILLIARDS USD) TABLEAU 125. ESTIMATIONS ET ESTIMATIONS DE LA TAILLE DU MARCHÉ DE L'INTÉGRATION DE LA MANUTENTION EN AMÉRIQUE DU SUD PRÉVISIONS, PAR NIVEAU D'AUTOMATISATION DES PROCESSUS, 2019-2032 (MILLIARDS USD) TABLEAU 126. ESTIMATIONS ET ESTIMATIONS DE LA TAILLE DU MARCHÉ DE L'INTÉGRATION DE LA MANUTENTION EN AMÉRIQUE DU SUD PRÉVISIONS, PAR APPLICATION, 2019-2032 (MILLIARDS USD) TABLEAU 127. ESTIMATIONS ET ESTIMATIONS DE LA TAILLE DU MARCHÉ DE L'INTÉGRATION DE LA MANUTENTION EN AMÉRIQUE DU SUD PRÉVISIONS, PAR RÉGION, 2019-2032 (MILLIARDS USD) TABLEAU 128. ESTIMATIONS ET ESTIMATIONS DE LA TAILLE DU MARCHÉ DE L'INTÉGRATION DE LA MANUTENTION AU BRÉSIL POURECAST, PAR TYPE D'INTÉGRATION, 2019-2032 (MILLIARDS USD) TABLEAU 129. ESTIMATIONS ET ESTIMATIONS DE LA TAILLE DU MARCHÉ DE L'INTÉGRATION DE LA MANUTENTION AU BRÉSIL PRÉVISIONS, PAR INDUSTRIE DES UTILISATEURS FINAUX, 2019-2032 (MILLIARDS USD) TABLEAU 130. ESTIMATIONS ET ESTIMATIONS DE LA TAILLE DU MARCHÉ DE L'INTÉGRATION DE LA MANUTENTION AU BRÉSIL PRÉVISIONS, PAR TECHNOLOGIE, 2019-2032 (MILLIARDS USD) TABLEAU 131. ESTIMATIONS ET ESTIMATIONS DE LA TAILLE DU MARCHÉ DE L'INTÉGRATION DE LA MANUTENTION AU BRÉSIL PRÉVISIONS, PAR NIVEAU D'AUTOMATISATION DES PROCESSUS, 2019-2032 (MILLIARDS USD) TABLEAU 132. ESTIMATIONS ET ESTIMATIONS DE LA TAILLE DU MARCHÉ DE L'INTÉGRATION DE LA MANUTENTION AU BRÉSIL PRÉVISIONS, PAR APPLICATION, 2019-2032 (MILLIARDS USD) TABLEAU 133. ESTIMATIONS ET ESTIMATIONS DE LA TAILLE DU MARCHÉ DE L'INTÉGRATION DE LA MANUTENTION AU BRÉSIL PRÉVISIONS, PAR RÉGIONAL, 2019-2032 (MILLIARDS USD) TABLEAU 134. ESTIMATIONS ET ESTIMATIONS DE LA TAILLE DU MARCHÉ DE L'INTÉGRATION DE LA MANUTENTION AU MEXIQUE PRÉVISIONS, PAR TYPE D'INTÉGRATION, 2019-2032 (MILLIARDS USD) TABLEAU 135. ESTIMATIONS ET ESTIMATIONS DE LA TAILLE DU MARCHÉ DE L'INTÉGRATION DE LA MANUTENTION AU MEXIQUE PRÉVISIONS, PAR INDUSTRIE DES UTILISATEURS FINAUX, 2019-2032 (MILLIARDS USD) TABLEAU 136. ESTIMATIONS ET ESTIMATIONS DE LA TAILLE DU MARCHÉ DE L'INTÉGRATION DE LA MANUTENTION AU MEXIQUE PRÉVISIONS, PAR TECHNOLOGIE, 2019-2032 (MILLIARDS USD) TABLEAU 137. ESTIMATIONS ET ESTIMATIONS DE LA TAILLE DU MARCHÉ DE L'INTÉGRATION DE LA MANUTENTION AU MEXIQUE PRÉVISIONS, PAR NIVEAU D'AUTOMATISATION DES PROCESSUS, 2019-2032 (MILLIARDS USD) TABLEAU 138. ESTIMATIONS ET ESTIMATIONS DE LA TAILLE DU MARCHÉ DE L'INTÉGRATION DE LA MANUTENTION AU MEXIQUE PRÉVISIONS, PAR APPLICATION, 2019-2032 (MILLIARDS USD) TABLEAU 139. ESTIMATIONS ET ESTIMATIONS DE LA TAILLE DU MARCHÉ DE L'INTÉGRATION DE LA MANUTENTION AU MEXIQUE PRÉVISIONS, PAR RÉGIONAL, 2019-2032 (MILLIARDS USD) TABLEAU 140. ESTIMATIONS ET ESTIMATIONS DE LA TAILLE DU MARCHÉ DE L'INTÉGRATION DE LA MANUTENTION EN ARGENTINE PRÉVISIONS, PAR TYPE D'INTÉGRATION, 2019-2032 (MILLIARDS USD) TABLEAU 141. ESTIMATIONS DE LA TAILLE ET DU MARCHÉ DE L'INTÉGRATION DE LA MANUTENTION EN ARGENTINE PRÉVISIONS, PAR INDUSTRIE DES UTILISATEURS FINAUX, 2019-2032 (MILLIARDS USD) TABLEAU 142. ESTIMATIONS ET ESTIMATIONS DE LA TAILLE DU MARCHÉ DE L'INTÉGRATION DE LA MANUTENTION EN ARGENTINE PRÉVISIONS, PAR TECHNOLOGIE, 2019-2032 (MILLIARDS USD) TABLEAU 143. ESTIMATIONS ET ESTIMATIONS DE LA TAILLE DU MARCHÉ DE L'INTÉGRATION DE LA MANUTENTION EN ARGENTINE PRÉVISIONS, PAR NIVEAU D'AUTOMATISATION DES PROCESSUS, 2019-2032 (MILLIARDS USD) TABLEAU 144. ESTIMATIONS ET ESTIMATIONS DE LA TAILLE DU MARCHÉ DE L'INTÉGRATION DE LA MANUTENTION EN ARGENTINE PRÉVISIONS, PAR APPLICATION, 2019-2032 (MILLIARDS USD) TABLEAU 145. ESTIMATIONS ET ESTIMATIONS DE LA TAILLE DU MARCHÉ DE L'INTÉGRATION DE LA MANUTENTION EN ARGENTINE PRÉVISIONS, PAR RÉGIONAL, 2019-2032 (MILLIARDS USD) TABLEAU 146. RESTE DE L'AMÉRIQUE DU SUD, ESTIMATIONS DE LA TAILLE DU MARCHÉ DE L'INTÉGRATION DE LA MANUTENTION ET AMÉRIQUE DU SUD. PRÉVISIONS, PAR TYPE D'INTÉGRATION, 2019-2032 (MILLIARDS USD) TABLEAU 147. RESTE DE L'AMÉRIQUE DU SUD ESTIMATIONS DE LA TAILLE DU MARCHÉ DE L'INTÉGRATION DE LA MANUTENTION ET AMP; PRÉVISIONS, PAR INDUSTRIE DES UTILISATEURS FINAUX, 2019-2032 (MILLIARDS USD) TABLEAU 148. RESTE DE L'AMÉRIQUE DU SUD, ESTIMATIONS DE LA TAILLE DU MARCHÉ DE L'INTÉGRATION DE LA MANUTENTION ET AMÉRIQUE DU SUD. PRÉVISIONS, PAR TECHNOLOGIE, 2019-2032 (MILLIARDS USD) TABLEAU 149. RESTE DE L'AMÉRIQUE DU SUD, ESTIMATIONS DE LA TAILLE DU MARCHÉ DE L'INTÉGRATION DE LA MANUTENTION ET AMÉRIQUE DU SUD. PRÉVISIONS, PAR NIVEAU D'AUTOMATISATION DES PROCESSUS, 2019-2032 (MILLIARDS USD) TABLEAU 150. RESTE DE L'AMÉRIQUE DU SUD, ESTIMATIONS DE LA TAILLE DU MARCHÉ DE L'INTÉGRATION DE LA MANUTENTION ET AMÉRIQUE DU SUD. PRÉVISIONS, PAR APPLICATION, 2019-2032 (MILLIARDS USD) TABLEAU 151. RESTE DE L'AMÉRIQUE DU SUD, ESTIMATIONS DE LA TAILLE DU MARCHÉ DE L'INTÉGRATION DE LA MANUTENTION ET AMÉRIQUE DU SUD. PRÉVISIONS, PAR RÉGIONAL, 2019-2032 (MILLIARDS USD) TABLEAU 152. ESTIMATIONS ET ESTIMATIONS DE LA TAILLE DU MARCHÉ DE L'INTÉGRATION DE LA MANUTENTION DES MATÉRIAUX DU MEA PRÉVISIONS, PAR TYPE D'INTÉGRATION, 2019-2032 (MILLIARDS USD) TABLEAU 153. ESTIMATIONS ET ESTIMATIONS DE LA TAILLE DU MARCHÉ DE L'INTÉGRATION DE LA MANUTENTION DES MATÉRIAUX DU MEA PRÉVISIONS, PAR INDUSTRIE DES UTILISATEURS FINAUX, 2019-2032 (MILLIARDS USD) TABLEAU 154. ESTIMATIONS ET ESTIMATIONS DE LA TAILLE DU MARCHÉ DE L'INTÉGRATION DE LA MANUTENTION DES MATÉRIAUX DU MEA PRÉVISIONS, PAR TECHNOLOGIE, 2019-2032 (MILLIARDS USD) TABLEAU 155. ESTIMATIONS ET ESTIMATIONS DE LA TAILLE DU MARCHÉ DE L'INTÉGRATION DE LA MANUTENTION DES MATÉRIAUX DU MEA PRÉVISIONS, PAR NIVEAU D'AUTOMATISATION DES PROCESSUS, 2019-2032 (MILLIARDS USD) TABLEAU 156. ESTIMATIONS ET ESTIMATIONS DE LA TAILLE DU MARCHÉ DE L'INTÉGRATION DE LA MANUTENTION DES MATÉRIAUX PAR MEA PRÉVISIONS, PAR APPLICATION, 2019-2032 (MILLIARDS USD) TABLEAU 157. ESTIMATIONS ET ESTIMATIONS DE LA TAILLE DU MARCHÉ DE L'INTÉGRATION DE LA MANUTENTION DES MATÉRIAUX DU MEA PRÉVISIONS, PAR RÉGION, 2019-2032 (MILLIARDS USD) TABLEAU 158. PAYS DU CCG INTÉGRATION DE LA MANUTENTION ESTIMATIONS DE LA TAILLE DU MARCHÉ & PRÉVISIONS, PAR TYPE D'INTÉGRATION, 2019-2032 (MILLIARDS USD) TABLEAU 159. PAYS DU CCG INTÉGRATION DE LA MANUTENTION ESTIMATIONS DE LA TAILLE DU MARCHÉ & PRÉVISIONS, PAR INDUSTRIE DES UTILISATEURS FINAUX, 2019-2032 (MILLIARDS USD) TABLEAU 160. PAYS DU CCG INTÉGRATION DE LA MANUTENTION ESTIMATIONS DE LA TAILLE DU MARCHÉ & PRÉVISIONS, PAR TECHNOLOGIE, 2019-2032 (MILLIARDS USD) TABLEAU 161. PAYS DU CCG INTÉGRATION DE LA MANUTENTION ESTIMATIONS DE LA TAILLE DU MARCHÉ & PRÉVISIONS, PAR NIVEAU D'AUTOMATISATION DES PROCESSUS, 2019-2032 (MILLIARDS USD) TABLEAU 162. PAYS DU CCG, ESTIMATIONS DE LA TAILLE DU MARCHÉ DE L'INTÉGRATION DE LA MANUTENTION ET AMP; PRÉVISIONS, PAR APPLICATION, 2019-2032 (MILLIARDS USD) TABLEAU 163. PAYS DU CCG INTÉGRATION DE LA MANUTENTION ESTIMATIONS DE LA TAILLE DU MARCHÉ & PRÉVISIONS, PAR RÉGION, 2019-2032 (MILLIARDS USD) TABLEAU 164. ESTIMATIONS ET ESTIMATIONS DE LA TAILLE DU MARCHÉ DE L'INTÉGRATION DE LA MANUTENTION EN AFRIQUE DU SUD PRÉVISIONS, PAR TYPE D'INTÉGRATION, 2019-2032 (MILLIARDS USD) TABLEAU 165. ESTIMATIONS ET ESTIMATIONS DE LA TAILLE DU MARCHÉ DE L'INTÉGRATION DE LA MANUTENTION EN AFRIQUE DU SUD PRÉVISIONS, PAR INDUSTRIE DES UTILISATEURS FINAUX, 2019-2032 (MILLIARDS USD) TABLEAU 166. ESTIMATIONS ET ESTIMATIONS DE LA TAILLE DU MARCHÉ DE L'INTÉGRATION DE LA MANUTENTION EN AFRIQUE DU SUD PRÉVISIONS, PAR TECHNOLOGIE, 2019-2032 (MILLIARDS USD) TABLEAU 167. ESTIMATIONS ET ESTIMATIONS DE LA TAILLE DU MARCHÉ DE L'INTÉGRATION DE LA MANUTENTION EN AFRIQUE DU SUD PRÉVISIONS, PAR NIVEAU D'AUTOMATISATION DES PROCESSUS, 2019-2032 (MILLIARDS USD) TABLEAU 168. ESTIMATIONS ET ESTIMATIONS DE LA TAILLE DU MARCHÉ DE L'INTÉGRATION DE LA MANUTENTION EN AFRIQUE DU SUD PRÉVISIONS, PAR APPLICATION, 2019-2032 (MILLIARDS USD) TABLEAU 169. ESTIMATIONS ET ESTIMATIONS DE LA TAILLE DU MARCHÉ DE L'INTÉGRATION DE LA MANUTENTION EN AFRIQUE DU SUD PRÉVISIONS, PAR RÉGIONAL, 2019-2032 (MILLIARDS USD) TABLEAU 170. RESTE DU MEA ESTIMATIONS DE LA TAILLE DU MARCHÉ DE L'INTÉGRATION DE LA MANUTENTION ETAMP; PRÉVISIONS, PAR TYPE D'INTÉGRATION, 2019-2032 (MILLIARDS USD) TABLEAU 171. RESTE DE L'AMÉNAGEMENT DE L'INTÉGRATION DE LA MANUTENTION, ESTIMATIONS DE LA TAILLE DU MARCHÉ & PRÉVISIONS, PAR INDUSTRIE DES UTILISATEURS FINAUX, 2019-2032 (MILLIARDS USD) TABLEAU 172. RESTE DU MEA ESTIMATIONS DE LA TAILLE DU MARCHÉ DE L'INTÉGRATION DE LA MANUTENTION ET AMP; PRÉVISIONS, PAR TECHNOLOGIE, 2019-2032 (MILLIARDS USD) TABLEAU 173. RESTE DE L'AMÉNAGEMENT DE L'INTÉGRATION DE LA MANUTENTION, ESTIMATIONS DE LA TAILLE DU MARCHÉ & PRÉVISIONS, PAR NIVEAU D'AUTOMATISATION DES PROCESSUS, 2019-2032 (MILLIARDS USD) TABLEAU 174. RESTE DES ESTIMATIONS ET ESTIMATIONS DE LA TAILLE DU MARCHÉ DE L'INTÉGRATION DE LA MANUTENTION DES MATÉRIAUX DU MEA PRÉVISIONS, PAR APPLICATION, 2019-2032 (MILLIARDS USD) TABLEAU 175. RESTE DU MEA ESTIMATIONS DE LA TAILLE DU MARCHÉ DE L'INTÉGRATION DE LA MANUTENTION ET AMP; PRÉVISIONS, PAR RÉGIONAL, 2019-2032 (MILLIARDS USD) TABLEAU 176. LANCEMENT DE PRODUIT/DEVELOPPEMENT DE PRODUIT/APPROBATION TABLEAU 177. ACQUISITION/PARTENARIAT LISTE DES FIGURES FIGURE 1. SYNOPSIS DU MARCHÉ FIGURE 2. ANALYSE DU MARCHÉ DE L'INTÉGRATION DE LA MANUTENTION EN AMÉRIQUE DU NORD FIGURE 3. INTÉGRATION DE LA MANUTENTION AUX ÉTATS-UNIS ANALYSE DU MARCHÉ PAR TYPE D'INTÉGRATION FIGURE 4. ANALYSE DU MARCHÉ AMÉRICAIN DE L'INTÉGRATION DE LA MANUTENTION PAR INDUSTRIE UTILISATEUR FINAL FIGURE 5. ANALYSE DU MARCHÉ AMÉRICAIN DE L'INTÉGRATION DE LA MANUTENTION PAR TECHNOLOGIE FIGURE 6. ANALYSE DU MARCHÉ AMÉRICAIN DE L'INTÉGRATION DE LA MANUTENTION PAR NIVEAU D'AUTOMATISATION DES PROCÉDÉS CHIFFRE 7. ANALYSE DU MARCHÉ DE L'INTÉGRATION DE LA MANUTENTION DES MATÉRIAUX AUX ÉTATS-UNIS PAR APPLICATION FIGURE 8. ANALYSE DU MARCHÉ DE L'INTÉGRATION DE LA MANUTENTION DES MATÉRIAUX AUX ÉTATS-UNIS PAR RÉGION FIGURE 9. ANALYSE DU MARCHÉ DE L'INTÉGRATION DE LA MANUTENTION DES MATÉRIAUX AU CANADA PAR TYPE D'INTÉGRATION FIGURE 10. MATÉRIEL AU CANADA GÉRER L'ANALYSE DU MARCHÉ DE L'INTÉGRATION PAR L'INDUSTRIE DES UTILISATEURS FINAUX FIGURE 11. ANALYSE DU MARCHÉ DE L'INTÉGRATION DE LA MANUTENTION AU CANADA PAR TECHNOLOGIE FIGURE 12. ANALYSE DU MARCHÉ DE L'INTÉGRATION DE LA MANUTENTION AU CANADA PAR NIVEAU D'AUTOMATISATION DES PROCÉDÉS FIGURE 13. ANALYSE DU MARCHÉ DE L'INTÉGRATION DE LA MANUTENTION AU CANADA PAR APPLICATION FIGURE 14. MARCHÉ CANADIEN DE L’INTÉGRATION DE LA MANUTENTION DES MATÉRIAUX ANALYSE PAR RÉGION FIGURE 15. ANALYSE DU MARCHÉ DE L'INTÉGRATION DE LA MANUTENTION EN EUROPE FIGURE 16. ANALYSE DU MARCHÉ DE L'INTÉGRATION DE LA MANUTENTION EN ALLEMAGNE PAR TYPE D'INTÉGRATION FIGURE 17. ANALYSE DU MARCHÉ DE L'INTÉGRATION DE LA MANUTENTION EN ALLEMAGNE PAR INDUSTRIE UTILISATEUR FINAL < br />CHIFFRE 18. ANALYSE DU MARCHÉ DE L'INTÉGRATION DE LA MANUTENTION EN ALLEMAGNE PAR TECHNOLOGIE FIGURE 19. ANALYSE DU MARCHÉ DE L'INTÉGRATION DE LA MANUTENTION EN ALLEMAGNE PAR NIVEAU D'AUTOMATISATION DES PROCESSUS FIGURE 20. ANALYSE DU MARCHÉ DE L'INTÉGRATION DE LA MANUTENTION EN ALLEMAGNE PAR APPLICATION FIGURE 21. ALLEMAGNE MANUTENTION DES MATÉRIAUX ANALYSE DU MARCHÉ DE L'INTÉGRATION PAR RÉGION FIGURE 22. ANALYSE DU MARCHÉ DE L'INTÉGRATION DE LA MANUTENTION AU ROYAUME-UNI PAR TYPE D'INTÉGRATION FIGURE 23. ANALYSE DU MARCHÉ DE L'INTÉGRATION DE LA MANUTENTION AU ROYAUME-UNI PAR INDUSTRIE UTILISATEUR FINAL FIGURE 24. MARCHÉ DE L'INTÉGRATION DE LA MANUTENTION AU ROYAUME-UNI ANALYSE PAR TECHNOLOGIE FIGURE 25. ANALYSE DU MARCHÉ DE L'INTÉGRATION DE LA MANUTENTION AU ROYAUME-UNI PAR NIVEAU D'AUTOMATISATION DES PROCESSUS FIGURE 26. ANALYSE DU MARCHÉ DE L'INTÉGRATION DE LA MANUTENTION AU ROYAUME-UNI PAR APPLICATION FIGURE 27. ANALYSE DU MARCHÉ DE L'INTÉGRATION DE LA MANUTENTION AU ROYAUME-UNI PAR RÉGION FIGURE 28. ANALYSE DU MARCHÉ DE L’INTÉGRATION DE LA MANUTENTION EN FRANCE PAR TYPE D'INTÉGRATION FIGURE 29. ANALYSE DU MARCHÉ DE L'INTÉGRATION DE LA MANUTENTION EN FRANCE PAR INDUSTRIE UTILISATEUR FINAL FIGURE 30. ANALYSE DU MARCHÉ DE L'INTÉGRATION DE LA MANUTENTION EN FRANCE PAR TECHNOLOGIE FIGURE 31. ANALYSE DU MARCHÉ DE L'INTÉGRATION DE LA MANUTENTION EN FRANCE PAR PROCESSUS NIVEAU D'AUTOMATISATION CHIFFRE 32. ANALYSE DU MARCHÉ DE L'INTÉGRATION DE LA MANUTENTION EN FRANCE PAR APPLICATION FIGURE 33. ANALYSE DU MARCHÉ DE L'INTÉGRATION DE LA MANUTENTION EN FRANCE PAR RÉGION FIGURE 34. ANALYSE DU MARCHÉ DE L'INTÉGRATION DE LA MANUTENTION EN RUSSIE PAR TYPE D'INTÉGRATION FIGURE 35. ANALYSE DU MARCHÉ DE L'INTÉGRATION DE LA MANUTENTION EN RUSSIE PAR TYPE D'INTÉGRATION GESTION DE L'ANALYSE DU MARCHÉ DE L'INTÉGRATION PAR FIN INDUSTRIE UTILISATEUR FIGURE 36. ANALYSE DU MARCHÉ DE L'INTÉGRATION DE LA MANUTENTION EN RUSSIE PAR TECHNOLOGIE FIGURE 37. ANALYSE DU MARCHÉ DE L'INTÉGRATION DE LA MANUTENTION EN RUSSIE PAR NIVEAU D'AUTOMATISATION DES PROCESSUS FIGURE 38. ANALYSE DU MARCHÉ DE L'INTÉGRATION DE LA MANUTENTION EN RUSSIE PAR APPLICATION < br />CHIFFRE 39. ANALYSE DU MARCHÉ DE L'INTÉGRATION DE LA MANUTENTION EN RUSSIE PAR RÉGION FIGURE 40. ANALYSE DU MARCHÉ DE L'INTÉGRATION DE LA MANUTENTION EN ITALIE PAR TYPE D'INTÉGRATION FIGURE 41. ANALYSE DU MARCHÉ DE L'INTÉGRATION DE LA MANUTENTION EN ITALIE PAR INDUSTRIE UTILISATEUR FINAL FIGURE 42. INTÉGRATION DE LA MANUTENTION EN ITALIE ANALYSE DU MARCHÉ PAR TECHNOLOGIE FIGURE 43. ANALYSE DU MARCHÉ DE L'INTÉGRATION DE LA MANUTENTION EN ITALIE PAR NIVEAU D'AUTOMATISATION DES PROCESSUS FIGURE 44. ANALYSE DU MARCHÉ DE L'INTÉGRATION DE LA MANUTENTION EN ITALIE PAR APPLICATION FIGURE 45. ANALYSE DU MARCHÉ DE L'INTÉGRATION DE LA MANUTENTION EN ITALIE PAR APPLICATION RÉGIONAL FIGURE 46. ANALYSE DU MARCHÉ DE L'INTÉGRATION DE LA MANUTENTION EN ESPAGNE PAR TYPE D'INTÉGRATION FIGURE 47. ANALYSE DU MARCHÉ DE L'INTÉGRATION DE LA MANUTENTION EN ESPAGNE PAR INDUSTRIE UTILISATEUR FINAL FIGURE 48. ANALYSE DU MARCHÉ DE L'INTÉGRATION DE LA MANUTENTION EN ESPAGNE PAR TECHNOLOGIE FIGURE 49. MANUTENTION EN ESPAGNE ANALYSE DU MARCHÉ DE L'INTÉGRATION PAR NIVEAU D'AUTOMATISATION DES PROCESSUS FIGURE 50. ANALYSE DU MARCHÉ DE L'INTÉGRATION DE LA MANUTENTION EN ESPAGNE PAR APPLICATION FIGURE 51. ANALYSE DU MARCHÉ DE L'INTÉGRATION DE LA MANUTENTION EN ESPAGNE PAR RÉGION FIGURE 52. RESTE DE L'EUROPE INTÉGRATION DE LA MANUTENTION ANALYSE DU MARCHÉ PAR TYPE D'INTÉGRATION FIGURE 53. ANALYSE DU MARCHÉ DE L'INTÉGRATION DE LA MANUTENTION DU RESTE DE L'EUROPE PAR INDUSTRIE DES UTILISATEURS FINAUX FIGURE 54. ANALYSE DU MARCHÉ DE L'INTÉGRATION DE LA MANUTENTION DU RESTE DE L'EUROPE PAR TECHNOLOGIE FIGURE 55. ANALYSE DU MARCHÉ DE L'INTÉGRATION DE LA MANUTENTION DU RESTE DE L'EUROPE PAR NIVEAU D'AUTOMATISATION DES PROCESSUS FIGURE 56. ANALYSE DU MARCHÉ DE L'INTÉGRATION DE LA MANUTENTION DU RESTE DE L'EUROPE PAR APPLICATION FIGURE 57. ANALYSE DU MARCHÉ DE L'INTÉGRATION DE LA MANUTENTION DU RESTE DE L'EUROPE PAR RÉGION FIGURE 58. ANALYSE DU MARCHÉ DE L'INTÉGRATION DE LA MANUTENTION APAC FIGURE 59. POIGNÉE MATÉRIELLE CHINEANALYSE DU MARCHÉ DE L'INTÉGRATION D'ING PAR TYPE D'INTÉGRATION FIGURE 60. ANALYSE DU MARCHÉ DE L'INTÉGRATION DE LA MANUTENTION EN CHINE PAR INDUSTRIE UTILISATEUR FINAL FIGURE 61. ANALYSE DU MARCHÉ DE L'INTÉGRATION DE LA MANUTENTION EN CHINE PAR TECHNOLOGIE FIGURE 62. INTÉGRATION DE LA MANUTENTION DES MATÉRIAUX EN CHINE ANALYSE DE MARCHÉ PAR NIVEAU D'AUTOMATISATION DES PROCESSUS FIGURE 63. ANALYSE DU MARCHÉ DE L'INTÉGRATION DE LA MANUTENTION EN CHINE PAR APPLICATION FIGURE 64. ANALYSE DU MARCHÉ DE L'INTÉGRATION DE LA MANUTENTION EN CHINE PAR RÉGION FIGURE 65. ANALYSE DU MARCHÉ DE L'INTÉGRATION DE LA MANUTENTION EN INDE PAR TYPE D'INTÉGRATION < br />FIGURE 66. MATÉRIEL INDE ANALYSE DU MARCHÉ DE L'INTÉGRATION DE LA MANUTENTION PAR INDUSTRIE UTILISATEUR FINAL FIGURE 67. ANALYSE DU MARCHÉ DE L'INTÉGRATION DE LA MANUTENTION EN INDE PAR TECHNOLOGIE FIGURE 68. ANALYSE DU MARCHÉ DE L'INTÉGRATION DE LA MANUTENTION EN INDE PAR NIVEAU D'AUTOMATISATION DES PROCESSUS FIGURE 69. MANUTENTION DES MATÉRIAUX EN INDE ANALYSE DU MARCHÉ DE L'INTÉGRATION PAR APPLICATION FIGURE 70. ANALYSE DU MARCHÉ DE L'INTÉGRATION DE LA MANUTENTION EN INDE PAR RÉGION FIGURE 71. ANALYSE DU MARCHÉ DE L'INTÉGRATION DE LA MANUTENTION AU JAPON PAR TYPE D'INTÉGRATION FIGURE 72. ANALYSE DU MARCHÉ DE L'INTÉGRATION DE LA MANUTENTION AU JAPON PAR INDUSTRIE UTILISATEUR FINAL FIGURE 73. MATÉRIEL JAPON ANALYSE DU MARCHÉ DE L'INTÉGRATION DE LA MANUTENTION PAR TECHNOLOGIE FIGURE 74. ANALYSE DU MARCHÉ DE L'INTÉGRATION DE LA MANUTENTION AU JAPON PAR NIVEAU D'AUTOMATISATION DES PROCESSUS FIGURE 75. ANALYSE DU MARCHÉ DE L'INTÉGRATION DE LA MANUTENTION AU JAPON PAR APPLICATION FIGURE 76. MARCHÉ DE L'INTÉGRATION DE LA MANUTENTION AU JAPON ANALYSE PAR RÉGIONAL FIGURE 77. ANALYSE DU MARCHÉ DE L'INTÉGRATION DE LA MANUTENTION EN CORÉE DU SUD PAR TYPE D'INTÉGRATION FIGURE 78. ANALYSE DU MARCHÉ DE L'INTÉGRATION DE LA MANUTENTION EN CORÉE DU SUD PAR INDUSTRIE UTILISATEUR FINAL FIGURE 79. ANALYSE DU MARCHÉ DE L'INTÉGRATION DE LA MANUTENTION EN CORÉE DU SUD PAR TECHNOLOGIE < br />FIGURE 80. ANALYSE DU MARCHÉ DE L'INTÉGRATION DE LA MANUTENTION EN CORÉE DU SUD PAR NIVEAU D'AUTOMATISATION DES PROCESSUS FIGURE 81. ANALYSE DU MARCHÉ DE L'INTÉGRATION DE LA MANUTENTION EN CORÉE DU SUD PAR APPLICATION FIGURE 82. ANALYSE DU MARCHÉ DE L'INTÉGRATION DE LA MANUTENTION EN CORÉE DU SUD PAR RÉGION FIGURE 83. MARCHÉ DE L'INTÉGRATION DE LA MANUTENTION DES MATÉRIAUX EN MALAISIE ANALYSE PAR TYPE D'INTÉGRATION FIGURE 84. ANALYSE DU MARCHÉ DE L'INTÉGRATION DE LA MANUTENTION EN MALAISIE PAR INDUSTRIE UTILISATEUR FINAL FIGURE 85. ANALYSE DU MARCHÉ DE L'INTÉGRATION DE LA MANUTENTION EN MALAISIE PAR TECHNOLOGIE FIGURE 86. ANALYSE DU MARCHÉ DE L'INTÉGRATION DE LA MANUTENTION EN MALAISIE PAR TECHNOLOGIE PROCESSUS NIVEAU D'AUTOMATISATION FIGURE 87. ANALYSE DU MARCHÉ DE L'INTÉGRATION DE LA MANUTENTION EN MALAISIE PAR APPLICATION FIGURE 88. ANALYSE DU MARCHÉ DE L'INTÉGRATION DE LA MANUTENTION EN MALAISIE PAR RÉGION FIGURE 89. ANALYSE DU MARCHÉ DE L'INTÉGRATION DE LA MANUTENTION EN THAÏLANDE PAR TYPE D'INTÉGRATION FIGURE 90. THAÏLANDE ANALYSE DU MARCHÉ DE L'INTÉGRATION DE LA MANUTENTION PAR INDUSTRIE UTILISATEUR FINAL FIGURE 91. ANALYSE DU MARCHÉ DE L'INTÉGRATION DE LA MANUTENTION EN THAÏLANDE PAR TECHNOLOGIE FIGURE 92. ANALYSE DU MARCHÉ DE L'INTÉGRATION DE LA MANUTENTION EN THAÏLANDE PAR NIVEAU D'AUTOMATISATION DES PROCESSUS FIGURE 93. MATÉRIAUX EN THAÏLANDE GÉRER LE MARCHÉ DE L’INTÉGRATION ANALYSE PAR APPLICATION FIGURE 94. ANALYSE DU MARCHÉ DE L'INTÉGRATION DE LA MANUTENTION EN THAÏLANDE PAR RÉGION FIGURE 95. ANALYSE DU MARCHÉ DE L'INTÉGRATION DE LA MANUTENTION EN INDONÉSIE PAR TYPE D'INTÉGRATION FIGURE 96. ANALYSE DU MARCHÉ DE L'INTÉGRATION DE LA MANUTENTION EN INDONÉSIE PAR UTILISATEUR FINAL INDUSTRIE FIGURE 97. ANALYSE DU MARCHÉ DE L'INTÉGRATION DE LA MANUTENTION EN INDONÉSIE PAR TECHNOLOGIE FIGURE 98. ANALYSE DU MARCHÉ DE L'INTÉGRATION DE LA MANUTENTION EN INDONÉSIE PAR NIVEAU D'AUTOMATISATION DES PROCESSUS FIGURE 99. ANALYSE DU MARCHÉ DE L'INTÉGRATION DE LA MANUTENTION EN INDONÉSIE PAR APPLICATION FIGURE 100. ANALYSE DU MARCHÉ DE L'INTÉGRATION DE LA MANUTENTION EN INDONÉSIE PAR RÉGION FIGURE 101. ANALYSE DU MARCHÉ DE L'INTÉGRATION DE LA MANUTENTION DES MATÉRIAUX RESTE DE L'APAC PAR TYPE D'INTÉGRATION FIGURE 102. ANALYSE DU MARCHÉ DE L'INTÉGRATION DE LA MANUTENTION DES MATÉRIAUX APAC RESTE PAR INDUSTRIE UTILISATEUR FINAL FIGURE 103. RESTE DU MATÉRIEL APAC ANALYSE DU MARCHÉ DE L'INTÉGRATION DE LA MANUTENTION PAR TECHNOLOGIE FIGURE 104. RESTE DE L'ANALYSE DU MARCHÉ DE L'INTÉGRATION DE LA MANUTENTION APAC PAR NIVEAU D'AUTOMATISATION DES PROCESSUS FIGURE 105. RESTE DE L'ANALYSE DU MARCHÉ DE L'INTÉGRATION DE LA MANUTENTION APAC PAR APPLICATION FIGURE 106. RESTE DE L'INTÉGRATION DE LA MANUTENTION DES MATÉRIAUX APAC ANALYSE DU MARCHÉ PAR RÉGION FIGURE 107. ANALYSE DU MARCHÉ DE L'INTÉGRATION DE LA MANUTENTION EN AMÉRIQUE DU SUD FIGURE 108. ANALYSE DU MARCHÉ DE L'INTÉGRATION DE LA MANUTENTION AU BRÉSIL PAR TYPE D'INTÉGRATION FIGURE 109. ANALYSE DU MARCHÉ DE L'INTÉGRATION DE LA MANUTENTION AU BRÉSIL PAR UTILISATEUR FINAL INDUSTRIE FIGURE 110. ANALYSE DU MARCHÉ DE L'INTÉGRATION DE LA MANUTENTION AU BRÉSIL PAR TECHNOLOGIE FIGURE 111. ANALYSE DU MARCHÉ DE L'INTÉGRATION DE LA MANUTENTION AU BRÉSIL PAR NIVEAU D'AUTOMATISATION DES PROCESSUS FIGURE 112. ANALYSE DU MARCHÉ DE L'INTÉGRATION DE LA MANUTENTION AU BRÉSIL PAR APPLICATION FIGURE 113. BRÉSIL ANALYSE DU MARCHÉ DE L'INTÉGRATION DE LA MANUTENTION PAR RÉGION FIGURE 114. ANALYSE DU MARCHÉ DE L'INTÉGRATION DE LA MANUTENTION AU MEXIQUE PAR TYPE D'INTÉGRATION FIGURE 115. ANALYSE DU MARCHÉ DE L'INTÉGRATION DE LA MANUTENTION AU MEXIQUE PAR INDUSTRIE UTILISATEUR FINAL FIGURE 116. MANUTENTION DES MATÉRIAUX AU MEXIQUE MARCHÉ DE L'INTÉGRATION ANALYSE PAR TECHNOLOGIE FIGURE 117. ANALYSE DU MARCHÉ DE L'INTÉGRATION DE LA MANUTENTION AU MEXIQUE PAR NIVEAU D'AUTOMATISATION DES PROCESSUS FIGURE 118. ANALYSE DU MARCHÉ DE L'INTÉGRATION DE LA MANUTENTION AU MEXIQUE PAR APPLICATION FIGURE 119. ANALYSE DU MARCHÉ DE L'INTÉGRATION DE LA MANUTENTION AU MEXIQUE PAR RÉGION FIGURE 120. ANALYSE DU MARCHÉ DE L'INTÉGRATION DE LA MANUTENTION EN ARGENTINE PAR TYPE D'INTÉGRATION FIGURE 121. ANALYSE DU MARCHÉ DE L'INTÉGRATION DE LA MANUTENTION EN ARGENTINE PAR INDUSTRIE UTILISATEUR FINAL FIGURE 122. ANALYSE DU MARCHÉ DE L'INTÉGRATION DE LA MANUTENTION EN ARGENTINE PAR TECHNOLOGIE CHIFFRE 123. ANALYSE DU MARCHÉ DE L'INTÉGRATION DE LA MANUTENTION EN ARGENTINE PAR NIVEAU D'AUTOMATISATION DES PROCESSUS FIGURE 124. ANALYSE DU MARCHÉ DE L'INTÉGRATION DE LA MANUTENTION EN ARGENTINE PAR APPLICATION FIGURE 125. ANALYSE DU MARCHÉ DE L'INTÉGRATION DE LA MANUTENTION EN ARGENTINE PAR RÉGION FIGURE 126. RESTE DU SUD ANALYSE DU MARCHÉ DE L'INTÉGRATION DE LA MANUTENTION EN AMÉRIQUE PAR TYPE D'INTÉGRATION FIGURE 127. RESTE DE L'AMÉRIQUE DU SUD ANALYSE DU MARCHÉ DE L'INTÉGRATION DE LA MANUTENTION PAR INDUSTRIE UTILISATEUR FINAL FIGURE 128. RESTE DE L'AMÉRIQUE DU SUD ANALYSE DU MARCHÉ DE L'INTÉGRATION DE LA MANUTENTION PAR TECHNOLOGIE
    GRAPHIQUE 129. RESTE DE L'AMÉRIQUE DU SUD ANALYSE DU MARCHÉ DE L'INTÉGRATION DE LA MANUTENTION PAR NIVEAU D'AUTOMATISATION DES PROCESSUS FIGURE 130. RESTE DE L'AMÉRIQUE DU SUD ANALYSE DU MARCHÉ DE L'INTÉGRATION DE LA MANUTENTION PAR APPLICATION FIGURE 131. RESTE DE L'AMÉRIQUE DU SUD ANALYSE DU MARCHÉ DE L'INTÉGRATION DE LA MANUTENTION PAR RÉGION br />FIGURE 132. MEA ANALYSE DU MARCHÉ DE L'INTÉGRATION DE LA MANUTENTION FIGURE 133. ANALYSE DU MARCHÉ DE L'INTÉGRATION DE LA MANUTENTION DES PAYS DU CCG PAR TYPE D'INTÉGRATION FIGURE 134. ANALYSE DU MARCHÉ DE L'INTÉGRATION DE LA MANUTENTION DES PAYS DU CCG PAR INDUSTRIE DES UTILISATEURS FINAUX FIGURE 135. PAYS DU CCG INTÉGRATION DE LA MANUTENTION DES MATÉRIAUX ANALYSE DU MARCHÉ PAR TECHNOLOGIE FIGURE 136. ANALYSE DU MARCHÉ DE L'INTÉGRATION DE LA MANUTENTION DES PAYS DU CCG PAR NIVEAU D'AUTOMATISATION DES PROCESSUS FIGURE 137. ANALYSE DU MARCHÉ DE L'INTÉGRATION DE LA MANUTENTION DES PAYS DU CCG PAR APPLICATION FIGURE 138. INTÉGRATION DE LA MANUTENTION DES PAYS DU CCG ANALYSE DE MARCHÉ PAR RÉGIONAL FIGURE 139. ANALYSE DU MARCHÉ DE L'INTÉGRATION DE LA MANUTENTION EN AFRIQUE DU SUD PAR TYPE D'INTÉGRATION FIGURE 140. ANALYSE DU MARCHÉ DE L'INTÉGRATION DE LA MANUTENTION EN AFRIQUE DU SUD PAR INDUSTRIE UTILISATEUR FINAL FIGURE 141. ANALYSE DU MARCHÉ DE L'INTÉGRATION DE LA MANUTENTION EN AFRIQUE DU SUD PAR TECHNOLOGIE FIGURE 142. ANALYSE DU MARCHÉ DE L'INTÉGRATION DE LA MANUTENTION EN AFRIQUE DU SUD PAR NIVEAU D'AUTOMATISATION DES PROCESSUS FIGURE 143. ANALYSE DU MARCHÉ DE L'INTÉGRATION DE LA MANUTENTION EN AFRIQUE DU SUD PAR APPLICATION FIGURE 144. ANALYSE DU MARCHÉ DE L'INTÉGRATION DE LA MANUTENTION EN AFRIQUE DU SUD PAR RÉGION CHIFFRE 145. RESTE DE L'ANALYSE DU MARCHÉ DE L'INTÉGRATION DE LA MANUTENTION DES MATÉRIAUX MEA PAR TYPE D'INTÉGRATION FIGURE 146. RESTE DE L'ANALYSE DU MARCHÉ DE L'INTÉGRATION DE LA MANUTENTION DES MATÉRIAUX MEA PAR INDUSTRIE UTILISATEUR FINAL FIGURE 147. RESTE DE L'ANALYSE DU MARCHÉ DE L'INTÉGRATION DE LA MANUTENTION DES MATÉRIAUX MEA PAR TECHNOLOGIE br />CHIFFRE 148. RESTE DE L'ANALYSE DU MARCHÉ DE L'INTÉGRATION DE LA MANUTENTION MEA PAR NIVEAU D'AUTOMATISATION DES PROCESSUS FIGURE 149. RESTE DE L'ANALYSE DU MARCHÉ DE L'INTÉGRATION DE LA MANUTENTION MEA PAR APPLICATION FIGURE 150. RESTE DE L'ANALYSE DU MARCHÉ DE L'INTÉGRATION DE LA MANUTENTION MEA PAR RÉGION FIGURE 151. CLÉ CRITÈRES D'ACHAT DU MARCHÉ DE L'INTÉGRATION DE LA MANUTENTION FIGURE 152. PROCESSUS DE RECHERCHE DU MRFR FIGURE 153. ANALYSE DRO DU MARCHÉ DE L'INTÉGRATION DE LA MANUTENTION FIGURE 154. ANALYSE D'IMPACT DES FACTEURS : MARCHÉ DE L'INTÉGRATION DE LA MANUTENTION
    FIGURE 155. IMPACT DES RETENUES ANALYSE : MARCHÉ DE L'INTÉGRATION DE LA MANUTENTION FIGURE 156. CHAÎNE D'APPROVISIONNEMENT / DE VALEUR : MARCHÉ DE L'INTÉGRATION DE LA MANUTENTION FIGURE 157. MARCHÉ DE L'INTÉGRATION DE LA MANUTENTION, PAR TYPE D'INTÉGRATION, 2024 (% DE PART) FIGURE 158. MARCHÉ DE L'INTÉGRATION DE LA MANUTENTION, PAR TYPE D'INTÉGRATION, 2019 À 2032 (en milliards USD) FIGURE 159. MARCHÉ DE L'INTÉGRATION DE LA MANUTENTION, PAR INDUSTRIE DES UTILISATEURS FINAUX, 2024 (PART EN%) FIGURE 160. MARCHÉ DE L'INTÉGRATION DE LA MANUTENTION, PAR INDUSTRIE DES UTILISATEURS FINAUX, 2019 À 2032 ( Milliards USD) CHIFFRE 161. MARCHÉ DE L'INTÉGRATION DE LA MANUTENTION, PAR TECHNOLOGIE, 2024 (PARTAGE EN%) FIGURE 162. MARCHÉ DE L'INTÉGRATION DE LA MANUTENTION, PAR TECHNOLOGIE, 2019 À 2032 (en milliards USD) FIGURE 163. MARCHÉ DE L'INTÉGRATION DE LA MANUTENTION, PAR NIVEAU D’AUTOMATISATION DES PROCÉDÉS, 2024 (% PART) FIGURE 164. MARCHÉ DE L'INTÉGRATION DE LA MANUTENTION, PAR NIVEAU D'AUTOMATISATION DES PROCESSUS, 2019 À 2032 (en milliards USD) FIGURE 165. MARCHÉ DE L'INTÉGRATION DE LA MANUTENTION, PAR APPLICATION, 2024 (% PART) FIGURE 166. MARCHÉ DE L'INTÉGRATION DE LA MANUTENTION, PAR APPLICATION, 2019 À 2032 (en milliards USD) FIGURE 167. MARCHÉ DE L'INTÉGRATION DE LA MANUTENTION, PAR RÉGION, 2024 (PART EN%) FIGURE 168. MARCHÉ DE L'INTÉGRATION DE LA MANUTENTION, PAR RÉGION, 2019 À 2032 (en milliards USD) < br />FIGURE 169. ANALYSE ANALYTIQUE DES PRINCIPAUX CONCURRENTS

    Segmentation du marché de l'intégration de la manutention


    • Marché de l'intégration de la manutention par type d'intégration (en milliards USD, 2019-2032)

      • Intégration logicielle

      • Intégration matérielle

      • Intégration du système


    • Marché de l'intégration de la manutention par secteur d'activité des utilisateurs finaux (en milliards USD, 2019-2032)

      • Fabrication

      • Commerce de détail

      • Nourriture et boissons

      • Pharmaceutique

      • Automobile


    • Marché de l'intégration de la manutention par technologie (en milliards USD, 2019-2032)

      • Véhicules à guidage automatique (AGV)

      • Robotique

      • Solutions compatibles IoT

      • Intelligence artificielle (IA)


    • Marché de l'intégration de la manutention par niveau d'automatisation des processus (en milliards USD, 2019-2032)

      • Manuel

      • Semi-automatisé

      • Entièrement automatisé


    • Marché de l'intégration de la manutention par application (en milliards USD, 2019-2032)

      • Gestion d'entrepôt

      • Gestion des stocks

      • Exécution des commandes

      • Gestion des transports


    • Marché de l'intégration de la manutention par région (en milliards USD, 2019-2032)

      • Amérique du Nord

      • Europe

      • Amérique du Sud

      • Asie-Pacifique

      • Moyen-Orient et Afrique


    Perspectives régionales du marché de l'intégration de la manutention (en milliards USD, 2019-2032)


    • Perspectives de l'Amérique du Nord (milliards USD, 2019-2032)

      • Marché de l'intégration de la manutention en Amérique du Nord par type d'intégration

        • Intégration logicielle

        • Intégration matérielle

        • Intégration du système

      • Marché de l'intégration de la manutention en Amérique du Nord par type d'industrie d'utilisateur final

        • Fabrication

        • Commerce de détail

        • Nourriture et boissons

        • Pharmaceutique

        • Automobile

      • Marché de l'intégration de la manutention en Amérique du Nord par type de technologie

        • Véhicules à guidage automatique (AGV)

        • Robotique

        • Solutions compatibles IoT

        • Intelligence artificielle (IA)

      • Marché de l'intégration de la manutention en Amérique du Nord par type de niveau d'automatisation des processus

        • Manuel

        • Semi-automatisé

        • Entièrement automatisé

      • Marché de l'intégration de la manutention en Amérique du Nord par type d'application

        • Gestion d'entrepôt

        • Gestion des stocks

        • Exécution des commandes

        • Gestion des transports

      • Marché de l'intégration de la manutention en Amérique du Nord par type régional

        • États-Unis

        • Canada

      • Perspectives des États-Unis (milliards USD, 2019-2032)

      • Marché américain de l'intégration de la manutention par type d'intégration

        • Intégration logicielle

        • Intégration matérielle

        • Intégration du système

      • Marché américain de l'intégration de la manutention par type d'industrie d'utilisateur final

        • Fabrication

        • Commerce de détail

        • Nourriture et boissons

        • Pharmaceutique

        • Automobile

      • Marché américain de l'intégration de la manutention par type de technologie

        • Véhicules à guidage automatique (AGV)

        • Robotique

        • Solutions compatibles IoT

        • Intelligence artificielle (IA)

      • Marché américain de l'intégration de la manutention par type de niveau d'automatisation des processus

        • Manuel

        • Semi-automatisé

        • Entièrement automatisé

      • Marché américain de l'intégration de la manutention par type d'application

        • Gestion d'entrepôt

        • Gestion des stocks

        • Exécution des commandes

        • Gestion des transports

      • Perspectives du CANADA (milliards USD, 2019-2032)

      • Marché canadien de l'intégration de la manutention par type d'intégration

        • Intégration logicielle

        • Intégration matérielle

        • Intégration du système

      • Marché canadien de l'intégration de la manutention par type d'industrie d'utilisateur final

        • Fabrication

        • Commerce de détail

        • Nourriture et boissons

        • Pharmaceutique

        • Automobile

      • Marché canadien de l'intégration de la manutention par type de technologie

        • Véhicules à guidage automatique (AGV)

        • Robotique

        • Solutions compatibles IoT

        • Intelligence artificielle (IA)

      • Marché canadien de l'intégration de la manutention par type de niveau d'automatisation des processus

        • Manuel

        • Semi-automatisé

        • Entièrement automatisé

      • Marché canadien de l'intégration de la manutention par type d'application

        • Gestion d'entrepôt

        • Gestion des stocks

        • Exécution des commandes

        • Gestion des transports

    • Perspectives européennes (milliards USD, 2019-2032)

      • Marché européen de l'intégration de la manutention par type d'intégration

        • Intégration logicielle

        • Intégration matérielle

        • Intégration du système

      • Marché européen de l'intégration de la manutention par type d'industrie d'utilisateur final

        • Fabrication

        • Commerce de détail

        • Nourriture et boissons

        • Pharmaceutique

        • Automobile

      • Marché européen de l'intégration de la manutention par type de technologie

        • Véhicules à guidage automatique (AGV)

        • Robotique

        • Solutions compatibles IoT

        • Intelligence artificielle (IA)

      • Marché européen de l'intégration de la manutention par type de niveau d'automatisation des processus

        • Manuel

        • Semi-automatisé

        • Entièrement automatisé

      • Marché européen de l'intégration de la manutention par type d'application

        • Gestion d'entrepôt

        • Gestion des stocks

        • Exécution des commandes

        • Gestion des transports

      • Marché européen de l’intégration de la manutention par type régional

        • Allemagne

        • Royaume-Uni

        • France

        • Russie

        • Italie

        • Espagne

        • Reste de l'Europe

      • Perspectives de l'ALLEMAGNE (milliards USD, 2019-2032)

      • ALLEMAGNE Marché de l'intégration de la manutention par type d'intégration

        • Intégration logicielle

        • Intégration matérielle

        • Intégration du système

      • ALLEMAGNE Marché de l'intégration de la manutention par type d'industrie d'utilisateur final

        • Fabrication

        • Commerce de détail

        • Nourriture et boissons

        • Pharmaceutique

        • Automobile

      • ALLEMAGNE Marché de l'intégration de la manutention par type de technologie

        • Véhicules à guidage automatique (AGV)

        • Robotique

        • Solutions compatibles IoT

        • Intelligence artificielle (IA)

      • ALLEMAGNE Marché de l'intégration de la manutention par type de niveau d'automatisation des processus

        • Manuel

        • Semi-automatisé

        • Entièrement automatisé

      • ALLEMAGNE Marché de l'intégration de la manutention par type d'application

        • Gestion d'entrepôt

        • Gestion des stocks

        • Exécution des commandes

        • Gestion des transports

      • Perspectives du Royaume-Uni (milliards USD, 2019-2032)

      • Marché britannique de l'intégration de la manutention par type d'intégration

        • Intégration logicielle

        • Intégration matérielle

        • Intégration du système

      • Marché britannique de l'intégration de la manutention par type d'industrie d'utilisateur final

        • Fabrication

        • Commerce de détail

        • Nourriture et boissons

        • Pharmaceutique

        • Automobile

      • Marché britannique de l'intégration de la manutention par type de technologie

        • Véhicules à guidage automatique (AGV)

        • Robotique

        • Solutions compatibles IoT

        • Intelligence artificielle (IA)

      • Marché britannique de l'intégration de la manutention par type de niveau d'automatisation des processus

        • Manuel

        • Semi-automatisé

        • Entièrement automatisé

      • Marché britannique de l'intégration de la manutention par type d'application

        • Gestion d'entrepôt

        • Gestion des stocks

        • Exécution des commandes

        • Gestion des transports

      • Perspectives de la FRANCE (en milliards de dollars, 2019-2032)

      • FRANCE Marché de l'intégration de la manutention par type d'intégration

        • Intégration logicielle

        • Intégration matérielle

        • Intégration du système

      • FRANCE Marché de l'intégration de la manutention par type d'industrie d'utilisateur final

        • Fabrication

        • Commerce de détail

        • Nourriture et boissons

        • Pharmaceutique

        • Automobile

      • FRANCE Marché de l'intégration de la manutention par type de technologie

        • Véhicules à guidage automatique (AGV)

        • Robotique

        • Solutions compatibles IoT

        • Intelligence artificielle (IA)

      • FRANCE Marché de l'intégration de la manutention par type de niveau d'automatisation des processus

        • Manuel

        • Semi-automatisé

        • Entièrement automatisé

      • FRANCE Marché de l'intégration de la manutention par type d'application

        • Gestion d'entrepôt

        • Gestion des stocks

        • Exécution des commandes

        • Gestion des transports

      • Perspectives de la RUSSIE (milliards USD, 2019-2032)

      • Marché de l'intégration de la manutention en RUSSIE par type d'intégration

        • Intégration logicielle

        • Intégration matérielle

        • Intégration du système

      • Marché de l'intégration de la manutention en RUSSIE par type d'industrie d'utilisateur final

        • Fabrication

        • Commerce de détail

        • Nourriture et boissons

        • Pharmaceutique

        • Automobile

      • Marché de l'intégration de la manutention en RUSSIE par type de technologie

        • Véhicules à guidage automatique (AGV)

        • Robotique

        • Solutions compatibles IoT

        • Intelligence artificielle (IA)

      • Marché de l'intégration de la manutention en RUSSIE par type de niveau d'automatisation des processus

        • Manuel

        • Semi-automatisé

        • Entièrement automatisé

      • Marché de l'intégration de la manutention en RUSSIE par type d'application

        • Gestion d'entrepôt

        • Gestion des stocks

        • Exécution des commandes

        • Gestion des transports

      • Perspectives de l'ITALIE (milliards USD, 2019-2032)

      • ITALIE Marché de l'intégration de la manutention par type d'intégration

        • Intégration logicielle

        • Intégration matérielle

        • Intégration du système

      • ITALIE Marché de l'intégration de la manutention par type d'industrie d'utilisateur final

        • Fabrication

        • Commerce de détail

        • Nourriture et boissons

        • Pharmaceutique

        • Automobile

      • ITALIE Marché de l’intégration de la manutention par type de technologie

        • Véhicules à guidage automatique (AGV)

        • Robotique

        • Solutions compatibles IoT

        • Intelligence artificielle (IA)

      • ITALIE Marché de l'intégration de la manutention par type de niveau d'automatisation des processus

        • Manuel

        • Semi-automatisé

        • Entièrement automatisé

      • ITALIE Marché de l'intégration de la manutention par type d'application

        • Gestion d'entrepôt

        • Gestion des stocks

        • Exécution des commandes

        • Gestion des transports

      • Perspectives de l'ESPAGNE (milliards USD, 2019-2032)

      • ESPAGNE Marché de l'intégration de la manutention par type d'intégration

        • Intégration logicielle

        • Intégration matérielle

        • Intégration du système

      • ESPAGNE Marché de l'intégration de la manutention par type d'industrie d'utilisateur final

        • Fabrication

        • Commerce de détail

        • Nourriture et boissons

        • Pharmaceutique

        • Automobile

      • ESPAGNE Marché de l'intégration de la manutention par type de technologie

        • Véhicules à guidage automatique (AGV)

        • Robotique

        • Solutions compatibles IoT

        • Intelligence artificielle (IA)

      • ESPAGNE Marché de l'intégration de la manutention par type de niveau d'automatisation des processus

        • Manuel

        • Semi-automatisé

        • Entièrement automatisé

      • ESPAGNE Marché de l'intégration de la manutention par type d'application

        • Gestion d'entrepôt

        • Gestion des stocks

        • Exécution des commandes

        • Gestion des transports

      • Perspectives RESTE DE L'EUROPE (milliards USD, 2019-2032)

      • RESTE DE L'EUROPE Marché de l'intégration de la manutention par type d'intégration

        • Intégration logicielle

        • Intégration matérielle

        • Intégration du système

      • RESTE DE L'EUROPE Marché de l'intégration de la manutention par type d'industrie d'utilisateur final

        • Fabrication

        • Commerce de détail

        • Nourriture et boissons

        • Pharmaceutique

        • Automobile

      • RESTE DE L'EUROPE Marché de l'intégration de la manutention par type de technologie

        • Véhicules à guidage automatique (AGV)

        • Robotique

        • Solutions compatibles IoT

        • Intelligence artificielle (IA)

      • RESTE DE L'EUROPE Marché de l'intégration de la manutention par type de niveau d'automatisation des processus

        • Manuel

        • Semi-automatisé

        • Entièrement automatisé

      • RESTE DE L'EUROPE Marché de l'intégration de la manutention par type d'application

        • Gestion d'entrepôt

        • Gestion des stocks

        • Exécution des commandes

        • Gestion des transports

    • Perspectives APAC (milliards USD, 2019-2032)

      • Marché de l'intégration de la manutention des matériaux APAC par type d'intégration

        • Intégration logicielle

        • Intégration matérielle

        • Intégration du système

      • Marché de l'intégration de la manutention des matériaux APAC par type d'industrie d'utilisateur final

        • Fabrication

        • Commerce de détail

        • Nourriture et boissons

        • Pharmaceutique

        • Automobile

      • Marché de l'intégration de la manutention des matériaux APAC par type de technologie

        • Véhicules à guidage automatique (AGV)

        • Robotique

        • Solutions compatibles IoT

        • Intelligence artificielle (IA)

      • Marché de l'intégration de la manutention des matériaux APAC par type de niveau d'automatisation des processus

        • Manuel

        • Semi-automatisé

        • Entièrement automatisé

      • Marché de l'intégration de la manutention des matériaux APAC par type d'application

        • Gestion d'entrepôt

        • Gestion des stocks

        • Exécution des commandes

        • Gestion des transports

      • Marché de l'intégration de la manutention des matériaux APAC par type régional

        • Chine

        • Inde

        • Japon

        • Corée du Sud

        • Malaisie

        • Thaïlande

        • Indonésie

        • Reste de l'APAC

      • Perspectives de la CHINE (milliards USD, 2019-2032)

      • Marché de l'intégration de la manutention en CHINE par type d'intégration

        • Intégration logicielle

        • Intégration matérielle

        • Intégration du système

      • Marché de l'intégration de la manutention des matériaux en CHINE par type d'industrie d'utilisateur final

        • Fabrication

        • Commerce de détail

        • Nourriture et boissons

        • Pharmaceutique

        • Automobile

      • Marché de l'intégration de la manutention des matériaux en CHINE par type de technologie

        • Véhicules à guidage automatique (AGV)

        • Robotique

        • Solutions compatibles IoT

        • Intelligence artificielle (IA)

      • Marché de l'intégration de la manutention des matériaux en CHINE par type de niveau d'automatisation des processus

        • Manuel

        • Semi-automatisé

        • Entièrement automatisé

      • Marché de l'intégration de la manutention des matériaux en CHINE par type d'application

        • Gestion d'entrepôt

        • Gestion des stocks

        • Exécution des commandes

        • Gestion des transports

      • Perspectives de l'INDE (milliards USD, 2019-2032)

      • Marché indien de l'intégration de la manutention par type d'intégration

        • Intégration logicielle

        • Intégration matérielle

        • Intégration du système

      • Marché de l'intégration de la manutention en INDE par type d'industrie d'utilisateur final

        • Fabrication

        • Commerce de détail

        • Nourriture et boissons

        • Pharmaceutique

        • Automobile

      • Marché de l'intégration de la manutention en INDE par type de technologie

        • Véhicules à guidage automatique (AGV)

        • Robotique

        • Solutions compatibles IoT

        • Intelligence artificielle (IA)

      • Marché indien de l'intégration de la manutention par type de niveau d'automatisation des processus

        • Manuel

        • Semi-automatisé

        • Entièrement automatisé

      • Marché indien de l'intégration de la manutention par type d'application

        • Gestion d'entrepôt

        • Gestion des stocks

        • Exécution des commandes

        • Gestion des transports

      • Perspectives du JAPON (milliards USD, 2019-2032)

      • Marché de l'intégration de la manutention au JAPON par type d'intégration

        • Intégration logicielle

        • Intégration matérielle

        • Intégration du système

      • Marché de l'intégration de la manutention au JAPON par type d'industrie d'utilisateur final

        • Fabrication

        • Commerce de détail

        • Nourriture et boissons

        • Pharmaceutique

        • Automobile

      • Marché de l'intégration de la manutention au JAPON par type de technologie

        • Véhicules à guidage automatique (AGV)

        • Robotique

        • Solutions compatibles IoT

        • Intelligence artificielle (IA)

      • Marché de l'intégration de la manutention des matériaux au JAPON par type de niveau d'automatisation des processus

        • Manuel

        • Semi-automatisé

        • Entièrement automatisé

      • Marché de l'intégration de la manutention au JAPON par type d'application

        • Gestion d'entrepôt

        • Gestion des stocks

        • Exécution des commandes

        • Gestion des transports

      • Perspectives de la CORÉE DU SUD (milliards USD, 2019-2032)

      • Marché de l'intégration de la manutention en CORÉE DU SUD par type d'intégration

        • Intégration logicielle

        • Intégration matérielle

        • Intégration du système

      • Marché de l'intégration de la manutention en CORÉE DU SUD par type d'industrie d'utilisateur final

        • Fabrication

        • Commerce de détail

        • Nourriture et boissons

        • Pharmaceutique

        • Automobile

      • Marché de l'intégration de la manutention en CORÉE DU SUD par type de technologie

        • Véhicules à guidage automatique (AGV)

        • Robotique

        • Solutions compatibles IoT

        • Intelligence artificielle (IA)

      • Marché de l'intégration de la manutention en CORÉE DU SUD par type de niveau d'automatisation des processus

        • Manuel

        • Semi-automatisé

        • Entièrement automatisé

      • Marché de l'intégration de la manutention en CORÉE DU SUD par type d'application

        • Gestion d'entrepôt

        • Gestion des stocks

        • Exécution des commandes

        • Gestion des transports

      • Perspectives de la MALAISIE (en milliards USD, 2019-2032))

      • Marché de l'intégration de la manutention en MALAISIE par type d'intégration

        • Intégration logicielle

        • Intégration matérielle

        • Intégration du système

      • Marché de l'intégration de la manutention en MALAISIE par type d'industrie d'utilisateur final

        • Fabrication

        • Commerce de détail

        • Nourriture et boissons

        • Pharmaceutique

        • Automobile

      • Marché de l'intégration de la manutention en MALAISIE par type de technologie

        • Véhicules à guidage automatique (AGV)

        • Robotique

        • Solutions compatibles IoT

        • Intelligence artificielle (IA)

      • Marché de l'intégration de la manutention en MALAISIE par type de niveau d'automatisation des processus

        • Manuel

        • Semi-automatisé

        • Entièrement automatisé

      • Marché de l'intégration de la manutention en MALAISIE par type d'application

        • Gestion d'entrepôt

        • Gestion des stocks

        • Exécution des commandes

        • Gestion des transports

      • Perspectives de la THAÏLANDE (milliards USD, 2019-2032)

      • THAÏLANDE Marché de l'intégration de la manutention par type d'intégration

        • Intégration logicielle

        • Intégration matérielle

        • Intégration du système

      • THAÏLANDE Marché de l'intégration de la manutention par type d'industrie d'utilisateur final

        • Fabrication

        • Commerce de détail

        • Nourriture et boissons

        • Pharmaceutique

        • Automobile

      • THAÏLANDE Marché de l'intégration de la manutention par type de technologie

        • Véhicules à guidage automatique (AGV)

        • Robotique

        • Solutions compatibles IoT

        • Intelligence artificielle (IA)

      • THAÏLANDE Marché de l'intégration de la manutention par type de niveau d'automatisation des processus

        • Manuel

        • Semi-automatisé

        • Entièrement automatisé

      • THAÏLANDE Marché de l'intégration de la manutention par type d'application

        • Gestion d'entrepôt

        • Gestion des stocks

        • Exécution des commandes

        • Gestion des transports

      • Perspectives de l'INDONÉSIE (milliards USD, 2019-2032)

      • Marché de l'intégration de la manutention en INDONÉSIE par type d'intégration

        • Intégration logicielle

        • Intégration matérielle

        • Intégration du système

      • INDONÉSIE Marché de l’intégration de la manutention par type d’industrie d’utilisateur final

        • Fabrication

        • Commerce de détail

        • Nourriture et boissons

        • Pharmaceutique

        • Automobile

      • Marché de l'intégration de la manutention en INDONÉSIE par type de technologie

        • Véhicules à guidage automatique (AGV)

        • Robotique

        • Solutions compatibles IoT

        • Intelligence artificielle (IA)

      • INDONÉSIE Marché de l'intégration de la manutention par type de niveau d'automatisation des processus

        • Manuel

        • Semi-automatisé

        • Entièrement automatisé

      • Marché de l'intégration de la manutention en INDONÉSIE par type d'application

        • Gestion d'entrepôt

        • Gestion des stocks

        • Exécution des commandes

        • Gestion des transports

      • Perspectives RESTE DE L'APAC (milliards USD, 2019-2032)

      • RESTE DE L'APAC Marché de l'intégration de la manutention par type d'intégration

        • Intégration logicielle

        • Intégration matérielle

        • Intégration du système

      • RESTE DU Marché de l'intégration de la manutention des matériaux en APAC par type d'industrie d'utilisateur final

        • Fabrication

        • Commerce de détail

        • Nourriture et boissons

        • Pharmaceutique

        • Automobile

      • RESTE DE L'APAC Marché de l'intégration de la manutention par type de technologie

        • Véhicules à guidage automatique (AGV)

        • Robotique

        • Solutions compatibles IoT

        • Intelligence artificielle (IA)

      • RESTE DU Marché de l'intégration de la manutention des matériaux en APAC par type de niveau d'automatisation des processus

        • Manuel

        • Semi-automatisé

        • Entièrement automatisé

      • RESTE DE L'APAC Marché de l'intégration de la manutention par type d'application

        • Gestion d'entrepôt

        • Gestion des stocks

        • Exécution des commandes

        • Gestion des transports

    • Perspectives de l'Amérique du Sud (milliards USD, 2019-2032)

      • Marché de l'intégration de la manutention en Amérique du Sud par type d'intégration

        • Intégration logicielle

        • Intégration matérielle

        • Intégration du système

      • Marché de l'intégration de la manutention en Amérique du Sud par type d'industrie d'utilisateur final

        • Fabrication

        • Commerce de détail

        • Nourriture et boissons

        • Pharmaceutique

        • Automobile

      • Marché de l'intégration de la manutention en Amérique du Sud par type de technologie

        • Véhicules à guidage automatique (AGV)

        • Robotique

        • Solutions compatibles IoT

        • Intelligence artificielle (IA)

      • Marché de l'intégration de la manutention des matériaux en Amérique du Sud par type de niveau d'automatisation des processus

        • Manuel

        • Semi-automatisé

        • Entièrement automatisé

      • Marché de l'intégration de la manutention en Amérique du Sud par type d'application

        • Gestion d'entrepôt

        • Gestion des stocks

        • Exécution des commandes

        • Gestion des transports

      • Marché de l’intégration de la manutention en Amérique du Sud par type régional

        • Brésil

        • Mexique

        • Argentine

        • Reste de l'Amérique du Sud

      • Perspectives du BRÉSIL (milliards USD, 2019-2032)

      • BRÉSIL Marché de l'intégration de la manutention par type d'intégration

        • Intégration logicielle

        • Intégration matérielle

        • Intégration du système

      • BRÉSIL Marché de l'intégration de la manutention par type d'industrie d'utilisateur final

        • Fabrication

        • Commerce de détail

        • Nourriture et boissons

        • Pharmaceutique

        • Automobile

      • BRÉSIL Marché de l'intégration de la manutention par type de technologie

        • Véhicules à guidage automatique (AGV)

        • Robotique

        • Solutions compatibles IoT

        • Intelligence artificielle (IA)

      • BRÉSIL Marché de l'intégration de la manutention par type de niveau d'automatisation des processus

        • Manuel

        • Semi-automatisé

        • Entièrement automatisé

      • BRÉSIL Marché de l'intégration de la manutention par type d'application

        • Gestion d'entrepôt

        • Gestion des stocks

        • Exécution des commandes

        • Gestion des transports

      • Perspectives du MEXIQUE (milliards USD, 2019-2032)

      • MEXIQUE Marché de l'intégration de la manutention par type d'intégration

        • Intégration logicielle

        • Intégration matérielle

        • Intégration du système

      • MEXIQUE Marché de l'intégration de la manutention par type d'industrie d'utilisateur final

        • Fabrication

        • Commerce de détail

        • Nourriture et boissons

        • Pharmaceutique

        • Automobile

      • MEXIQUE Marché de l'intégration de la manutention par type de technologie

        • Véhicules à guidage automatique (AGV)

        • Robotique

        • Solutions compatibles IoT

        • Intelligence artificielle (IA)

      • MEXIQUE Marché de l'intégration de la manutention par type de niveau d'automatisation des processus

        • Manuel

        • Semi-automatisé

        • Entièrement automatisé

      • MEXIQUE Marché de l'intégration de la manutention par type d'application

        • Gestion d'entrepôt

        • Gestion des stocks

        • Exécution des commandes

        • Gestion des transports

      • Perspectives de l'ARGENTINE (milliards USD, 2019-2032)

      • Marché de l'intégration de la manutention en ARGENTINE par type d'intégration

        • Intégration logicielle

        • Intégration matérielle

        • Intégration du système

      • Marché de l'intégration de la manutention en ARGENTINE par type d'industrie d'utilisateur final

        • Fabrication

        • Commerce de détail

        • Nourriture et boissons

        • Pharmaceutique

        • Automobile

      • Marché de l'intégration de la manutention en ARGENTINE par type de technologie

        • Véhicules à guidage automatique (AGV)

        • Robotique

        • Solutions compatibles IoT

        • Intelligence artificielle (IA)

      • Marché de l'intégration de la manutention des matériaux en Argentine par type de niveau d'automatisation des processus

        • Manuel

        • Semi-automatisé

        • Entièrement automatisé

      • Marché de l'intégration de la manutention en ARGENTINE par type d'application

        • Gestion d'entrepôt

        • Gestion des stocks

        • Exécution des commandes

        • Gestion des transports

      • Perspectives du reste de l'Amérique du Sud (en milliards de dollars américains, 2019-2032)

      • RESTE DE L'AMÉRIQUE DU SUD Marché de l'intégration de la manutention par type d'intégration

        • Intégration logicielle

        • Intégration matérielle

        • Intégration du système

      • RESTE DE L'AMÉRIQUE DU SUD Marché de l'intégration de la manutention par type d'industrie d'utilisateur final

        • Fabrication

        • Commerce de détail

        • Nourriture et boissons

        • Pharmaceutique

        • Automobile

      • RESTE DE L'AMÉRIQUE DU SUD Marché de l'intégration de la manutention par type de technologie

        • Véhicules à guidage automatique (AGV)

        • Robotique

        • Solutions compatibles IoT

        • Intelligence artificielle (IA)

      • RESTE DE L'AMÉRIQUE DU SUD Marché de l'intégration de la manutention par type de niveau d'automatisation des processus

        • Manuel

        • Semi-automatisé

        • Entièrement automatisé

      • RESTE DE L'AMÉRIQUE DU SUD Intégration de la manutentionMarché par type d'application

        • Gestion d'entrepôt

        • Gestion des stocks

        • Exécution des commandes

        • Gestion des transports

    • Perspectives MEA (milliards USD, 2019-2032)

      • Marché de l'intégration de la manutention des matériaux MEA par type d'intégration

        • Intégration logicielle

        • Intégration matérielle

        • Intégration du système

      • Marché de l'intégration de la manutention des matériaux MEA par type d'industrie d'utilisateur final

        • Fabrication

        • Commerce de détail

        • Nourriture et boissons

        • Pharmaceutique

        • Automobile

      • Marché de l'intégration de la manutention des matériaux MEA par type de technologie

        • Véhicules à guidage automatique (AGV)

        • Robotique

        • Solutions compatibles IoT

        • Intelligence artificielle (IA)

      • Marché de l'intégration de la manutention des matériaux MEA par type de niveau d'automatisation des processus

        • Manuel

        • Semi-automatisé

        • Entièrement automatisé

      • Marché de l'intégration de la manutention des matériaux MEA par type d'application

        • Gestion d'entrepôt

        • Gestion des stocks

        • Exécution des commandes

        • Gestion des transports

      • Marché de l’intégration de la manutention des matériaux MEA par type régional

        • Pays du CCG

        • Afrique du Sud

        • Reste de la MEA

      • Perspectives des pays du CCG (en milliards de dollars, 2019-2032)

      • PAYS DU CCG Marché de l'intégration de la manutention par type d'intégration

        • Intégration logicielle

        • Intégration matérielle

        • Intégration du système

      • PAYS DU CCG Marché de l’intégration de la manutention par type d’industrie d’utilisateur final

        • Fabrication

        • Commerce de détail

        • Nourriture et boissons

        • Pharmaceutique

        • Automobile

      • PAYS DU CCG Marché de l’intégration de la manutention par type de technologie

        • Véhicules à guidage automatique (AGV)

        • Robotique

        • Solutions compatibles IoT

        • Intelligence artificielle (IA)

      • PAYS DU CCG Marché de l'intégration de la manutention par type de niveau d'automatisation des processus

        • Manuel

        • Semi-automatisé

        • Entièrement automatisé

      • PAYS DU CCG Marché de l'intégration de la manutention par type d'application

        • Gestion d'entrepôt

        • Gestion des stocks

        • Exécution des commandes

        • Gestion des transports

      • Perspectives de l'AFRIQUE DU SUD (milliards USD, 2019-2032)

      • Marché de l'intégration de la manutention en AFRIQUE DU SUD par type d'intégration

        • Intégration logicielle

        • Intégration matérielle

        • Intégration du système

      • Marché de l'intégration de la manutention en AFRIQUE DU SUD par type d'industrie d'utilisateur final

        • Fabrication

        • Commerce de détail

        • Nourriture et boissons

        • Pharmaceutique

        • Automobile

      • Marché de l'intégration de la manutention en AFRIQUE DU SUD par type de technologie

        • Véhicules à guidage automatique (AGV)

        • Robotique

        • Solutions compatibles IoT

        • Intelligence artificielle (IA)

      • Marché de l'intégration de la manutention en AFRIQUE DU SUD par type de niveau d'automatisation des processus

        • Manuel

        • Semi-automatisé

        • Entièrement automatisé

      • Marché de l'intégration de la manutention en AFRIQUE DU SUD par type d'application

        • Gestion d'entrepôt

        • Gestion des stocks

        • Exécution des commandes

        • Gestion des transports

      • Perspectives RESTE DES MEA (milliards USD, 2019-2032)

      • RESTE DU MEA Marché de l'intégration de la manutention par type d'intégration

        • Intégration logicielle

        • Intégration matérielle

        • Intégration du système

      • RESTE DU MEA Marché de l’intégration de la manutention par type d’industrie d’utilisateur final

        • Fabrication

        • Commerce de détail

        • Nourriture et boissons

        • Pharmaceutique

        • Automobile

      • RESTE DU MEA Marché de l’intégration de la manutention par type de technologie

        • Véhicules à guidage automatique (AGV)

        • Robotique

        • Solutions compatibles IoT

        • Intelligence artificielle (IA)

      • RESTE DU MEA Marché de l’intégration de la manutention par type de niveau d’automatisation des processus

        • Manuel

        • Semi-automatisé

        • Entièrement automatisé

      • RESTE DU MEA Marché de l’intégration de la manutention par type d’application

        • Gestion d'entrepôt

        • Gestion des stocks

        • Exécution des commandes

        • Gestion des transports

    Report Infographic
    Free Sample Request

    Kindly complete the form below to receive a free sample of this Report

    Customer Strories

    “I am very pleased with how market segments have been defined in a relevant way for my purposes (such as "Portable Freezers & refrigerators" and "last-mile"). In general the report is well structured. Thanks very much for your efforts.”

    Victoria Milne Founder
    Case Study

    Chemicals and Materials