• Cat-intel
  • MedIntelliX
  • Resources
  • About Us
  • Request Free Sample ×

    Kindly complete the form below to receive a free sample of this Report

    Leading companies partner with us for data-driven Insights

    clients tt-cursor

    Wireless IoT Sensors Market

    ID: MRFR/SEM/6797-CR
    170 Pages
    Ankit Gupta
    January 2020

    Wireless IoT Sensors Market Research Report Information By Component (Hardware, Service and Software), By Type (Image Sensor, Motion Sensor, Proximity Sensor, Pressure Sensor, Magnetometer, Humidity Sensor, Temperature Sensor, Touch Sensor, Accelerometer, Gyroscope, Flow Sensor and Others), By Technology (Wi-Fi, Bluetooth, ZigBee, NFC, Z-Wave, RFID, and Others), By Vertical (Industrial IoT, Consumer lot, and Commercial loT) And By Region (North America, Europe, Asia-Pacific, And Rest Of The World) – Industry Forecast Till 2032

    Share:
    Download PDF ×

    We do not share your information with anyone. However, we may send you emails based on your report interest from time to time. You may contact us at any time to opt-out.

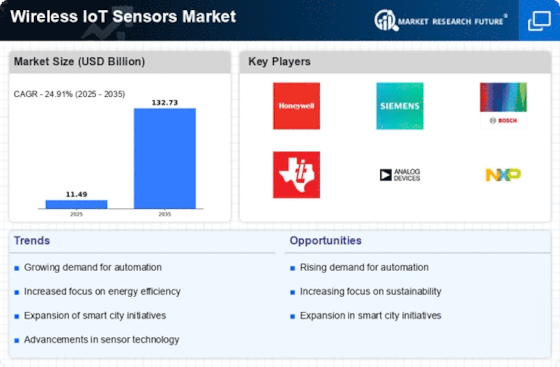
    Wireless IoT Sensors Market Research Report - Global Forecast till 2032 Infographic
    Purchase Options
    $ 4,950.0
    $ 5,950.0
    $ 7,250.0
    Table of Contents

    Wireless IoT Sensors Market Summary

    As per Market Research Future Analysis, the Global Wireless IoT Sensors Market was valued at USD 9.2 Billion in 2023 and is projected to reach USD 68.1 Billion by 2032, growing at a CAGR of 24.91% from 2024 to 2032. The market is driven by increased demand for smartphones, home appliances, consumer electronics, vehicles, and defense products. The hardware segment leads the market, while temperature sensors and Wi-Fi technology dominate their respective categories. North America holds the largest market share, followed by Europe and the Asia-Pacific region, which is expected to grow at the fastest rate due to government support for IoT technology.

    Key Market Trends & Highlights

    Key trends driving the Wireless IoT Sensors market include technological advancements and government support.

    • Market Size in 2023: USD 9.2 Billion
    • Projected Market Size by 2032: USD 68.1 Billion
    • CAGR from 2024 to 2032: 24.91%
    • North America dominates the market due to developed infrastructure.

    Market Size & Forecast

    2023 Market Size USD 9.2 Billion
    2024 Market Size USD 11.49 Billion
    2032 Market Size USD 68.1 Billion

    Major Players

    Key players include Honeywell International Inc. (US), NXP Semiconductors (Netherlands), Omron Corporation (Japan), TDK Corporation (Japan), Broadcom Inc. (US), and Texas Instruments Incorporated (US).

    Wireless IoT Sensors Market Trends

      • Increasing use of sensors in loT applications is driving the market growth

    The utilization of sensors in Internet of Things (IoT) applications is on the rise, primarily because of the decrease in cost and size, as well as advancements in technology. The adoption of microelectromechanical systems (MEMS) technology has contributed to the reduction in sensor size, making it feasible for sensors to be employed in various sectors including automotive, healthcare, and consumer products. As a result, the sensors market has experienced significant growth. Over the past five years, there has been a rapid deployment of smaller sensors in devices such as smartphones, drones, wearables, and robots. This factor drives the Market CAGR.

    Additionally, governments around the world provide support and funding for Internet of Things (IoT) advancements since the government sector is expected to be a major consumer of IoT solutions. Governments seek advancements and innovations in key sectors like intelligent traffic management systems, energy conservation using smart meters, and enhanced security systems with the help of smart cameras. Additionally, governments are financially backing new research projects focused on building smart cities through IoT initiatives. This support is anticipated to be instrumental in the future growth of IoT. Thus, driving the Wireless IoT Sensors market revenue.

    The ongoing integration of wireless IoT sensors across various sectors suggests a transformative shift towards enhanced operational efficiency and data-driven decision-making.

    U.S. Department of Commerce

    Wireless IoT Sensors Market Drivers

    Market Growth Projections

    The Global Wireless IoT Sensors Market Industry is poised for substantial growth, with projections indicating a market size of 11.5 USD Billion in 2024 and an anticipated increase to 132.7 USD Billion by 2035. This growth trajectory reflects a compound annual growth rate (CAGR) of 24.91% from 2025 to 2035. The increasing integration of IoT sensors across various sectors, including smart cities, industrial applications, and healthcare, underscores the market's potential. As organizations continue to recognize the value of real-time data and connectivity, the demand for wireless IoT sensors is expected to surge, shaping the future landscape of the industry.

    Rising Demand for Smart Cities

    The increasing global emphasis on smart city initiatives drives the Global Wireless IoT Sensors Market Industry. As urban populations grow, cities are adopting IoT technologies to enhance efficiency and sustainability. For instance, cities are deploying wireless sensors for traffic management, waste management, and energy efficiency. This trend is projected to contribute to the market's growth, with the industry expected to reach 11.5 USD Billion in 2024. The integration of IoT sensors in urban infrastructure not only improves service delivery but also fosters a more connected urban environment, indicating a robust demand for wireless IoT solutions.

    Advancements in Sensor Technology

    Technological advancements in sensor capabilities significantly influence the Global Wireless IoT Sensors Market Industry. Innovations such as miniaturization, enhanced battery life, and improved data processing capabilities enable the development of more efficient and versatile sensors. For example, the emergence of low-power wide-area networks (LPWAN) allows for long-range communication with minimal energy consumption. These advancements are likely to attract investments and drive adoption across various sectors, including healthcare, agriculture, and manufacturing. As a result, the market is anticipated to grow substantially, potentially reaching 132.7 USD Billion by 2035.

    Growing Adoption of Wearable Technology

    The rising adoption of wearable technology is influencing the Global Wireless IoT Sensors Market Industry. Wearables equipped with wireless sensors are increasingly utilized in healthcare for monitoring vital signs, physical activity, and overall health. This trend is particularly evident in the growing demand for remote patient monitoring solutions, which enhance healthcare delivery and patient outcomes. As the healthcare sector embraces IoT solutions, the market for wireless sensors is expected to expand significantly. The convergence of healthcare and technology suggests a promising future for wireless IoT sensors, with potential applications extending beyond traditional healthcare settings.

    Expansion of Industrial IoT Applications

    The expansion of Industrial IoT (IIoT) applications is a crucial driver of the Global Wireless IoT Sensors Market Industry. Industries such as manufacturing, logistics, and energy are increasingly adopting wireless sensors to optimize operations, enhance productivity, and reduce costs. For example, predictive maintenance enabled by IoT sensors can significantly minimize downtime and improve operational efficiency. This trend is likely to contribute to a compound annual growth rate (CAGR) of 24.91% from 2025 to 2035, reflecting the growing reliance on IoT technologies in industrial settings. The integration of wireless sensors in industrial processes underscores the transformative potential of IoT.

    Increased Focus on Environmental Monitoring

    The growing awareness of environmental issues propels the Global Wireless IoT Sensors Market Industry forward. Governments and organizations are increasingly utilizing wireless IoT sensors for environmental monitoring, including air quality, water quality, and climate change tracking. For instance, sensors deployed in urban areas can provide real-time data on pollution levels, enabling timely interventions. This heightened focus on sustainability and environmental protection is expected to drive market growth, as stakeholders seek to leverage IoT technology to address pressing environmental challenges. The industry's expansion is indicative of a broader commitment to sustainable development.

    Market Segment Insights

    Wireless IoT Sensors Component Insights

    Based on components, the Wireless IoT Sensors Market segmentation includes Hardware, Service and Software. The hardware segment dominated the market because hardware is the essential Component of wireless IoT sensors, as it provides the physical capabilities for sensing, processing, and transmitting data.

    Figure 1: WIRELESS IoT SENSORS MARKET SHARE BY COMPONENT, (USD Billion)

    WIRELESS IoT SENSORS MARKET SHARE BY COMPONENT,

    Source: Secondary Research, Primary Research, MRFR Database and Analyst Review

    Wireless IoT Sensors Type Insights

    The Wireless IoT Sensors Market segmentation, based on type, includes Image Sensors, Motion Sensor, Proximity Sensor, Pressure Sensor, Magnetometers, Humidity Sensor, Temperature Sensor, Touch Sensor, Accelerometers, Gyroscopes, Flow Sensor and others. The temperature sensor segment dominated the market; the temperature of air, water, and other gases can significantly impact the performance of machines and equipment. The temperature of patients can also be a critical indicator of their health. These providers offer a variety of temperature sensor solutions that can be the specific requirements of different applications.

    Wireless IoT Sensors Technology Insights

    The Wireless IoT Sensors Market segmentation, based on Technology, includes Wi-Fi, Bluetooth, ZigBee, NFC, Z-Wave, RFID others. The Wi-Fi segment dominated the market because Wi-Fi is a mature and widely adopted technology offering high data rates and long range. This makes it ideal for applications that require transmitting large amounts of data, such as video streaming and remote monitoring.

    Wireless IoT Sensors Insights

    Based on Vertical, the Wireless IoT Sensors Market segmentation includes Industrial IoT, Consumer lot, and Commercial loT. The industrial IoT segment dominated the market because industrial IoT applications are typically characterized by high data rates and long-range requirements, which are well-suited to wireless technologies such as Wi-Fi and ZigBee.

    Regional Insights

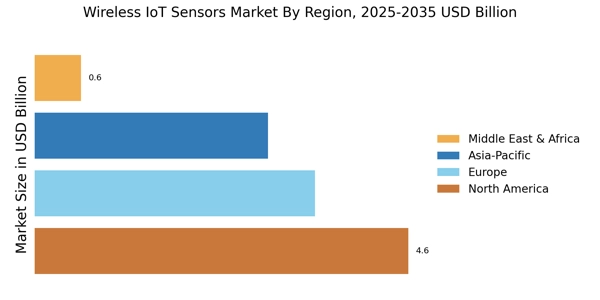
    Segmented by region, the study provides market insights for North America, Europe, Asia Pacific and Rest of the World. The North American Wireless IoT Sensors market will dominate this market due to well-developed infrastructure conducive to adopting IoT technology. This includes a reliable power grid, a robust telecommunications network, and many data centers.

    In addition, major countries examined in the report market include the United States, Canada, Germany, France, United Kingdom, Italy, Spain, China, Japan, India, Australia, South Korea and Brazil.

    Figure 2: WIRELESS IoT SENSORS MARKET SHARE BY REGION, (USD Billion)

    WIRELESS IoT SENSORS MARKET SHARE BY REGION,

    Source: Secondary Research, Primary Research, MRFR Database and Analyst Review

    Europe's Wireless IoT Sensors market accounts for the second-largest market share due to the high level of innovation and the presence of a large number of tech companies.. Further, the German Wireless IoT Sensors market held the largest market share, and the UK Wireless IoT Sensors market was the largest growing market in the European Region.

    The Asia-Pacific Wireless IoT Sensors Market is witnessing to grow at the fastest CAGR from 2024 to 2032. This is because governments in the Region support IoT technology and invest in its development. This is helping to create a favorable environment for the adoption of wireless IoT sensors. Moreover, China’s Wireless IoT Sensors market held the largest market share, and the Indian Wireless IoT Sensors market was the largest-growing market in the Asia-Pacific region.

    Key Players and Competitive Insights

    Leading manufacturers are investing in research and development to expand their products that will help the wireless IoT sensors market grow further. Entrepreneurs are also undertaking various activities to expand their global footprint, and key business development activities include new product development, contract deals, joint venture mergers and acquisitions, increased investment and collaboration with other organizations. To grow and survive in a more competitive and changing business environment, the wireless IoT sensor industry must provide quality products.

    Manufacturing locally to minimize operational costs is one of the major business tactics manufacturers use in the global Wireless IoT Sensors industry to benefit clients and increase the market sector. The Wireless IoT Sensors industry has offered some of the most significant advantages in recent years.

    Dominant players in the Wireless IoT Sensors market, including Honeywell International Inc. (US), NXP Semiconductors (Netherlands), Omron Corporation (Japan), TDK Corporation (Japan), Broadcom Inc. (US), Analog Devices, Inc. (US), Murata Manufacturing Co., Ltd (Japan), FUJITSU (Japan), SmartThings Inc. (US), Texas Instruments Incorporated (US), STMicroelectronics (US), TE Connectivity (Switzerland), Infineon Technologies AG (Germany), Robert Bosch GmbH (Germany), and Sony Corporation (Japan)., and Other companies are trying to meet their business needs by investing in R&D activities.

    TE Connectivity is an American technology company headquartered in Switzerland that designs and manufactures connectors and sensors.TE Connectivity offers LVDT position sensors. These sensors provide standard and custom solutions based on hydraulic application requirements for ICT field equipment and machinery.

    Texas Instruments Corporation is an American technology company headquartered in Dallas, Texas, that designs and manufactures electronic devices and a variety of integrated circuits and sells them to electronics manufacturers and manufacturers worldwide. Texas Instruments (TI) presents the industry's first zero-slip Hall-effect current sensor. The TMCS1100 and TMCS1101 provide the lowest and highest accuracy in time and temperature while providing 3kVrms isolation, which is especially important for AC or DC high voltage systems such as drives, solar inverters, energy storage and power supplies.

    Key Companies in the Wireless IoT Sensors Market market include

    Industry Developments

    July 2020: Texas Instruments (TI) presents the industry's first zero-slip Hall-effect current sensor. The TMCS1100 and TMCS1101 provide the lowest and highest accuracy in time and temperature while providing 3kVrms isolation, which is particularly important for AC or DC high voltage systems such as motor drives, solar inverters, energy storage and power supplies.

    June 2020: TE Connectivity offers LVDT position sensors. These sensors provide standard and custom solutions based on hydraulic application requirements for ICT field equipment and machinery.

    Future Outlook

    Wireless IoT Sensors Market Future Outlook

    The Wireless IoT Sensors Market is projected to grow at a 24.91% CAGR from 2024 to 2035, driven by advancements in smart technology, increased demand for automation, and enhanced connectivity solutions.

    New opportunities lie in:

    • Develop specialized sensors for smart agriculture to optimize resource use and yield.
    • Invest in AI-driven analytics for real-time data processing and decision-making.
    • Create integrated solutions for industrial IoT to enhance operational efficiency and reduce downtime.

    By 2035, the Wireless IoT Sensors Market is expected to achieve substantial growth, solidifying its role in global technological advancements.

    Market Segmentation

    Wireless IoT Sensors Type Outlook

    • Image Sensor
    • Motion Sensor
    • Proximity Sensor
    • Pressure Sensor
    • Magnetometer
    • Humidity Sensor
    • Temperature Sensor
    • Touch Sensor
    • Accelerometer
    • Gyroscope
    • Flow Sensor
    • Others

    Wireless IoT Sensors Regional Outlook

    North America
    • US
    • Canada

    Wireless IoT Sensors Vertical Outlook

    • Industrial IoT
    • Consumer lot
    • Commercial loT

    Wireless IoT Sensors Component Outlook

    • Hardware
    • Service
    • Software

    Wireless IoT Sensors Technology Outlook

    • Wi-Fi
    • Bluetooth
    • ZigBee
    • NFC
    • Z-Wave
    • RFID
    • Others

    Report Scope

    Report Attribute/Metric Details
    Market Size 2023 USD 9.2 billion
    Market Size 2024 USD 11.49 billion
    Market Size 2032 USD 68.1 billion
    Compound Annual Growth Rate (CAGR) 24.91% (2024-2032)
    Base Year 2023
    Market Forecast Period 2024-2032
    Historical Data 2018- 2022
    Market Forecast Units Value (USD Billion)
    Report Coverage Revenue Forecast, Market Competitive Landscape, Growth Factors, and Trends
    Segments Covered Component, Type, Technology, Vertical and Region
    Geographies Covered North America, Europe, AsiaPacific, and the Rest of the World
    Countries Covered USA, Canada, Germany, France, UK, Italy, Spain, China, Japan, India, Australia, South Korea and Brazil
    Key Companies Profiled Honeywell International Inc. (US), NXP Semiconductors (Netherlands), Omron Corporation (Japan), TDK Corporation (Japan), Broadcom Inc. (US), Analog Devices, Inc. (US), Murata Manufacturing Co., Ltd (Japan), FUJITSU (Japan), SmartThings Inc. (US)
    Key Market Opportunities Demand for smartphones, home appliances, electronics, automobiles and defense equipment is increasing.
    Key Market Dynamics High demand for loT devices and communication networks in the energy and manufacturing industries.

    Market Highlights

    Author
    Ankit Gupta
    Senior Research Analyst

    Ankit Gupta is an analyst in market research industry in ICT and SEMI industry. With post-graduation in "Telecom and Marketing Management" and graduation in "Electronics and Telecommunication" vertical he is well versed with recent development in ICT industry as a whole. Having worked on more than 150+ reports including consultation for fortune 500 companies such as Microsoft and Rio Tinto in identifying solutions with respect to business problems his opinions are inclined towards mixture of technical and managerial aspects.

    Leave a Comment

    FAQs

    How much is the Wireless IoT Sensors market?

    The Wireless IoT Sensors Market size was valued at USD 9.2 Billion in 2023.

    What is the growth rate of the Wireless IoT Sensors market?

    The global market is witnessed to grow at a CAGR of 24.91% during the forecast period, 2024-2032.

    Which Region witnessed the largest market share in the Wireless IoT Sensors market?

    North America witnessed the largest share of the global market

    Who are the dominant players in the Wireless IoT Sensors market?

    The dominant players in the market are Honeywell International Inc. (US), NXP Semiconductors (Netherlands), Omron Corporation (Japan), TDK Corporation (Japan), Broadcom Inc. (US), Analog Devices, Inc. (US), Murata Manufacturing Co., Ltd (Japan), FUJITSU (Japan), SmartThings Inc. (US).

    Which type led the Wireless IoT Sensors market?

    The temperature sensor category dominated the market in 2022.

    Which Vertical witnessed the largest market share in the Wireless IoT Sensors market?

    The Industrial IoT had the largest share of the global market.

    1. '1 EXECUTIVE SUMMARY
      1. MARKET ATTRACTIVEN7ESS ANALYSIS 18
        1. GLOBAL WIRELESS IOT SENSORS MARKET, BY TYPE 19
        2. GLOBAL WIRELESS IOT SENSORS MARKET, BY COMPONENT 20
        3. GLOBAL WIRELESS IOT SENSORS MARKET, BY TECHNOLOGY
        4. GLOBAL WIRELESS IOT SENSORS MARKET,
    2. BY VERTICAL 22
      1. GLOBAL WIRELESS IOT
    3. SENSORS MARKET, BY REGION 23
    4. MARKET INTRODUCTION
      1. DEFINITION 24
      2. SCOPE OF THE STUDY 24
      3. MARKET STRUCTURE 25
    5. KEY BUYING CRITERIA 26
    6. RESEARCH METHODOLOGY
      1. RESEARCH PROCESS 27
      2. PRIMARY RESEARCH 28
    7. SECONDARY RESEARCH 29
      1. MARKET SIZE
    8. ESTIMATION 29
      1. TOP-DOWN AND BOTTOM-UP
    9. APPROACH 30
      1. FORECAST MODEL 30
      2. LIST OF ASSUMPTIONS 31
    10. MARKET INSIGHTS
    11. MARKET
    12. DYNAMICS
      1. INTRODUCTION 35
      2. DRIVERS 36
    13. INCREASED ADOPTION OF CONNECTED WEARABLE DEVICES 36
      1. RISING INTERNET PENETRATION 36
    14. DRIVERS IMPACT ANALYSIS 37
      1. RESTRAINT
        1. DATA SECURITY CONCERNS 37
        2. RISK OF OPERATIONAL FAILURES 38
        3. RESTRAINT IMPACT ANALYSIS 38
      2. OPPORTUNITY 39
    15. FAVORABLE GOVERNMENT INITIATIVES 39
    16. USE IN INDUSTRIAL MONITORING 39
    17. MARKET FACTOR ANALYSIS
      1. SUPPLY CHAIN ANALYSIS
        1. RESEARCH & DEVELOPMENT CENTRE
        2. MATERIAL SUPPLIERS AND FOUNDRIES
        3. COMPONENT MANUFACTURERS 41
        4. SUB-SYSTEM INTEGRATORS 41
        5. END USERS 41
    18. PORTER’S FIVE FORCES MODEL 42
    19. THREAT OF NEW ENTRANTS 42
      1. BARGAINING
    20. POWER OF SUPPLIERS 42
      1. BARGAINING
    21. POWER OF BUYERS 43
      1. THREAT OF SUBSTITUTES
        1. RIVALRY 43
    22. GLOBAL WIRELESS IOT SENSORS MARKET, BY COMPONENT
      1. OVERVIEW 44
      2. HARDWARE 44
      3. SERVICE
      4. SOFTWARE 44
    23. GLOBAL WIRELESS IOT SENSORS MARKET, BY TYPE
      1. OVERVIEW 47
      2. IMAGE SENSOR
      3. MOTION SENSOR 47
      4. PROXIMITY SENSOR 47
      5. PRESSURE SENSOR 48
      6. MAGNETOMETER
      7. HUMIDITY SENSOR 48
      8. TEMPERATURE SENSOR 48
      9. TOUCH SENSOR 48
      10. ACCELEROMETER
      11. GYROSCOPE 49
      12. FLOW SENSOR 49
    24. OTHERS 49
    25. GLOBAL WIRELESS IOT SENSORS
    26. MARKET, BY TECHNOLOGY
      1. OVERVIEW 51
      2. WI-FI 51
    27. BLUETOOTH 51
      1. ZIGBEE 51
      2. NFC 51
    28. Z-WAVE 52
      1. RFID 52
      2. OTHERS 52
    29. GLOBAL WIRELESS IOT SENSORS MARKET, BY VERTICAL
      1. OVERVIEW 54
      2. INDUSTRIAL
    30. IOT 54
      1. CONSUMER IOT 54
      2. COMMERCIAL IOT 54
    31. GLOBAL WIRELESS IOT SENSORS MARKET, BY REGION
      1. INTRODUCTION 58
      2. NORTH
    32. AMERICA 59
      1. US 62
        1. CANADA 64
    33. MEXICO 66
      1. EUROPE 69
        1. UK 72
    34. GERMANY 74
      1. FRANCE 76
        1. REST OF EUROPE 78
      2. ASIA-PACIFIC 81
    35. CHINA 84
      1. JAPAN 86
        1. INDIA 88
    36. REST OF ASIA-PACIFIC 90
      1. SOUTH AMERICA
        1. BRAZIL 96
        2. ARGENTINA 98
    37. REST OF SOUTH AMERICA 100
      1. MIDDLE
    38. EAST & AFRICA 103
      1. SAUDI ARABIA
        1. UAE 108
        2. REST OF MIDDLE EAST & AFRICA 110
    39. COMPETITIVE LANDSCAPE
    40. COMPETITIVE OVERVIEW 112
      1. GLOBAL WIRELESS
    41. IOT SENSORS MARKET, SHARE ANALYSIS, 2020 (%) 112
      1. COMPETITIVE BENCHMARKING 113
    42. KEY STRATEGY ANALYSIS 114
      1. LEADING
    43. PLAYERS (IN TERMS OF NUMBER OF DEVELOPMENTS) IN GLOBAL WIRELESS IOT SENSORS MARKET
    44. COMPANY PROFILES
      1. TEXAS INSTRUMENTS INCORPORATED 115
        1. COMPANY OVERVIEW 115
        2. FINANCIAL OVERVIEW 116
    45. PRODUCTS OFFERED 116
      1. KEY DEVELOPMENTS
        1. SWOT ANALYSIS 118
        2. KEY STRATEGIES 118
      2. STMICROELECTRONICS 119
    46. COMPANY OVERVIEW 119
      1. FINANCIAL
    47. OVERVIEW 120
      1. PRODUCTS OFFERED 120
        1. KEY DEVELOPMENTS 121
        2. SWOT ANALYSIS 122
    48. KEY STRATEGIES 123
      1. TE CONNECTIVITY
        1. COMPANY OVERVIEW 124
        2. FINANCIAL OVERVIEW 125
        3. PRODUCTS OFFERED 125
        4. KEY DEVELOPMENTS 126
    49. SWOT ANALYSIS 127
      1. KEY STRATEGIES
      2. INFINEON TECHNOLOGIES AG 128
        1. COMPANY OVERVIEW 128
        2. FINANCIAL OVERVIEW 129
    50. PRODUCTS OFFERED 129
      1. KEY DEVELOPMENTS
        1. SWOT ANALYSIS 130
        2. KEY STRATEGIES 131
      2. ROBERT BOSCH GMBH 132
    51. COMPANY OVERVIEW 132
      1. FINANCIAL
    52. OVERVIEW 133
      1. PRODUCTS OFFERED 134
        1. KEY DEVELOPMENTS 134
        2. SWOT ANALYSIS 135
    53. KEY STRATEGIES 135
      1. SONY CORPORATION
        1. COMPANY OVERVIEW 136
        2. FINANCIAL OVERVIEW 137
        3. PRODUCTS OFFERED 137
        4. KEY DEVELOPMENTS 137
    54. SWOT ANALYSIS 138
      1. KEY STRATEGIES
      2. HONEYWELL INTERNATIONAL INC.
        1. COMPANY OVERVIEW 140
        2. FINANCIAL OVERVIEW 141
        3. PRODUCTS OFFERED 141
        4. KEY DEVELOPMENTS 142
    55. SWOT ANALYSIS 142
      1. KEY STRATEGIES
      2. NXP SEMICONDUCTORS 144
        1. COMPANY OVERVIEW 144
        2. FINANCIAL OVERVIEW 145
    56. PRODUCTS OFFERED 145
      1. KEY DEVELOPMENTS
        1. SWOT ANALYSIS 146
        2. KEY STRATEGIES 146
      2. OMRON CORPORATION 147
    57. COMPANY OVERVIEW 147
      1. FINANCIAL
    58. OVERVIEW 148
      1. PRODUCTS OFFERED 148
        1. KEY DEVELOPMENTS 149
        2. SWOT ANALYSIS 149
    59. KEY STRATEGIES 150
      1. TDK CORPORATION
        1. COMPANY OVERVIEW 151
        2. FINANCIAL OVERVIEW 152
        3. PRODUCTS OFFERED 152
        4. KEY DEVELOPMENTS 153
    60. SWOT ANALYSIS 154
      1. KEY STRATEGIES
      2. BROADCOM INC. 155
        1. COMPANY OVERVIEW 155
        2. FINANCIAL OVERVIEW 156
    61. PRODUCTS OFFERED 156
      1. KEY DEVELOPMENTS
        1. SWOT ANALYSIS 157
        2. KEY STRATEGIES 158
      2. ANALOG DEVICES, INC. 159
    62. COMPANY OVERVIEW 159
      1. FINANCIAL
    63. OVERVIEW 160
      1. PRODUCTS OFFERED
        1. KEY DEVELOPMENTS 160
        2. SWOT ANALYSIS 161
        3. KEY STRATEGIES 161
    64. MURATA MANUFACTURING CO., LTD 162
    65. COMPANY OVERVIEW 162
      1. FINANCIAL
    66. OVERVIEW 162
      1. PRODUCTS OFFERED
        1. KEY DEVELOPMENTS 163
        2. SWOT ANALYSIS 164
        3. KEY STRATEGIES 164
    67. FUJITSU 165
      1. COMPANY OVERVIEW 165
        1. FINANCIAL OVERVIEW 166
        2. PRODUCTS OFFERED 166
        3. KEY DEVELOPMENTS 166
    68. SWOT ANALYSIS 167
      1. KEY STRATEGIES
      2. SMARTTHINGS INC. 168
        1. COMPANY OVERVIEW 168
        2. FINANCIAL OVERVIEW 169
    69. PRODUCTS OFFERED 169
      1. KEY DEVELOPMENTS
        1. SWOT ANALYSIS 170
        2. KEY STRATEGIES 170
    70. LIST OF TABLES
    71. OF ASSUMPTIONS 31
    72. IOT SENSORS MARKET, BY COMPONENT 2024-2032 (USD MILLION) 45
    73. 2032 (USD MILLION) 45
    74. GLOBAL WIRELESS IOT SENSORS MARKET, BY SUB-SEGMENT, 2024-2032 (USD MILLION) 46
    75. BY SUB-SEGMENT, 2024-2032 (USD MILLION) 46
    76. GLOBAL WIRELESS IOT SENSORS MARKET, BY TYPE, 2024-2032 (USD MILLION) 50
    77. 2032 (USD MILLION) 53
    78. WIRELESS IOT SENSORS MARKET, BY VERTICAL, 2024-2032 (USD MILLION) 55
    79. BY SUB-SEGMENT, 2024-2032 (USD MILLION) 56
    80. CONUSMER IOT: GLOBAL WIRELESS IOT SENSORS MARKET, BY SUB-SEGMENT, 2024-2032 (USD
    81. MILLION) 56
    82. WIRELESS IOT SENSORS MARKET, BY SUB-SEGMENT, 2024-2032 (USD MILLION) 57
    83. REGION, 2024-2032 (USD MILLION) 58
    84. NORTH AMERICA: WIRELESS IOT SENSORS MARKET, BY COUNTRY, 2024-2032 (USD MILLION)
    85. SENSORS MARKET, BY COMPONENT 2024-2032 (USD MILLION) 60
    86. (USD MILLION) 61
    87. WIRELESS IOT SENSORS MARKET, BY TECHNOLOGY, 2024-2032 (USD MILLION) 61
    88. BY VERTICAL, 2024-2032 (USD MILLION) 62
    89. US WIRELESS IOT SENSORS MARKET, BY COMPONENT 2024-2032 (USD MILLION) 62
    90. 2032 (USD MILLION) 63
    91. WIRELESS IOT SENSORS MARKET, BY TECHNOLOGY, 2024-2032 (USD MILLION) 63
    92. 2032 (USD MILLION) 64
    93. WIRELESS IOT SENSORS MARKET, BY COMPONENT 2024-2032 (USD MILLION) 64
    94. (USD MILLION) 65
    95. IOT SENSORS MARKET, BY TECHNOLOGY, 2024-2032 (USD MILLION) 65
    96. 2032 (USD MILLION) 66
    97. WIRELESS IOT SENSORS MARKET, BY COMPONENT 2024-2032 (USD MILLION) 66
    98. (USD MILLION) 67
    99. IOT SENSORS MARKET, BY TECHNOLOGY, 2024-2032 (USD MILLION) 67
    100. 2032 (USD MILLION) 68
    101. WIRELESS IOT SENSORS MARKET, BY COUNTRY, 2024-2032 (USD MILLION) 70
    102. 2032 (USD MILLION) 70
    103. WIRELESS IOT SENSORS MARKET, BY TYPE, 2024-2032 (USD MILLION) 71
    104. 2032 (USD MILLION) 71
    105. WIRELESS IOT SENSORS MARKET, BY VERTICAL, 2024-2032 (USD MILLION) 72
    106. (USD MILLION) 72
    107. IOT SENSORS MARKET, BY TYPE, 2024-2032 (USD MILLION) 73
    108. MILLION) 73
    109. MARKET, BY VERTICAL, 2024-2032 (USD MILLION) 74
    110. MILLION) 74
    111. IOT SENSORS MARKET, BY TYPE, 2024-2032 (GERMANYD MILLION) 75
    112. (GERMANYD MILLION) 75
    113. WIRELESS IOT SENSORS MARKET, BY VERTICAL, 2024-2032 (GERMANYD MILLION) 76
    114. COMPONENT 2024-2032 (FRANCED MILLION) 76
    115. FRANCE WIRELESS IOT SENSORS MARKET, BY TYPE, 2024-2032 (FRANCED MILLION) 77
    116. TECHNOLOGY, 2024-2032 (FRANCED MILLION) 77
    117. FRANCE WIRELESS IOT SENSORS MARKET, BY VERTICAL, 2024-2032 (FRANCED MILLION)
    118. SENSORS MARKET, BY COMPONENT 2024-2032 (REST OF EUROPED MILLION) 78
    119. TYPE, 2024-2032 (REST OF EUROPED MILLION) 79
    120. REST OF EUROPE WIRELESS IOT SENSORS MARKET, BY TECHNOLOGY, 2024-2032 (REST OF
    121. EUROPED MILLION) 79
    122. WIRELESS IOT SENSORS MARKET, BY VERTICAL, 2024-2032 (REST OF EUROPED MILLION) 80
    123. BY COUNTRY, 2024-2032 (USD MILLION) 82
    124. ASIA-PACIFIC WIRELESS IOT SENSORS MARKET, BY COMPONENT 2024-2032 (USD MILLION)
    125. SENSORS MARKET, BY TYPE, 2024-2032 (USD MILLION) 83
    126. (USD MILLION) 83
    127. WIRELESS IOT SENSORS MARKET, BY VERTICAL, 2024-2032 (USD MILLION) 84
    128. 2032 (USD MILLION) 84
    129. WIRELESS IOT SENSORS MARKET, BY TYPE, 2024-2032 (USD MILLION) 85
    130. 2032 (USD MILLION) 85
    131. WIRELESS IOT SENSORS MARKET, BY VERTICAL, 2024-2032 (USD MILLION) 86
    132. 2032 (JAPAN D MILLION) 86
    133. JAPAN WIRELESS IOT SENSORS MARKET, BY TYPE, 2024-2032 (JAPAN D MILLION) 87
    134. 2032 (JAPAN D MILLION) 87
    135. JAPAN WIRELESS IOT SENSORS MARKET, BY VERTICAL, 2024-2032 (JAPAN D MILLION) 88
    136. 2032 (INDIA D MILLION) 88
    137. INDIA WIRELESS IOT SENSORS MARKET, BY TYPE, 2024-2032 (INDIA D MILLION) 89
    138. 2032 (INDIA D MILLION) 89
    139. INDIA WIRELESS IOT SENSORS MARKET, BY VERTICAL, 2024-2032 (INDIA D MILLION) 90
    140. MARKET, BY COMPONENT 2024-2032 (REST OF ASIA-PACIFICD MILLION) 90
    141. BY TYPE, 2024-2032 (REST OF ASIA-PACIFICD MILLION) 91
    142. 2032 (REST OF ASIA-PACIFICD MILLION) 91
    143. REST OF ASIA-PACIFIC WIRELESS IOT SENSORS MARKET, BY VERTICAL, 2024-2032 (REST
    144. OF ASIA-PACIFICD MILLION) 92
    145. SOUTH AMERICA: WIRELESS IOT SENSORS MARKET, BY COUNTRY, 2024-2032 (USD MILLION)
    146. SENSORS MARKET, BY COMPONENT 2024-2032 (USD MILLION) 94
    147. (USD MILLION) 95
    148. WIRELESS IOT SENSORS MARKET, BY TECHNOLOGY, 2024-2032 (USD MILLION) 95
    149. BY VERTICAL, 2024-2032 (USD MILLION) 96
    150. BRAZIL WIRELESS IOT SENSORS MARKET, BY COMPONENT 2024-2032 (USD MILLION) 96
    151. TYPE, 2024-2032 (USD MILLION) 97
    152. BRAZIL WIRELESS IOT SENSORS MARKET, BY TECHNOLOGY, 2024-2032 (USD MILLION) 97
    153. VERTICAL, 2024-2032 (USD MILLION) 98
    154. ARGENTINA WIRELESS IOT SENSORS MARKET, BY COMPONENT 2024-2032 (ARGENTINAD MILLION)
    155. MARKET, BY TYPE, 2024-2032 (ARGENTINAD MILLION) 99
    156. (ARGENTINAD MILLION) 99
    157. WIRELESS IOT SENSORS MARKET, BY VERTICAL, 2024-2032 (ARGENTINAD MILLION) 100
    158. MARKET, BY COMPONENT 2024-2032 (REST OF SOUTH AMERICAD MILLION) 100
    159. BY TYPE, 2024-2032 (REST OF SOUTH AMERICAD MILLION) 101
    160. 2032 (REST OF SOUTH AMERICAD MILLION) 101
    161. REST OF SOUTH AMERICA WIRELESS IOT SENSORS MARKET, BY VERTICAL, 2024-2032 (REST
    162. OF SOUTH AMERICAD MILLION) 102
    163. MIDDLE EAST & AFRICA: WIRELESS IOT SENSORS MARKET, BY COUNTRY, 2024-2032 (USD
    164. MILLION) 103
    165. AFRICA WIRELESS IOT SENSORS MARKET, BY COMPONENT 2024-2032 (USD MILLION) 104
    166. MARKET, BY TYPE, 2024-2032 (USD MILLION) 104
    167. MIDDLE EAST & AFRICA WIRELESS IOT SENSORS MARKET, BY TECHNOLOGY, 2024-2032
    168. (USD MILLION) 105
    169. & AFRICA WIRELESS IOT SENSORS MARKET, BY VERTICAL, 2024-2032 (USD MILLION) 105
    170. BY COMPONENT 2024-2032 (USD MILLION) 106
    171. SAUDI ARABIA WIRELESS IOT SENSORS MARKET, BY TYPE, 2024-2032 (USD MILLION) 106
    172. BY TECHNOLOGY, 2024-2032 (USD MILLION) 107
    173. SAUDI ARABIA WIRELESS IOT SENSORS MARKET, BY VERTICAL, 2024-2032 (USD MILLION)
    174. MARKET, BY COMPONENT 2024-2032 (UAED MILLION) 108
    175. MARKET, BY TECHNOLOGY, 2024-2032 (UAED MILLION) 109
    176. MILLION) 109
    177. EAST & AFRICA WIRELESS IOT SENSORS MARKET, BY COMPONENT 2024-2032 (REST OF MIDDLE
    178. EAST & AFRICAD MILLION) 110
    179. REST OF MIDDLE EAST & AFRICA WIRELESS IOT SENSORS MARKET, BY TYPE, 2024-2032
    180. (REST OF MIDDLE EAST & AFRICAD MILLION) 110
    181. BY TECHNOLOGY, 2024-2032 (REST OF MIDDLE EAST & AFRICAD MILLION) 111
    182. IOT SENSORS MARKET, BY VERTICAL, 2024-2032 (REST OF MIDDLE EAST & AFRICAD MILLION)
    183. THE GLOBAL WIRELESS IOT SENSORS MARKET 114
    184. TEXAS INSTRUMENTS INCORPORATED: PRODUCTS OFFERED 116
    185. OFFERED 120
    186. KEY DEVELOPMENTS (2024-2032) 121
    187. TE CONNECTIVITY: PRODUCTS OFFERED 125
    188. TE CONNECTIVITY: KEY DEVELOPMENTS (2024-2032) 126
    189. OFFERED 134
    190. KEY DEVELOPMENTS (2024-2032) 134
    191. SONY CORPORATION: PRODUCTS OFFERED 137
    192. SONY CORPORATION: KEY DEVELOPMENTS (2024-2032) 137
    193. PRODUCTS OFFERED (2024-2032) 145
    194. OMRON CORPORATION: PRODUCTS OFFERED 148
    195. OMRON CORPORATION: KEY DEVELOPMENTS (2024-2032) 149
    196. OFFERED 160
    197. CO., LTD: PRODUCTS OFFERED 163
    198. MURATA MANUFACTURING CO., LTD: KEY DEVELOPMENTS (2024-2032) 163

    Wireless IoT Sensors Market Segmentation

    Market Segmentation Overview

    • Detailed segmentation data will be available in the full report
    • Comprehensive analysis by multiple parameters
    • Regional and country-level breakdowns
    • Market size forecasts by segment
    Wireless IoT Sensors Market Research Report - Global Forecast till 2032 Infographic
    Free Sample Request

    Kindly complete the form below to receive a free sample of this Report

    Customer Strories

    “I am very pleased with how market segments have been defined in a relevant way for my purposes (such as "Portable Freezers & refrigerators" and "last-mile"). In general the report is well structured. Thanks very much for your efforts.”

    Victoria Milne Founder
    Case Study

    Chemicals and Materials