• Cat-intel
  • MedIntelliX
  • Resources
  • About Us
  • Request Free Sample ×

    Kindly complete the form below to receive a free sample of this Report

    Leading companies partner with us for data-driven Insights

    clients tt-cursor

    Wearable Display Device Materials Market

    ID: MRFR/CnM/6285-CR
    272 Pages
    Anshula Mandaokar
    April 2019

    Wearable Display Device Materials Market Research Report Information by Substrate (Glass, Polycarbonate), Adhesives (Silicone, Polyurethane), Coatings (Conductive), End-Uses Industry (Smart Glass, Smart Watches, Fitness Trackers) and Region Forecast till 2032

    Share:
    Download PDF ×

    We do not share your information with anyone. However, we may send you emails based on your report interest from time to time. You may contact us at any time to opt-out.

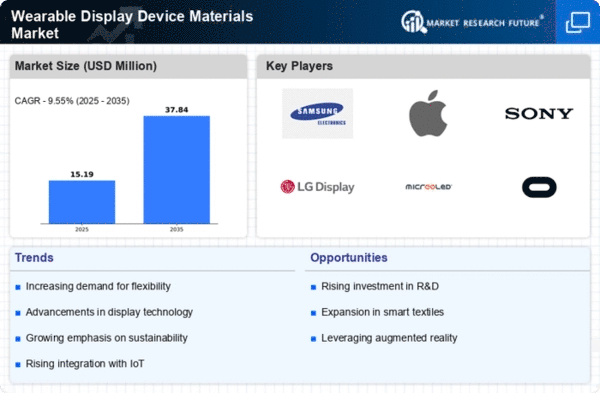
    Wearable Display Device Materials Market Research Report—Forecast till 2032 Infographic
    Purchase Options
    $ 4,950.0
    $ 5,950.0
    $ 7,250.0
    Table of Contents

    Wearable Display Device Materials Market Summary

    The Global Wearable Display Device Materials Market is projected to grow significantly from 45.67 USD Billion in 2024 to 112.34 USD Billion by 2035.

    Key Market Trends & Highlights

    Wearable Display Device Materials Key Trends and Highlights

    • The market is expected to experience a compound annual growth rate (CAGR) of 8.53% from 2025 to 2035.
    • By 2035, the market valuation is anticipated to reach 112.34 USD Billion, indicating robust growth potential.
    • In 2024, the market is valued at 45.67 USD Billion, reflecting a strong foundation for future expansion.
    • Growing adoption of wearable technology due to increasing consumer demand for health monitoring devices is a major market driver.

    Market Size & Forecast

    2024 Market Size 45.67 (USD Billion)
    2035 Market Size 112.34 (USD Billion)
    CAGR (2025 - 2035) 8.53%

    Major Players

    Apple Inc (US), Microsoft Corp (US), Amazon.com Inc (US), Alphabet Inc (US), Berkshire Hathaway Inc (US), Tesla Inc (US), Meta Platforms Inc (US), Johnson & Johnson (US), Visa Inc (US), Procter & Gamble Co (US)

    Wearable Display Device Materials Market Trends

    The evolution of materials used in wearable display devices is poised to redefine user interaction and functionality, reflecting a broader trend towards enhanced integration of technology in daily life.

    U.S. Department of Commerce

    Wearable Display Device Materials Market Drivers

    Market Growth Projections

    The Global Wearable Display Device Materials Market Industry is projected to witness substantial growth over the coming years. With a market value expected to reach 45.67 USD Billion in 2024 and further expand to 112.34 USD Billion by 2035, the industry is poised for a robust trajectory. This growth is underpinned by a compound annual growth rate of 8.53% from 2025 to 2035, indicating a strong demand for innovative materials that enhance wearable technology. The increasing integration of smart features into everyday devices is likely to drive this expansion, as consumers seek more functionality and improved user experiences.

    Rising Demand for Smart Wearables

    The Global Wearable Display Device Materials Market Industry experiences a surge in demand for smart wearables, driven by consumer preferences for health monitoring and fitness tracking. As individuals increasingly seek devices that provide real-time data, the market is projected to reach 45.67 USD Billion in 2024. This growth is indicative of a broader trend towards integrating technology into daily life, where wearable devices serve not only functional purposes but also enhance lifestyle choices. The proliferation of smartwatches and fitness bands exemplifies this trend, as manufacturers innovate with materials that enhance durability and display quality, thereby attracting a wider consumer base.

    Emergence of Augmented Reality Applications

    The emergence of augmented reality applications is reshaping the Global Wearable Display Device Materials Market Industry. As AR technology becomes more mainstream, the demand for wearable devices that support immersive experiences is on the rise. This trend is particularly evident in sectors such as gaming, education, and training, where AR enhances user engagement and learning outcomes. Manufacturers are increasingly focusing on developing materials that facilitate high-quality displays and user interaction, thereby expanding the market's potential. The integration of AR capabilities into wearable devices is expected to drive innovation and growth, positioning the industry for a dynamic future.

    Growing Health Awareness and Fitness Trends

    Growing health awareness and fitness trends are driving the Global Wearable Display Device Materials Market Industry. As consumers become more health-conscious, the demand for wearable devices that monitor health metrics such as heart rate, sleep patterns, and physical activity increases. This trend is reflected in the rising sales of fitness trackers and smartwatches, which utilize advanced materials for better performance and user comfort. The market's expansion is further supported by the integration of health-related features in wearable technology, appealing to a broader audience. This shift towards proactive health management is likely to sustain growth in the industry for years to come.

    Increased Investment in Research and Development

    Increased investment in research and development plays a pivotal role in shaping the Global Wearable Display Device Materials Market Industry. Companies are allocating substantial resources to explore new materials that enhance the functionality and aesthetics of wearable devices. This focus on innovation is likely to yield breakthroughs in lightweight, flexible materials that can withstand daily wear and tear. As a result, the market is anticipated to expand significantly, with projections indicating a rise to 112.34 USD Billion by 2035. This commitment to R&D not only fosters technological advancements but also positions companies to meet evolving consumer demands effectively.

    Technological Advancements in Display Technologies

    Technological advancements in display technologies significantly influence the Global Wearable Display Device Materials Market Industry. Innovations such as OLED and microLED displays offer superior image quality and energy efficiency, which are crucial for wearable devices. These advancements not only improve user experience but also extend battery life, a critical factor for consumer acceptance. As manufacturers adopt these cutting-edge technologies, the market is expected to grow at a CAGR of 8.53% from 2025 to 2035. This growth trajectory suggests a robust future for the industry, as enhanced display capabilities become a key differentiator in a competitive landscape.

    Market Segment Insights

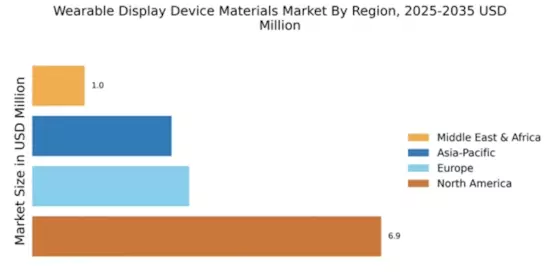
    Regional Insights

    Key Companies in the Wearable Display Device Materials Market market include

    Industry Developments

    In January 2020

    The smart-hearing company, namely Nuheara, has launched the IQbuds2 MAX earbuds. This product consists of many unique features like the cancellation of active noise, personalization, and soundscape, which is growing its demand among the consumers. Moreover, this product produces fine tunes that are helpful for the environment.

    In May 2020

    The prominent player Garmin has launched its quatix 6X Solar, which is a new feature in the marine GPS. This product has a unique feature that it uses solar energy rather than using electric charging with an aim to expand its battery life.

    Future Outlook

    Wearable Display Device Materials Market Future Outlook

    The Wearable Display Device Materials Market is projected to grow at an 8.53% CAGR from 2024 to 2035, driven by advancements in flexible electronics, increasing consumer demand, and innovations in material science.

    New opportunities lie in:

    • Develop lightweight, flexible materials to enhance user comfort and device functionality.
    • Invest in sustainable production methods to meet growing environmental regulations and consumer preferences.
    • Leverage AI and machine learning for predictive analytics in material performance and market trends.

    By 2035, the market is expected to achieve substantial growth, establishing a robust position globally.

    Market Segmentation

    In May 2020

    • Recent Developments
    • Competitive Landscape
    • Regional Analysis
    • Market Segmentation
    • Value Chain Analysis
    • Market Dynamics
    • COVID 19 Analysis
    • Market Overview

    In January 2020

    • Recent Developments
    • Competitive Landscape
    • Regional Analysis
    • Market Segmentation
    • Value Chain Analysis
    • Market Dynamics
    • COVID 19 Analysis
    • Market Overview

    Report Overview

    • Recent Developments
    • Competitive Landscape
    • Regional Analysis
    • Market Segmentation
    • Value Chain Analysis
    • Market Dynamics
    • COVID 19 Analysis
    • Market Overview

    Recent Developments

    • Recent Developments
    • Competitive Landscape
    • Regional Analysis
    • Market Segmentation
    • Value Chain Analysis
    • Market Dynamics
    • COVID 19 Analysis
    • Market Overview

    Competitive Landscape

    • Master Bond Inc. (U.S.)
    • Henkel AG and Co. KGaA (Germany)
    • Covestro AG (Germany)
    • Solvay (Belgium)
    • Eastman Chemical Company (U.S.)
    • 3M (U.S.)
    • Arkema SA (France)
    • Wacker Chemie AG (Germany)
    • DowDuPont (U.S.)
    • BASF SE (Germany)
    • Recent Developments
    • Competitive Landscape
    • Regional Analysis
    • Market Segmentation
    • Value Chain Analysis
    • Market Dynamics
    • COVID 19 Analysis
    • Market Overview

    Report Scope

    Report Attribute/Metric Details
      Market Size ·  2032: USD 4,157.2 Million 
      CAGR   2032: 13.05% CAGR
      Base Year   2023
      Forecast Period   2024 to 2032
      Historical Data   2019 & 2020
      Forecast Units   Value (USD Million)
      Report Coverage   Revenue Forecast, Competitive Landscape, Growth Factors, and Trends
      Segments Covered   Substrate, Adhesives, Coatings and End-Use
      Geographies Covered   North America, Europe, Asia-Pacific, and Rest of the World (RoW)
      Key Vendors   BASF SE (Germany), DowDuPont (U.S.), Wacker Chemie AG (Germany), Arkema SA (France), 3M (U.S.), Eastman Chemical Company (U.S.), Solvay (Belgium), Covestro AG (Germany), Henkel AG and Co. KGaA (Germany), Master Bond Inc. (U.S.)
      Key Market Opportunities   The opportunity in the development of hybrid and multi-function wearable devices that will integrate all the functions in one compact device.
      Key Market Drivers   Owing to the increase in the phenomenon of the Internet Of Things (the IoT), and its interconnected capacity with various devices like computers, laptops, tablets, smartphones, etc

    Market Highlights

    Author
    Anshula Mandaokar
    Team Lead - Research

    Anshula Mandaokar holds an academic degree in Chemical Engineering and has been contributing to the field for more than 5 years. She has expertise in Market Research and Business Consulting and serves as a Team Lead for a reputed Market Research firm under the Chemicals and Materials domain spectrum. She has worked on multiple projects, generating explicit results in a quick turnaround time. Her understanding of data interpretation justifies her role as a leader.

    Leave a Comment

    FAQs

    What are the top market players in the wearable display device materials market in the global market?

    The most prominent market player in the wearable display market in the global market are Master Bond Inc. (U.S.), Covestro AG (Germany), Solvay (Belgium), 3M (U.S.), Arkema SA (France), Wacker Chemie AG (Germany), DowDuPont (U.S.), BASF SE (Germany), and many others.

    What are the expected growth rate and valuation of the wearable display device materials market in the global market during the forecasted period?

    The wearable display device materials market in the global market is expected to show a high CAGR of 13.05% and is expected to reach USD 4,157.2 million during the forecasted period 2024-2032

    Which region has the largest share in the wearable display device materials market in the global market during the forecasted period?

    The largest share in the wearable display device materials market in the global market is held by the Asia-Pacific region as it is expected to show a high CAGR of 14.5% owing to an increase in the advancement in technology followed by North America.

    1. '1 Executive Summary
    2. Market Introduction
    3. Market Definition 24
      1. Scope Of The Study 24
      2. List Of
    4. Assumptions 24
      1. Market Structure 25
    5. Market Insights
      1. Market Insights 27
    6. Research Methodology
    7. Research Process 31
      1. Primary Research 32
      2. Secondary
    8. Research 33
      1. Market Size Estimation 33
      2. Forecast Model
    9. Market Dynamics
      1. Introduction 36
      2. Drivers
        1. Increasing Demand For Silicone-Based Adhesives In The Manufacturing
    10. Of Wearable Devices 37
      1. Rapid Development In The Internet Of Things
    11. (IoT) Technology 38
      1. Increasing Use Of Wearable Smart Glasses 39
      2. Restraint 40
        1. Increasing Cost Of Wearable Devices Due
    12. To Technological Advancements 40
      1. Opportunities 41
    13. Development Of Wearable Smart Safety Helmets For The Mining Industry 41
      1. Increasing Application Of Wearable Devices In Numerous End-Use Industries
      2. Trends 41
        1. Innovation In Adhesive Materials Used
    14. In The Manufacturing Of Medical Wearable Devices 41
    15. Market Factor Analysis
      1. Supply Chain Analysis 43
        1. Raw Material Suppliers 43
        2. Wearable Device Display Materials Manufacturers 44
    16. Distribution Channel 44
      1. End-Use Industries 44
      2. Porter’s
    17. Five Forces Model 44
      1. Threat Of New Entrants 45
    18. Threat Of Rivalry 45
      1. Threat Of Substitutes 45
    19. Bargaining Power Of Suppliers 45
      1. Bargaining Power Of Buyers 45
    20. Market Price Analysis 2020-2027
    21. Global Wearable
    22. Device Display Materials Market, By Substrates
      1. Introduction 49
      2. Glass 50
      3. Fiber 51
      4. Polycarbonates 52
      5. Others 54
    23. Global Wearable Device Display Materials Market,
    24. By Adhesives
      1. Introduction 56
      2. Silicone 57
      3. Epoxy 58
      4. Acrylic 59
      5. Polyurethane 60
      6. Others 62
    25. Global Wearable Device Display Materials Market, By
    26. Coatings
      1. Introduction 64
      2. Parylene 66
    27. Superhydrophobic 67
      1. Piezoresistive 68
      2. Conductive
      3. Others 70
    28. Global Wearable Device Display Materials
    29. Market, By End-Use Industry
      1. Introduction 73
      2. Smart
    30. Glass 74
      1. Smart Watches 75
      2. Wearable Cameras 77
      3. Fitness Trackers 78
      4. Others 79
    31. Global
    32. Wearable Device Display Materials Market, By Region
      1. Introduction
      2. North America 88
        1. US 92
        2. Canada
      3. Europe 101
        1. Germany 106
        2. France
        3. UK 113
        4. Italy 117
        5. Russia
        6. Spain 125
        7. The Netherlands 129
    33. Belgium 133
      1. Poland 137
        1. Rest Of Europe 141
      2. Asia-Pacific 146
        1. China 151
        2. Japan
        3. India 159
        4. South Korea 163
    34. Australia And New Zealand 167
      1. Thailand 171
        1. Malaysia
        2. Indonesia 179
        3. Rest Of Asia-Pacific 183
      2. Latin America 187
        1. Mexico 191
        2. Brazil
        3. Argentina 199
        4. Rest Of Latin America 203
      3. Middle East And Africa 208
        1. Turkey 213
    35. South Africa 217
      1. UAE 221
        1. Saudi Arabia 225
        2. Israel 228
        3. North Africa 232
        4. Rest
    36. Of Middle East And Africa 236
    37. Competitive Landscape
    38. Introduction 242
      1. Market Strategy Analysis 242
    39. Company
    40. Profiles
      1. BASF SE 245
        1. Company Overview 245
        2. Financial Overview 245
        3. Products Offered 246
        4. Key Developments 246
        5. SWOT Analysis 246
    41. Key Strategies 246
      1. DowDuPont 247
        1. Company Overview
        2. Financial Overview 247
        3. Products Offered
        4. Key Developments 248
        5. SWOT Analysis 249
        6. Key Strategies 249
      2. Wacker Chemie AG 250
        1. Company Overview 250
        2. Financial Overview 250
        3. Products Offered 251
        4. Key Developments 251
    42. SWOT Analysis 251
      1. Key Strategies 251
      2. Arkema SA_x005F_x000B_
        1. Company Overview 252
        2. Financial Overview
        3. Products Offered 253
        4. Key Developments 253
        5. SWOT Analysis 253
        6. Key Strategies 253
    43. M 254
      1. Company Overview 254
        1. Financial Overview
        2. Products Offered 255
        3. Key Developments 255
        4. SWOT Analysis 255
        5. Key Strategies 256
    44. Eastman Chemical Company 257
      1. Company Overview 257
    45. Financial Overview 257
      1. Products Offered 258
    46. Key Developments 258
      1. SWOT Analysis 258
        1. Key Strategies
      2. Solvay 259
        1. Company Overview 259
    47. Financial Overview 259
      1. Products Offered 260
    48. Key Developments 260
      1. SWOT Analysis 260
        1. Key Strategies
      2. Covestro AG 261
        1. Company Overview 261
        2. Financial Overview 261
        3. Products Offered 262
        4. Key Developments 263
        5. SWOT Analysis 263
    49. Key Strategies 263
      1. Henkel AG & Co. KGaA 264
    50. Company Overview 264
      1. Financial Overview 264
    51. Products Offered 265
      1. Key Developments 265
        1. SWOT
    52. Analysis 266
      1. Key Strategies 266
      2. Master Bond Inc
        1. Company Overview 267
        2. Financial Overview
        3. Products Offered 267
        4. Key Developments
        5. SWOT Analysis 268
        6. Key Strategies 268
    53. Conclusion
      1. Key Findings 270
    54. List Of Tables
    55. OF ASSUMPTIONS 24
    56. PRICING (USD/TON) (2020–2027) 47
    57. DISPLAY MATERIALS MARKET, BY SUBSTRATES, 2020‒2027 (USD MILLION) 49
    58. GLOBAL WEARABLE DEVICE DISPLAY MATERIALS MARKET, BY SUBSTRATES, 2020‒2027 (KILO
    59. TONS) 50
    60. BY REGION, 2020‒2027 (USD MILLION) 51
    61. DEVICE DISPLAY MATERIALS MARKET, BY REGION, 2020‒2027 (KILO TONS) 51
    62. FIBER: GLOBAL WEARABLE DEVICE DISPLAY MATERIALS MARKET, BY REGION, 2020‒2027 (USD
    63. MILLION) 52
    64. BY REGION, 2020‒2027 (KILO TONS) 52
    65. DEVICE DISPLAY MATERIALS MARKET, BY REGION, 2020‒2027 (USD MILLION) 53
    66. ‒2027 (KILO TONS) 53
    67. MATERIALS MARKET, BY REGION, 2020‒2027 (USD MILLION) 54
    68. GLOBAL WEARABLE DEVICE DISPLAY MATERIALS MARKET, BY REGION, 2020‒2027 (KILO TONS)
    69. ‒2027 (USD MILLION) 56
    70. MARKET, BY ADHESIVES, 2020‒2027 (KILO TONS) 57
    71. WEARABLE DEVICE DISPLAY MATERIALS MARKET, BY REGION, 2020‒2027 (USD MILLION) 58
    72. ‒2027 (KILO TONS) 58
    73. MATERIALS MARKET, BY REGION, 2020‒2027 (USD MILLION) 59
    74. GLOBAL WEARABLE DEVICE DISPLAY MATERIALS MARKET, BY REGION, 2020‒2027 (KILO TONS)
    75. BY REGION, 2020‒2027 (USD MILLION) 60
    76. DEVICE DISPLAY MATERIALS MARKET, BY REGION, 2020‒2027 (KILO TONS) 60
    77. POLYURETHANE: GLOBAL WEARABLE DEVICE DISPLAY MATERIALS MARKET, BY REGION, 2020‒2027
    78. (USD MILLION) 61
    79. MATERIALS MARKET, BY REGION, 2020‒2027 (KILO TONS) 61
    80. GLOBAL WEARABLE DEVICE DISPLAY MATERIALS MARKET, BY REGION, 2020‒2027 (USD MILLION)
    81. BY REGION, 2020‒2027 (KILO TONS) 62
    82. MATERIALS MARKET, BY COATINGS, 2020‒2027 (USD MILLION) 64
    83. WEARABLE DEVICE DISPLAY MATERIALS MARKET, BY COATINGS, 2020‒2027 (KILO TONS) 65
    84. ‒2027 (USD MILLION) 66
    85. DISPLAY MATERIALS MARKET, BY REGION, 2020‒2027 (KILO TONS) 66
    86. SUPERHYDROPHOBIC: GLOBAL WEARABLE DEVICE DISPLAY MATERIALS MARKET, BY REGION, 2020‒2027
    87. (USD MILLION) 67
    88. MATERIALS MARKET, BY REGION, 2020‒2027 (KILO TONS) 67
    89. GLOBAL WEARABLE DEVICE DISPLAY MATERIALS MARKET, BY REGION, 2020‒2027 (USD MILLION)
    90. MARKET, BY REGION, 2020‒2027 (KILO TONS) 68
    91. WEARABLE DEVICE DISPLAY MATERIALS MARKET, BY REGION, 2020‒2027 (USD MILLION) 69
    92. REGION, 2020‒2027 (KILO TONS) 69
    93. DISPLAY MATERIALS MARKET, BY REGION, 2020‒2027 (USD MILLION) 70
    94. OTHERS: GLOBAL WEARABLE DEVICE DISPLAY MATERIALS MARKET, BY REGION, 2020‒2027
    95. (KILO TONS) 70
    96. BY END-USE INDUSTRY, 2020‒2027 (USD MILLION) 73
    97. DEVICE DISPLAY MATERIALS MARKET, BY END-USE INDUSTRY, 2020‒2027 (KILO TONS) 74
    98. REGION, 2020‒2027 (USD MILLION) 75
    99. DEVICE DISPLAY MATERIALS MARKET, BY REGION, 2020‒2027 (KILO TONS) 75
    100. SMART WATCHES: GLOBAL WEARABLE DEVICE DISPLAY MATERIALS MARKET, BY REGION, 2020‒2027
    101. (USD MILLION) 76
    102. MATERIALS MARKET, BY REGION, 2020‒2027 (KILO TONS) 76
    103. CAMERAS: GLOBAL WEARABLE DEVICE DISPLAY MATERIALS MARKET, BY REGION, 2020‒2027 (USD
    104. MILLION) 77
    105. MATERIALS MARKET, BY REGION, 2020‒2027 (KILO TONS) 77
    106. TRACKERS: GLOBAL WEARABLE DEVICE DISPLAY MATERIALS MARKET, BY REGION, 2020‒2027
    107. (USD MILLION) 78
    108. MATERIALS MARKET, BY REGION, 2020‒2027 (KILO TONS) 78
    109. GLOBAL WEARABLE DEVICE DISPLAY MATERIALS MARKET, BY REGION, 2020‒2027 (USD MILLION)
    110. BY REGION, 2020‒2027 (KILO TONS) 79
    111. MATERIALS MARKET, BY REGION, 2020‒2027 (USD MILLION) 83
    112. WEARABLE DEVICE DISPLAY MATERIALS MARKET, BY REGION, 2020‒2027 (KILO TONS) 84
    113. ‒2027 (USD MILLION) 84
    114. MARKET, BY SUBSTRATES, 2020‒2027 (KILO TONS) 84
    115. DEVICE DISPLAY MATERIALS MARKET, BY ADHESIVES, 2020‒2027 (USD MILLION) 85
    116. (KILO TONS) 85
    117. BY COATINGS, 2020‒2027 (USD MILLION) 86
    118. DISPLAY MATERIALS MARKET, BY COATINGS, 2020‒2027 (KILO TONS) 86
    119. GLOBAL WEARABLE DEVICE DISPLAY MATERIALS MARKET, BY END-USE INDUSTRY, 2020‒2027
    120. (USD MILLION) 87
    121. BY END-USE INDUSTRY, 2020‒2027 (KILO TONS) 87
    122. WEARABLE DEVICE DISPLAY MATERIALS MARKET, BY COUNTRY, 2020‒2027 (USD MILLION) 88
    123. ‒2027 (KILO TONS) 88
    124. MATERIALS MARKET, BY SUBSTRATES, 2020‒2027 (USD MILLION) 88
    125. NORTH AMERICA: WEARABLE DEVICE DISPLAY MATERIALS MARKET, BY SUBSTRATES, 2020‒2027
    126. (KILO TONS) 89
    127. MARKET, BY ADHESIVES, 2020‒2027 (USD MILLION) 89
    128. WEARABLE DEVICE DISPLAY MATERIALS MARKET, BY ADHESIVES, 2020‒2027 (KILO TONS) 90
    129. ‒2027 (USD MILLION) 90
    130. MATERIALS MARKET, BY COATINGS, 2020‒2027 (KILO TONS) 91
    131. AMERICA: WEARABLE DEVICE DISPLAY MATERIALS MARKET, BY END-USE INDUSTRY, 2020‒2027
    132. (USD MILLION) 91
    133. MARKET, BY END-USE INDUSTRY, 2020‒2027 (KILO TONS) 92
    134. DEVICE DISPLAY MATERIALS MARKET, BY SUBSTRATES, 2020‒2027 (USD MILLION) 92
    135. (KILO TONS) 93
    136. BY ADHESIVES, 2020‒2027 (USD MILLION) 93
    137. DISPLAY MATERIALS MARKET, BY ADHESIVES, 2020‒2027 (KILO TONS) 94
    138. US: WEARABLE DEVICE DISPLAY MATERIALS MARKET, BY COATINGS, 2020‒2027 (USD MILLION)
    139. ‒2027 (KILO TONS) 95
    140. MARKET, BY END-USE INDUSTRY, 2020‒2027 (USD MILLION) 95
    141. WEARABLE DEVICE DISPLAY MATERIALS MARKET, BY END-USE INDUSTRY, 2020‒2027 (KILO TONS)
    142. ‒2027 (USD MILLION) 96
    143. MARKET, BY SUBSTRATES, 2020‒2027 (KILO TONS) 97
    144. DEVICE DISPLAY MATERIALS MARKET, BY ADHESIVES, 2020‒2027 (USD MILLION) 97
    145. (KILO TONS) 98
    146. BY COATINGS, 2020‒2027 (USD MILLION) 98
    147. DISPLAY MATERIALS MARKET, BY COATINGS, 2020‒2027 (KILO TONS) 99
    148. CANADA: WEARABLE DEVICE DISPLAY MATERIALS MARKET, BY END-USE INDUSTRY, 2020‒2027
    149. (USD MILLION) 99
    150. BY END-USE INDUSTRY, 2020‒2027 (KILO TONS) 100
    151. DEVICE DISPLAY MATERIALS MARKET, BY COUNTRY, 2020‒2027 (USD MILLION) 101
    152. (KILO TONS) 101
    153. BY SUBSTRATES, 2020‒2027 (USD MILLION) 102
    154. DEVICE DISPLAY MATERIALS MARKET, BY SUBSTRATES, 2020‒2027 (KILO TONS) 102
    155. (USD MILLION) 103
    156. MARKET, BY ADHESIVES, 2020‒2027 (KILO TONS) 103
    157. DEVICE DISPLAY MATERIALS MARKET, BY COATINGS, 2020‒2027 (USD MILLION) 104
    158. (KILO TONS) 104
    159. BY END-USE INDUSTRY, 2020‒2027 (USD MILLION) 105
    160. DEVICE DISPLAY MATERIALS MARKET, BY END-USE INDUSTRY, 2020‒2027 (KILO TONS) 105
    161. ‒2027 (USD MILLION) 106
    162. MATERIALS MARKET, BY SUBSTRATES, 2020‒2027 (KILO TONS) 106
    163. WEARABLE DEVICE DISPLAY MATERIALS MARKET, BY ADHESIVES, 2020‒2027 (USD MILLION)
    164. ‒2027 (KILO TONS) 107
    165. MATERIALS MARKET, BY COATINGS, 2020‒2027 (USD MILLION) 107
    166. GERMANY: WEARABLE DEVICE DISPLAY MATERIALS MARKET, BY COATINGS, 2020‒2027 (KILO
    167. TONS) 108
    168. BY END-USE INDUSTRY, 2020‒2027 (USD MILLION) 108
    169. DEVICE DISPLAY MATERIALS MARKET, BY END-USE INDUSTRY, 2020‒2027 (KILO TONS) 109
    170. ‒2027 (USD MILLION) 109
    171. MATERIALS MARKET, BY SUBSTRATES, 2020‒2027 (KILO TONS) 110
    172. FRANCE: WEARABLE DEVICE DISPLAY MATERIALS MARKET, BY ADHESIVES, 2020‒2027 (USD MILLION)
    173. ‒2027 (KILO TONS) 111
    174. MARKET, BY COATINGS, 2020‒2027 (USD MILLION) 111
    175. DEVICE DISPLAY MATERIALS MARKET, BY COATINGS, 2020‒2027 (KILO TONS) 112
    176. ‒2027 (USD MILLION) 112
    177. MATERIALS MARKET, BY END-USE INDUSTRY, 2020‒2027 (KILO TONS) 113
    178. UK: WEARABLE DEVICE DISPLAY MATERIALS MARKET, BY SUBSTRATES, 2020‒2027 (USD
    179. MILLION) 113
    180. BY SUBSTRATES, 2020‒2027 (KILO TONS) 114
    181. DISPLAY MATERIALS MARKET, BY ADHESIVES, 2020‒2027 (USD MILLION) 114
    182. UK: WEARABLE DEVICE DISPLAY MATERIALS MARKET, BY ADHESIVES, 2020‒2027 (KILO
    183. TONS) 115
    184. COATINGS, 2020‒2027 (USD MILLION) 115
    185. MATERIALS MARKET, BY COATINGS, 2020‒2027 (KILO TONS) 116
    186. WEARABLE DEVICE DISPLAY MATERIALS MARKET, BY END-USE INDUSTRY, 2020‒2027 (USD MILLION)
    187. INDUSTRY, 2020‒2027 (KILO TONS) 117
    188. DISPLAY MATERIALS MARKET, BY SUBSTRATES, 2020‒2027 (USD MILLION) 117
    189. ITALY: WEARABLE DEVICE DISPLAY MATERIALS MARKET, BY SUBSTRATES, 2020‒2027 (KILO
    190. TONS) 118
    191. BY ADHESIVES, 2020‒2027 (USD MILLION) 118
    192. DISPLAY MATERIALS MARKET, BY ADHESIVES, 2020‒2027 (KILO TONS) 119
    193. ITALY: WEARABLE DEVICE DISPLAY MATERIALS MARKET, BY COATINGS, 2020‒2027 (USD
    194. MILLION) 119
    195. BY COATINGS, 2020‒2027 (KILO TONS) 120
    196. DISPLAY MATERIALS MARKET, BY END-USE INDUSTRY, 2020‒2027 (USD MILLION) 120
    197. ‒2027 (KILO TONS) 121
    198. MARKET, BY SUBSTRATES, 2020‒2027 (USD MILLION) 121
    199. WEARABLE DEVICE DISPLAY MATERIALS MARKET, BY SUBSTRATES, 2020‒2027 (KILO TONS) 122
    200. ‒2027 (USD MILLION) 122
    201. MATERIALS MARKET, BY ADHESIVES, 2020‒2027 (KILO TONS) 123
    202. WEARABLE DEVICE DISPLAY MATERIALS MARKET, BY COATINGS, 2020‒2027 (USD MILLION) 123
    203. ‒2027 (KILO TONS) 124
    204. MARKET, BY END-USE INDUSTRY, 2020‒2027 (USD MILLION) 124
    205. WEARABLE DEVICE DISPLAY MATERIALS MARKET, BY END-USE INDUSTRY, 2020‒2027 (KILO TONS)
    206. ‒2027 (USD MILLION) 125
    207. MATERIALS MARKET, BY SUBSTRATES, 2020‒2027 (KILO TONS) 126
    208. SPAIN: WEARABLE DEVICE DISPLAY MATERIALS MARKET, BY ADHESIVES, 2020‒2027 (USD MILLION)
    209. ‒2027 (KILO TONS) 127
    210. MARKET, BY COATINGS, 2020‒2027 (USD MILLION) 127
    211. DEVICE DISPLAY MATERIALS MARKET, BY COATINGS, 2020‒2027 (KILO TONS) 128
    212. ‒2027 (USD MILLION) 128
    213. MATERIALS MARKET, BY END-USE INDUSTRY, 2020‒2027 (KILO TONS) 129
    214. THE NETHERLANDS: WEARABLE DEVICE DISPLAY MATERIALS MARKET, BY SUBSTRATES, 2020‒2027
    215. (USD MILLION) 129
    216. MATERIALS MARKET, BY SUBSTRATES, 2020‒2027 (KILO TONS) 130
    217. THE NETHERLANDS: WEARABLE DEVICE DISPLAY MATERIALS MARKET, BY ADHESIVES, 2020‒2027
    218. (USD MILLION) 130
    219. MATERIALS MARKET, BY ADHESIVES, 2020‒2027 (KILO TONS) 131
    220. NETHERLANDS: WEARABLE DEVICE DISPLAY MATERIALS MARKET, BY COATINGS, 2020‒2027 (USD
    221. MILLION) 131
    222. MARKET, BY COATINGS, 2020‒2027 (KILO TONS) 132
    223. WEARABLE DEVICE DISPLAY MATERIALS MARKET, BY END-USE INDUSTRY, 2020‒2027 (USD MILLION)
    224. BY END-USE INDUSTRY, 2020‒2027 (KILO TONS) 133
    225. DEVICE DISPLAY MATERIALS MARKET, BY SUBSTRATES, 2020‒2027 (USD MILLION) 133
    226. (KILO TONS) 134
    227. MARKET, BY ADHESIVES, 2020‒2027 (USD MILLION) 134
    228. WEARABLE DEVICE DISPLAY MATERIALS MARKET, BY ADHESIVES, 2020‒2027 (KILO TONS) 135
    229. ‒2027 (USD MILLION) 135
    230. MATERIALS MARKET, BY COATINGS, 2020‒2027 (KILO TONS) 136
    231. WEARABLE DEVICE DISPLAY MATERIALS MARKET, BY END-USE INDUSTRY, 2020‒2027 (USD MILLION)
    232. INDUSTRY, 2020‒2027 (KILO TONS) 137
    233. DISPLAY MATERIALS MARKET, BY SUBSTRATES, 2020‒2027 (USD MILLION) 137
    234. POLAND: WEARABLE DEVICE DISPLAY MATERIALS MARKET, BY SUBSTRATES, 2020‒2027 (KILO
    235. TONS) 138
    236. BY ADHESIVES, 2020‒2027 (USD MILLION) 138
    237. DEVICE DISPLAY MATERIALS MARKET, BY ADHESIVES, 2020‒2027 (KILO TONS) 139
    238. (USD MILLION) 139
    239. MARKET, BY COATINGS, 2020‒2027 (KILO TONS) 140
    240. DEVICE DISPLAY MATERIALS MARKET, BY END-USE INDUSTRY, 2020‒2027 (USD MILLION) 140
    241. ‒2027 (KILO TONS) 141
    242. MATERIALS MARKET, BY SUBSTRATES, 2020‒2027 (USD MILLION) 141
    243. REST OF EUROPE: WEARABLE DEVICE DISPLAY MATERIALS MARKET, BY SUBSTRATES, 2020‒2027
    244. (KILO TONS) 142
    245. MARKET, BY ADHESIVES, 2020‒2027 (USD MILLION) 142
    246. WEARABLE DEVICE DISPLAY MATERIALS MARKET, BY ADHESIVES, 2020‒2027 (KILO TONS) 143
    247. ‒2027 (USD MILLION) 143
    248. DISPLAY MATERIALS MARKET, BY COATINGS, 2020‒2027 (KILO TONS) 144
    249. REST OF EUROPE: WEARABLE DEVICE DISPLAY MATERIALS MARKET, BY END-USE INDUSTRY,
    250. ‒2027 (USD MILLION) 144
    251. DISPLAY MATERIALS MARKET, BY END-USE INDUSTRY, 2020‒2027 (KILO TONS) 145
    252. ‒2027 (USD MILLION) 146
    253. MATERIALS MARKET, BY COUNTRY, 2020‒2027 (KILO TONS) 146
    254. WEARABLE DEVICE DISPLAY MATERIALS MARKET, BY SUBSTRATES, 2020‒2027 (USD MILLION)
    255. BY SUBSTRATES, 2020‒2027 (KILO TONS) 147
    256. DEVICE DISPLAY MATERIALS MARKET, BY ADHESIVES, 2020‒2027 (USD MILLION) 148
    257. ‒2027 (KILO TONS) 148
    258. MATERIALS MARKET, BY COATINGS, 2020‒2027 (USD MILLION) 149
    259. ASIA-PACIFIC: WEARABLE DEVICE DISPLAY MATERIALS MARKET, BY COATINGS, 2020‒2027 (KILO
    260. TONS) 149
    261. BY END-USE INDUSTRY, 2020‒2027 (USD MILLION) 150
    262. WEARABLE DEVICE DISPLAY MATERIALS MARKET, BY END-USE INDUSTRY, 2020‒2027 (KILO TONS)
    263. ‒2027 (USD MILLION) 151
    264. MATERIALS MARKET, BY SUBSTRATES, 2020‒2027 (KILO TONS) 151
    265. CHINA: WEARABLE DEVICE DISPLAY MATERIALS MARKET, BY ADHESIVES, 2020‒2027 (USD MILLION)
    266. ‒2027 (KILO TONS) 152
    267. MARKET, BY COATINGS, 2020‒2027 (USD MILLION) 153
    268. DEVICE DISPLAY MATERIALS MARKET, BY COATINGS, 2020‒2027 (KILO TONS) 153
    269. ‒2027 (USD MILLION) 154
    270. MATERIALS MARKET, BY END-USE INDUSTRY, 2020‒2027 (KILO TONS) 154
    271. JAPAN: WEARABLE DEVICE DISPLAY MATERIALS MARKET, BY SUBSTRATES, 2020‒2027 (USD
    272. MILLION) 155
    273. BY SUBSTRATES, 2020‒2027 (KILO TONS) 155
    274. DISPLAY MATERIALS MARKET, BY ADHESIVES, 2020‒2027 (USD MILLION) 156
    275. JAPAN: WEARABLE DEVICE DISPLAY MATERIALS MARKET, BY ADHESIVES, 2020‒2027 (KILO
    276. TONS) 156
    277. BY COATINGS, 2020‒2027 (USD MILLION) 157
    278. DISPLAY MATERIALS MARKET, BY COATINGS, 2020‒2027 (KILO TONS) 157
    279. JAPAN: WEARABLE DEVICE DISPLAY MATERIALS MARKET, BY END-USE INDUSTRY, 2020‒2027
    280. (USD MILLION) 158
    281. MARKET, BY END-USE INDUSTRY, 2020‒2027 (KILO TONS) 158
    282. WEARABLE DEVICE DISPLAY MATERIALS MARKET, BY SUBSTRATES, 2020‒2027 (USD MILLION)
    283. ‒2027 (KILO TONS) 159
    284. MARKET, BY ADHESIVES, 2020‒2027 (USD MILLION) 160
    285. DEVICE DISPLAY MATERIALS MARKET, BY ADHESIVES, 2020‒2027 (KILO TONS) 160
    286. (USD MILLION) 161
    287. MARKET, BY COATINGS, 2020‒2027 (KILO TONS) 161
    288. DEVICE DISPLAY MATERIALS MARKET, BY END-USE INDUSTRY, 2020‒2027 (USD MILLION) 162
    289. ‒2027 (KILO TONS) 162
    290. MATERIALS MARKET, BY SUBSTRATES, 2020‒2027 (USD MILLION) 163
    291. SOUTH KOREA: WEARABLE DEVICE DISPLAY MATERIALS MARKET, BY SUBSTRATES, 2020‒2027
    292. (KILO TONS) 163
    293. MARKET, BY ADHESIVES, 2020‒2027 (USD MILLION) 164
    294. WEARABLE DEVICE DISPLAY MATERIALS MARKET, BY ADHESIVES, 2020‒2027 (KILO TONS) 164
    295. ‒2027 (USD MILLION) 165
    296. MATERIALS MARKET, BY COATINGS, 2020‒2027 (KILO TONS) 165
    297. KOREA: WEARABLE DEVICE DISPLAY MATERIALS MARKET, BY END-USE INDUSTRY, 2020‒2027
    298. (USD MILLION) 166
    299. MARKET, BY END-USE INDUSTRY, 2020‒2027 (KILO TONS) 166
    300. AND NEW ZEALAND: WEARABLE DEVICE DISPLAY MATERIALS MARKET, BY SUBSTRATES, 2020‒2027
    301. (USD MILLION) 167
    302. DISPLAY MATERIALS MARKET, BY SUBSTRATES, 2020‒2027 (KILO TONS) 167
    303. AUSTRALIA AND NEW ZEALAND: WEARABLE DEVICE DISPLAY MATERIALS MARKET, BY ADHESIVES,
    304. ‒2027 (USD MILLION) 168
    305. DEVICE DISPLAY MATERIALS MARKET, BY ADHESIVES, 2020‒2027 (KILO TONS) 168
    306. BY COATINGS, 2020‒2027 (USD MILLION) 169
    307. ZEALAND: WEARABLE DEVICE DISPLAY MATERIALS MARKET, BY COATINGS, 2020‒2027 (KILO
    308. TONS) 169
    309. MATERIALS MARKET, BY END-USE INDUSTRY, 2020‒2027 (USD MILLION) 170

    Wearable Display Device Materials Market Segmentation

    Market Segmentation Overview

    • Detailed segmentation data will be available in the full report
    • Comprehensive analysis by multiple parameters
    • Regional and country-level breakdowns
    • Market size forecasts by segment
    Wearable Display Device Materials Market Research Report—Forecast till 2032 Infographic
    Free Sample Request

    Kindly complete the form below to receive a free sample of this Report

    Customer Strories

    “I am very pleased with how market segments have been defined in a relevant way for my purposes (such as "Portable Freezers & refrigerators" and "last-mile"). In general the report is well structured. Thanks very much for your efforts.”

    Victoria Milne Founder
    Case Study

    Chemicals and Materials