• Cat-intel
  • MedIntelliX
  • Resources
  • About Us
  • Request Free Sample ×

    Kindly complete the form below to receive a free sample of this Report

    Leading companies partner with us for data-driven Insights

    clients tt-cursor

    Volt VAR Management Market

    ID: MRFR/E&P/6180-HCR
    111 Pages
    Anshula Mandaokar
    September 2025

    Volt/VAR Management Market Research Report Information By Application (Distribution & Transmission), By Component (Hardware and Software & Services), By End-Use (Utilities and Industrial), And By Region (North America, Europe, Asia-Pacific, And Rest Of The World) –Market Forecast Till 2032

    Share:
    Download PDF ×

    We do not share your information with anyone. However, we may send you emails based on your report interest from time to time. You may contact us at any time to opt-out.

    Purchase Options
    $ 4,950.0
    $ 5,950.0
    $ 7,250.0
    Table of Contents

    Volt VAR Management Market Summary

    Volt VAR Management Market Trends

      • Growing use of smart grids is driving the market growth

    The rising use of smart grids drives Market CAGR for Volt/VAR management. Volt/VAr management market expansion will be driven by a significant need for skilled operations to minimize power distribution loss and maximize energy factor throughout the anticipated timeframe. In addition, there will be a considerable need for volt management services over the next years because of the continuous need for electricity from industry and houses. 

    The importance of load flow and load shedding in the power sector has increased the demand for skilled voltage management operations, which will likely fuel the expansion of the volt/VAr management market in future years. Modernizing the electrical grid must include smart grid integration for utilities to improve sustainability, dependability, and efficiency. Demand response programs are made possible by smart grid integration, allowing utilities to communicate with customers directly. 

    Utility companies can instruct smart metres to transmit messages to customers to temporarily cut their power use during high demand or grid problems. Demand-side management lessens the need for expensive infrastructure investments while assisting in grid balancing. Volt/VAR management seeks to keep the grid's voltage and reactive power at ideal levels. Using smart grid technology, utilities may optimize dynamic Volt/VAR using the real-time data gathered from smart meters and sensors. 

    This entails dynamically altering voltage levels and reactive power settings to reduce energy losses and enhance power quality. Smart grid technologies use cutting-edge communication, control, and information technology to develop a more intelligent and interactive power system. Smart meter and sensor deployment across the distribution network is a component of smart grid systems. These gadgets provide real-time information on electricity use, voltage levels, and power quality.

    With thorough monitoring, utilities may learn much about how the grid behaves and spot inefficiencies or possible issues. DERs are frequently situated close to customers, generally smaller-scale, and dispersed across the distribution network. Due to DERs' decentralized nature, energy generation is more unpredictable and intermittent, which can cause voltage fluctuations, power imbalances, and other operational challenges for grid operators. 

    Volt VAR Management Market Drivers

    Market Segment Insights

    Volt/VAR Management Application Insights

    Based on application, the Volt/VAR Management market segmentation includes distribution & transmission. The distribution segment dominated the market, accounting for 67% of market revenue. The distribution sector of the volt/VAr management market is growing because of the expansion of smart grid implementation and the requirement to minimize power outages & faults in distribution feeders. The distribution volt/VAr management market is anticipated to be the largest and one with the quickest growth rates in North America.

    Volt/VAR Management Component Insights

    The Volt/VAR Management market segmentation, based on components, includes hardware, software & services. The hardware segment dominated the market. Due to the demand for effective power generation and flow operations by combining volt/VAr optimization, substation automation, sophisticated distribution management, and fault detection, this market sector is anticipated to rise steadily. 

    The demand for hardware components is anticipated to increase throughout the projected period due to upcoming power-generating projects in the non-renewable and renewable power sectors and transmission and distribution projects in nations like the US, the UK, Ireland, France, Norway, India, and China.

    Volt/VAR Management End-Use Insights

    Based on End Use, the Volt/VAR Management market segmentation includes utilities and industrial. The utilities category generated the most income (70.4%). Volt/VAr management is a service that aids utilities in giving end-users the proper voltage at the best power factor possible to reduce losses. In nations like China, India, and the US, the need for electricity is anticipated to rise dramatically during the projection period, which is anticipated to raise the demand for volt/VAr management.

    Figure 1: Volt/VAR Management Market, by End Use, 2022 & 2032 (USD Billion)

    Volt VAR Management Market, by End Use

    Source: Secondary Research, Primary Research, Market Research Future Database and Analyst Review

    Regional Insights

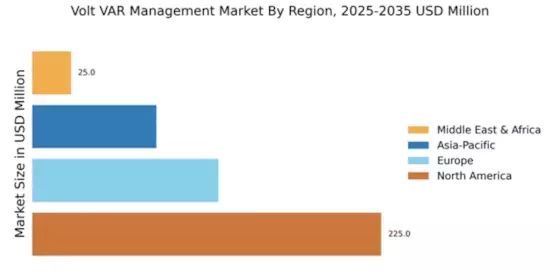
    By region, the study provides market insights into North America, Europe, Asia-Pacific and the Rest of the World. The North American Volt/VAR Management market area will dominate this market, with growth in Volt/VAR management market demand during the course of the projection. Reducing power losses would increase volt/VAR management investments, increasing North American demand for volt/VAR management.

    Hence, the major countries studied in the market report are The US, Canada, Spain, China, German, France, the UK, Australia, South Korea, Italy, Japan, India, and Brazil.

    Figure 2: Volt/Var Management Market Share By Region 2022 (USD Billion)

    Volt Var Management Market Share

    Source: Secondary Research, Primary Research, Market Research Future Database and Analyst Review

    Europe has the second-largest market share for Volt/VAR Management. European countries have been aggressively updating their electrical infrastructure to enable the integration of energy from renewable sources like wind and solar. Volt/VAR management systems are essential for optimizing reactive power and voltage regulation, which is necessary for the steady and effective integration of these decentralized energy resources. Furthermore, the German Volt/VAR Management market dominated, while the UK Volt/VAR Management market grew fastest in Europe.

    From 2023 to 2032, the Asia-Pacific Volt/VAR Management Market will develop quickly. The Asia-Pacific area is seeing a major rise in energy consumption due to its sizable and steadily growing population. Volt/VAR management tools aid utilities in better demand management, peak load reduction, and grid stability. Furthermore, China's Volt/VAR Management market had the highest market share, while India's was the fastest expanding in the Asia-Pacific region.

    Key Players and Competitive Insights

    Leading market companies are extensively spending R&D on increasing their product lines, which will help the Volt/VAR Management market grow even more. Important market developments include new product releases, contractual agreements, acquisitions and mergers, greater investments, and collaboration with other organizations. The Volt/VAR Management industry must produce cost-effective merchandise to flourish and thrive in a more competitive and increasing market climate.

    Manufacturing locally to reduce operating costs is an effective business strategy manufacturers use in the worldwide Volt/VAR Management industry to serve clients and expand the market sector. The Volt/VAR Management industry has provided some of the most important benefits recently. Schneider Electric, and other major competitors in the Volt/VAR Management market are seeking to improve market demand by investing in R&D efforts.

    The digital transformation of  infrastructure, energy management and automation in homes,data centers,  buildings,and industries is driven by Schneider Electric. Schneider is, without a doubt, the market leader in Automation Systems and Power Management - Medium Voltage, Low Voltage, and Secure Power - with a presence in more than 100 countries worldwide. They offer comprehensive efficiency solutions that incorporate energy, automation, and software. 

    They work with the biggest Partner, Integrator, and Developer Community on their Open Platform in our worldwide Ecosystem to provide real-time control and operational efficiency. Their dedication to innovation, diversity, and sustainability guarantees that life is on everywhere, for everyone, and at all times, and they think that great people and partners make Schneider a great business.

    In May 2019, Upgrade to EcoStruxureTM Power, the digital energy management solution built on industry-leading connected devices, edge control software, and advisor services, was announced today by Schneider Electric, the pioneer in the digital revolution of energy management and automation. The most recent EcoStruxure Power 2.0 design complies with IEC cyber-security requirements and is fully accredited to ISO energy management standards.

    ABB solutions link software and technical expertise to optimize objects' power, production, movement,  and operation. ABB's 105,000 workers are dedicated to driving breakthroughs that hasten industrial change, building on more than 130 years of excellence.ABB's Electrification division offers a diverse spectrum of products, digital solutions, and services, allowing safe, intelligent, and sustainable electrification from substation to socket. 

    Offerings include modular substations,  EV infrastructure, distribution automation, solar inverters, power protection, wire accessories, switchgear, enclosures, cabling, sensors, and low- and medium-voltage control. In June 2019, The State Grid Corporation of China (SGCC) won a power transmission contract with ABB. To protect the grid against disruptive failures, the firm intends to deploy high-voltage equipment like breakers. It also seeks to use capacitor banks to enhance the quality of the energy supply, increase product life, and reduce losses.

    Industry Developments

    August 2020:Larsen & Turbo, an Indian construction engineering company, has sold its electrical and automation business to Schneider Electric. This French company is a pioneer in energy and automation systems, for INR 14,000 crores. This is a significant development that may impact the growth of the Volt/VAr management industry.

    Market Segmentation

    Volt/VAR Management End Use Outlook

    • Utilities
    • Industrial

    Volt/VAR Management Regional Outlook

    • US
    • Canada

    Volt/VAR Management Component Outlook

    • Hardware
    • Software
    • Services

    Volt/VAR Management Application Outlook

    • Distribution
    • Transmission

    Report Scope

    Report Attribute/Metric Details
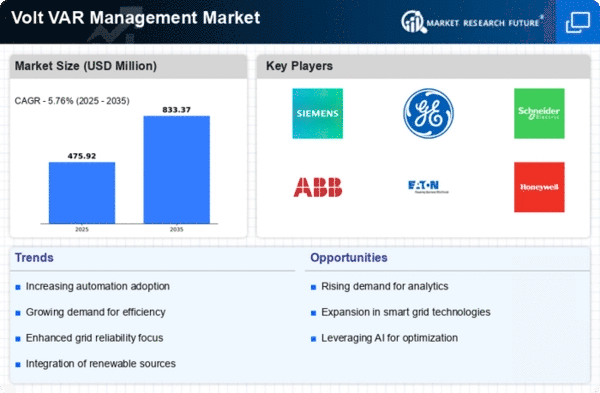
    Market Size 2023 USD 0.42 Billion
    Market Size 2024 USD 0.45 Billion
    Market Size 2032 USD 0.7 Billion
    Compound Annual Growth Rate (CAGR) 5.76% (2024-2032)
    Base Year 2023
    Market Forecast Period 2024-2032
    Historical Data 2018- 2022
    Market Forecast Units Value (USD Billion)
    Report Coverage Revenue Forecast, Market Competitive Landscape, Growth Factors, and Trends
    Segments Covered Type, End Use, and Region
    Geographies Covered North America, Europe, Asia Pacific, and the Rest of the World
    Countries Covered The US, Canada, German, France, UK, Italy, Spain, China, Japan, India, Australia, South Korea, and Brazil
    Key Companies Profiled  ABB, S&C Electric Company, DC Systems, Beckwith Electric, Utilidata, Open Systems International, Landis+Gyr, Advanced Control Systems, Siemens, Schneider Electric, GE, Eaton, and VArentec.
    Key Market Opportunities Favorable regulations and incentives to utilities
    Key Market Dynamics Focus on reduction in transmission & distribution (T&D) losses Reduction in operational cost

    Market Highlights

    Author
    Anshula Mandaokar
    Team Lead - Research

    Anshula Mandaokar holds an academic degree in Chemical Engineering and has been contributing to the field for more than 5 years. She has expertise in Market Research and Business Consulting and serves as a Team Lead for a reputed Market Research firm under the Chemicals and Materials domain spectrum. She has worked on multiple projects, generating explicit results in a quick turnaround time. Her understanding of data interpretation justifies her role as a leader.

    Leave a Comment

    FAQs

    How much is the Volt/VAR Management market?

    The Volt/VAR Management market size was valued at USD 0.42 Billion in 2023.

    What is the growth rate of the Volt/VAR Management market?

    The market is projected to grow at a CAGR of 5.76% during the forecast period, 2024-2032.

    Which region held the largest market share in the Volt/VAR Management market?

    North America had the largest share in the market

    Who are the key players in the Volt/VAR Management market?

    The key players in the market are ABB, S&C Electric Company, DC Systems, Beckwith Electric, Utilidata, Open Systems International, Landis+Gyr,

    Which Application led the Volt/VAR Management market?

    The distribution dominated the market in 2022.

    Which End Use had the largest market share in the Volt/VAR Management market?

    The store based had the largest share in the market.

    1. 'Table
    2. of Contents
    3. Executive Summary
    4. Market Introduction
      1. Market
    5. Definition
      1. Scope of the Study
      2. Market Structure
    6. Research Methodology
    7. Primary Research
      1. Secondary Research
      2. Market size Estimation
    8. Forecast Model
      1. List of Assumptions
      2. Limitations of the study
    9. Market Insights
    10. Market Dynamics
      1. Introduction
      2. Market Drivers
      3. Market
    11. Restraints
      1. Market Opportunities
      2. Porter’s Five Forces Analysis
    12. Threat of New Entrants
      1. Bargaining Power of Buyers
        1. Bargaining Power of Suppliers
    13. Threat of Substitutes
      1. Intensity of Rivalry
      2. Value Chain/Supply Chain Analysis
    14. Global Volt/Var Market, By Application
      1. Introduction
      2. Distribution Sector
    15. Market Estimates & Forecast, 2023-2032
      1. Market Estimates & Forecast,
    16. By Region, 2023-2032
      1. Transmission Sector
        1. Market Estimates & Forecast,
        2. Market Estimates & Forecast, By Region, 2023-2032
    17. Global Volt/Var
    18. Market, By Component
      1. Introduction
      2. Hardware
        1. Market Estimates & Forecast,
        2. Market Estimates & Forecast, By Region, 2023-2032
        3. Capacitor
    19. Banks
      1. Market Estimates & Forecast, 2023-2032
        1. Market Estimates &
    20. Forecast, By Region, 2023-2032
      1. Voltage Regulators
        1. Market Estimates &
    21. Forecast, 2023-2032
      1. Market Estimates & Forecast, By Region, 2023-2032
    22. Smart Sensors
      1. Market Estimates & Forecast, 2023-2032
    23. Market Estimates & Forecast, By Region, 2023-2032
      1. Others
        1. Market
    24. Estimates & Forecast, 2023-2032
      1. Market Estimates & Forecast,
    25. By Region, 2023-2032
      1. Software & Services
        1. Market Estimates & Forecast,
        2. Market Estimates & Forecast, By Region, 2023-2032
    26. Global Volt/Var
    27. Market, By End-Use
      1. Introduction
      2. Utilities
        1. Market Estimates & Forecast,
        2. Market Estimates & Forecast, By Region, 2023-2032
      3. Industrial
    28. Market Estimates & Forecast, 2023-2032
      1. Market Estimates & Forecast,
    29. By Region, 2023-2032
    30. Global Volt/Var Market, By Region
      1. Introduction
      2. North
    31. America
      1. Market Estimates & Forecast, By Application, 2023-2032
    32. Market Estimates & Forecast, By Component, 2023-2032
      1. Market Estimates & Forecast,
    33. By End-Use, 2023-2032
      1. Market Estimates & Forecast, By Country, 2023-2032
    34. US
      1. Market Estimates & Forecast, By Application, 2023-2032
    35. Market Estimates & Forecast, By Component, 2023-2032
      1. Market Estimates &
    36. Forecast, By End-Use, 2023-2032
      1. Canada
        1. Market Estimates &
    37. Forecast, By Application, 2023-2032
      1. Market Estimates & Forecast,
    38. By Component, 2023-2032
      1. Market Estimates & Forecast, By End-Use,
        1. Mexico
    39. Market Estimates & Forecast, By Component, 2023-2032
      1. Market Estimates &
    40. Forecast, By End-Use, 2023-2032
      1. Europe
        1. Market Estimates & Forecast,
    41. By Application, 2023-2032
      1. Market Estimates & Forecast, By Component,
        1. Market Estimates & Forecast, By End-Use, 2023-2032
    42. Market Estimates & Forecast, By Country, 2023-2032
      1. Germany
        1. Market
    43. Estimates & Forecast, By Application, 2023-2032
      1. Market Estimates &
    44. Forecast, By Component, 2023-2032
      1. Market Estimates & Forecast, By End-Use,
        1. UK
    45. Market Estimates & Forecast, By Component, 2023-2032
      1. Market Estimates &
    46. Forecast, By End-Use, 2023-2032
      1. Italy
        1. Market Estimates &
    47. Forecast, By Application, 2023-2032
      1. Market Estimates & Forecast,
    48. By Component, 2023-2032
      1. Market Estimates & Forecast, By End-Use,
        1. France
    49. Market Estimates & Forecast, By Component, 2023-2032
      1. Market Estimates &
    50. Forecast, By End-Use, 2023-2032
      1. Spain
        1. Market Estimates &
    51. Forecast, By Application, 2023-2032
      1. Market Estimates & Forecast,
    52. By Component, 2023-2032
      1. Market Estimates & Forecast, By End-Use,
        1. Rest of Europe
    53. Market Estimates & Forecast, By End-Use, 2023-2032
      1. Asia-Pacific
        1. Market
    54. Estimates & Forecast, By Application, 2023-2032
      1. Market Estimates & Forecast,
    55. By Component, 2023-2032
      1. Market Estimates & Forecast, By End-Use,
        1. Market Estimates & Forecast, By Country, 2023-2032
    56. China
      1. Market Estimates & Forecast, By Application, 2023-2032
    57. Market Estimates & Forecast, By Component, 2023-2032
      1. Market Estimates &
    58. Forecast, By End-Use, 2023-2032
      1. Australia
        1. Market Estimates &
    59. Forecast, By Application, 2023-2032
      1. Market Estimates & Forecast,
    60. By Component, 2023-2032
      1. Market Estimates & Forecast, By End-Use,
        1. South Korea
    61. Market Estimates & Forecast, By End-Use, 2023-2032
      1. Japan
        1. Market
    62. Estimates & Forecast, By Application, 2023-2032
      1. Market Estimates &
    63. Forecast, By Component, 2023-2032
      1. Market Estimates & Forecast, By End-Use,
        1. India
    64. Market Estimates & Forecast, By Component, 2023-2032
      1. Market Estimates &
    65. Forecast, By End-Use, 2023-2032
      1. Indonesia
        1. Market Estimates &
    66. Forecast, By Application, 2023-2032
      1. Market Estimates & Forecast,
    67. By Component, 2023-2032
      1. Market Estimates & Forecast, By End-Use,
        1. Rest of Asia-Pacific
    68. By Application, 2023-2032
      1. Market Estimates & Forecast, By Component,
        1. Market Estimates & Forecast, By End-Use, 2023-2032
    69. Middle East & Africa
      1. Market Estimates & Forecast, By Application,
        1. Market Estimates & Forecast, By Component, 2023-2032
    70. Market Estimates & Forecast, By End-Use, 2023-2032
      1. Market Estimates & Forecast,
    71. By Country, 2023-2032
      1. Saudi Arabia
        1. Market Estimates & Forecast,
    72. By Application, 2023-2032
      1. Market Estimates & Forecast, By Component,
        1. Market Estimates & Forecast, By End-Use, 2023-2032
    73. UAE
      1. Market Estimates & Forecast, By Application, 2023-2032
    74. Market Estimates & Forecast, By Component, 2023-2032
      1. Market Estimates &
    75. Forecast, By End-Use, 2023-2032
      1. South Africa
        1. Market Estimates &
    76. Forecast, By Application, 2023-2032
      1. Market Estimates & Forecast,
    77. By Component, 2023-2032
      1. Market Estimates & Forecast, By End-Use,
        1. Kuwait
    78. Market Estimates & Forecast, By Component, 2023-2032
      1. Market Estimates &
    79. Forecast, By End-Use, 2023-2032
      1. Rest of Middle East & Africa
    80. Market Estimates & Forecast, By Application, 2023-2032
      1. Market Estimates &
    81. Forecast, By Component, 2023-2032
      1. Market Estimates & Forecast, By End-Use,
      2. South America
        1. Market Estimates & Forecast, By Application,
        2. Market Estimates & Forecast, By Component, 2023-2032
    82. Market Estimates & Forecast, By End-Use, 2023-2032
      1. Market Estimates & Forecast,
    83. By Country, 2023-2032
      1. Brazil
        1. Market Estimates & Forecast, By Application,
    84. Market Estimates & Forecast, By End-Use, 2023-2032
      1. Argentina
        1. Market
    85. Estimates & Forecast, By Application, 2023-2032
      1. Market Estimates &
    86. Forecast, By Component, 2023-2032
      1. Market Estimates & Forecast, By End-Use,
        1. Rest of South America
    87. By Application, 2023-2032
      1. Market Estimates & Forecast, By Component,
        1. Market Estimates & Forecast, By End-Use, 2023-2032
    88. Competitive Landscape
      1. Competitive Scenario
      2. Competitive Benchmarking
    89. of the Global Volt/Var Market
      1. Major Growth Strategy in the Global Volt/Var
    90. Market
      1. Market Share Analysis: Global Volt/Var Market
      2. ABB: The Leading Player in
    91. terms of Number of Developments in Global Volt/Var Market
      1. New Product development in
    92. Volt/Var Market
      1. Mergers & acquisitions in Volt/Var Market
    93. Contracts & agreements in Volt/Var Market
      1. Expansions & investments
    94. in Volt/Var Market
    95. Company Profile
      1. ABB
        1. Company Overview
    96. Product/Services Offering
      1. Financial Overview
        1. Key Developments
    97. Strategy
      1. SWOT Analysis
      2. S&C Electric Company
        1. Company
    98. Overview
      1. Product /Services Offering
        1. Financial Overview
    99. Key Developments
      1. Strategy
        1. SWOT Analysis
      2. DC Systems
    100. Company Overview
      1. Product /Services Offering
        1. Financial Overview
    101. Key Developments
      1. Strategy
        1. SWOT Analysis
      2. Beckwith
    102. Electric
      1. Company Overview
        1. Product /Services Offering
        2. Financial
    103. Overview
      1. Key Developments
        1. Strategy
        2. SWOT Analysis
    104. Utilidata
      1. Company Overview
        1. Product /Services Offering
        2. Financial
    105. Overview
      1. Key Developments
        1. Strategy
        2. SWOT Analysis
    106. Open Systems International
      1. Company Overview
        1. Product /Services Offering
    107. Financial Overview
      1. Key Developments
        1. Strategy
        2. SWOT
    108. Analysis
      1. Landis+Gyr
        1. Company Overview
        2. Product /Services Offering
    109. Financial Overview
      1. Key Developments
        1. Strategy
        2. SWOT
    110. Analysis
      1. Advanced Control Systems
        1. Company Overview
        2. Product
    111. /Services Offering
      1. Financial Overview
        1. Key Developments
    112. Strategy
      1. SWOT Analysis
      2. Siemens
        1. Company Overview
    113. Product /Services Offering
      1. Financial Overview
        1. Key Developments
    114. Strategy
      1. SWOT Analysis
      2. Schneider Electric
        1. Company Overview
    115. Product /Services Offering
      1. Financial Overview
        1. Key Developments
    116. Strategy
      1. SWOT Analysis
      2. GE
        1. Company Overview
        2. Product
    117. /Services Offering
      1. Financial Overview
        1. Key Developments
    118. Strategy
      1. SWOT Analysis
      2. Eaton
        1. Company Overview
    119. Product /Services Offering
      1. Financial Overview
        1. Key Developments
    120. Strategy
      1. SWOT Analysis
      2. VArentec
        1. Company Overview
    121. Product /Services Offering
      1. Financial Overview
        1. Key Developments
    122. Strategy
      1. SWOT Analysis
    123. BY REGION, 2023-2032 (USD MILLION)
    124. BY COUNTRY, 2023-2032 (USD MILLION)
    125. 2032 (USD MILLION)
    126. 2032 (USD MILLION)
    127. BY REGION, 2023-2032 (USD MILLION)
    128. BY REGION, 2023-2032 (USD MILLION)
    129. 2032 (USD MILLION)
    130. 2032 (USD MILLION)
    131. 2032 (USD MILLION)
    132. 2032 (USD MILLION)
    133. BY APPLICATION, 2023-2032 (USD MILLION)
    134. BY APPLICATION, 2023-2032 (USD MILLION)
    135. 2032 (USD MILLION)
    136. 2032 (USD MILLION)
    137. (USD MILLION)
    138. (USD MILLION)
    139. 2032 (USD MILLION)
    140. 2032 (USD MILLION)
    141. (USD MILLION)
    142. (USD MILLION)
    143. MILLION)
    144. MIDDLE EAST & AFRICA VOLT/VAR MARKET, BY END-USE, 2023-2032 (USD MILLION)
    145. SOUTH AMERICA VOLT/VAR MARKET, BY END-USE, 2023-2032 (USD MILLION)
    146. GLOBAL VOLT/VAR MARKET: BY REGION, 2023-2032 (USD MILLION)
    147. AMERICA VOLT/VAR MARKET, BY COUNTRY, 2023-2032 (USD MILLION)
    148. MARKET, BY APPLICATION, 2023-2032 (USD MILLION)
    149. MARKET, BY COMPONENT, 2023-2032 (USD MILLION)
    150. MARKET, BY END-USE, 2023-2032 (USD MILLION)
    151. APPLICATION, 2023-2032 (USD MILLION)
    152. 2032 (USD MILLION)
    153. (USD MILLION)
    154. MILLION)
    155. CANADA VOLT/VAR MARKET, BY END-USE, 2023-2032 (USD MILLION)
    156. VOLT/VAR MARKET, BY APPLICATION, 2023-2032 (USD MILLION)
    157. BY COMPONENT, 2023-2032 (USD MILLION)
    158. 2032 (USD MILLION)
    159. (USD MILLION)
    160. MILLION)
    161. EUROPE VOLT/VAR MARKET, BY END-USE, 2023-2032 (USD MILLION)
    162. VOLT/VAR MARKET, BY APPLICATION, 2023-2032 (USD MILLION)
    163. BY COMPONENT, 2023-2032 (USD MILLION)
    164. END-USE, 2023-2032 (USD MILLION)
    165. (USD MILLION)
    166. UK VOLT/VAR MARKET, BY END-USE, 2023-2032 (USD MILLION)
    167. BY APPLICATION, 2023-2032 (USD MILLION)
    168. 2032 (USD MILLION)
    169. (USD MILLION)
    170. MILLION)
    171. FRANCE VOLT/VAR MARKET, BY END-USE, 2023-2032 (USD MILLION)
    172. VOLT/VAR MARKET, BY APPLICATION, 2023-2032 (USD MILLION)
    173. BY COMPONENT, 2023-2032 (USD MILLION)
    174. 2032 (USD MILLION)
    175. 2032 (USD MILLION)
    176. 2032 (USD MILLION)
    177. 2032 (USD MILLION)
    178. 2032 (USD MILLION)
    179. 2032 (USD MILLION)
    180. 2032 (USD MILLION)
    181. 2032 (USD MILLION)
    182. 2032 (USD MILLION)
    183. 2032 (USD MILLION)
    184. 2032 (USD MILLION)
    185. 2032 (USD MILLION)
    186. (USD MILLION)
    187. JAPAN VOLT/VAR MARKET, BY APPLICATION, 2023-2032 (USD MILLION)
    188. VOLT/VAR MARKET, BY COMPONENT, 2023-2032 (USD MILLION)
    189. BY END-USE, 2023-2032 (USD MILLION)
    190. APPLICATION, 2023-2032 (USD MILLION)
    191. COMPONENT, 2023-2032 (USD MILLION)
    192. END-USE, 2023-2032 (USD MILLION)
    193. 2032 (USD MILLION)
    194. (USD MILLION)
    195. INDONESIA VOLT/VAR MARKET, BY APPLICATION, 2023-2032 (USD MILLION)
    196. INDONESIA VOLT/VAR MARKET, BY COMPONENT, 2023-2032 (USD MILLION)
    197. VOLT/VAR MARKET, BY END-USE, 2023-2032 (USD MILLION)
    198. VOLT/VAR MARKET, BY APPLICATION, 2023-2032 (USD MILLION)
    199. VOLT/VAR MARKET, BY COMPONENT, 2023-2032 (USD MILLION)
    200. VOLT/VAR MARKET, BY END-USE, 2023-2032 (USD MILLION)
    201. VOLT/VAR MARKET, BY COUNTRY, 2023-2032 (USD MILLION)
    202. VOLT/VAR MARKET, BY APPLICATION, 2023-2032 (USD MILLION)
    203. VOLT/VAR MARKET, BY COMPONENT, 2023-2032 (USD MILLION)
    204. VOLT/VAR MARKET, BY END-USE, 2023-2032 (USD MILLION)
    205. MARKET, BY APPLICATION, 2023-2032 (USD MILLION)
    206. MARKET, BY COMPONENT, 2023-2032 (USD MILLION)
    207. MARKET, BY END-USE, 2023-2032 (USD MILLION)
    208. BY APPLICATION, 2023-2032 (USD MILLION)
    209. 2032 (USD MILLION)
    210. (USD MILLION)
    211. (USD MILLION)
    212. (USD MILLION)
    213. (USD MILLION)
    214. MILLION)
    215. KUWAIT VOLT/VAR MARKET, BY END-USE, 2023-2032 (USD MILLION)
    216. REST OF MIDDLE EAST & AFRICA VOLT/VAR MARKET, BY APPLICATION, 2023-2032 (USD
    217. MILLION)
    218. 2032 (USD MILLION)
    219. MARKET, BY END-USE, 2023-2032 (USD MILLION)
    220. MARKET, BY COUNTRY, 2023-2032 (USD MILLION)
    221. MARKET, BY APPLICATION, 2023-2032 (USD MILLION)
    222. MARKET, BY COMPONENT, 2023-2032 (USD MILLION)
    223. MARKET, BY END-USE, 2023-2032 (USD MILLION)
    224. BY APPLICATION, 2023-2032 (USD MILLION)
    225. COMPONENT, 2023-2032 (USD MILLION)
    226. END-USE, 2023-2032 (USD MILLION)
    227. 2032 (USD MILLION)
    228. 2032 (USD MILLION)
    229. 2032 (USD MILLION)
    230. BY APPLICATION, 2023-2032 (USD MILLION)
    231. MARKET, BY COMPONENT, 2023-2032 (USD MILLION)
    232. VOLT/VAR MARKET, BY END-USE, 2023-2032 (USD MILLION)
    233. PROCESS OF MRFR
    234. DYNAMICS
    235. RESTRAINTS
    236. GLOBAL VOLT/VAR MARKET SHARE, BY APPLICATION, 2023 (%)
    237. BY APPLICATION, 2023-2032 (USD MILLION)
    238. BY COMPONENT, 2023 (%)
    239. MILLION)
    240. GLOBAL VOLT/VAR MARKET, BY END-USE, 2023-2032 (USD MILLION)
    241. GLOBAL VOLT/VAR MARKET SHARE (%), BY REGION, 2023
    242. BY REGION, 2023-2032 (USD MILLION)
    243. SHARE (%), 2023
    244. (USD MILLION)
    245. EUROPE VOLT/VAR MARKET, BY COUNTRY, 2023-2032 (USD MILLION)
    246. MARKET SHARE (%), 2023
    247. (USD MILLION)
    248. (USD MILLION)
    249. SOUTH AMERICA VOLT/VAR MARKET, BY REGION, 2023-2032 (USD MILLION)'

    Volt/VAR Management Market Segmentation

    Volt/VAR Management Component Outlook (USD Billion, 2018-2032)

    • Distribution
    • Transmission

    Volt/VAR Management Component Outlook (USD Billion, 2018-2032)

    • Hardware
    • Software
    • Services

    Volt/VAR Management End Use Outlook (USD Billion, 2018-2032)

    • Utilities
    • Industrial

    Volt/VAR Management Regional Outlook (USD Billion, 2018-2032)

    • North America Outlook (USD Billion, 2018-2032)

      • North America Volt/VAR Management by Component
        • Distribution
        • Transmission
      • North America Volt/VAR Management by Component
        • Hardware
        • Software
        • Services
      • North America Volt/VAR Management by End Use
        • Utilities
        • Industrial
      • US Outlook (USD Billion, 2018-2032)

      • US Volt/VAR Management by Component
        • Distribution
        • Transmission
      • US Volt/VAR Management by Component
        • Hardware
        • Software
        • Services
      • US Volt/VAR Management by End Use
        • Utilities
        • Industrial
      • CANADA Outlook (USD Billion, 2018-2032)

      • CANADA Volt/VAR Management by Component
        • Distribution
        • Transmission
      • CANADA Volt/VAR Management by Component
        • Hardware
        • Software
        • Services
      • CANADA Volt/VAR Management by End Use
        • Utilities
        • Industrial
    • Europe Outlook (USD Billion, 2018-2032)

      • Europe Volt/VAR Management by Component
        • Distribution
        • Transmission
      • Europe Volt/VAR Management by Component
        • Hardware
        • Software
        • Services
      • Europe Volt/VAR Management by End Use
        • Utilities
        • Industrial
      • Germany Outlook (USD Billion, 2018-2032)

      • Germany Volt/VAR Management by Component

        • Distribution
        • Transmission
      • Germany Volt/VAR Management by Component
        • Hardware
        • Software
        • Services
      • Germany Volt/VAR Management by End Use
        • Utilities
        • Industrial
      • France Outlook (USD Billion, 2018-2032)

      • France Volt/VAR Management by Component
        • Distribution
        • Transmission
      • France Volt/VAR Management by Component
        • Hardware
        • Software
        • Services
      • France Volt/VAR Management by End Use
        • Utilities
        • Industrial
      • UK Outlook (USD Billion, 2018-2032)

      • UK Volt/VAR Management by Component

        • Distribution
        • Transmission
      • UK Volt/VAR Management by Component
        • Hardware
        • Software
        • Services
      • UK Volt/VAR Management by End Use
        • Utilities
        • Industrial
      • ITALY Outlook (USD Billion, 2018-2032)

      • ITALY Volt/VAR Management by Component

        • Distribution
        • Transmission
      • ITALY Volt/VAR Management by Component
        • Hardware
        • Software
        • Services
      • ITALY Volt/VAR Management by End Use
        • Utilities
        • Industrial
      • SPAIN Outlook (USD Billion, 2018-2032)

      • SPAIN Volt/VAR Management by Component

        • Distribution
        • Transmission
      • Spain Volt/VAR Management by Component
        • Hardware
        • Software
        • Services
      • Spain Volt/VAR Management by End Use
        • Utilities
        • Industrial
      • Rest Of Europe Outlook (USD Billion, 2018-2032)

      • Rest Of Europe Volt/VAR Management by Component

        • Distribution
        • Transmission
      • Rest Of Europe Volt/VAR Management by Component
        • Hardware
        • Software
        • Services
      • REST OF EUROPE Volt/VAR Management by End Use
        • Utilities
        • Industrial
    • Asia-Pacific Outlook (USD Billion, 2018-2032)

      • Asia-Pacific Volt/VAR Management by Component
        • Distribution
        • Transmission
      • Asia-Pacific Volt/VAR Management by Component
        • Hardware
        • Software
        • Services
      • Asia-Pacific Volt/VAR Management by End Use
        • Utilities
        • Industrial
      • China Outlook (USD Billion, 2018-2032)

      • China Volt/VAR Management by Component

        • Distribution
        • Transmission
      • China Volt/VAR Management by Component
        • Hardware
        • Software
        • Services
      • China Volt/VAR Management by End Use
        • Utilities
        • Industrial
      • Japan Outlook (USD Billion, 2018-2032)

      • Japan Volt/VAR Management by Component

        • Distribution
        • Transmission
      • Japan Volt/VAR Management by Component
        • Hardware
        • Software
        • Services
      • Japan Volt/VAR Management by End Use
        • Utilities
        • Industrial
      • India Outlook (USD Billion, 2018-2032)

      • India Volt/VAR Management by Component

        • Distribution
        • Transmission
      • India Volt/VAR Management by Component
        • Hardware
        • Software
        • Services
      • India Volt/VAR Management by End Use
        • Utilities
        • Industrial
      • Australia Outlook (USD Billion, 2018-2032)

      • Australia Volt/VAR Management by Component

        • Distribution
        • Transmission
      • Australia Volt/VAR Management by Component
        • Hardware
        • Software
        • Services
      • Australia Volt/VAR Management by End Use
        • Utilities
        • Industrial
      • Rest of Asia-Pacific Outlook (USD Billion, 2018-2032)

      • Rest of Asia-Pacific Volt/VAR Management by Component

        • Distribution
        • Transmission
      • Rest of Asia-Pacific Volt/VAR Management by Component
        • Hardware
        • Software
        • Services
      • Rest of Asia-Pacific Volt/VAR Management by End Use
        • Utilities
        • Industrial
    • Rest of the World Outlook (USD Billion, 2018-2032)

      • Rest of the World Volt/VAR Management by Component
        • Distribution
        • Transmission
      • Rest of the World Volt/VAR Management by Component
        • Hardware
        • Software
        • Services
      • Rest of the World Volt/VAR Management by End Use
        • Utilities
        • Industrial
      • Middle East Outlook (USD Billion, 2018-2032)

      • Middle East Volt/VAR Management by Component
        • Distribution
        • Transmission
      • Middle East Volt/VAR Management by Component
        • Hardware
        • Software
        • Services
      • Middle East Volt/VAR Management by End Use
        • Utilities
        • Industrial
      • Africa Outlook (USD Billion, 2018-2032)

      • Africa Volt/VAR Management by Component

        • Distribution
        • Transmission
      • Africa Volt/VAR Management by Component
        • Hardware
        • Software
        • Services
      • Africa Volt/VAR Management by End Use
        • Utilities
        • Industrial
      • Latin America Outlook (USD Billion, 2018-2032)

      • Latin America Volt/VAR Management by Component

        • Distribution
        • Transmission
      • Latin America Volt/VAR Management by Component
        • Hardware
        • Software
        • Services
      • Latin America Volt/VAR Management by End Use
        • Utilities
        • Industrial
    Volt/VAR Management Market Research Report- Forecast till 2032 Infographic
    Free Sample Request

    Kindly complete the form below to receive a free sample of this Report

    Customer Strories

    “I am very pleased with how market segments have been defined in a relevant way for my purposes (such as "Portable Freezers & refrigerators" and "last-mile"). In general the report is well structured. Thanks very much for your efforts.”

    Victoria Milne Founder
    Case Study

    Chemicals and Materials