• Cat-intel
  • MedIntelliX
  • Resources
  • About Us
  • Request Free Sample ×

    Kindly complete the form below to receive a free sample of this Report

    Leading companies partner with us for data-driven Insights

    clients tt-cursor

    Visual Communication Market

    ID: MRFR/SEM/32499-HCR
    100 Pages
    Aarti Dhapte
    September 2025

    Visual Communication Market Research Report By Technology (Digital Signage, Virtual Reality, Augmented Reality, Interactive Displays), By Application (Advertising, Education, Corporate Communication, Entertainment), By End Use (Retail, Healthcare, Transportation, Hospitality, Corporate), By Media Type (Image, Video, Animation, Text) and By Regional (North America, Europe, South America, Asia Pacific, Middle East and Africa) - Industry Forecast to 2034

    Share:
    Download PDF ×

    We do not share your information with anyone. However, we may send you emails based on your report interest from time to time. You may contact us at any time to opt-out.

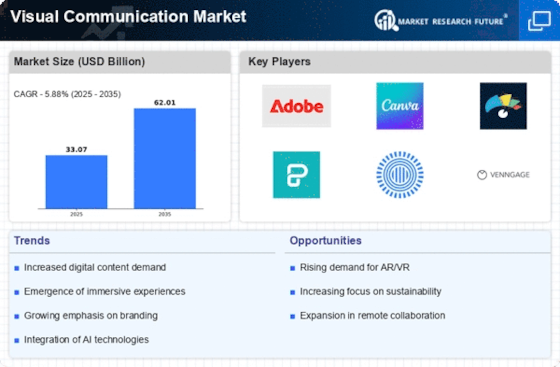
    Visual Communication Market Research Report Forecast Till 2034 Infographic
    Purchase Options
    $ 4,950.0
    $ 5,950.0
    $ 7,250.0
    Table of Contents

    Visual Communication Market Summary

    The Global Visual Communication Market is projected to grow significantly from 235.94 USD Billion in 2024 to 541.32 USD Billion by 2035.

    Key Market Trends & Highlights

    Visual Communication Key Trends and Highlights

    • The market is expected to experience a compound annual growth rate (CAGR) of 7.84 percent from 2025 to 2035.
    • By 2035, the market valuation is anticipated to reach 541.32 USD Billion, indicating robust growth potential.
    • In 2024, the market is valued at 235.94 USD Billion, reflecting a strong foundation for future expansion.
    • Growing adoption of digital signage due to increasing demand for effective marketing strategies is a major market driver.

    Market Size & Forecast

    2024 Market Size 235.94 (USD Billion)
    2035 Market Size 541.32 (USD Billion)
    CAGR (2025 - 2035) 7.84%

    Major Players

    Apple Inc (US), Microsoft Corp (US), Amazon.com Inc (US), Alphabet Inc (US), Berkshire Hathaway Inc (US), Tesla Inc (US), Meta Platforms Inc (US), Johnson & Johnson (US), Visa Inc (US), Procter & Gamble Co (US)

    Visual Communication Market Trends

    The Visual Communication Market is witnessing significant growth driven by several key market drivers. The increasing reliance on digital platforms for communication and advertising is one of the main factors fueling this demand.

    As businesses and consumers increasingly shift towards online interactions, effective visual communication tools have become essential. These tools help enhance brand visibility, attract target audiences, and convey messages more effectively.

    Additionally, the rise of social media as a primary communication channel is prompting companies to adopt innovative visual content strategies to engage users and create memorable experiences.

    There are numerous opportunities in the Visual Communication Market that businesses can explore. With advancements in technology, such as augmented reality and virtual reality, companies can create immersive experiences that drive customer engagement.

    The growing trend of remote work and virtual collaboration also presents a chance for the development of new visual communication tools tailored to online teamwork.

    Moreover, businesses can tap into the increasing demand for personalization by providing customized visual content that resonates with individual consumers, thus enhancing connection and brand loyalty. Recent trends in the industry show a heightened focus on mobile-friendly content as consumers increasingly access information via smartphones and tablets.

    This shift has resulted in the optimization of visual communications for smaller screens, enhancing the user experience. Additionally, there is a rising emphasis on sustainability and ethical design practices, prompting brands to adopt eco-friendly materials and promote sustainable messaging through their visual content.

    As societal values evolve, companies are incorporating these aspects into their visual communication strategies to align with consumer preferences. Overall, the dynamic landscape of the Visual Communication Market offers numerous avenues for growth and innovation, driven by technology and changing consumer behaviors.

    Source: Primary Research, Secondary Research, MRFR Database and Analyst Review

    The Global Visual Communication Market is poised for transformative growth as organizations increasingly recognize the power of visual media in enhancing engagement and conveying complex information effectively.

    U.S. Department of Commerce

    Visual Communication Market Drivers

    Technological Advancements

    The Global Visual Communication Market Industry is experiencing a surge due to rapid technological advancements. Innovations in augmented reality (AR), virtual reality (VR), and artificial intelligence (AI) are transforming how visual content is created and consumed. For instance, AR applications in marketing allow brands to engage customers interactively, enhancing user experience. As of 2024, the market is valued at approximately 235.94 USD Billion, indicating a robust demand for cutting-edge visual communication tools. This trend is expected to continue, with projections suggesting that the market could reach 541.32 USD Billion by 2035, reflecting a compound annual growth rate (CAGR) of 7.84% from 2025 to 2035.

    Market Segment Insights

    Visual Communication Market Technology Insights

    The Visual Communication Market is experiencing a notable transformation driven by advancements in technology. Within this domain, several key segments are shaping the market landscape, including Digital Signage, Virtual Reality, Augmented Reality, and Interactive Displays.

    Digital Signage stood out with a significant market value of 10.5 USD billion in 2023, demonstrating its majority holding and effectiveness in delivering engaging content in various environments, such as retail and public spaces. This segment has become indispensable for businesses looking to attract and communicate with their audiences dynamically.

    Virtual Reality, valued at 7.5 USD billion in 2023, is also gaining traction, offering immersive experiences for training, entertainment, and education, which further emphasizes its importance in redefining user engagement.

    Augmented Reality represented another interesting area within the market, valued at 5.0 USD billion in 2023, which enhances real-world interactions and brings a layer of digital information into the physical environment, making it valuable for industries like marketing and gaming.

    Lastly, Interactive Displays, which held a market value of 6.5 USD billion in 2023, cater to the increasing demand for interactive user experiences across different sectors, including education and corporate environments.

    Visual Communication Market Application Insights

    Among these applications, Advertising plays a crucial role due to its ability to capture audience attention through compelling visual content, driving market growth. Education also emerged as a prominent area where visual aids enhance learning experiences and retention, fundamentally transforming traditional methods into more engaging formats.

    Corporate Communication relies heavily on visual elements to convey corporate messages and branding, establishing a clear connection with stakeholders. Meanwhile, the Entertainment sector adopts innovative visual techniques to enhance user experiences, creating immersive content that captivates audiences.

    Get more detailed insights about Visual Communication Market Research Report Forecast Till 2034

    Regional Insights

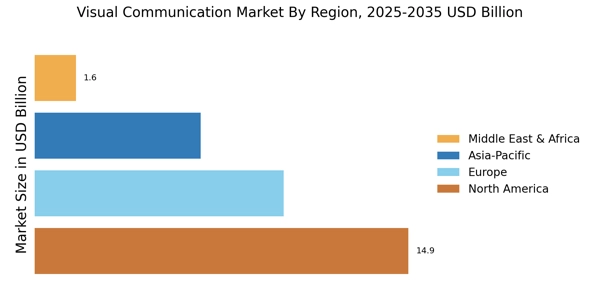
    North America led with a majority holding, contributing 11.75 USD billion currently, and projected to rise to 19.21 USD billion by 2032, driven by advanced technology adoption and a strong business environment. Europe followed as a significant contributor, currently valued at 8.1 USD billion and expected to reach 12.94 USD billion, benefiting from a robust advertising industry and digital marketing trends.

    The APAC region, valued at 6.45 USD billion in 2023, is also a growing market, forecasted to grow to 10.65 USD billion, propelled by rapid urbanization and a burgeoning middle class.

    South America and MEA, though smaller in comparison, are witnessing growth opportunities, with South America at 1.95 USD billion and MEA at 1.25 USD billion, signaling potential in expanding digital communication strategies in these regions.

    This diverse regional segmentation of the Visual Communication Market highlights varying growth drivers and trends, illustrating a dynamic landscape ripe for investment and innovation.

    Visual Communication Market Regional Insights

    Source: Primary Research, Secondary Research, MRFR Database and Analyst Review

    Key Players and Competitive Insights

    The Visual Communication Market is a dynamic and rapidly evolving sector characterized by the increasing integration of technology into communication strategies across various industries. This market encompasses a broad range of solutions and applications, such as digital signage, interactive display systems, video conferencing tools, and visual collaboration platforms.

    As businesses strive to enhance user engagement, streamline communication, and improve customer experiences, the demand for innovative visual communication solutions has surged. Competitive insights within this arena reveal a landscape populated by prominent players who leverage advanced technologies, unique selling propositions, and strategic partnerships to carve out significant market positions.

    The ongoing innovation and adoption of cloud-based solutions further underline the competitive nature of this market, pushing companies to continually develop and optimize their offerings. Oracle stands as a formidable entity within the Visual Communication Market, leveraging its robust technological foundation and extensive industry experience.

    The company's strengths lie in its comprehensive suite of cloud-based and on-premise solutions designed for visual communication and collaboration. Oracle offers a range of applications that integrate seamlessly with existing enterprise systems, thus enhancing organizational efficiency.

    Its strong emphasis on data security and privacy, coupled with innovative analytics capabilities, empowers businesses to make informed decisions and adapt quickly to changing market dynamics.

    The company's established reputation for providing high-performance infrastructure and robust integration capabilities further solidifies its position in the visual communication landscape, enabling clients to achieve cohesive branding and messaging through advanced visual solutions.

    Cisco Systems maintains a steady presence in the Visual Communication Market, recognized for its commitment to enhancing communication and collaboration through cutting-edge technology solutions.

    The company excels in providing comprehensive video conferencing and collaboration tools that cater to the needs of various sectors, including education, healthcare, and corporate environments. Cisco's strengths include its user-friendly interface, reliability, and ability to support large-scale deployment, ensuring high-quality communication experiences regardless of the number of users.

    Furthermore, Cisco's integration of artificial intelligence and machine learning into its visual communication products positions it as a leader in innovation, helping businesses enhance engagement and productivity.

    The company's extensive portfolio, including tools for virtual events and webinars, enables organizations to communicate effectively and maintain strong connections with their audiences, thereby reinforcing its competitive advantage in the market.

    Key Companies in the Visual Communication Market market include

    Industry Developments

    The Visual Communication Market is witnessing significant advancements, particularly with companies like Microsoft and Cisco Systems enhancing their collaboration tools to support remote work and virtual events amid ongoing shifts in workplace dynamics.

    Oracle has been investing in AI-driven solutions to improve user engagement, while Slack Technologies continues to expand its real-time communication capabilities, aiming to bolster teamwork efficiency. Adobe has introduced innovative features in its Creative Cloud to promote seamless content creation and sharing, closely followed by NVIDIA's advancements in visual computing technologies.

    In terms of mergers and acquisitions, recent activities include Microsoft's acquisition of Nuance Communications, aiming to augment its cloud and AI capabilities in visual communication applications. Similarly, Cisco has been active in exploring partnerships to enrich its Webex platform.

    Meanwhile, Zoom Video Communications has been expanding its ecosystem through strategic collaborations, enhancing its offerings in the visual communication landscape.

    Growth across these companies is contributing to a robust valuation in the market, driving competition and innovation as these entities adapt to evolving consumer demands for effective remote connectivity and visual collaboration tools.

    Future Outlook

    Visual Communication Market Future Outlook

    The Global Visual Communication Market is projected to grow at a 7.84% CAGR from 2024 to 2035, driven by technological advancements, increasing digital content consumption, and the demand for enhanced customer engagement.

    New opportunities lie in:

    • Invest in AI-driven design tools to streamline content creation processes.
    • Develop immersive AR/VR experiences for enhanced user engagement in marketing campaigns.
    • Leverage data analytics to personalize visual content for targeted audiences.

    By 2035, the market is expected to reach a robust position, reflecting substantial growth and innovation.

    Market Segmentation

    Visual Communication Market End Use Outlook

    • Retail
    • Healthcare
    • Transportation
    • Hospitality
    • Corporate

    Visual Communication Market Regional Outlook

    • North America
    • Europe
    • South America
    • Asia Pacific
    • Middle East and Africa

    Visual Communication Market Media Type Outlook

    • Image
    • Video
    • Animation
    • Text

    Visual Communication Market Technology Outlook

    • Digital Signage
    • Virtual Reality
    • Augmented Reality
    • Interactive Displays

    Visual Communication Market Application Outlook

    • Advertising
    • Education
    • Corporate Communication
    • Entertainment

    Report Scope

    Report Attribute/Metric Details
    Market Size 2024 USD 33.71 Billion
    Market Size 2025 USD 35.16 Billion
    Market Size 2034 USD 58.56 Billion
    Compound Annual Growth Rate (CAGR) 5.88% (2025-2034)
    Base Year 2024
    Market Forecast Period 2025-2034
    Historical Data 2020-2023
    Market Forecast Units USD billion
    Key Companies Profiled Oracle, Cisco Systems, Slack Technologies, SAP, Microsoft, Apple, IBM, Sony, Salesforce, Adobe, NVIDIA, Zoom Video Communications, Panasonic, LG Electronics, Google
    Segments Covered Technology, Application, End Use, Media Type, Regional
    Key Market Opportunities Augmented Reality Applications, Remote Collaboration Tools, Interactive Digital Signage, E-learning Visual Solutions, Enhanced Branding through Visuals
    Key Market Dynamics technological advancements, increasing demand for remote communication, integration of AR/VR solutions, growing importance of visual branding, expansion of digital signage solutions
    Countries Covered North America, Europe, APAC, South America, MEA

    Market Highlights

    Author
    Aarti Dhapte
    Team Lead - Research

    She holds an experience of about 6+ years in Market Research and Business Consulting, working under the spectrum of Information Communication Technology, Telecommunications and Semiconductor domains. Aarti conceptualizes and implements a scalable business strategy and provides strategic leadership to the clients. Her expertise lies in market estimation, competitive intelligence, pipeline analysis, customer assessment, etc.

    Leave a Comment

    FAQs

    What is the expected market size of the Visual Communication Market in 2032?

    The Visual Communication Market is expected to be valued at 58.56 USD billion in 2034.

    What is the projected CAGR for the Visual Communication Market between 2024 to 2032?

    The expected CAGR for the Visual Communication Market from 2025 to 2034 is 5.88%.

    Which region is projected to have the largest market share in 2032?

    North America is projected to have the largest market share with a value of 19.21 USD billion in 2032.

    What is the market size for Digital Signage in 2032?

    The market size for Digital Signage is expected to reach 16.5 USD billion by 2032.

    How much was the Augmented Reality segment valued in 2023?

    The Augmented Reality segment was valued at 5.0 USD billion in 2023.

    What is the expected market size for Interactive Displays in 2032?

    The expected market size for Interactive Displays is projected to be 11.3 USD billion in 2032.

    What is the anticipated market value of the Virtual Reality segment in 2032?

    The anticipated market value of the Virtual Reality segment is 12.5 USD billion in 2032.

    Who are the key players in the Visual Communication Market?

    Key players in the Visual Communication Market include major companies like Oracle, Cisco Systems, and Microsoft.

    What was the market size of the APAC region in 2023?

    The market size of the APAC region was valued at 6.45 USD billion in 2023.

    How much is the South American market expected to grow by 2032?

    The South America market is expected to grow to 3.09 USD billion by 2032 from 1.95 USD billion in 2023.

    1. 'TABLE OF CONTENTS
    2. EXECUTIVE SUMMARY
      1. Market Overview
      2. Key Findings
      3. Market Segmentation
      4. Competitive Landscape
      5. Challenges and Opportunities
      6. Future Outlook
    3. MARKET INTRODUCTION
      1. Definition
      2. Scope of the study
        1. Research Objective
        2. Assumption
        3. Limitations
    4. RESEARCH METHODOLOGY
    5. Overview
      1. Data Mining
      2. Secondary Research
      3. Primary Research
        1. Primary Interviews and Information Gathering Process
        2. Breakdown
    6. of Primary Respondents
      1. Forecasting Model
      2. Market Size Estimation
        1. Bottom-Up Approach
        2. Top-Down Approach
      3. Data Triangulation
      4. Validation
    7. MARKET DYNAMICS
      1. Overview
      2. Drivers
      3. Restraints
      4. Opportunities
    8. MARKET FACTOR ANALYSIS
    9. Value chain Analysis
      1. Porter''s Five Forces Analysis
        1. Bargaining
    10. Power of Suppliers
      1. Bargaining Power of Buyers
        1. Threat of
    11. New Entrants
      1. Threat of Substitutes
        1. Intensity of Rivalry
      2. COVID-19 Impact Analysis
        1. Market Impact Analysis
        2. Regional
    12. Impact
      1. Opportunity and Threat Analysis
    13. VISUAL COMMUNICATION
    14. MARKET, BY TECHNOLOGY (USD BILLION)
      1. Digital Signage
      2. Virtual
    15. Reality
      1. Augmented Reality
      2. Interactive Displays
    16. VISUAL
    17. COMMUNICATION MARKET, BY APPLICATION (USD BILLION)
      1. Advertising
    18. Education
      1. Corporate Communication
      2. Entertainment
    19. VISUAL
    20. COMMUNICATION MARKET, BY END USE (USD BILLION)
      1. Retail
      2. Healthcare
      3. Transportation
      4. Hospitality
      5. Corporate
    21. VISUAL COMMUNICATION
    22. MARKET, BY MEDIA TYPE (USD BILLION)
      1. Image
      2. Video
      3. Animation
      4. Text
    23. VISUAL COMMUNICATION MARKET, BY REGIONAL (USD BILLION)
    24. North America
      1. US
        1. Canada
      2. Europe
    25. Germany
      1. UK
        1. France
        2. Russia
        3. Italy
        4. Spain
        5. Rest of Europe
      2. APAC
        1. China
        2. India
        3. Japan
        4. South Korea
        5. Malaysia
        6. Thailand
        7. Indonesia
        8. Rest of APAC
      3. South
    26. America
      1. Brazil
        1. Mexico
        2. Argentina
    27. Rest of South America
      1. MEA
        1. GCC Countries
        2. South
    28. Africa
      1. Rest of MEA
    29. COMPETITIVE LANDSCAPE
      1. Overview
      2. Competitive Analysis
      3. Market share Analysis
      4. Major Growth
    30. Strategy in the Visual Communication Market
      1. Competitive Benchmarking
      2. Leading Players in Terms of Number of Developments in the Visual Communication
    31. Market
      1. Key developments and growth strategies
        1. New Product
    32. Launch/Service Deployment
      1. Merger & Acquisitions
        1. Joint
    33. Ventures
      1. Major Players Financial Matrix
        1. Sales and Operating
    34. Income
      1. Major Players R&D Expenditure. 2023
    35. COMPANY PROFILES
      1. Oracle
        1. Financial Overview
        2. Products Offered
        3. Key Developments
        4. SWOT Analysis
        5. Key Strategies
      2. Cisco Systems
        1. Financial Overview
        2. Products Offered
        3. Key Developments
        4. SWOT Analysis
        5. Key Strategies
      3. Slack Technologies
        1. Financial Overview
        2. Products
    36. Offered
      1. Key Developments
        1. SWOT Analysis
        2. Key
    37. Strategies
      1. SAP
        1. Financial Overview
        2. Products
    38. Offered
      1. Key Developments
        1. SWOT Analysis
        2. Key
    39. Strategies
      1. Microsoft
        1. Financial Overview
        2. Products
    40. Offered
      1. Key Developments
        1. SWOT Analysis
        2. Key
    41. Strategies
      1. Apple
        1. Financial Overview
        2. Products
    42. Offered
      1. Key Developments
        1. SWOT Analysis
        2. Key
    43. Strategies
      1. IBM
        1. Financial Overview
        2. Products
    44. Offered
      1. Key Developments
        1. SWOT Analysis
        2. Key
    45. Strategies
      1. Sony
        1. Financial Overview
        2. Products
    46. Offered
      1. Key Developments
        1. SWOT Analysis
        2. Key
    47. Strategies
      1. Salesforce
        1. Financial Overview
        2. Products
    48. Offered
      1. Key Developments
        1. SWOT Analysis
        2. Key
    49. Strategies
      1. Adobe
        1. Financial Overview
        2. Products
    50. Offered
      1. Key Developments
        1. SWOT Analysis
    51. Key Strategies
      1. NVIDIA
        1. Financial Overview
    52. Products Offered
      1. Key Developments
        1. SWOT Analysis
    53. Key Strategies
      1. Zoom Video Communications
        1. Financial Overview
        2. Products Offered
        3. Key Developments
        4. SWOT Analysis
        5. Key Strategies
      2. Panasonic
        1. Financial Overview
        2. Products Offered
        3. Key Developments
        4. SWOT Analysis
        5. Key Strategies
      3. LG Electronics
        1. Financial Overview
        2. Products Offered
        3. Key Developments
        4. SWOT Analysis
        5. Key Strategies
      4. Google
        1. Financial Overview
        2. Products Offered
        3. Key Developments
        4. SWOT Analysis
        5. Key Strategies
    54. APPENDIX
      1. References
      2. Related
    55. Reports
    56. NORTH AMERICA VISUAL COMMUNICATION MARKET SIZE ESTIMATES & FORECAST, BY TECHNOLOGY,
    57. 2034 (USD BILLIONS)
    58. SIZE ESTIMATES & FORECAST, BY APPLICATION, 2020-2034 (USD BILLIONS)
    59. NORTH AMERICA VISUAL COMMUNICATION MARKET SIZE ESTIMATES & FORECAST, BY END
    60. USE, 2020-2034 (USD BILLIONS)
    61. SIZE ESTIMATES & FORECAST, BY MEDIA TYPE, 2020-2034 (USD BILLIONS)
    62. NORTH AMERICA VISUAL COMMUNICATION MARKET SIZE ESTIMATES & FORECAST, BY REGIONAL,
    63. 2034 (USD BILLIONS)
    64. & FORECAST, BY TECHNOLOGY, 2020-2034 (USD BILLIONS)
    65. COMMUNICATION MARKET SIZE ESTIMATES & FORECAST, BY APPLICATION, 2020-2034 (USD
    66. BILLIONS)
    67. BY END USE, 2020-2034 (USD BILLIONS)
    68. SIZE ESTIMATES & FORECAST, BY MEDIA TYPE, 2020-2034 (USD BILLIONS)
    69. US VISUAL COMMUNICATION MARKET SIZE ESTIMATES & FORECAST, BY REGIONAL, 2020-2034
    70. (USD BILLIONS)
    71. & FORECAST, BY TECHNOLOGY, 2020-2034 (USD BILLIONS)
    72. COMMUNICATION MARKET SIZE ESTIMATES & FORECAST, BY APPLICATION, 2020-2034 (USD
    73. BILLIONS)
    74. FORECAST, BY END USE, 2020-2034 (USD BILLIONS)
    75. MARKET SIZE ESTIMATES & FORECAST, BY MEDIA TYPE, 2020-2034 (USD BILLIONS)
    76. REGIONAL, 2020-2034 (USD BILLIONS)
    77. SIZE ESTIMATES & FORECAST, BY TECHNOLOGY, 2020-2034 (USD BILLIONS)
    78. EUROPE VISUAL COMMUNICATION MARKET SIZE ESTIMATES & FORECAST, BY APPLICATION,
    79. 2034 (USD BILLIONS)
    80. ESTIMATES & FORECAST, BY END USE, 2020-2034 (USD BILLIONS)
    81. VISUAL COMMUNICATION MARKET SIZE ESTIMATES & FORECAST, BY MEDIA TYPE, 2020-2034
    82. (USD BILLIONS)
    83. & FORECAST, BY REGIONAL, 2020-2034 (USD BILLIONS)
    84. COMMUNICATION MARKET SIZE ESTIMATES & FORECAST, BY TECHNOLOGY, 2020-2034 (USD
    85. BILLIONS)
    86. FORECAST, BY APPLICATION, 2020-2034 (USD BILLIONS)
    87. COMMUNICATION MARKET SIZE ESTIMATES & FORECAST, BY END USE, 2020-2034 (USD BILLIONS)
    88. MEDIA TYPE, 2020-2034 (USD BILLIONS)
    89. MARKET SIZE ESTIMATES & FORECAST, BY REGIONAL, 2020-2034 (USD BILLIONS)
    90. UK VISUAL COMMUNICATION MARKET SIZE ESTIMATES & FORECAST, BY TECHNOLOGY,
    91. 2034 (USD BILLIONS)
    92. & FORECAST, BY APPLICATION, 2020-2034 (USD BILLIONS)
    93. COMMUNICATION MARKET SIZE ESTIMATES & FORECAST, BY END USE, 2020-2034 (USD BILLIONS)
    94. TYPE, 2020-2034 (USD BILLIONS)
    95. ESTIMATES & FORECAST, BY REGIONAL, 2020-2034 (USD BILLIONS)
    96. VISUAL COMMUNICATION MARKET SIZE ESTIMATES & FORECAST, BY TECHNOLOGY, 2020-2034
    97. (USD BILLIONS)
    98. & FORECAST, BY APPLICATION, 2020-2034 (USD BILLIONS)
    99. COMMUNICATION MARKET SIZE ESTIMATES & FORECAST, BY END USE, 2020-2034 (USD BILLIONS)
    100. MEDIA TYPE, 2020-2034 (USD BILLIONS)
    101. MARKET SIZE ESTIMATES & FORECAST, BY REGIONAL, 2020-2034 (USD BILLIONS)
    102. RUSSIA VISUAL COMMUNICATION MARKET SIZE ESTIMATES & FORECAST, BY TECHNOLOGY,
    103. 2034 (USD BILLIONS)
    104. ESTIMATES & FORECAST, BY APPLICATION, 2020-2034 (USD BILLIONS)
    105. RUSSIA VISUAL COMMUNICATION MARKET SIZE ESTIMATES & FORECAST, BY END USE, 2020-2034
    106. (USD BILLIONS)
    107. & FORECAST, BY MEDIA TYPE, 2020-2034 (USD BILLIONS)
    108. COMMUNICATION MARKET SIZE ESTIMATES & FORECAST, BY REGIONAL, 2020-2034 (USD
    109. BILLIONS)
    110. FORECAST, BY TECHNOLOGY, 2020-2034 (USD BILLIONS)
    111. MARKET SIZE ESTIMATES & FORECAST, BY APPLICATION, 2020-2034 (USD BILLIONS)
    112. END USE, 2020-2034 (USD BILLIONS)
    113. SIZE ESTIMATES & FORECAST, BY MEDIA TYPE, 2020-2034 (USD BILLIONS)
    114. ITALY VISUAL COMMUNICATION MARKET SIZE ESTIMATES & FORECAST, BY REGIONAL,
    115. 2034 (USD BILLIONS)
    116. & FORECAST, BY TECHNOLOGY, 2020-2034 (USD BILLIONS)
    117. COMMUNICATION MARKET SIZE ESTIMATES & FORECAST, BY APPLICATION, 2020-2034 (USD
    118. BILLIONS)
    119. FORECAST, BY END USE, 2020-2034 (USD BILLIONS)
    120. MARKET SIZE ESTIMATES & FORECAST, BY MEDIA TYPE, 2020-2034 (USD BILLIONS)
    121. REGIONAL, 2020-2034 (USD BILLIONS)
    122. MARKET SIZE ESTIMATES & FORECAST, BY TECHNOLOGY, 2020-2034 (USD BILLIONS)
    123. BY APPLICATION, 2020-2034 (USD BILLIONS)
    124. MARKET SIZE ESTIMATES & FORECAST, BY END USE, 2020-2034 (USD BILLIONS)
    125. REST OF EUROPE VISUAL COMMUNICATION MARKET SIZE ESTIMATES & FORECAST, BY
    126. MEDIA TYPE, 2020-2034 (USD BILLIONS)
    127. MARKET SIZE ESTIMATES & FORECAST, BY REGIONAL, 2020-2034 (USD BILLIONS)
    128. APAC VISUAL COMMUNICATION MARKET SIZE ESTIMATES & FORECAST, BY TECHNOLOGY,
    129. 2034 (USD BILLIONS)
    130. & FORECAST, BY APPLICATION, 2020-2034 (USD BILLIONS)
    131. COMMUNICATION MARKET SIZE ESTIMATES & FORECAST, BY END USE, 2020-2034 (USD BILLIONS)
    132. TYPE, 2020-2034 (USD BILLIONS)
    133. ESTIMATES & FORECAST, BY REGIONAL, 2020-2034 (USD BILLIONS)
    134. VISUAL COMMUNICATION MARKET SIZE ESTIMATES & FORECAST, BY TECHNOLOGY, 2020-2034
    135. (USD BILLIONS)
    136. FORECAST, BY APPLICATION, 2020-2034 (USD BILLIONS)
    137. MARKET SIZE ESTIMATES & FORECAST, BY END USE, 2020-2034 (USD BILLIONS)
    138. CHINA VISUAL COMMUNICATION MARKET SIZE ESTIMATES & FORECAST, BY MEDIA TYPE,
    139. 2034 (USD BILLIONS)
    140. & FORECAST, BY REGIONAL, 2020-2034 (USD BILLIONS)
    141. COMMUNICATION MARKET SIZE ESTIMATES & FORECAST, BY TECHNOLOGY, 2020-2034 (USD
    142. BILLIONS)
    143. FORECAST, BY APPLICATION, 2020-2034 (USD BILLIONS)
    144. MARKET SIZE ESTIMATES & FORECAST, BY END USE, 2020-2034 (USD BILLIONS)
    145. INDIA VISUAL COMMUNICATION MARKET SIZE ESTIMATES & FORECAST, BY MEDIA TYPE,
    146. 2034 (USD BILLIONS)
    147. & FORECAST, BY REGIONAL, 2020-2034 (USD BILLIONS)
    148. COMMUNICATION MARKET SIZE ESTIMATES & FORECAST, BY TECHNOLOGY, 2020-2034 (USD
    149. BILLIONS)
    150. FORECAST, BY APPLICATION, 2020-2034 (USD BILLIONS)
    151. MARKET SIZE ESTIMATES & FORECAST, BY END USE, 2020-2034 (USD BILLIONS)
    152. JAPAN VISUAL COMMUNICATION MARKET SIZE ESTIMATES & FORECAST, BY MEDIA TYPE,
    153. 2034 (USD BILLIONS)
    154. & FORECAST, BY REGIONAL, 2020-2034 (USD BILLIONS)
    155. VISUAL COMMUNICATION MARKET SIZE ESTIMATES & FORECAST, BY TECHNOLOGY, 2020-2034
    156. (USD BILLIONS)
    157. & FORECAST, BY APPLICATION, 2020-2034 (USD BILLIONS)
    158. VISUAL COMMUNICATION MARKET SIZE ESTIMATES & FORECAST, BY END USE, 2020-2034
    159. (USD BILLIONS)
    160. & FORECAST, BY MEDIA TYPE, 2020-2034 (USD BILLIONS)
    161. VISUAL COMMUNICATION MARKET SIZE ESTIMATES & FORECAST, BY REGIONAL, 2020-2034
    162. (USD BILLIONS)
    163. & FORECAST, BY TECHNOLOGY, 2020-2034 (USD BILLIONS)
    164. VISUAL COMMUNICATION MARKET SIZE ESTIMATES & FORECAST, BY APPLICATION, 2020-2034
    165. (USD BILLIONS)
    166. & FORECAST, BY END USE, 2020-2034 (USD BILLIONS)
    167. COMMUNICATION MARKET SIZE ESTIMATES & FORECAST, BY MEDIA TYPE, 2020-2034 (USD
    168. BILLIONS)
    169. FORECAST, BY REGIONAL, 2020-2034 (USD BILLIONS)
    170. MARKET SIZE ESTIMATES & FORECAST, BY TECHNOLOGY, 2020-2034 (USD BILLIONS)
    171. BY APPLICATION, 2020-2034 (USD BILLIONS)
    172. MARKET SIZE ESTIMATES & FORECAST, BY END USE, 2020-2034 (USD BILLIONS)
    173. THAILAND VISUAL COMMUNICATION MARKET SIZE ESTIMATES & FORECAST, BY MEDIA
    174. TYPE, 2020-2034 (USD BILLIONS)
    175. SIZE ESTIMATES & FORECAST, BY REGIONAL, 2020-2034 (USD BILLIONS)
    176. INDONESIA VISUAL COMMUNICATION MARKET SIZE ESTIMATES & FORECAST, BY TECHNOLOGY,
    177. 2034 (USD BILLIONS)
    178. ESTIMATES & FORECAST, BY APPLICATION, 2020-2034 (USD BILLIONS)
    179. INDONESIA VISUAL COMMUNICATION MARKET SIZE ESTIMATES & FORECAST, BY END USE,
    180. 2034 (USD BILLIONS)
    181. ESTIMATES & FORECAST, BY MEDIA TYPE, 2020-2034 (USD BILLIONS)
    182. INDONESIA VISUAL COMMUNICATION MARKET SIZE ESTIMATES & FORECAST, BY REGIONAL,
    183. 2034 (USD BILLIONS)
    184. SIZE ESTIMATES & FORECAST, BY TECHNOLOGY, 2020-2034 (USD BILLIONS)
    185. REST OF APAC VISUAL COMMUNICATION MARKET SIZE ESTIMATES & FORECAST, BY APPLICATION,
    186. 2034 (USD BILLIONS)
    187. SIZE ESTIMATES & FORECAST, BY END USE, 2020-2034 (USD BILLIONS)
    188. REST OF APAC VISUAL COMMUNICATION MARKET SIZE ESTIMATES & FORECAST, BY MEDIA
    189. TYPE, 2020-2034 (USD BILLIONS)
    190. MARKET SIZE ESTIMATES & FORECAST, BY REGIONAL, 2020-2034 (USD BILLIONS)
    191. SOUTH AMERICA VISUAL COMMUNICATION MARKET SIZE ESTIMATES & FORECAST, BY
    192. TECHNOLOGY, 2020-2034 (USD BILLIONS)
    193. MARKET SIZE ESTIMATES & FORECAST, BY APPLICATION, 2020-2034 (USD BILLIONS)
    194. BY END USE, 2020-2034 (USD BILLIONS)
    195. MARKET SIZE ESTIMATES & FORECAST, BY MEDIA TYPE, 2020-2034 (USD BILLIONS)
    196. BY REGIONAL, 2020-2034 (USD BILLIONS)
    197. MARKET SIZE ESTIMATES & FORECAST, BY TECHNOLOGY, 2020-2034 (USD BILLIONS)
    198. APPLICATION, 2020-2034 (USD BILLIONS)
    199. MARKET SIZE ESTIMATES & FORECAST, BY END USE, 2020-2034 (USD BILLIONS)
    200. BRAZIL VISUAL COMMUNICATION MARKET SIZE ESTIMATES & FORECAST, BY MEDIA
    201. TYPE, 2020-2034 (USD BILLIONS)
    202. SIZE ESTIMATES & FORECAST, BY REGIONAL, 2020-2034 (USD BILLIONS)
    203. MEXICO VISUAL COMMUNICATION MARKET SIZE ESTIMATES & FORECAST, BY TECHNOLOGY,
    204. 2034 (USD BILLIONS)
    205. ESTIMATES & FORECAST, BY APPLICATION, 2020-2034 (USD BILLIONS)
    206. MEXICO VISUAL COMMUNICATION MARKET SIZE ESTIMATES & FORECAST, BY END USE, 2020-2034
    207. (USD BILLIONS)
    208. & FORECAST, BY MEDIA TYPE, 2020-2034 (USD BILLIONS)
    209. COMMUNICATION MARKET SIZE ESTIMATES & FORECAST, BY REGIONAL, 2020-2034 (USD
    210. BILLIONS)
    211. FORECAST, BY TECHNOLOGY, 2020-2034 (USD BILLIONS)
    212. COMMUNICATION MARKET SIZE ESTIMATES & FORECAST, BY APPLICATION, 2020-2034 (USD
    213. BILLIONS)
    214. FORECAST, BY END USE, 2020-2034 (USD BILLIONS)
    215. COMMUNICATION MARKET SIZE ESTIMATES & FORECAST, BY MEDIA TYPE, 2020-2034 (USD
    216. BILLIONS)
    217. FORECAST, BY REGIONAL, 2020-2034 (USD BILLIONS)
    218. VISUAL COMMUNICATION MARKET SIZE ESTIMATES & FORECAST, BY TECHNOLOGY, 2020-2034
    219. (USD BILLIONS)
    220. SIZE ESTIMATES & FORECAST, BY APPLICATION, 2020-2034 (USD BILLIONS)
    221. REST OF SOUTH AMERICA VISUAL COMMUNICATION MARKET SIZE ESTIMATES & FORECAST,
    222. BY END USE, 2020-2034 (USD BILLIONS)
    223. COMMUNICATION MARKET SIZE ESTIMATES & FORECAST, BY MEDIA TYPE, 2020-2034 (USD
    224. BILLIONS)
    225. ESTIMATES & FORECAST, BY REGIONAL, 2020-2034 (USD BILLIONS)
    226. MEA VISUAL COMMUNICATION MARKET SIZE ESTIMATES & FORECAST, BY TECHNOLOGY, 2020-2034
    227. (USD BILLIONS)
    228. FORECAST, BY APPLICATION, 2020-2034 (USD BILLIONS)
    229. MARKET SIZE ESTIMATES & FORECAST, BY END USE, 2020-2034 (USD BILLIONS)
    230. MEA VISUAL COMMUNICATION MARKET SIZE ESTIMATES & FORECAST, BY MEDIA TYPE,
    231. 2034 (USD BILLIONS)
    232. & FORECAST, BY REGIONAL, 2020-2034 (USD BILLIONS)
    233. VISUAL COMMUNICATION MARKET SIZE ESTIMATES & FORECAST, BY TECHNOLOGY, 2020-2034
    234. (USD BILLIONS)
    235. & FORECAST, BY APPLICATION, 2020-2034 (USD BILLIONS)
    236. VISUAL COMMUNICATION MARKET SIZE ESTIMATES & FORECAST, BY END USE, 2020-2034
    237. (USD BILLIONS)
    238. & FORECAST, BY MEDIA TYPE, 2020-2034 (USD BILLIONS)
    239. VISUAL COMMUNICATION MARKET SIZE ESTIMATES & FORECAST, BY REGIONAL, 2020-2034
    240. (USD BILLIONS)
    241. & FORECAST, BY TECHNOLOGY, 2020-2034 (USD BILLIONS)
    242. VISUAL COMMUNICATION MARKET SIZE ESTIMATES & FORECAST, BY APPLICATION, 2020-2034
    243. (USD BILLIONS)
    244. & FORECAST, BY END USE, 2020-2034 (USD BILLIONS)
    245. VISUAL COMMUNICATION MARKET SIZE ESTIMATES & FORECAST, BY MEDIA TYPE, 2020-2034
    246. (USD BILLIONS)
    247. & FORECAST, BY REGIONAL, 2020-2034 (USD BILLIONS)
    248. VISUAL COMMUNICATION MARKET SIZE ESTIMATES & FORECAST, BY TECHNOLOGY, 2020-2034
    249. (USD BILLIONS)
    250. & FORECAST, BY APPLICATION, 2020-2034 (USD BILLIONS)
    251. MEA VISUAL COMMUNICATION MARKET SIZE ESTIMATES & FORECAST, BY END USE, 2020-2034
    252. (USD BILLIONS)
    253. & FORECAST, BY MEDIA TYPE, 2020-2034 (USD BILLIONS)
    254. MEA VISUAL COMMUNICATION MARKET SIZE ESTIMATES & FORECAST, BY REGIONAL, 2020-2034
    255. (USD BILLIONS)
    256. ACQUISITION/PARTNERSHIP
    257. SYNOPSIS
    258. US VISUAL COMMUNICATION MARKET ANALYSIS BY TECHNOLOGY
    259. COMMUNICATION MARKET ANALYSIS BY APPLICATION
    260. MARKET ANALYSIS BY END USE
    261. BY MEDIA TYPE
    262. CANADA VISUAL COMMUNICATION MARKET ANALYSIS BY APPLICATION
    263. VISUAL COMMUNICATION MARKET ANALYSIS BY END USE
    264. MARKET ANALYSIS BY MEDIA TYPE
    265. ANALYSIS BY REGIONAL
    266. GERMANY VISUAL COMMUNICATION MARKET ANALYSIS BY APPLICATION
    267. GERMANY VISUAL COMMUNICATION MARKET ANALYSIS BY END USE
    268. VISUAL COMMUNICATION MARKET ANALYSIS BY MEDIA TYPE
    269. COMMUNICATION MARKET ANALYSIS BY REGIONAL
    270. MARKET ANALYSIS BY TECHNOLOGY
    271. BY APPLICATION
    272. UK VISUAL COMMUNICATION MARKET ANALYSIS BY REGIONAL
    273. COMMUNICATION MARKET ANALYSIS BY TECHNOLOGY
    274. MARKET ANALYSIS BY APPLICATION
    275. ANALYSIS BY END USE
    276. BY MEDIA TYPE
    277. RUSSIA VISUAL COMMUNICATION MARKET ANALYSIS BY APPLICATION
    278. VISUAL COMMUNICATION MARKET ANALYSIS BY END USE
    279. MARKET ANALYSIS BY MEDIA TYPE
    280. ANALYSIS BY REGIONAL
    281. BY TECHNOLOGY
    282. ITALY VISUAL COMMUNICATION MARKET ANALYSIS BY MEDIA TYPE
    283. COMMUNICATION MARKET ANALYSIS BY REGIONAL
    284. MARKET ANALYSIS BY TECHNOLOGY
    285. ANALYSIS BY APPLICATION
    286. BY END USE
    287. REST OF EUROPE VISUAL COMMUNICATION MARKET ANALYSIS BY TECHNOLOGY
    288. REST OF EUROPE VISUAL COMMUNICATION MARKET ANALYSIS BY APPLICATION
    289. REST OF EUROPE VISUAL COMMUNICATION MARKET ANALYSIS BY END USE
    290. REST OF EUROPE VISUAL COMMUNICATION MARKET ANALYSIS BY MEDIA TYPE
    291. REST OF EUROPE VISUAL COMMUNICATION MARKET ANALYSIS BY REGIONAL
    292. APAC VISUAL COMMUNICATION MARKET ANALYSIS
    293. MARKET ANALYSIS BY TECHNOLOGY
    294. ANALYSIS BY APPLICATION
    295. BY END USE
    296. INDIA VISUAL COMMUNICATION MARKET ANALYSIS BY TECHNOLOGY
    297. VISUAL COMMUNICATION MARKET ANALYSIS BY APPLICATION
    298. COMMUNICATION MARKET ANALYSIS BY END USE
    299. MARKET ANALYSIS BY MEDIA TYPE
    300. ANALYSIS BY REGIONAL
    301. BY TECHNOLOGY
    302. JAPAN VISUAL COMMUNICATION MARKET ANALYSIS BY MEDIA TYPE
    303. COMMUNICATION MARKET ANALYSIS BY REGIONAL
    304. MARKET ANALYSIS BY TECHNOLOGY
    305. ANALYSIS BY APPLICATION
    306. ANALYSIS BY END USE
    307. BY MEDIA TYPE
    308. REGIONAL
    309. MALAYSIA VISUAL COMMUNICATION MARKET ANALYSIS BY END USE
    310. VISUAL COMMUNICATION MARKET ANALYSIS BY MEDIA TYPE
    311. COMMUNICATION MARKET ANALYSIS BY REGIONAL
    312. MARKET ANALYSIS BY TECHNOLOGY
    313. ANALYSIS BY APPLICATION
    314. BY END USE
    315. TYPE
    316. INDONESIA VISUAL COMMUNICATION MARKET ANALYSIS BY APPLICATION
    317. INDONESIA VISUAL COMMUNICATION MARKET ANALYSIS BY END USE
    318. VISUAL COMMUNICATION MARKET ANALYSIS BY MEDIA TYPE
    319. COMMUNICATION MARKET ANALYSIS BY REGIONAL
    320. MARKET ANALYSIS BY TECHNOLOGY
    321. MARKET ANALYSIS BY APPLICATION
    322. MARKET ANALYSIS BY END USE
    323. ANALYSIS BY MEDIA TYPE
    324. ANALYSIS BY REGIONAL
    325. BRAZIL VISUAL COMMUNICATION MARKET ANALYSIS BY APPLICATION
    326. VISUAL COMMUNICATION MARKET ANALYSIS BY END USE
    327. MARKET ANALYSIS BY MEDIA TYPE
    328. ANALYSIS BY REGIONAL
    329. BY TECHNOLOGY
    330. MEXICO VISUAL COMMUNICATION MARKET ANALYSIS BY MEDIA TYPE
    331. VISUAL COMMUNICATION MARKET ANALYSIS BY REGIONAL
    332. COMMUNICATION MARKET ANALYSIS BY TECHNOLOGY
    333. MARKET ANALYSIS BY APPLICATION
    334. ANALYSIS BY END USE
    335. BY MEDIA TYPE
    336. REGIONAL
    337. BY TECHNOLOGY
    338. ANALYSIS BY APPLICATION
    339. MARKET ANALYSIS BY END USE
    340. MARKET ANALYSIS BY MEDIA TYPE
    341. MARKET ANALYSIS BY REGIONAL
    342. GCC COUNTRIES VISUAL COMMUNICATION MARKET ANALYSIS BY MEDIA TYPE
    343. GCC COUNTRIES VISUAL COMMUNICATION MARKET ANALYSIS BY REGIONAL
    344. SOUTH AFRICA VISUAL COMMUNICATION MARKET ANALYSIS BY TECHNOLOGY
    345. SOUTH AFRICA VISUAL COMMUNICATION MARKET ANALYSIS BY APPLICATION
    346. SOUTH AFRICA VISUAL COMMUNICATION MARKET ANALYSIS BY END USE
    347. SOUTH AFRICA VISUAL COMMUNICATION MARKET ANALYSIS BY MEDIA TYPE
    348. SOUTH AFRICA VISUAL COMMUNICATION MARKET ANALYSIS BY REGIONAL
    349. OF MEA VISUAL COMMUNICATION MARKET ANALYSIS BY TECHNOLOGY
    350. OF MEA VISUAL COMMUNICATION MARKET ANALYSIS BY APPLICATION
    351. OF MEA VISUAL COMMUNICATION MARKET ANALYSIS BY END USE
    352. MEA VISUAL COMMUNICATION MARKET ANALYSIS BY MEDIA TYPE
    353. MEA VISUAL COMMUNICATION MARKET ANALYSIS BY REGIONAL
    354. CRITERIA OF VISUAL COMMUNICATION MARKET
    355. IMPACT ANALYSIS: VISUAL COMMUNICATION MARKET
    356. ANALYSIS: VISUAL COMMUNICATION MARKET
    357. COMMUNICATION MARKET
    358. (% SHARE)
    359. (USD Billions)
    360. (% SHARE)
    361. (USD Billions)
    362. SHARE)
    363. Billions)
    364. VISUAL COMMUNICATION MARKET, BY REGIONAL, 2020-2034 (USD Billions)
    365. BENCHMARKING OF MAJOR COMPETITORS'

    Visual Communication Market Segmentation

    • Visual Communication Market By Technology (USD Billion, 2020-2034)
      • Digital Signage
      • Virtual Reality
      • Augmented Reality
      • Interactive Displays


    • Visual Communication Market By Application (USD Billion, 2020-2034)
      • Advertising
      • Education
      • Corporate Communication
      • Entertainment


    • Visual Communication Market By End Use (USD Billion, 2020-2034)
      • Retail
      • Healthcare
      • Transportation
      • Hospitality
      • Corporate


    • Visual Communication Market By Media Type (USD Billion, 2020-2034)
      • Image
      • Video
      • Animation
      • Text


    • Visual Communication Market By Regional (USD Billion, 2020-2034)
      • North America
      • Europe
      • South America
      • Asia Pacific
      • Middle East and Africa


    Visual Communication Market Regional Outlook (USD Billion, 2020-2034)


    • North America Outlook (USD Billion, 2020-2034)
      • North America Visual Communication Market by Technology Type
        • Digital Signage
        • Virtual Reality
        • Augmented Reality
        • Interactive Displays
      • North America Visual Communication Market by Application Type
        • Advertising
        • Education
        • Corporate Communication
        • Entertainment
      • North America Visual Communication Market by End Use Type
        • Retail
        • Healthcare
        • Transportation
        • Hospitality
        • Corporate
      • North America Visual Communication Market by Media Type
        • Image
        • Video
        • Animation
        • Text
      • North America Visual Communication Market by Regional Type
        • US
        • Canada
      • US Outlook (USD Billion, 2020-2034)
      • US Visual Communication Market by Technology Type
        • Digital Signage
        • Virtual Reality
        • Augmented Reality
        • Interactive Displays
      • US Visual Communication Market by Application Type
        • Advertising
        • Education
        • Corporate Communication
        • Entertainment
      • US Visual Communication Market by End Use Type
        • Retail
        • Healthcare
        • Transportation
        • Hospitality
        • Corporate
      • US Visual Communication Market by Media Type
        • Image
        • Video
        • Animation
        • Text
      • CANADA Outlook (USD Billion, 2020-2034)
      • CANADA Visual Communication Market by Technology Type
        • Digital Signage
        • Virtual Reality
        • Augmented Reality
        • Interactive Displays
      • CANADA Visual Communication Market by Application Type
        • Advertising
        • Education
        • Corporate Communication
        • Entertainment
      • CANADA Visual Communication Market by End Use Type
        • Retail
        • Healthcare
        • Transportation
        • Hospitality
        • Corporate
      • CANADA Visual Communication Market by Media Type
        • Image
        • Video
        • Animation
        • Text
      • Europe Outlook (USD Billion, 2020-2034)
        • Europe Visual Communication Market by Technology Type
          • Digital Signage
          • Virtual Reality
          • Augmented Reality
          • Interactive Displays
        • Europe Visual Communication Market by Application Type
          • Advertising
          • Education
          • Corporate Communication
          • Entertainment
        • Europe Visual Communication Market by End Use Type
          • Retail
          • Healthcare
          • Transportation
          • Hospitality
          • Corporate
        • Europe Visual Communication Market by Media Type
          • Image
          • Video
          • Animation
          • Text
        • Europe Visual Communication Market by Regional Type
          • Germany
          • UK
          • France
          • Russia
          • Italy
          • Spain
          • Rest of Europe
        • GERMANY Outlook (USD Billion, 2020-2034)
        • GERMANY Visual Communication Market by Technology Type
          • Digital Signage
          • Virtual Reality
          • Augmented Reality
          • Interactive Displays
        • GERMANY Visual Communication Market by Application Type
          • Advertising
          • Education
          • Corporate Communication
          • Entertainment
        • GERMANY Visual Communication Market by End Use Type
          • Retail
          • Healthcare
          • Transportation
          • Hospitality
          • Corporate
        • GERMANY Visual Communication Market by Media Type
          • Image
          • Video
          • Animation
          • Text
        • UK Outlook (USD Billion, 2020-2034)
        • UK Visual Communication Market by Technology Type
          • Digital Signage
          • Virtual Reality
          • Augmented Reality
          • Interactive Displays
        • UK Visual Communication Market by Application Type
          • Advertising
          • Education
          • Corporate Communication
          • Entertainment
        • UK Visual Communication Market by End Use Type
          • Retail
          • Healthcare
          • Transportation
          • Hospitality
          • Corporate
        • UK Visual Communication Market by Media Type
          • Image
          • Video
          • Animation
          • Text
        • FRANCE Outlook (USD Billion, 2020-2034)
        • FRANCE Visual Communication Market by Technology Type
          • Digital Signage
          • Virtual Reality
          • Augmented Reality
          • Interactive Displays
        • FRANCE Visual Communication Market by Application Type
          • Advertising
          • Education
          • Corporate Communication
          • Entertainment
        • FRANCE Visual Communication Market by End Use Type
          • Retail
          • Healthcare
          • Transportation
          • Hospitality
          • Corporate
        • FRANCE Visual Communication Market by Media Type
          • Image
          • Video
          • Animation
          • Text
        • RUSSIA Outlook (USD Billion, 2020-2034)
        • RUSSIA Visual Communication Market by Technology Type
          • Digital Signage
          • Virtual Reality
          • Augmented Reality
          • Interactive Displays
        • RUSSIA Visual Communication Market by Application Type
          • Advertising
          • Education
          • Corporate Communication
          • Entertainment
        • RUSSIA Visual Communication Market by End Use Type
          • Retail
          • Healthcare
          • Transportation
          • Hospitality
          • Corporate
        • RUSSIA Visual Communication Market by Media Type
          • Image
          • Video
          • Animation
          • Text
        • ITALY Outlook (USD Billion, 2020-2034)
        • ITALY Visual Communication Market by Technology Type
          • Digital Signage
          • Virtual Reality
          • Augmented Reality
          • Interactive Displays
        • ITALY Visual Communication Market by Application Type
          • Advertising
          • Education
          • Corporate Communication
          • Entertainment
        • ITALY Visual Communication Market by End Use Type
          • Retail
          • Healthcare
          • Transportation
          • Hospitality
          • Corporate
        • ITALY Visual Communication Market by Media Type
          • Image
          • Video
          • Animation
          • Text
        • SPAIN Outlook (USD Billion, 2020-2034)
        • SPAIN Visual Communication Market by Technology Type
          • Digital Signage
          • Virtual Reality
          • Augmented Reality
          • Interactive Displays
        • SPAIN Visual Communication Market by Application Type
          • Advertising
          • Education
          • Corporate Communication
          • Entertainment
        • SPAIN Visual Communication Market by End Use Type
          • Retail
          • Healthcare
          • Transportation
          • Hospitality
          • Corporate
        • SPAIN Visual Communication Market by Media Type
          • Image
          • Video
          • Animation
          • Text
        • REST OF EUROPE Outlook (USD Billion, 2020-2034)
        • REST OF EUROPE Visual Communication Market by Technology Type
          • Digital Signage
          • Virtual Reality
          • Augmented Reality
          • Interactive Displays
        • REST OF EUROPE Visual Communication Market by Application Type
          • Advertising
          • Education
          • Corporate Communication
          • Entertainment
        • REST OF EUROPE Visual Communication Market by End Use Type
          • Retail
          • Healthcare
          • Transportation
          • Hospitality
          • Corporate
        • REST OF EUROPE Visual Communication Market by Media Type
          • Image
          • Video
          • Animation
          • Text
        • APAC Outlook (USD Billion, 2020-2034)
          • APAC Visual Communication Market by Technology Type
            • Digital Signage
            • Virtual Reality
            • Augmented Reality
            • Interactive Displays
          • APAC Visual Communication Market by Application Type
            • Advertising
            • Education
            • Corporate Communication
            • Entertainment
          • APAC Visual Communication Market by End Use Type
            • Retail
            • Healthcare
            • Transportation
            • Hospitality
            • Corporate
          • APAC Visual Communication Market by Media Type
            • Image
            • Video
            • Animation
            • Text
          • APAC Visual Communication Market by Regional Type
            • China
            • India
            • Japan
            • South Korea
            • Malaysia
            • Thailand
            • Indonesia
            • Rest of APAC
          • CHINA Outlook (USD Billion, 2020-2034)
          • CHINA Visual Communication Market by Technology Type
            • Digital Signage
            • Virtual Reality
            • Augmented Reality
            • Interactive Displays
          • CHINA Visual Communication Market by Application Type
            • Advertising
            • Education
            • Corporate Communication
            • Entertainment
          • CHINA Visual Communication Market by End Use Type
            • Retail
            • Healthcare
            • Transportation
            • Hospitality
            • Corporate
          • CHINA Visual Communication Market by Media Type
            • Image
            • Video
            • Animation
            • Text
          • INDIA Outlook (USD Billion, 2020-2034)
          • INDIA Visual Communication Market by Technology Type
            • Digital Signage
            • Virtual Reality
            • Augmented Reality
            • Interactive Displays
          • INDIA Visual Communication Market by Application Type
            • Advertising
            • Education
            • Corporate Communication
            • Entertainment
          • INDIA Visual Communication Market by End Use Type
            • Retail
            • Healthcare
            • Transportation
            • Hospitality
            • Corporate
          • INDIA Visual Communication Market by Media Type
            • Image
            • Video
            • Animation
            • Text
          • JAPAN Outlook (USD Billion, 2020-2034)
          • JAPAN Visual Communication Market by Technology Type
            • Digital Signage
            • Virtual Reality
            • Augmented Reality
            • Interactive Displays
          • JAPAN Visual Communication Market by Application Type
            • Advertising
            • Education
            • Corporate Communication
            • Entertainment
          • JAPAN Visual Communication Market by End Use Type
            • Retail
            • Healthcare
            • Transportation
            • Hospitality
            • Corporate
          • JAPAN Visual Communication Market by Media Type
            • Image
            • Video
            • Animation
            • Text
          • SOUTH KOREA Outlook (USD Billion, 2020-2034)
          • SOUTH KOREA Visual Communication Market by Technology Type
            • Digital Signage
            • Virtual Reality
            • Augmented Reality
            • Interactive Displays
          • SOUTH KOREA Visual Communication Market by Application Type
            • Advertising
            • Education
            • Corporate Communication
            • Entertainment
          • SOUTH KOREA Visual Communication Market by End Use Type
            • Retail
            • Healthcare
            • Transportation
            • Hospitality
            • Corporate
          • SOUTH KOREA Visual Communication Market by Media Type
            • Image
            • Video
            • Animation
            • Text
          • MALAYSIA Outlook (USD Billion, 2020-2034)
          • MALAYSIA Visual Communication Market by Technology Type
            • Digital Signage
            • Virtual Reality
            • Augmented Reality
            • Interactive Displays
          • MALAYSIA Visual Communication Market by Application Type
            • Advertising
            • Education
            • Corporate Communication
            • Entertainment
          • MALAYSIA Visual Communication Market by End Use Type
            • Retail
            • Healthcare
            • Transportation
            • Hospitality
            • Corporate
          • MALAYSIA Visual Communication Market by Media Type
            • Image
            • Video
            • Animation
            • Text
          • THAILAND Outlook (USD Billion, 2020-2034)
          • THAILAND Visual Communication Market by Technology Type
            • Digital Signage
            • Virtual Reality
            • Augmented Reality
            • Interactive Displays
          • THAILAND Visual Communication Market by Application Type
            • Advertising
            • Education
            • Corporate Communication
            • Entertainment
          • THAILAND Visual Communication Market by End Use Type
            • Retail
            • Healthcare
            • Transportation
            • Hospitality
            • Corporate
          • THAILAND Visual Communication Market by Media Type
            • Image
            • Video
            • Animation
            • Text
          • INDONESIA Outlook (USD Billion, 2020-2034)
          • INDONESIA Visual Communication Market by Technology Type
            • Digital Signage
            • Virtual Reality
            • Augmented Reality
            • Interactive Displays
          • INDONESIA Visual Communication Market by Application Type
            • Advertising
            • Education
            • Corporate Communication
            • Entertainment
          • INDONESIA Visual Communication Market by End Use Type
            • Retail
            • Healthcare
            • Transportation
            • Hospitality
            • Corporate
          • INDONESIA Visual Communication Market by Media Type
            • Image
            • Video
            • Animation
            • Text
          • REST OF APAC Outlook (USD Billion, 2020-2034)
          • REST OF APAC Visual Communication Market by Technology Type
            • Digital Signage
            • Virtual Reality
            • Augmented Reality
            • Interactive Displays
          • REST OF APAC Visual Communication Market by Application Type
            • Advertising
            • Education
            • Corporate Communication
            • Entertainment
          • REST OF APAC Visual Communication Market by End Use Type
            • Retail
            • Healthcare
            • Transportation
            • Hospitality
            • Corporate
          • REST OF APAC Visual Communication Market by Media Type
            • Image
            • Video
            • Animation
            • Text
          • South America Outlook (USD Billion, 2020-2034)
            • South America Visual Communication Market by Technology Type
              • Digital Signage
              • Virtual Reality
              • Augmented Reality
              • Interactive Displays
            • South America Visual Communication Market by Application Type
              • Advertising
              • Education
              • Corporate Communication
              • Entertainment
            • South America Visual Communication Market by End Use Type
              • Retail
              • Healthcare
              • Transportation
              • Hospitality
              • Corporate
            • South America Visual Communication Market by Media Type
              • Image
              • Video
              • Animation
              • Text
            • South America Visual Communication Market by Regional Type
              • Brazil
              • Mexico
              • Argentina
              • Rest of South America
            • BRAZIL Outlook (USD Billion, 2020-2034)
            • BRAZIL Visual Communication Market by Technology Type
              • Digital Signage
              • Virtual Reality
              • Augmented Reality
              • Interactive Displays
            • BRAZIL Visual Communication Market by Application Type
              • Advertising
              • Education
              • Corporate Communication
              • Entertainment
            • BRAZIL Visual Communication Market by End Use Type
              • Retail
              • Healthcare
              • Transportation
              • Hospitality
              • Corporate
            • BRAZIL Visual Communication Market by Media Type
              • Image
              • Video
              • Animation
              • Text
            • MEXICO Outlook (USD Billion, 2020-2034)
            • MEXICO Visual Communication Market by Technology Type
              • Digital Signage
              • Virtual Reality
              • Augmented Reality
              • Interactive Displays
            • MEXICO Visual Communication Market by Application Type
              • Advertising
              • Education
              • Corporate Communication
              • Entertainment
            • MEXICO Visual Communication Market by End Use Type
              • Retail
              • Healthcare
              • Transportation
              • Hospitality
              • Corporate
            • MEXICO Visual Communication Market by Media Type
              • Image
              • Video
              • Animation
              • Text
            • ARGENTINA Outlook (USD Billion, 2020-2034)
            • ARGENTINA Visual Communication Market by Technology Type
              • Digital Signage
              • Virtual Reality
              • Augmented Reality
              • Interactive Displays
            • ARGENTINA Visual Communication Market by Application Type
              • Advertising
              • Education
              • Corporate Communication
              • Entertainment
            • ARGENTINA Visual Communication Market by End Use Type
              • Retail
              • Healthcare
              • Transportation
              • Hospitality
              • Corporate
            • ARGENTINA Visual Communication Market by Media Type
              • Image
              • Video
              • Animation
              • Text
            • REST OF SOUTH AMERICA Outlook (USD Billion, 2020-2034)
            • REST OF SOUTH AMERICA Visual Communication Market by Technology Type
              • Digital Signage
              • Virtual Reality
              • Augmented Reality
              • Interactive Displays
            • REST OF SOUTH AMERICA Visual Communication Market by Application Type
              • Advertising
              • Education
              • Corporate Communication
              • Entertainment
            • REST OF SOUTH AMERICA Visual Communication Market by End Use Type
              • Retail
              • Healthcare
              • Transportation
              • Hospitality
              • Corporate
            • REST OF SOUTH AMERICA Visual Communication Market by Media Type
              • Image
              • Video
              • Animation
              • Text
            • MEA Outlook (USD Billion, 2020-2034)
              • MEA Visual Communication Market by Technology Type
                • Digital Signage
                • Virtual Reality
                • Augmented Reality
                • Interactive Displays
              • MEA Visual Communication Market by Application Type
                • Advertising
                • Education
                • Corporate Communication
                • Entertainment
              • MEA Visual Communication Market by End Use Type
                • Retail
                • Healthcare
                • Transportation
                • Hospitality
                • Corporate
              • MEA Visual Communication Market by Media Type
                • Image
                • Video
                • Animation
                • Text
              • MEA Visual Communication Market by Regional Type
                • GCC Countries
                • South Africa
                • Rest of MEA
              • GCC COUNTRIES Outlook (USD Billion, 2020-2034)
              • GCC COUNTRIES Visual Communication Market by Technology Type
                • Digital Signage
                • Virtual Reality
                • Augmented Reality
                • Interactive Displays
              • GCC COUNTRIES Visual Communication Market by Application Type
                • Advertising
                • Education
                • Corporate Communication
                • Entertainment
              • GCC COUNTRIES Visual Communication Market by End Use Type
                • Retail
                • Healthcare
                • Transportation
                • Hospitality
                • Corporate
              • GCC COUNTRIES Visual Communication Market by Media Type
                • Image
                • Video
                • Animation
                • Text
              • SOUTH AFRICA Outlook (USD Billion, 2020-2034)
              • SOUTH AFRICA Visual Communication Market by Technology Type
                • Digital Signage
                • Virtual Reality
                • Augmented Reality
                • Interactive Displays
              • SOUTH AFRICA Visual Communication Market by Application Type
                • Advertising
                • Education
                • Corporate Communication
                • Entertainment
              • SOUTH AFRICA Visual Communication Market by End Use Type
                • Retail
                • Healthcare
                • Transportation
                • Hospitality
                • Corporate
              • SOUTH AFRICA Visual Communication Market by Media Type
                • Image
                • Video
                • Animation
                • Text
              • REST OF MEA Outlook (USD Billion, 2020-2034)
              • REST OF MEA Visual Communication Market by Technology Type
                • Digital Signage
                • Virtual Reality
                • Augmented Reality
                • Interactive Displays
              • REST OF MEA Visual Communication Market by Application Type
                • Advertising
                • Education
                • Corporate Communication
                • Entertainment
              • REST OF MEA Visual Communication Market by End Use Type
                • Retail
                • Healthcare
                • Transportation
                • Hospitality
                • Corporate
              • REST OF MEA Visual Communication Market by Media Type
                • Image
                • Video
                • Animation
                • Text


    Report Infographic
    Free Sample Request

    Kindly complete the form below to receive a free sample of this Report

    Customer Strories

    “I am very pleased with how market segments have been defined in a relevant way for my purposes (such as "Portable Freezers & refrigerators" and "last-mile"). In general the report is well structured. Thanks very much for your efforts.”

    Victoria Milne Founder
    Case Study

    Chemicals and Materials