• Cat-intel
  • MedIntelliX
  • Resources
  • About Us
  • Request Free Sample ×

    Kindly complete the form below to receive a free sample of this Report

    Leading companies partner with us for data-driven Insights

    clients tt-cursor
    Hero Background

    US Visual Analytics Market

    ID: MRFR/ICT/13903-HCR
    100 Pages
    Garvit Vyas
    October 2025

    US Visual Analytics Market Research Report: By Component (Software, Services), By Deployment (On-Demand, On-Premise) and By Industry (IT, Retail, BFSI, Manufacturing, Military & Defense, Transportation & Logistics, Others) - Forecast to 2035

    Share:
    Download PDF ×

    We do not share your information with anyone. However, we may send you emails based on your report interest from time to time. You may contact us at any time to opt-out.

    US Visual Analytics Market Infographic
    Purchase Options

    US Visual Analytics Market Summary

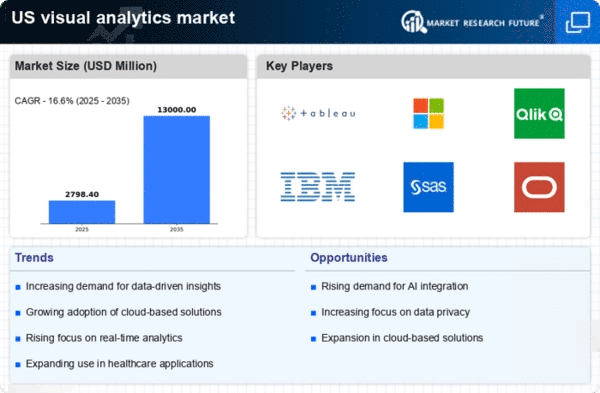
    As per MRFR analysis, the US visual analytics market size was estimated at 2400.0 USD Million in 2024. The visual analytics market is projected to grow from 2798.4 USD Million in 2025 to 13000.0 USD Million by 2035, exhibiting a compound annual growth rate (CAGR) of 16.6% during the forecast period 2025 - 2035.

    Key Market Trends & Highlights

    The US visual analytics market is experiencing robust growth driven by technological advancements and evolving business needs.

    • The market is witnessing increased adoption of cloud-based solutions, enhancing accessibility and scalability.
    • Real-time data processing is becoming a focal point, enabling organizations to make timely decisions based on current insights.
    • The integration of AI and machine learning is transforming visual analytics, providing deeper insights and predictive capabilities.
    • Key market drivers include the growing demand for data-driven decision making and the rising importance of data visualization tools.

    Market Size & Forecast

    2024 Market Size 2400.0 (USD Million)
    2035 Market Size 13000.0 (USD Million)

    Major Players

    Tableau Software (US), Microsoft (US), Qlik (US), IBM (US), SAS (US), Oracle (US), Sisense (US), Domo (US), TIBCO Software (US)

    US Visual Analytics Market Trends

    The visual analytics market is currently experiencing a notable transformation. This change is driven by advancements in technology and an increasing demand for data-driven decision-making. Organizations across various sectors are recognizing the value of visual analytics in interpreting complex data sets, which enhances their ability to derive actionable insights. This trend is particularly evident in industries such as healthcare, finance, and retail, where the ability to visualize data can lead to improved operational efficiency and strategic planning. As businesses continue to invest in data analytics tools, the visual analytics market is poised for substantial growth, reflecting a shift towards more sophisticated analytical capabilities. Moreover, the integration of artificial intelligence and machine learning into visual analytics tools is reshaping the landscape. These technologies enable more intuitive data exploration and predictive analytics, allowing users to uncover patterns and trends that may not be immediately apparent. The emphasis on user-friendly interfaces and real-time data visualization is also becoming increasingly important, as organizations seek to empower employees at all levels to engage with data. This evolution suggests that the visual analytics market will continue to expand, driven by the need for enhanced data literacy and the ability to make informed decisions swiftly.

    Increased Adoption of Cloud-Based Solutions

    The shift towards cloud computing is significantly influencing the visual analytics market. Organizations are increasingly opting for cloud-based platforms due to their scalability, flexibility, and cost-effectiveness. This trend allows businesses to access advanced analytics tools without the need for extensive on-premises infrastructure, thereby facilitating quicker deployment and easier collaboration among teams.

    Focus on Real-Time Data Processing

    There is a growing emphasis on real-time data processing within the visual analytics market. Companies are recognizing the importance of timely insights for decision-making, leading to the development of tools that can process and visualize data instantaneously. This capability enables organizations to respond swiftly to market changes and operational challenges.

    Integration of AI and Machine Learning

    The incorporation of artificial intelligence and machine learning technologies is transforming the visual analytics market. These innovations enhance the analytical capabilities of tools, allowing for more sophisticated data interpretation and predictive modeling. As a result, users can gain deeper insights and make more informed decisions based on complex data sets.

    US Visual Analytics Market Drivers

    Increased Focus on Customer Experience

    The visual analytics market is significantly influenced by the growing emphasis on customer experience. Organizations are leveraging visual analytics to gain deeper insights into customer behavior and preferences, enabling them to tailor their offerings accordingly. This focus on customer-centric strategies is driving the demand for visual analytics solutions that can provide actionable insights. As businesses aim to enhance customer satisfaction and loyalty, the visual analytics market is expected to see continued growth. Companies that effectively utilize visual analytics to understand and respond to customer needs are likely to gain a competitive edge in their respective industries.

    Expansion of Business Intelligence Solutions

    The visual analytics market is benefiting from the expansion of business intelligence (BI) solutions. As organizations strive to improve their analytical capabilities, the integration of visual analytics within BI platforms is becoming increasingly prevalent. This integration allows users to seamlessly access and analyze data, leading to more informed decision making. The BI market is projected to reach $40 billion by 2027, with visual analytics playing a crucial role in this growth. By providing users with the tools to visualize data in real-time, organizations can enhance their operational efficiency and responsiveness to market changes, thereby solidifying the relevance of visual analytics in the broader BI landscape.

    Advancements in Technology and Infrastructure

    The visual analytics market is expected to grow due to advancements in technology and infrastructure. Innovations in cloud computing, big data, and machine learning are enhancing the capabilities of visual analytics tools, making them more accessible and effective for organizations. As technology continues to evolve, businesses are increasingly adopting these advanced solutions to improve their analytical processes. The market for visual analytics is projected to expand as organizations invest in modern infrastructure that supports data integration and visualization. This trend indicates a shift towards more sophisticated analytics capabilities, positioning the visual analytics market as a critical component of future business strategies.

    Rising Importance of Data Visualization Tools

    The visual analytics market is witnessing a notable increase in the adoption of data visualization tools. These tools enable users to interpret complex data sets through intuitive graphical representations, making it easier to identify trends and patterns. As organizations generate vast amounts of data, the need for effective visualization becomes paramount. Reports indicate that the market for data visualization tools is expected to reach $10 billion by 2026, reflecting a growing recognition of their importance in the analytics process. This trend underscores the necessity for businesses to invest in visual analytics solutions that enhance their ability to communicate insights effectively and drive data-centric strategies.

    Growing Demand for Data-Driven Decision Making

    The visual analytics market is experiencing a surge in demand as organizations increasingly prioritize data-driven decision making. Companies across various sectors are recognizing the value of leveraging data insights to enhance operational efficiency and drive strategic initiatives. According to recent estimates, the market is projected to grow at a CAGR of approximately 25% from 2025 to 2030. This growth is fueled by the need for businesses to remain competitive in a rapidly evolving landscape. As organizations seek to harness the power of data, the visual analytics market is positioned to play a pivotal role in transforming raw data into actionable insights, thereby facilitating informed decision making and fostering innovation.

    Market Segment Insights

    By Component: Software (Largest) vs. Services (Fastest-Growing)

    In the US visual analytics market, the Software segment holds the largest market share, driven by the increasing demand for data-driven decision-making across various industries. Organizations are increasingly investing in software solutions that offer advanced analytical capabilities, real-time insights, and enhanced user interfaces. Meanwhile, the Services segment, although smaller, is experiencing rapid growth as businesses seek consulting, implementation, and ongoing support services to maximize the benefits of their analytics investments. Growth trends indicate a shift towards digital transformation, where businesses are prioritizing the integration of advanced analytics into their operations. The accelerating adoption of cloud-based solutions and AI-powered analytics tools further fuels the growth in the Services segment. As organizations realize the importance of data literacy and strategy execution, demand for services that enhance software utilization is expected to rise significantly in the coming years.

    Software (Dominant) vs. Services (Emerging)

    The Software segment in the US visual analytics market is characterized by its robust offerings, including tools for data visualization, dashboard creation, and reporting. This dominance is largely attributed to the need for intuitive and interactive solutions that empower users to derive actionable insights from complex datasets. On the other hand, the Services segment is emerging as a critical player, focusing on providing tailored solutions, training, and consultancy to help organizations fully leverage their software investments. As more companies recognize the value of analytics in driving business performance, the strategic alignment between software capabilities and service offerings becomes increasingly important for achieving competitive advantages.

    By Deployment: On-Demand (Largest) vs. On-Premise (Fastest-Growing)

    In the US visual analytics market, On-Demand deployment currently dominates the landscape, capturing a significant share compared to On-Premise solutions. This shift towards cloud-based options reflects a growing preference among organizations for flexibility and scalability, making On-Demand a prominent choice for many businesses. The integration of advanced analytics tools and technologies in On-Demand offerings enhances their appeal, ensuring they meet the evolving needs of users seeking actionable insights through visual analytics. Conversely, the On-Premise segment showcases remarkable growth potential, with an increasing number of enterprises gravitating towards On-Premise solutions for enhanced control over their data and analytics infrastructure. Factors such as heightened data security concerns and regulatory requirements are driving this trend. As companies prioritize compliance and data governance, the On-Premise segment is expected to grow rapidly, appealing to industries that require stringent data management practices.

    Deployment: On-Demand (Dominant) vs. On-Premise (Emerging)

    The On-Demand deployment model in the US visual analytics market is characterized by its flexibility, scalability, and the ability to deliver analytics capabilities without significant upfront investment. Businesses favor On-Demand solutions for their ease of use and the opportunity to leverage powerful analytics tools with minimal IT overhead. On the other hand, the On-Premise segment is gaining traction as organizations seek greater control over their data and wish to comply with specific industry regulations. While traditionally seen as a less popular choice, the On-Premise deployment is emerging as a viable option for companies requiring strict data security protocols and tailored analytics capabilities.

    By Industry: Retail (Largest) vs. BFSI (Fastest-Growing)

    The distribution of market share in the US visual analytics market among various industries reveals that the retail sector holds the largest portion, driven by the increasing need for data-driven decision-making. Meanwhile, the BFSI segment demonstrates a significant rise in its market share as financial institutions focus on enhancing customer experience and operational efficiency through analytics. Growth trends indicate that the BFSI segment is currently the fastest-growing sector, propelled by technological advancements and the shift toward digital solutions in banking and finance. The retail segment, while still dominant, is experiencing robust competition from emerging sectors like Military & Defense and Transportation & Logistics, which are also looking to leverage visual analytics for better operational insights.

    Retail (Dominant) vs. BFSI (Emerging)

    The retail sector is characterized by its extensive use of visual analytics to optimize customer engagement, supply chain management, and inventory control. Retailers are increasingly adopting advanced analytics to understand consumer behavior and tailor their offerings effectively. On the other hand, the BFSI sector, emerging as a significant player, focuses on data visualization tools to manage risk, detect fraud, and enhance customer insights. This industry is rapidly embracing innovations such as AI-driven analytics, making it a critical area of growth within the US visual analytics market.

    Get more detailed insights about US Visual Analytics Market

    Key Players and Competitive Insights

    The visual analytics market is currently characterized by a dynamic competitive landscape, driven by the increasing demand for data-driven decision-making across various sectors. Key players such as Tableau Software (US), Microsoft (US), and Qlik (US) are at the forefront, leveraging their technological prowess to enhance their offerings. Tableau Software (US) focuses on innovation through continuous product enhancements, while Microsoft (US) emphasizes integration with its broader suite of cloud services. Qlik (US), on the other hand, is strategically positioned through partnerships that enhance its data integration capabilities. Collectively, these strategies contribute to a competitive environment that is both collaborative and competitive, as companies seek to differentiate themselves through advanced analytics capabilities.

    In terms of business tactics, companies are increasingly localizing their operations to better serve regional markets, optimizing supply chains to enhance efficiency. The competitive structure of the market appears moderately fragmented, with several players vying for market share. However, the influence of major companies is substantial, as they set industry standards and drive innovation, thereby shaping the overall market dynamics.

    In October 2025, Tableau Software (US) announced a significant partnership with a leading cloud provider to enhance its data visualization capabilities. This strategic move is likely to bolster its market position by providing users with more robust tools for data analysis, thereby attracting a broader customer base. The partnership underscores Tableau's commitment to innovation and its focus on integrating advanced analytics into cloud environments.

    In September 2025, Microsoft (US) launched a new AI-driven analytics feature within its Power BI platform. This feature aims to automate data insights, making it easier for users to derive actionable intelligence from complex datasets. The introduction of AI capabilities not only enhances user experience but also positions Microsoft as a leader in the integration of artificial intelligence within visual analytics, potentially increasing its market share.

    In August 2025, Qlik (US) expanded its operations by acquiring a smaller analytics firm specializing in machine learning technologies. This acquisition is expected to enhance Qlik's product offerings and strengthen its competitive edge by integrating advanced machine learning capabilities into its analytics solutions. Such strategic moves reflect a broader trend of consolidation within the market, as companies seek to enhance their technological capabilities and market presence.

    As of November 2025, the visual analytics market is witnessing trends that emphasize digitalization, sustainability, and the integration of AI technologies. Strategic alliances are increasingly shaping the competitive landscape, as companies collaborate to enhance their technological capabilities and market reach. Looking ahead, it appears that competitive differentiation will evolve, with a shift from price-based competition to a focus on innovation, technology, and supply chain reliability. This transition suggests that companies that prioritize these aspects are likely to thrive in an increasingly competitive environment.

    Key Companies in the US Visual Analytics Market market include

    Industry Developments

    The US Visual Analytics Market has seen significant developments recently, reflecting a robust upward trajectory in demand and innovation. Companies such as Tableau and Microsoft are continuously enhancing their platforms, focusing on user-friendly interfaces and integration capabilities with cloud technologies. In August 2023, IBM announced enhancements to its Watson Analytics suite, emphasizing AI-driven data visualization, which aligns with growing market needs. Additionally, in September 2023, SAS revealed its commitment to expanding capabilities in predictive analytics and visualization tools to cater to the increasing need for faster data insights across industries.

    The merger and acquisition landscape reflects strategic consolidation, with Oracle acquiring a leading data analytics startup in July 2023, enhancing its cloud-based analytics services. Furthermore, MicroStrategy announced in October 2022 its plans to evolve its strategy by integrating advanced analytics features into its framework, targeting enterprises seeking actionable insights from diverse data sources. The overall market is experiencing robust growth, driven by a surge in data generation and the need for real-time analytics, with companies aggressively pursuing advancements in visualization technology to stay competitive and meet evolving customer demands.

    Future Outlook

    US Visual Analytics Market Future Outlook

    The visual analytics market is projected to grow at 16.6% CAGR from 2024 to 2035, driven by increasing data complexity, demand for real-time insights, and advancements in AI technologies.

    New opportunities lie in:

    • Development of AI-driven predictive analytics tools for enhanced decision-making.
    • Integration of visual analytics in IoT devices for real-time data visualization.
    • Expansion of cloud-based visual analytics platforms for scalable business solutions.

    By 2035, the visual analytics market is expected to achieve substantial growth and innovation.

    Market Segmentation

    US Visual Analytics Market Industry Outlook

    • IT
    • Retail
    • BFSI
    • Manufacturing
    • Military & Defense
    • Transportation & Logistics
    • Others

    US Visual Analytics Market Component Outlook

    • Software
    • Services

    US Visual Analytics Market Deployment Outlook

    • On-Demand
    • On-Premise

    Report Scope

    MARKET SIZE 20242400.0(USD Million)
    MARKET SIZE 20252798.4(USD Million)
    MARKET SIZE 203513000.0(USD Million)
    COMPOUND ANNUAL GROWTH RATE (CAGR)16.6% (2024 - 2035)
    REPORT COVERAGERevenue Forecast, Competitive Landscape, Growth Factors, and Trends
    BASE YEAR2024
    Market Forecast Period2025 - 2035
    Historical Data2019 - 2024
    Market Forecast UnitsUSD Million
    Key Companies Profiled["Tableau Software (US)", "Microsoft (US)", "Qlik (US)", "IBM (US)", "SAS (US)", "Oracle (US)", "Sisense (US)", "Domo (US)", "TIBCO Software (US)"]
    Segments CoveredComponent, Deployment, Industry
    Key Market OpportunitiesIntegration of artificial intelligence enhances decision-making capabilities in the visual analytics market.
    Key Market DynamicsGrowing demand for real-time data visualization tools drives innovation and competition in the visual analytics market.
    Countries CoveredUS

    Leave a Comment

    FAQs

    What is the expected market size of the US Visual Analytics Market in 2024?

    The US Visual Analytics Market is expected to be valued at 2.5 USD Billion in 2024.

    What is the projected market size of the US Visual Analytics Market by 2035?

    By 2035, the US Visual Analytics Market is projected to be valued at 14.31 USD Billion.

    What is the compound annual growth rate (CAGR) for the US Visual Analytics Market from 2025 to 2035?

    The expected CAGR for the US Visual Analytics Market from 2025 to 2035 is 17.169%.

    Who are the major players in the US Visual Analytics Market?

    Key players in the US Visual Analytics Market include SAP, Zoho, SAS, Oracle, MicroStrategy, Domo, and many others.

    How much is the software segment of the US Visual Analytics Market expected to be worth in 2024?

    The software segment of the US Visual Analytics Market is expected to be valued at 1.5 USD Billion in 2024.

    What is the projected value of the services segment of the US Visual Analytics Market in 2035?

    The services segment of the US Visual Analytics Market is projected to reach 5.41 USD Billion by 2035.

    What are the key applications driving the US Visual Analytics Market?

    Key applications driving the US Visual Analytics Market include data visualization, business intelligence, and performance management.

    What are the growth drivers for the US Visual Analytics Market?

    Growth drivers for the US Visual Analytics Market include increasing data generation and the demand for real-time insights.

    What challenges does the US Visual Analytics Market face?

    Challenges in the US Visual Analytics Market include data security concerns and the complexity of integrating analytics solutions.

    What impact might current global scenarios have on the US Visual Analytics Market?

    Current global scenarios may impact the US Visual Analytics Market by influencing investment strategies and technology adoption rates.

    Download Free Sample

    Kindly complete the form below to receive a free sample of this Report

    Case Study
    Chemicals and Materials

    Compare Licence

    ×
    Features License Type
    Single User Multiuser License Enterprise User
    Price $4,950 $5,950 $7,250
    Maximum User Access Limit 1 User Upto 10 Users Unrestricted Access Throughout the Organization
    Free Customization
    Direct Access to Analyst
    Deliverable Format
    Platform Access
    Discount on Next Purchase 10% 15% 15%
    Printable Versions