×
  • Cat-intel
  • MedIntelliX
  • Resources
  • About Us
  • Hero Background
    English
    Chinese
    French
    Japanese
    Korean
    German
    Spanish

    Virtual Dressing Room Market Trends

    ID: MRFR/ICT/6822-HCR
    111 Pages
    Aarti Dhapte
    October 2025

    Virtual Dressing Room Market Research Report Information By Component (Solutions and Services), By End Users (E-Commerce and Physical Stores), And By Region (North America, Europe, Asia-Pacific, And Rest Of The World) – Market Forecast Till 2035.

    Share:
    Download PDF ×

    We do not share your information with anyone. However, we may send you emails based on your report interest from time to time. You may contact us at any time to opt-out.

    Virtual Dressing Room Market Infographic
    Purchase Options

    Market Trends

    Key Emerging Trends in the Virtual Dressing Room Market

    Recently, there has been a remarkable surge in the market trends of virtual dressing rooms that have revolutionized how consumers shop for clothing and accessories. Traditional brick-and-mortar retailing is being reshaped using this innovative technology that provides users with a virtual interactive experience. One major driver behind this market is the demand for personalized shopping experiences that are full of color. Adoption rates have also risen due to increasing e-commerce activities spurred on by internet marketing platforms. In recognition of this shift in consumer behavior from physical stores to online platforms where people purchase products, retailers understand the importance of improving the digital shopping experience. Virtual Dressing Rooms enable customers not only to imagine themselves in certain garments but also reduce return rates, which remain one of the most critical concerns in web-based retailing. Another major trend involves incorporating augmented reality (AR) and virtual reality (VR) technologies into Virtual Dressing Rooms.AR coupled with VR enhances the overall customer experience by providing more lifelike and immersive environments. While AR can overlay virtual clothing onto actual people in real-time, VR establishes a complete virtual reality system where customers can explore any product. This fashion trend, however, is not peculiar to fashion retailers alone. Still, it has also expanded into furniture and home décor, allowing customers to place items in their homes before purchasing them virtually. Furthermore, the increasing emphasis on sustainability in the fashion industry has affected virtual dressing room trends. Consumers are becoming more mindful of their environmental footprints, and the try-on apparel experiences can reduce the ecological impact of traditional shopping methods. Besides, artificial intelligence (AI) advancements play a crucial role in shaping the virtual dressing room market. AI algorithms analyze customer data, such as body measurements and style preferences, to provide personalized suggestions. Such a degree of customization enhances the overall shopping experience while promoting customer loyalty at large. In order to remain competitive, retailers invest heavily in AI-driven virtual dressing room solutions that make their service more individualized and efficient.

    Author
    Aarti Dhapte
    Team Lead - Research

    She holds an experience of about 6+ years in Market Research and Business Consulting, working under the spectrum of Information Communication Technology, Telecommunications and Semiconductor domains. Aarti conceptualizes and implements a scalable business strategy and provides strategic leadership to the clients. Her expertise lies in market estimation, competitive intelligence, pipeline analysis, customer assessment, etc.

    Leave a Comment

    FAQs

    At what CAGR is the global virtual dressing room market projected to grow in the forecast period (2022-2030)?

    Global virtual dressing room market is projected to grow at approximately 14.42% CAGR during the assessment period (2022-2030).

    How much is the global virtual dressing room market worth in the future?

    The valuation of the global virtual dressing room market is estimated to increase to USD 15.87 BN by the end of 2030.

    What are the major tailwinds pushing the growth of the global virtual dressing room market?

    Increasing adoption of the technology due to its advantages and the proliferating retail & e-commerce sectors worldwide, are major tailwinds pushing the growth of the global virtual dressing room market.

    Which region holds the largest share in the global virtual dressing room market?

    North America holds the largest share in the global virtual dressing room market, followed by Europe and the Asia Pacific region, respectively.

    Who are the top players in the global virtual dressing room market?

    SenseMi, Zugara, Inc., Coitor IT Tech, Reactive Reality GMBH, Fit Analytics, 3D-A-PORTER LTD., triMirror, Dressformer, 3DLOOK Inc., ELSE Corp srl, Elpro Technologies, Fitle, Fitnect Interactive, True Fit Corporation, and SIZEBAY, are some of the top players operating in the global virtual dressing room market.

    Market Summary

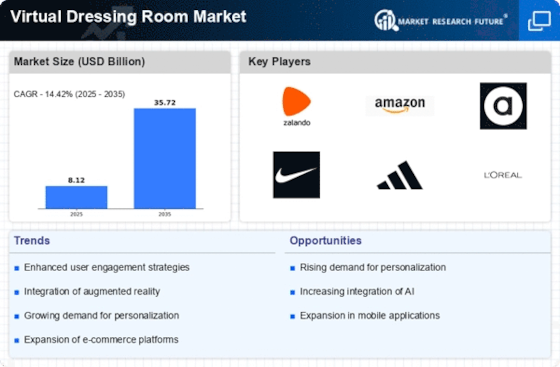
    As per MRFR analysis, the Virtual Dressing Room Market Size was estimated at 8.117 USD Billion in 2024. The Virtual Dressing Room industry is projected to grow from 9.287 USD Billion in 2025 to 35.72 USD Billion by 2035, exhibiting a compound annual growth rate (CAGR) of 14.42 during the forecast period 2025 - 2035.

    Key Market Trends & Highlights

    The Virtual Dressing Room Market is experiencing robust growth driven by technological innovations and changing consumer preferences.

    • Technological advancements are enhancing the realism and functionality of virtual dressing rooms, appealing to a broader audience.
    • Integration with e-commerce platforms is becoming increasingly prevalent, facilitating seamless shopping experiences for consumers.
    • Social sharing features are gaining traction, allowing users to share their virtual outfits on social media, thus driving engagement.
    • Consumer demand for personalization and the rise of online shopping are key drivers propelling the market forward, particularly in North America and Asia-Pacific.

    Market Size & Forecast

    2024 Market Size 8.117 (USD Billion)
    2035 Market Size 35.72 (USD Billion)
    CAGR (2025 - 2035) 14.42%
    Largest Regional Market Share in 2024 North America

    Major Players

    <p>Zalando (DE), Amazon (US), ASOS (GB), Nike (US), Adidas (DE), L'Oreal (FR), Sephora (FR), ModiFace (CA), Fashmates (US)</p>

    Market Trends

    The Virtual Dressing Room Market is currently experiencing a transformative phase, driven by advancements in technology and changing consumer preferences. As shoppers increasingly seek personalized experiences, retailers are adopting virtual dressing room solutions to enhance customer engagement and satisfaction. This market appears to be evolving rapidly, with innovations in augmented reality and artificial intelligence playing pivotal roles in shaping user experiences. Retailers are recognizing the potential of these technologies to reduce return rates and improve conversion rates, thereby optimizing their operational efficiencies. Moreover, the integration of social media platforms with virtual dressing rooms seems to be a growing trend, allowing users to share their virtual try-on experiences with friends and family. This social aspect not only enhances the shopping experience but also serves as a marketing tool for brands. As the Virtual Dressing Room Market continues to expand, it is likely that more companies will invest in these technologies to remain competitive and meet the demands of a tech-savvy consumer base. The future of this market appears promising, with ongoing developments suggesting a shift towards more immersive and interactive shopping experiences.

    Technological Advancements

    The Virtual Dressing Room Market is witnessing rapid technological advancements, particularly in augmented reality and artificial intelligence. These innovations are enhancing the accuracy and realism of virtual try-ons, allowing consumers to visualize how clothing will fit and look on them without physical trials.

    Integration with E-commerce

    There is a noticeable trend towards the integration of virtual dressing rooms with e-commerce platforms. This synergy enables seamless shopping experiences, where customers can easily transition from browsing to trying on items virtually, thereby streamlining the purchasing process.

    Social Sharing Features

    The incorporation of social sharing features within virtual dressing rooms is becoming increasingly prevalent. This allows users to share their virtual outfits on social media, fostering community engagement and providing brands with organic marketing opportunities.

    Virtual Dressing Room Market Market Drivers

    Rise of Online Shopping

    The Virtual Dressing Room Market is benefiting from the rise of online shopping, which has transformed consumer behavior. With e-commerce sales projected to reach over 6 trillion dollars by 2024, the demand for innovative solutions that enhance online shopping experiences is paramount. Virtual dressing rooms offer a unique solution by allowing consumers to try on clothes virtually, reducing the uncertainty associated with online purchases. This technology not only improves customer confidence but also decreases return rates, which have been a significant challenge for online retailers. As more consumers turn to online shopping, the virtual dressing room market is likely to expand.

    Sustainability Trends in Fashion

    The Virtual Dressing Room Market is also shaped by the growing emphasis on sustainability within the fashion sector. As consumers become more environmentally conscious, they are seeking ways to reduce waste associated with clothing purchases. Virtual dressing rooms can play a crucial role in this shift by minimizing the need for physical samples and returns, which contribute to environmental degradation. By enabling consumers to make informed purchasing decisions, virtual dressing rooms can help reduce the overall carbon footprint of the fashion industry. This alignment with sustainability trends is likely to drive further adoption of virtual dressing room technologies.

    Advancements in Augmented Reality

    The Virtual Dressing Room Market is significantly influenced by advancements in augmented reality (AR) technology. AR provides immersive experiences that allow consumers to visualize clothing in real-time, enhancing the overall shopping experience. The integration of AR in virtual dressing rooms is expected to grow, with the AR market projected to reach 198 billion dollars by 2025. This growth indicates a strong potential for virtual dressing rooms to leverage AR capabilities, offering consumers a more interactive and engaging way to shop. As technology continues to evolve, the demand for AR-enabled virtual dressing rooms is likely to increase.

    Consumer Demand for Personalization

    The Virtual Dressing Room Market is experiencing a surge in consumer demand for personalized shopping experiences. As consumers increasingly seek tailored solutions, retailers are adopting virtual dressing rooms to provide customized fitting options. This trend is supported by data indicating that 70 percent of consumers prefer personalized experiences, which enhances customer satisfaction and loyalty. The ability to visualize how clothing fits and looks on an individual can significantly influence purchasing decisions. Consequently, retailers are investing in advanced technologies to create more engaging and personalized virtual dressing room experiences, thereby driving growth in the market.

    Integration with Social Media Platforms

    The Virtual Dressing Room Market is increasingly integrating with social media platforms, enhancing consumer engagement and brand visibility. As social media continues to influence shopping behaviors, virtual dressing rooms that allow users to share their experiences on platforms like Instagram and TikTok are gaining traction. This integration not only promotes brand awareness but also encourages user-generated content, which can drive traffic and sales. With social media's role in shaping consumer preferences, the synergy between virtual dressing rooms and social platforms is expected to foster growth in the market, appealing to a younger, tech-savvy demographic.

    Market Segment Insights

    By Component: Solutions (Largest) vs. Services (Fastest-Growing)

    <p>In the Virtual Dressing Room Market, the component segment is divided into Solutions, Services, Posterior Fusion, and Others. Among these, Solutions hold the largest market share, primarily due to their comprehensive ability to provide immersive and interactive dressing experiences. Services, on the other hand, are gaining traction rapidly as businesses increasingly seek personalized customer interactions and enhanced virtual assistance, thereby capturing a growing clientele. As these two components evolve, they shape the overall market dynamics significantly.</p>

    <p>Solutions (Dominant) vs. Services (Emerging)</p>

    <p>Solutions in the Virtual Dressing Room Market represent the dominant component, characterized by comprehensive platforms that integrate augmented reality (AR) and artificial intelligence (AI) to enable virtual try-ons. They enhance user engagement and streamline online shopping, thus driving their market prominence. Emerging Services, in contrast, are focused on delivering personalized experiences and technological support to consumers. This shift towards service-oriented approaches is facilitated by advancements in AI and machine learning, positioning them as critical enablers of customer satisfaction and retention in an increasingly digital retail environment.</p>

    By End Users: E-commerce (Largest) vs. Physical Stores (Fastest-Growing)

    <p>In the Virtual Dressing Room Market, E-commerce holds the largest share among end users, driven by the increasing online shopping trend. Consumers are drawn to the convenience and interactive experience offered by virtual fitting solutions, leading to a significant reliance on e-commerce platforms. Physical stores, while traditionally dominant, are adapting by integrating virtual dressing technologies, thus emerging as a competitive segment in this evolving landscape. Additionally, the 'Others' category, including niche markets and hybrid solutions, contributes to the diversification of end-user segments in the market.</p>

    <p>E-commerce: (Dominant) vs. Physical Stores (Emerging)</p>

    <p>E-commerce is a dominant force in the Virtual Dressing Room Market, leveraging advanced technologies to enhance online shopping experiences. With features like 3D modeling and augmented reality, these platforms enable consumers to visualize clothing on their avatars, thus minimizing the uncertainty associated with online purchases. Meanwhile, physical stores are rapidly emerging as a competitive segment by embracing virtual dressing rooms to merge physical and digital shopping experiences. This hybrid approach attracts tech-savvy consumers who prefer the instant gratification of in-store shopping alongside the personalized features of online platforms. As both segments continue to innovate, their strategies will significantly redefine consumer engagement in the fashion retail space.</p>

    Get more detailed insights about Virtual Dressing Room Market Research Report - Global Forecast till 2035

    Regional Insights

    By Region, the study provides the market insights into North America, Europe, Asia-Pacific and Rest of the World. North America Virtual Dressing Room market accounted for USD 2.376 billion in 2021 and is expected to exhibit a significant CAGR growth during the study period. The North America market share is driven by increasing adoption of Augmented Reality (AR), Virtual Reality (VR), and Artificial Intelligence (AI) technology in the retail sector and e-commerce stores. These technologies help customers to try on different products with virtual try-ons and fitting rooms to increase customer engagement and conversion rate.

    Further, many well-established retailers in the region are engaged in the acquisition of small scale e-commerce platforms to increase their customer base as well as brand building.

    Further, the major countries studied in the market report are: The U.S, Canada, Germany, France, UK, Italy, Spain, China, Japan, India, Australia, South Korea, and Brazil.

    Figure 3: Virtual Dressing Room, MARKET SHARE BY REGION 2021 (%)

    Virtual Dressing Room Market

    Source: Secondary Research, Primary Research, Market Research Future Database and Analyst Review

    Europe Virtual Dressing Room market accounts for the second-largest market share. The region has played a significant role in introducing new trends, styles, and designs, which are then followed by other fashion enthusiasts globally. The presence of an extensive retailer base is encouraging the setting up of multiple startups in this region. Furthermore, the rising competitiveness among retailers is offering growth prospects to the regional market, as retailers are increasingly adopting innovative digital technologies to increase footfall as well as engagement levels.

    Further, the Germany Virtual Dressing Room market held the largest market share, and the UK Virtual Dressing Room market was the fastest growing market in the European region.

    The Asia-Pacific Virtual Dressing Room Market is expected to grow at the fastest CAGR from 2022 to 2030. The soaring demand for advanced solutions that can help customers make prompt buying decisions is likely to contribute to the regional market growth. Top e-commerce portals in these countries are adopting fitting room solutions as the region also features an end-user base with the highest number of smartphone users. The benefits of virtual dressing rooms in offering a collaborative online buying experience are expected to trigger the demand in the Asia Pacific region over the forecast period.

    Moreover, China Virtual Dressing Room market held the largest market share, and the India Virtual Dressing Room market was the fastest growing market in the Asia-Pacific region.

    Key Players and Competitive Insights

    Major market players are spending a lot of money on R&D to increase their product lines, which will help the Virtual Dressing Room market grow even more. Market participants are also taking a range of strategic initiatives to grow their worldwide footprint, with key market developments such as new product launches, contractual agreements, mergers and acquisitions, increased investments, and collaboration with other organizations. Competitors in the Virtual Dressing Room industry must offer cost-effective items to expand and survive in an increasingly competitive and rising market environment.

    One of the primary business strategies adopted by manufacturers in the Virtual Dressing Room industry to benefit clients and expand the market sector is to manufacture locally to reduce operating costs. In recent years, Virtual Dressing Room industry has provided medicine with some of the most significant benefits. The Virtual 3D  market major player such as Stray Vista Studios, and others are working to expand the market demand by investing in research and development activities.

    tray Vista’s facility, located a short distance from Austin, features Texas’ first full-size Virtual Production Volume (VPV) wall that displays interactive, computer-generated environments whose perspectives adjust based on camera positioning. In January 2023, Stray Vista Studios will open Feb. 9 at 252 Frog Pond Lane, Bldg C., Dripping Springs. The facility features a virtual production volume wall that can display interactive environments that are computer generated. The perspective can shift with the camera movement, allowing for fluid motion. Fully immersive lighting that can mimic any time of day comes from the LEDs in the screen and ceiling.

    Key Companies in the Virtual Dressing Room Market market include

    Industry Developments

    • Q2 2024: Walmart Expands Virtual Try-On Technology to Menswear and Kids’ Apparel Walmart announced the expansion of its virtual try-on technology, previously available for women’s apparel, to now include menswear and kids’ clothing, aiming to enhance the online shopping experience and reduce returns.
    • Q2 2024: Zyler partners with John Lewis to launch virtual fitting room for online shoppers Zyler, a virtual fitting room startup, announced a partnership with UK retailer John Lewis to integrate its AI-powered virtual try-on solution into the retailer’s e-commerce platform, allowing customers to visualize clothing on themselves before purchase.
    • Q2 2024: 3DLOOK Launches New Mobile Virtual Fitting Room Solution for Retailers 3DLOOK, a provider of AI-powered fit technology, launched a new mobile virtual fitting room solution designed to help retailers offer personalized size and fit recommendations to online shoppers.
    • Q3 2024: Snap acquires Fit Analytics to bolster AR-based virtual try-on capabilities Snap Inc. completed the acquisition of Fit Analytics, a company specializing in size recommendation and virtual fitting room technology, to strengthen its augmented reality commerce offerings.
    • Q3 2024: Perfect Corp. launches virtual try-on for eyewear with Luxottica partnership Perfect Corp. announced a partnership with eyewear giant Luxottica to launch a virtual try-on platform for glasses and sunglasses, enabling customers to see how frames look on their faces using augmented reality.
    • Q3 2024: MemoMi raises $30M Series B to expand virtual fitting room technology MemoMi, a developer of virtual try-on and smart mirror solutions, raised $30 million in Series B funding to accelerate the rollout of its virtual fitting room technology across global retail partners.
    • Q4 2024: Zeekit launches virtual fitting room for footwear in partnership with Adidas Zeekit, a virtual fitting room platform, launched a new footwear try-on feature in partnership with Adidas, allowing customers to visualize how different shoe models will look on their feet using augmented reality.
    • Q4 2024: Amazon introduces virtual try-on for watches and jewelry Amazon rolled out a new virtual try-on feature for watches and jewelry, enabling customers to use their mobile devices to see how products will look on their wrists and hands before purchasing.
    • Q1 2025: Vue.ai secures $20M Series C funding to enhance AI-powered virtual dressing room Vue.ai, an AI solutions provider for fashion retail, raised $20 million in Series C funding to further develop its virtual dressing room technology and expand its global reach.
    • Q1 2025: Metail appoints new CEO to drive next phase of virtual fitting room growth Metail, a virtual fitting room technology company, announced the appointment of a new CEO to lead the company’s expansion and innovation strategy in the digital fashion space.
    • Q2 2025: Bold Metrics partners with Levi’s to launch AI-driven virtual fitting experience Bold Metrics, a provider of AI sizing solutions, partnered with Levi’s to launch an AI-driven virtual fitting experience, aiming to improve fit accuracy and reduce returns for online shoppers.
    • Q2 2025: Fit:Match opens new virtual fitting studio in Los Angeles Fit:Match, a virtual fitting room startup, opened a new studio in Los Angeles to provide in-person 3D body scanning and personalized virtual try-on experiences for apparel shoppers.

    Future Outlook

    Virtual Dressing Room Market Future Outlook

    <p>The Virtual Dressing Room Market is projected to grow at a 14.42% CAGR from 2024 to 2035, driven by technological advancements, consumer demand for personalization, and enhanced retail experiences.</p>

    New opportunities lie in:

    • <p>Integration of AI-driven personalization algorithms for tailored shopping experiences.</p>
    • <p>Expansion into augmented reality platforms for immersive virtual try-ons.</p>
    • <p>Partnerships with fashion brands for exclusive virtual collections and promotions.</p>

    <p>By 2035, the market is expected to be robust, driven by innovation and strategic partnerships.</p>

    Market Segmentation

    Virtual Dressing Room Market Component Outlook

    • Solutions
    • Services
    • Posterior Fusion
    • Others

    Virtual Dressing Room Market End Users Outlook

    • E-commerce
    • Physical Stores
    • Others

    Report Scope

    MARKET SIZE 20248.117(USD Billion)
    MARKET SIZE 20259.287(USD Billion)
    MARKET SIZE 203535.72(USD Billion)
    COMPOUND ANNUAL GROWTH RATE (CAGR)14.42% (2024 - 2035)
    REPORT COVERAGERevenue Forecast, Competitive Landscape, Growth Factors, and Trends
    BASE YEAR2024
    Market Forecast Period2025 - 2035
    Historical Data2019 - 2024
    Market Forecast UnitsUSD Billion
    Key Companies ProfiledMarket analysis in progress
    Segments CoveredMarket segmentation analysis in progress
    Key Market OpportunitiesIntegration of augmented reality and artificial intelligence enhances consumer engagement in the Virtual Dressing Room Market.
    Key Market DynamicsRising consumer demand for personalized shopping experiences drives innovation in virtual dressing room technologies.
    Countries CoveredNorth America, Europe, APAC, South America, MEA

    FAQs

    At what CAGR is the global virtual dressing room market projected to grow in the forecast period (2022-2030)?

    Global virtual dressing room market is projected to grow at approximately 14.42% CAGR during the assessment period (2022-2030).

    How much is the global virtual dressing room market worth in the future?

    The valuation of the global virtual dressing room market is estimated to increase to USD 15.87 BN by the end of 2030.

    What are the major tailwinds pushing the growth of the global virtual dressing room market?

    Increasing adoption of the technology due to its advantages and the proliferating retail &amp; e-commerce sectors worldwide, are major tailwinds pushing the growth of the global virtual dressing room market.

    Which region holds the largest share in the global virtual dressing room market?

    North America holds the largest share in the global virtual dressing room market, followed by Europe and the Asia Pacific region, respectively.

    Who are the top players in the global virtual dressing room market?

    SenseMi, Zugara, Inc., Coitor IT Tech, Reactive Reality GMBH, Fit Analytics, 3D-A-PORTER LTD., triMirror, Dressformer, 3DLOOK Inc., ELSE Corp srl, Elpro Technologies, Fitle, Fitnect Interactive, True Fit Corporation, and SIZEBAY, are some of the top players operating in the global virtual dressing room market.

    1. SECTION I: EXECUTIVE SUMMARY AND KEY HIGHLIGHTS
      1. | 1.1 EXECUTIVE SUMMARY
      2. | | 1.1.1 Market Overview
      3. | | 1.1.2 Key Findings
      4. | | 1.1.3 Market Segmentation
      5. | | 1.1.4 Competitive Landscape
      6. | | 1.1.5 Challenges and Opportunities
      7. | | 1.1.6 Future Outlook
    2. SECTION II: SCOPING, METHODOLOGY AND MARKET STRUCTURE
      1. | 2.1 MARKET INTRODUCTION
      2. | | 2.1.1 Definition
      3. | | 2.1.2 Scope of the study
      4. | | | 2.1.2.1 Research Objective
      5. | | | 2.1.2.2 Assumption
      6. | | | 2.1.2.3 Limitations
      7. | 2.2 RESEARCH METHODOLOGY
      8. | | 2.2.1 Overview
      9. | | 2.2.2 Data Mining
      10. | | 2.2.3 Secondary Research
      11. | | 2.2.4 Primary Research
      12. | | | 2.2.4.1 Primary Interviews and Information Gathering Process
      13. | | | 2.2.4.2 Breakdown of Primary Respondents
      14. | | 2.2.5 Forecasting Model
      15. | | 2.2.6 Market Size Estimation
      16. | | | 2.2.6.1 Bottom-Up Approach
      17. | | | 2.2.6.2 Top-Down Approach
      18. | | 2.2.7 Data Triangulation
      19. | | 2.2.8 Validation
    3. SECTION III: QUALITATIVE ANALYSIS
      1. | 3.1 MARKET DYNAMICS
      2. | | 3.1.1 Overview
      3. | | 3.1.2 Drivers
      4. | | 3.1.3 Restraints
      5. | | 3.1.4 Opportunities
      6. | 3.2 MARKET FACTOR ANALYSIS
      7. | | 3.2.1 Value chain Analysis
      8. | | 3.2.2 Porter's Five Forces Analysis
      9. | | | 3.2.2.1 Bargaining Power of Suppliers
      10. | | | 3.2.2.2 Bargaining Power of Buyers
      11. | | | 3.2.2.3 Threat of New Entrants
      12. | | | 3.2.2.4 Threat of Substitutes
      13. | | | 3.2.2.5 Intensity of Rivalry
      14. | | 3.2.3 COVID-19 Impact Analysis
      15. | | | 3.2.3.1 Market Impact Analysis
      16. | | | 3.2.3.2 Regional Impact
      17. | | | 3.2.3.3 Opportunity and Threat Analysis
    4. SECTION IV: QUANTITATIVE ANALYSIS
      1. | 4.1 Information and Communications Technology, BY Component (USD Billion)
      2. | | 4.1.1 Solutions
      3. | | 4.1.2 Services
      4. | | 4.1.3 Posterior Fusion
      5. | | 4.1.4 Others
      6. | 4.2 Information and Communications Technology, BY End Users (USD Billion)
      7. | | 4.2.1 E-commerce
      8. | | 4.2.2 Physical Stores
      9. | | 4.2.3 Others
      10. | 4.3 Information and Communications Technology, BY Region (USD Billion)
      11. | | 4.3.1 North America
      12. | | | 4.3.1.1 US
      13. | | | 4.3.1.2 Canada
      14. | | 4.3.2 Europe
      15. | | | 4.3.2.1 Germany
      16. | | | 4.3.2.2 UK
      17. | | | 4.3.2.3 France
      18. | | | 4.3.2.4 Russia
      19. | | | 4.3.2.5 Italy
      20. | | | 4.3.2.6 Spain
      21. | | | 4.3.2.7 Rest of Europe
      22. | | 4.3.3 APAC
      23. | | | 4.3.3.1 China
      24. | | | 4.3.3.2 India
      25. | | | 4.3.3.3 Japan
      26. | | | 4.3.3.4 South Korea
      27. | | | 4.3.3.5 Malaysia
      28. | | | 4.3.3.6 Thailand
      29. | | | 4.3.3.7 Indonesia
      30. | | | 4.3.3.8 Rest of APAC
      31. | | 4.3.4 South America
      32. | | | 4.3.4.1 Brazil
      33. | | | 4.3.4.2 Mexico
      34. | | | 4.3.4.3 Argentina
      35. | | | 4.3.4.4 Rest of South America
      36. | | 4.3.5 MEA
      37. | | | 4.3.5.1 GCC Countries
      38. | | | 4.3.5.2 South Africa
      39. | | | 4.3.5.3 Rest of MEA
    5. SECTION V: COMPETITIVE ANALYSIS
      1. | 5.1 Competitive Landscape
      2. | | 5.1.1 Overview
      3. | | 5.1.2 Competitive Analysis
      4. | | 5.1.3 Market share Analysis
      5. | | 5.1.4 Major Growth Strategy in the Information and Communications Technology
      6. | | 5.1.5 Competitive Benchmarking
      7. | | 5.1.6 Leading Players in Terms of Number of Developments in the Information and Communications Technology
      8. | | 5.1.7 Key developments and growth strategies
      9. | | | 5.1.7.1 New Product Launch/Service Deployment
      10. | | | 5.1.7.2 Merger & Acquisitions
      11. | | | 5.1.7.3 Joint Ventures
      12. | | 5.1.8 Major Players Financial Matrix
      13. | | | 5.1.8.1 Sales and Operating Income
      14. | | | 5.1.8.2 Major Players R&D Expenditure. 2023
      15. | 5.2 Company Profiles
      16. | | 5.2.1 Zalando (DE)
      17. | | | 5.2.1.1 Financial Overview
      18. | | | 5.2.1.2 Products Offered
      19. | | | 5.2.1.3 Key Developments
      20. | | | 5.2.1.4 SWOT Analysis
      21. | | | 5.2.1.5 Key Strategies
      22. | | 5.2.2 Amazon (US)
      23. | | | 5.2.2.1 Financial Overview
      24. | | | 5.2.2.2 Products Offered
      25. | | | 5.2.2.3 Key Developments
      26. | | | 5.2.2.4 SWOT Analysis
      27. | | | 5.2.2.5 Key Strategies
      28. | | 5.2.3 ASOS (GB)
      29. | | | 5.2.3.1 Financial Overview
      30. | | | 5.2.3.2 Products Offered
      31. | | | 5.2.3.3 Key Developments
      32. | | | 5.2.3.4 SWOT Analysis
      33. | | | 5.2.3.5 Key Strategies
      34. | | 5.2.4 Nike (US)
      35. | | | 5.2.4.1 Financial Overview
      36. | | | 5.2.4.2 Products Offered
      37. | | | 5.2.4.3 Key Developments
      38. | | | 5.2.4.4 SWOT Analysis
      39. | | | 5.2.4.5 Key Strategies
      40. | | 5.2.5 Adidas (DE)
      41. | | | 5.2.5.1 Financial Overview
      42. | | | 5.2.5.2 Products Offered
      43. | | | 5.2.5.3 Key Developments
      44. | | | 5.2.5.4 SWOT Analysis
      45. | | | 5.2.5.5 Key Strategies
      46. | | 5.2.6 L'Oreal (FR)
      47. | | | 5.2.6.1 Financial Overview
      48. | | | 5.2.6.2 Products Offered
      49. | | | 5.2.6.3 Key Developments
      50. | | | 5.2.6.4 SWOT Analysis
      51. | | | 5.2.6.5 Key Strategies
      52. | | 5.2.7 Sephora (FR)
      53. | | | 5.2.7.1 Financial Overview
      54. | | | 5.2.7.2 Products Offered
      55. | | | 5.2.7.3 Key Developments
      56. | | | 5.2.7.4 SWOT Analysis
      57. | | | 5.2.7.5 Key Strategies
      58. | | 5.2.8 ModiFace (CA)
      59. | | | 5.2.8.1 Financial Overview
      60. | | | 5.2.8.2 Products Offered
      61. | | | 5.2.8.3 Key Developments
      62. | | | 5.2.8.4 SWOT Analysis
      63. | | | 5.2.8.5 Key Strategies
      64. | | 5.2.9 Fashmates (US)
      65. | | | 5.2.9.1 Financial Overview
      66. | | | 5.2.9.2 Products Offered
      67. | | | 5.2.9.3 Key Developments
      68. | | | 5.2.9.4 SWOT Analysis
      69. | | | 5.2.9.5 Key Strategies
      70. | 5.3 Appendix
      71. | | 5.3.1 References
      72. | | 5.3.2 Related Reports
    6. LIST OF FIGURES
      1. | 6.1 MARKET SYNOPSIS
      2. | 6.2 NORTH AMERICA MARKET ANALYSIS
      3. | 6.3 US MARKET ANALYSIS BY COMPONENT
      4. | 6.4 US MARKET ANALYSIS BY END USERS
      5. | 6.5 CANADA MARKET ANALYSIS BY COMPONENT
      6. | 6.6 CANADA MARKET ANALYSIS BY END USERS
      7. | 6.7 EUROPE MARKET ANALYSIS
      8. | 6.8 GERMANY MARKET ANALYSIS BY COMPONENT
      9. | 6.9 GERMANY MARKET ANALYSIS BY END USERS
      10. | 6.10 UK MARKET ANALYSIS BY COMPONENT
      11. | 6.11 UK MARKET ANALYSIS BY END USERS
      12. | 6.12 FRANCE MARKET ANALYSIS BY COMPONENT
      13. | 6.13 FRANCE MARKET ANALYSIS BY END USERS
      14. | 6.14 RUSSIA MARKET ANALYSIS BY COMPONENT
      15. | 6.15 RUSSIA MARKET ANALYSIS BY END USERS
      16. | 6.16 ITALY MARKET ANALYSIS BY COMPONENT
      17. | 6.17 ITALY MARKET ANALYSIS BY END USERS
      18. | 6.18 SPAIN MARKET ANALYSIS BY COMPONENT
      19. | 6.19 SPAIN MARKET ANALYSIS BY END USERS
      20. | 6.20 REST OF EUROPE MARKET ANALYSIS BY COMPONENT
      21. | 6.21 REST OF EUROPE MARKET ANALYSIS BY END USERS
      22. | 6.22 APAC MARKET ANALYSIS
      23. | 6.23 CHINA MARKET ANALYSIS BY COMPONENT
      24. | 6.24 CHINA MARKET ANALYSIS BY END USERS
      25. | 6.25 INDIA MARKET ANALYSIS BY COMPONENT
      26. | 6.26 INDIA MARKET ANALYSIS BY END USERS
      27. | 6.27 JAPAN MARKET ANALYSIS BY COMPONENT
      28. | 6.28 JAPAN MARKET ANALYSIS BY END USERS
      29. | 6.29 SOUTH KOREA MARKET ANALYSIS BY COMPONENT
      30. | 6.30 SOUTH KOREA MARKET ANALYSIS BY END USERS
      31. | 6.31 MALAYSIA MARKET ANALYSIS BY COMPONENT
      32. | 6.32 MALAYSIA MARKET ANALYSIS BY END USERS
      33. | 6.33 THAILAND MARKET ANALYSIS BY COMPONENT
      34. | 6.34 THAILAND MARKET ANALYSIS BY END USERS
      35. | 6.35 INDONESIA MARKET ANALYSIS BY COMPONENT
      36. | 6.36 INDONESIA MARKET ANALYSIS BY END USERS
      37. | 6.37 REST OF APAC MARKET ANALYSIS BY COMPONENT
      38. | 6.38 REST OF APAC MARKET ANALYSIS BY END USERS
      39. | 6.39 SOUTH AMERICA MARKET ANALYSIS
      40. | 6.40 BRAZIL MARKET ANALYSIS BY COMPONENT
      41. | 6.41 BRAZIL MARKET ANALYSIS BY END USERS
      42. | 6.42 MEXICO MARKET ANALYSIS BY COMPONENT
      43. | 6.43 MEXICO MARKET ANALYSIS BY END USERS
      44. | 6.44 ARGENTINA MARKET ANALYSIS BY COMPONENT
      45. | 6.45 ARGENTINA MARKET ANALYSIS BY END USERS
      46. | 6.46 REST OF SOUTH AMERICA MARKET ANALYSIS BY COMPONENT
      47. | 6.47 REST OF SOUTH AMERICA MARKET ANALYSIS BY END USERS
      48. | 6.48 MEA MARKET ANALYSIS
      49. | 6.49 GCC COUNTRIES MARKET ANALYSIS BY COMPONENT
      50. | 6.50 GCC COUNTRIES MARKET ANALYSIS BY END USERS
      51. | 6.51 SOUTH AFRICA MARKET ANALYSIS BY COMPONENT
      52. | 6.52 SOUTH AFRICA MARKET ANALYSIS BY END USERS
      53. | 6.53 REST OF MEA MARKET ANALYSIS BY COMPONENT
      54. | 6.54 REST OF MEA MARKET ANALYSIS BY END USERS
      55. | 6.55 KEY BUYING CRITERIA OF INFORMATION AND COMMUNICATIONS TECHNOLOGY
      56. | 6.56 RESEARCH PROCESS OF MRFR
      57. | 6.57 DRO ANALYSIS OF INFORMATION AND COMMUNICATIONS TECHNOLOGY
      58. | 6.58 DRIVERS IMPACT ANALYSIS: INFORMATION AND COMMUNICATIONS TECHNOLOGY
      59. | 6.59 RESTRAINTS IMPACT ANALYSIS: INFORMATION AND COMMUNICATIONS TECHNOLOGY
      60. | 6.60 SUPPLY / VALUE CHAIN: INFORMATION AND COMMUNICATIONS TECHNOLOGY
      61. | 6.61 INFORMATION AND COMMUNICATIONS TECHNOLOGY, BY COMPONENT, 2024 (% SHARE)
      62. | 6.62 INFORMATION AND COMMUNICATIONS TECHNOLOGY, BY COMPONENT, 2024 TO 2035 (USD Billion)
      63. | 6.63 INFORMATION AND COMMUNICATIONS TECHNOLOGY, BY END USERS, 2024 (% SHARE)
      64. | 6.64 INFORMATION AND COMMUNICATIONS TECHNOLOGY, BY END USERS, 2024 TO 2035 (USD Billion)
      65. | 6.65 BENCHMARKING OF MAJOR COMPETITORS
    7. LIST OF TABLES
      1. | 7.1 LIST OF ASSUMPTIONS
      2. | | 7.1.1
      3. | 7.2 North America MARKET SIZE ESTIMATES; FORECAST
      4. | | 7.2.1 BY COMPONENT, 2025-2035 (USD Billion)
      5. | | 7.2.2 BY END USERS, 2025-2035 (USD Billion)
      6. | 7.3 US MARKET SIZE ESTIMATES; FORECAST
      7. | | 7.3.1 BY COMPONENT, 2025-2035 (USD Billion)
      8. | | 7.3.2 BY END USERS, 2025-2035 (USD Billion)
      9. | 7.4 Canada MARKET SIZE ESTIMATES; FORECAST
      10. | | 7.4.1 BY COMPONENT, 2025-2035 (USD Billion)
      11. | | 7.4.2 BY END USERS, 2025-2035 (USD Billion)
      12. | 7.5 Europe MARKET SIZE ESTIMATES; FORECAST
      13. | | 7.5.1 BY COMPONENT, 2025-2035 (USD Billion)
      14. | | 7.5.2 BY END USERS, 2025-2035 (USD Billion)
      15. | 7.6 Germany MARKET SIZE ESTIMATES; FORECAST
      16. | | 7.6.1 BY COMPONENT, 2025-2035 (USD Billion)
      17. | | 7.6.2 BY END USERS, 2025-2035 (USD Billion)
      18. | 7.7 UK MARKET SIZE ESTIMATES; FORECAST
      19. | | 7.7.1 BY COMPONENT, 2025-2035 (USD Billion)
      20. | | 7.7.2 BY END USERS, 2025-2035 (USD Billion)
      21. | 7.8 France MARKET SIZE ESTIMATES; FORECAST
      22. | | 7.8.1 BY COMPONENT, 2025-2035 (USD Billion)
      23. | | 7.8.2 BY END USERS, 2025-2035 (USD Billion)
      24. | 7.9 Russia MARKET SIZE ESTIMATES; FORECAST
      25. | | 7.9.1 BY COMPONENT, 2025-2035 (USD Billion)
      26. | | 7.9.2 BY END USERS, 2025-2035 (USD Billion)
      27. | 7.10 Italy MARKET SIZE ESTIMATES; FORECAST
      28. | | 7.10.1 BY COMPONENT, 2025-2035 (USD Billion)
      29. | | 7.10.2 BY END USERS, 2025-2035 (USD Billion)
      30. | 7.11 Spain MARKET SIZE ESTIMATES; FORECAST
      31. | | 7.11.1 BY COMPONENT, 2025-2035 (USD Billion)
      32. | | 7.11.2 BY END USERS, 2025-2035 (USD Billion)
      33. | 7.12 Rest of Europe MARKET SIZE ESTIMATES; FORECAST
      34. | | 7.12.1 BY COMPONENT, 2025-2035 (USD Billion)
      35. | | 7.12.2 BY END USERS, 2025-2035 (USD Billion)
      36. | 7.13 APAC MARKET SIZE ESTIMATES; FORECAST
      37. | | 7.13.1 BY COMPONENT, 2025-2035 (USD Billion)
      38. | | 7.13.2 BY END USERS, 2025-2035 (USD Billion)
      39. | 7.14 China MARKET SIZE ESTIMATES; FORECAST
      40. | | 7.14.1 BY COMPONENT, 2025-2035 (USD Billion)
      41. | | 7.14.2 BY END USERS, 2025-2035 (USD Billion)
      42. | 7.15 India MARKET SIZE ESTIMATES; FORECAST
      43. | | 7.15.1 BY COMPONENT, 2025-2035 (USD Billion)
      44. | | 7.15.2 BY END USERS, 2025-2035 (USD Billion)
      45. | 7.16 Japan MARKET SIZE ESTIMATES; FORECAST
      46. | | 7.16.1 BY COMPONENT, 2025-2035 (USD Billion)
      47. | | 7.16.2 BY END USERS, 2025-2035 (USD Billion)
      48. | 7.17 South Korea MARKET SIZE ESTIMATES; FORECAST
      49. | | 7.17.1 BY COMPONENT, 2025-2035 (USD Billion)
      50. | | 7.17.2 BY END USERS, 2025-2035 (USD Billion)
      51. | 7.18 Malaysia MARKET SIZE ESTIMATES; FORECAST
      52. | | 7.18.1 BY COMPONENT, 2025-2035 (USD Billion)
      53. | | 7.18.2 BY END USERS, 2025-2035 (USD Billion)
      54. | 7.19 Thailand MARKET SIZE ESTIMATES; FORECAST
      55. | | 7.19.1 BY COMPONENT, 2025-2035 (USD Billion)
      56. | | 7.19.2 BY END USERS, 2025-2035 (USD Billion)
      57. | 7.20 Indonesia MARKET SIZE ESTIMATES; FORECAST
      58. | | 7.20.1 BY COMPONENT, 2025-2035 (USD Billion)
      59. | | 7.20.2 BY END USERS, 2025-2035 (USD Billion)
      60. | 7.21 Rest of APAC MARKET SIZE ESTIMATES; FORECAST
      61. | | 7.21.1 BY COMPONENT, 2025-2035 (USD Billion)
      62. | | 7.21.2 BY END USERS, 2025-2035 (USD Billion)
      63. | 7.22 South America MARKET SIZE ESTIMATES; FORECAST
      64. | | 7.22.1 BY COMPONENT, 2025-2035 (USD Billion)
      65. | | 7.22.2 BY END USERS, 2025-2035 (USD Billion)
      66. | 7.23 Brazil MARKET SIZE ESTIMATES; FORECAST
      67. | | 7.23.1 BY COMPONENT, 2025-2035 (USD Billion)
      68. | | 7.23.2 BY END USERS, 2025-2035 (USD Billion)
      69. | 7.24 Mexico MARKET SIZE ESTIMATES; FORECAST
      70. | | 7.24.1 BY COMPONENT, 2025-2035 (USD Billion)
      71. | | 7.24.2 BY END USERS, 2025-2035 (USD Billion)
      72. | 7.25 Argentina MARKET SIZE ESTIMATES; FORECAST
      73. | | 7.25.1 BY COMPONENT, 2025-2035 (USD Billion)
      74. | | 7.25.2 BY END USERS, 2025-2035 (USD Billion)
      75. | 7.26 Rest of South America MARKET SIZE ESTIMATES; FORECAST
      76. | | 7.26.1 BY COMPONENT, 2025-2035 (USD Billion)
      77. | | 7.26.2 BY END USERS, 2025-2035 (USD Billion)
      78. | 7.27 MEA MARKET SIZE ESTIMATES; FORECAST
      79. | | 7.27.1 BY COMPONENT, 2025-2035 (USD Billion)
      80. | | 7.27.2 BY END USERS, 2025-2035 (USD Billion)
      81. | 7.28 GCC Countries MARKET SIZE ESTIMATES; FORECAST
      82. | | 7.28.1 BY COMPONENT, 2025-2035 (USD Billion)
      83. | | 7.28.2 BY END USERS, 2025-2035 (USD Billion)
      84. | 7.29 South Africa MARKET SIZE ESTIMATES; FORECAST
      85. | | 7.29.1 BY COMPONENT, 2025-2035 (USD Billion)
      86. | | 7.29.2 BY END USERS, 2025-2035 (USD Billion)
      87. | 7.30 Rest of MEA MARKET SIZE ESTIMATES; FORECAST
      88. | | 7.30.1 BY COMPONENT, 2025-2035 (USD Billion)
      89. | | 7.30.2 BY END USERS, 2025-2035 (USD Billion)
      90. | 7.31 PRODUCT LAUNCH/PRODUCT DEVELOPMENT/APPROVAL
      91. | | 7.31.1
      92. | 7.32 ACQUISITION/PARTNERSHIP
      93. | | 7.32.1

    Virtual Dressing Room Market Segmentation

    Virtual Dressing Room Component Outlook (USD Billion, 2018-2030)

    Solutions

    Services

    Virtual Dressing Room End User Outlook (USD Billion, 2018-2030)

    E-Commerce

    Physical Stores

    Virtual Dressing Room Regional Outlook (USD Billion, 2018-2030)

    North America Outlook (USD Billion, 2018-2030)

    Virtual Dressing Room Component Outlook (USD Billion, 2018-2030)

    Solutions

    Services

    Virtual Dressing Room End User Outlook (USD Billion, 2018-2030)

    E-Commerce

    Physical Stores

    US Outlook (USD Billion, 2018-2030)

    Virtual Dressing Room Component Outlook (USD Billion, 2018-2030)

    Solutions

    Services

    Virtual Dressing Room End User Outlook (USD Billion, 2018-2030)

    E-Commerce

    Physical Stores

    CANADA Outlook (USD Billion, 2018-2030)

    Virtual Dressing Room Component Outlook (USD Billion, 2018-2030)

    Solutions

    Services

    Virtual Dressing Room End User Outlook (USD Billion, 2018-2030)

    E-Commerce

    Physical Stores

    Europe Outlook (USD Billion, 2018-2030)

    Virtual Dressing Room Component Outlook (USD Billion, 2018-2030)

    Solutions

    Services

    Virtual Dressing Room End User Outlook (USD Billion, 2018-2030)

    E-Commerce

    Physical Stores

    Germany Outlook (USD Billion, 2018-2030)

    Virtual Dressing Room Component Outlook (USD Billion, 2018-2030)

    Solutions

    Services

    Virtual Dressing Room End User Outlook (USD Billion, 2018-2030)

    E-Commerce

    Physical Stores

    France Outlook (USD Billion, 2018-2030)

    Virtual Dressing Room Component Outlook (USD Billion, 2018-2030)

    Solutions

    Services

    Virtual Dressing Room End User Outlook (USD Billion, 2018-2030)

    E-Commerce

    Physical Stores

    UK Outlook (USD Billion, 2018-2030)

    Virtual Dressing Room Component Outlook (USD Billion, 2018-2030)

    Solutions

    Services

    Virtual Dressing Room End User Outlook (USD Billion, 2018-2030)

    E-Commerce

    Physical Stores

    ITALY Outlook (USD Billion, 2018-2030)

    Virtual Dressing Room Component Outlook (USD Billion, 2018-2030)

    Solutions

    Services

    Virtual Dressing Room End User Outlook (USD Billion, 2018-2030)

    E-Commerce

    Physical Stores

    SPAIN Outlook (USD Billion, 2018-2030)

    Virtual Dressing Room Component Outlook (USD Billion, 2018-2030)

    Solutions

    Services

    Virtual Dressing Room End User Outlook (USD Billion, 2018-2030)

    E-Commerce

    Physical Stores

    Rest Of Europe Outlook (USD Billion, 2018-2030)

    Virtual Dressing Room Component Outlook (USD Billion, 2018-2030)

    Solutions

    Services

    Virtual Dressing Room End User Outlook (USD Billion, 2018-2030)

    E-Commerce

    Physical Stores

    Asia-Pacific Outlook (USD Billion, 2018-2030)

    Virtual Dressing Room Component Outlook (USD Billion, 2018-2030)

    Solutions

    Services

    Virtual Dressing Room End User Outlook (USD Billion, 2018-2030)

    E-Commerce

    Physical Stores

    China Outlook (USD Billion, 2018-2030)

    Virtual Dressing Room Component Outlook (USD Billion, 2018-2030)

    Solutions

    Services

    Virtual Dressing Room End User Outlook (USD Billion, 2018-2030)

    E-Commerce

    Physical Stores

    Japan Outlook (USD Billion, 2018-2030)

    Virtual Dressing Room Component Outlook (USD Billion, 2018-2030)

    Solutions

    Services

    Virtual Dressing Room End User Outlook (USD Billion, 2018-2030)

    E-Commerce

    Physical Stores

    India Outlook (USD Billion, 2018-2030)

    Virtual Dressing Room Component Outlook (USD Billion, 2018-2030)

    Solutions

    Services

    Virtual Dressing Room End User Outlook (USD Billion, 2018-2030)

    E-Commerce

    Physical Stores

    Australia Outlook (USD Billion, 2018-2030)

    Virtual Dressing Room Component Outlook (USD Billion, 2018-2030)

    Solutions

    Services

    Virtual Dressing Room End User Outlook (USD Billion, 2018-2030)

    E-Commerce

    Physical Stores

    Rest of Asia-Pacific Outlook (USD Billion, 2018-2030)

    Virtual Dressing Room Component Outlook (USD Billion, 2018-2030)

    Solutions

    Services

    Virtual Dressing Room End User Outlook (USD Billion, 2018-2030)

    E-Commerce

    Physical Stores

    Rest of the World Outlook (USD Billion, 2018-2030)

    Virtual Dressing Room Component Outlook (USD Billion, 2018-2030)

    Solutions

    Services

    Virtual Dressing Room End User Outlook (USD Billion, 2018-2030)

    E-Commerce

    Physical Stores

    Middle East Outlook (USD Billion, 2018-2030)

    Virtual Dressing Room Component Outlook (USD Billion, 2018-2030)

    Solutions

    Services

    Virtual Dressing Room End User Outlook (USD Billion, 2018-2030)

    E-Commerce

    Physical Stores

    Africa Outlook (USD Billion, 2018-2030)

    Virtual Dressing Room Component Outlook (USD Billion, 2018-2030)

    Solutions

    Services

    Virtual Dressing Room End User Outlook (USD Billion, 2018-2030)

    E-Commerce

    Physical Stores

    Latin America Outlook (USD Billion, 2018-2030)

    Virtual Dressing Room Component Outlook (USD Billion, 2018-2030)

    Solutions

    Services

    Virtual Dressing Room End User Outlook (USD Billion, 2018-2030)

    E-Commerce

    Physical Stores

    Infographic

    Free Sample Request

    Kindly complete the form below to receive a free sample of this Report

    Get Free Sample

    Customer Strories

    “I am very pleased with how market segments have been defined in a relevant way for my purposes (such as "Portable Freezers & refrigerators" and "last-mile"). In general the report is well structured. Thanks very much for your efforts.”

    Victoria Milne

    Founder
    Case Study
    Chemicals and Materials

    Compare Licence

    ×
    Features License Type
    Single User Multiuser License Enterprise User
    Price $4,950 $5,950 $7,250
    Maximum User Access Limit 1 User Upto 10 Users Unrestricted Access Throughout the Organization
    Free Customization
    Direct Access to Analyst
    Deliverable Format
    Platform Access
    Discount on Next Purchase 10% 15% 15%
    Printable Versions