• Cat-intel
  • MedIntelliX
  • Resources
  • About Us
  • Hero Background
    English
    Chinese
    French
    Japanese
    Korean
    German
    Spanish

    USB Devices Market Share

    ID: MRFR/SEM/7199-CR
    111 Pages
    Ankit Gupta
    February 2022

    USB Devices Market Research Report Information By Product (Webcam, USB flash drives, memory card readers, digital audio players, computer peripherals, scanners & printers and others), By Type (USB 1.0, USB 2.0, USB 3.0 and Others), By Connector Type (Type A, Type B, Type C and Lightning Connector), By Application (Consumer electronics, IT & telecommunication, Automotive, Healthcare &amp...

    Share:
    Download PDF ×

    We do not share your information with anyone. However, we may send you emails based on your report interest from time to time. You may contact us at any time to opt-out.

    USB Devices Market Infographic
    Purchase Options

    Market Share

    USB Devices Market Share Analysis

    Collaborating and forming strategic alliances are essential for securing market share. Manufacturers may offer complementary solutions and grow their product ecosystem by partnering with other tech businesses. For instance, a producer of USB devices and a smartphone company may work together to develop USB accessories that are compatible with the newest mobile devices. These collaborations not only improve product offers but also present chances for co-branding, expanding reach, and gaining market share. The market share positioning of USB devices has seen a growing significance of e-commerce and online retail techniques. In order to provide simple accessibility and exposure for customers, manufacturers are focusing on enhancing their presence on e-commerce platforms in response to the growing popularity of online shopping. Companies may also use online platforms for consumer interaction programs, discounts, and exclusive product debuts. By doing so, they may improve their digital presence and take a substantial chunk of the expanding online market. Market share positioning requires both consumer loyalty and brand credibility. Manufacturers make investments in upholding a favorable brand image by providing after-sale services, customer assistance, and consistently high-quality products. Customers that are happy with a brand are more likely to use it again and to recommend it to others, which helps maintain a steady market share. Prioritizing customer happiness gives brands a competitive edge since satisfied consumers recommend them to others and read online reviews before making a purchase. Manufacturers of USB devices use tactics of global growth and market penetration to expand their presence in various locations. Businesses may modify their offerings to satisfy the particular demands of various markets by taking into account elements including local competition, legal constraints, and regional preferences. Manufacturers may increase their market share of USB devices worldwide and broaden their client base by proactively entering new areas and building a strong presence.

    Author
    Ankit Gupta
    Senior Research Analyst

    Ankit Gupta is an analyst in market research industry in ICT and SEMI industry. With post-graduation in "Telecom and Marketing Management" and graduation in "Electronics and Telecommunication" vertical he is well versed with recent development in ICT industry as a whole. Having worked on more than 150+ reports including consultation for fortune 500 companies such as Microsoft and Rio Tinto in identifying solutions with respect to business problems his opinions are inclined towards mixture of technical and managerial aspects.

    Leave a Comment

    FAQs

    How much is the USB devices market?

    The USB Devices Market size was valued at USD 35.05 billion in 2024.

    What is the growth rate of the USB devices market?

    The global market is projected to grow at a CAGR of 10.51% during the forecast period, 2025 to 2035.

    Which region held the largest market share in the USB devices market?

    North America had the largest share in the global market

    Who are the key players in the USB devices market?

    The key players in the market are Corsair Memory Inc. (US), Adata Technology Co. Ltd. (Taiwan), Sandisk Corporation (US), Kingston Technology Corporation (US), Toshiba Corporation (Japan), Samsung Electronics Co. Ltd.(South Korea), Micron Consumer Products Group Inc. (US), Verbatim Americas LLC (US), Transcend Information Inc. (Taiwan), Intel Corporation (US), HP Inc. (US), Imation Corporation (Ojin Corporation) (US), Koninklijke Philips N.V. (Netherlands), Netac Technology Co Ltd. (China) and Teclast Electronics Co. Ltd. (China).

    Which type led the USB devices market?

    The USB 3.0 category dominated the market in 2022.

    Which application had the largest market share in the USB devices market?

    The consumer electronics had the largest share in the global market.

    Market Summary

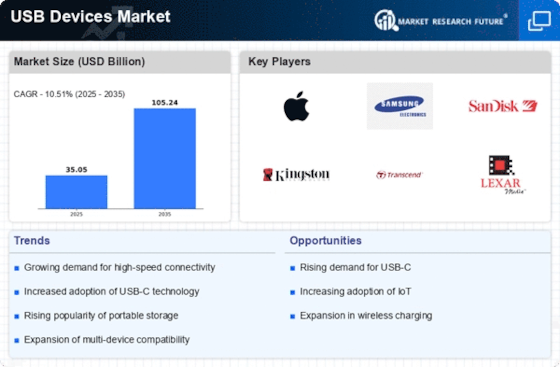
    As per Market Research Future Analysis, the Global USB Devices Market was valued at USD 35.05 Billion in 2024 and is projected to grow from USD 35.05 Billion in 2024 to USD 105.24 Billion by 2035, with a CAGR of 10.51% during the forecast period. The market is driven by the increasing demand for small storage devices, technological advancements, and the rise of IoT, which enhance data transmission rates and storage capacities. The consumer electronics sector is a significant contributor to market growth, with USB devices being integral for data transfer across various devices. North America leads the market, followed by Europe and Asia-Pacific, with the latter expected to grow at the fastest rate due to rising smartphone usage and digitalization efforts.

    Key Market Trends & Highlights

    The USB devices market is witnessing significant growth driven by various trends.

    • Market Size in 2024: USD 35.05 Billion
    • Projected Market Size by 2035: USD 105.24 Billion
    • CAGR from 2025 to 2035: 10.51%
    • North America holds the largest market share due to high demand for connectivity solutions.

    Market Size & Forecast

    2024 Market Size USD 35.05 Billion
    2035 Market Size USD 105.24 Billion
    CAGR (2024-2035) 10.51%
    Largest Regional Market Share in 2024 North America

    Major Players

    Key players include Corsair Memory Inc., Adata Technology Co. Ltd., Sandisk Corporation, Kingston Technology Corporation, Toshiba Corporation, Samsung Electronics Co. Ltd., Micron Consumer Products Group Inc., Verbatim Americas LLC, Transcend Information Inc., Intel Corporation, HP Inc., Imation Corporation, Koninklijke Philips N.V., Netac Technology Co Ltd., and Teclast Electronics Co. Ltd.

    Market Trends

    Growing demand for small storage devices is driving the market growth

    The rising demand for small storage devices is one of the main drivers boosting the USB device industry. Due to the growing need for data storage among individual consumers and organizations, the industry is seeing an increase in demand for storage devices with large capacities and compact sizes. Furthermore, USB devices are trustworthy since they can withstand 200Gs of shock, store data for extended periods, and undergo several programming cycles. The need for USB devices is growing as a result. In handheld devices like feature phones, smartphones, tablets, cameras, and camcorders, USB devices typically provide additional storage.

    These devices need small, high-capacity components since they are becoming more elegant and fashionable. Thus, the large storage capacity and small size of USB devices serve a purpose and will advance the market CAGR.

    Furthermore, cell phone use throughout all age groups has fueled the global expansion of the consumer electronics sector. Frequently referred to as USB keys or USB sticks, devices that use the Universal Serial Bus (USB) have a USB-integrated interface and can store data on flash memory. USB devices can connect various computer peripherals, including webcams, flash drives, memory card readers, digital music players, and more. The market for USB devices is expanding, and they are compatible with a wide range of devices, including smart TVs, tablets, smartphones, and computer and digital cameras.

    A significant range of emerging technologies also contributes to one of the quickest growth rates of consumer electronics. The most common way for end devices, such as laptops, mobile phones, PCs, and digital cameras, to exchange data is through USB devices. Due to the rising demand for consumer electronics and data transfer technologies, manufacturers of USB devices around the world are working extremely hard to develop new products. Therefore, it is anticipated that rising consumer electronics demand will be the main driver propelling the expansion of the worldwide USB device market.

    Another factor promoting the rise of the market share for USB devices is the rising demand for high-capacity solutions. By 2025, there will likely be three times as many linked things as there are now due to rising Internet usage globally. Data transactions will expand as a result, driving up the demand for storage devices with large capacities. Producers of USB devices are creating models with large storage capabilities comparable to HDD and USB flash drives.

    Due to the growing popularity of social networking services like Facebook, Instagram, and WhatsApp, which use up a lot of space, vendors now offer USB devices with enormous storage capacities since young consumers prefer them. Thus, driving the USB devices market revenue.

    The ongoing evolution of USB technology appears to be driving increased adoption across various sectors, reflecting a growing demand for enhanced connectivity solutions.

    U.S. Department of Commerce

    USB Devices Market Market Drivers

    Rising Demand for Data Storage Solutions

    The Global USB Devices Market Industry experiences a surge in demand for data storage solutions, driven by the increasing need for portable and efficient data transfer methods. As businesses and consumers generate vast amounts of data, the reliance on USB devices for storage and transfer becomes paramount. In 2024, the market is projected to reach 35.0 USD Billion, reflecting a growing trend towards mobile computing and data accessibility. This demand is likely to continue, as the industry adapts to the evolving technological landscape, with USB devices becoming essential tools for both personal and professional use.

    Market Segment Insights

    USB Devices Product Insights

    The USB Devices Market segmentation, based on product includes webcam, USB flash drives, memory card readers, digital audio players, computer peripherals, scanners & printers and others. The computer peripherals segment dominated the market. Any external device that offers input and output to the computer is considered a computer peripheral. Any supplemental hardware, such as computer mouse or keyboard, that connects to and works with a computer is a peripheral device. A PC's peripheral devices are connected using the serial bus standard known as USB.

    USB Devices Type Insights

    The USB Devices Market segmentation, based on type, includes USB 1.0, USB 2.0, USB 3.0 and others. The USB 3.0 category generated the most income. The SuperSpeed USB is another name for USB 3.0. A maximum data transfer rate of 5 gigabits per second is supported by USB 3.0 ports, which include nine pins, greater full bus power, improved power management, and new connections and cables that enable faster transfer rates and more capacity. Additionally, USB 3.0 allowed for simultaneous data transmission in both ways, allowing for simultaneous downloads and uploads.

    Source: Secondary Research, Primary Research, MRFR Database and Analyst Review

    USB Devices Connector Type Insights

    The USB Devices Market segmentation, based on connector type, includes type A, type B, type C and lightning connector. The type A category generated the most income. The rectangular, flat USB Type-A connectors are also referred to as Standard-A connectors. A variety of hosts, such as gaming consoles, media players, and desktop and laptop computers, typically had standard Type-A connectors. Although peripheral devices occasionally use the USB A connection as an upstream connector, it is most frequently employed on computer host controllers and hubs.

    USB Devices Application Insights

    The USB Devices Market segmentation, based on application, includes consumer electronics, IT & telecommunication, automotive, healthcare & medical devices and others. The consumer electronics category generated the most income. The connections, cables, and adaptors for USB Type-C are used in the creation of consumer electronics applications. They are connected to USB devices so that users can watch movies, listen to music, or even read books on those storage devices. Devices and hosts can be linked together using the USB Type-C connector.

    Its reversible plug position and cable direction mean that it does not matter which side of the connector or end of the cable is inserted into the device.

    Get more detailed insights about USB Devices Market Research Report—Global Forecast till 2035

    Regional Insights

    By region, the study provides the market insights into North America, Europe, Asia-Pacific and Rest of the World. The North American USB devices market area will dominate this market because more and more people demand improved connections between their electronic devices. The widespread acceptance of these standards can be credited with the significant penetration of this technology in North America. The serial, parallel, and gaming ports, as well as other connectors, all had compatibility problems that USB addressed.

    Further, the major countries studied in the market report are The US, Canada, German, France, the UK, Italy, Spain, China, Japan, India, Australia, South Korea, and Brazil.

    Figure 2: USB Devices Market SHARE BY REGION 2022 (USD Billion)

    USB Devices Market SHARE BY REGION 2022

    Source: Secondary Research, Primary Research, MRFR Database and Analyst Review

    Europe USB devices market accounts for the second-largest market share. There is a big demand for USB device security and data storage solutions in the European market for USB devices. An enormous amount of data has been produced in the area as a result of the IT sector's rapid growth. Due to their versatility and ease of use, USB devices like printers, scanners, flash drives, hard drives, and networking equipment have recently become more popular.

    Further, the German USB devices market held the largest market share, and the UK USB devices market was the fastest growing market in the European region

    The Asia-Pacific USB devices Market is expected to grow at the fastest CAGR from 2023 to 2032. Some key variables that foresee the rise in USB Devices are the rising number of smartphone users, technological advancements in mobile devices, and advanced network connectivity in the area. Additionally, the major US and UK-based manufacturers of USB devices are growing their operations in the Asia-Pacific region. The reasons in the developing nations of the Asia-Pacific region also include rising digital platforms and government attempts to promote digitization.

    Moreover, China’s USB devices market held the largest market share, and the Indian USB devices market was the fastest growing market in the Asia-Pacific region.

    Key Players and Competitive Insights

    Leading market players are investing heavily in research and development in order to expand their product lines, which will help the USB devices market, grow even more. Market participants are also undertaking a variety of strategic activities to expand their global footprint, with important market developments including new product launches, contractual agreements, mergers and acquisitions, higher investments, and collaboration with other organizations. To expand and survive in a more competitive and rising market climate, USB devices industry must offer cost-effective items.

    Manufacturing locally to minimize operational costs is one of the key business tactics used by manufacturers in the global USB devices industry to benefit clients and increase the market sector. In recent years, the USB devices industry has offered some of the most significant advantages to market. Major players in the USB devices market attempting to increase market demand by investing in research and development operations include Corsair Memory Inc. (US), Adata Technology Co. Ltd. (Taiwan), Sandisk Corporation (US), Kingston Technology Corporation (US), Toshiba Corporation (Japan), Samsung Electronics Co.

    Ltd. (South Korea), Micron Consumer Products Group Inc. (US), Verbatim Americas LLC (US), Transcend Information Inc. (Taiwan), Intel Corporation (US), HP Inc. (US), Imation Corporation (Ojin Corporation) (US), Koninklijke Philips N.V. (Netherlands), Netac Technology Co Ltd. (China) and Teclast Electronics Co. Ltd. (China).

    SanDisk is a Western Digital brand for flash memory goods, such as memory cards and readers, USB flash drives, solid-state drives, and digital music players. In 2016, Western Digital bought the original business, SanDisk Corporation. SanDisk LLC creates, develops, and produces data storage products. SanDisk serves customers in the US.

    Intel Corp creates technological components and products. Microprocessors, chipsets, embedded processors, microcontrollers, flash memory, graphic, network, and conferencing solutions are all included in the company's product line. Additionally, it provides motherboards, SSDs, servers, wireless connection equipment, software, and applications. Original equipment manufacturers, producers of industrial and communication equipment, and producers of original designs are the customers of Intel.

    Key Companies in the USB Devices Market market include

    Industry Developments

    January 2023: The US-based secure data storage company Kanguru recently announced the addition of a cutting-edge and commercially successful USB to Cloud portable software tool by ClevX 2 its Defender product line of hardware-encrypted USB drives, which is the industry standard.

    December 2022: India joined the EU in requiring USB-C ports for smartphones, yet Americans are still forced to use three distinct ports and cables.

    August 2021: Kingston Digital provided new DataTraveler Max USB drive launch information. According to the manufacturer, the USB-C 3.2 flash drive is expected to achieve record-breaking data transmission speeds of up to 1,000 MB/s read and 900 MB/s write, making it one of the best USB drives models on the market. The high-speed Data Traveler Max uses USB 3.2 Gen 2 to provide speeds that are roughly twice as fast as Gen 1.

    Future Outlook

    USB Devices Market Future Outlook

    The Global USB Devices Market is projected to grow at a 10.51% CAGR from 2025 to 2035, driven by technological advancements, increasing data transfer needs, and the proliferation of smart devices.

    New opportunities lie in:

    • Develop innovative USB-C solutions to cater to emerging tech trends.
    • Expand into renewable energy USB charging devices for eco-conscious consumers.
    • Leverage IoT integration in USB devices to enhance connectivity and functionality.

    By 2035, the USB Devices Market is expected to achieve substantial growth, reflecting evolving consumer demands and technological innovations.

    Market Segmentation

    USB Devices Type Outlook (USD Billion, 2018-2032)

    • USB 1.0
    • USB 2.0
    • USB 3.0
    • Others

    USB Devices Product Outlook (USD Billion, 2018-2032)

    • Webcam
    • USB Flash Drives
    • Memory Card Readers
    • Digital Audio Players
    • Computer Peripherals
    • Scanners & Printers
    • Others

    USB Devices Regional Outlook (USD Billion, 2018-2032)

    • North America
    • US
    • Canada
    • Europe
    • Germany
    • France
    • UK
    • Italy
    • Spain
    • Rest of Europe
    • Asia-Pacific
    • China
    • Japan
    • India
    • Australia
    • South Korea
    • Rest of Asia-Pacific
    • Rest of the World
    • Middle East
    • Africa
    • Latin America

    USB Devices Application Outlook (USD Billion, 2018-2032)

    • Consumer Electronics
    • IT & Telecommunication
    • Automotive
    • Healthcare & Medical Devices
    • Others

    USB Devices Connector Type Outlook (USD Billion, 2018-2032)

    • Type A
    • Type B
    • Type C
    • Lightning Connector

    Report Scope

    Report Attribute/Metric Details
    Market Size 2024 USD 35.05 Billion
    Market Size 2035 105.24 (Value (USD Billion))
    Compound Annual Growth Rate (CAGR) 10.51% (2025 - 2035)
    Base Year 2024
    Market Forecast Period 2025 - 2035
    Historical Data 2018- 2022
    Market Forecast Units Value (USD Billion)
    Report Coverage Revenue Forecast, Market Competitive Landscape, Growth Factors, and Trends
    Segments Covered Product, Type, Connector Type, Application and Region
    Geographies Covered North America, Europe, Asia Pacific, and the Rest of the World
    Countries Covered The US, Canada, German, France, UK, Italy, Spain, China, Japan, India, Australia, South Korea, and Brazil
    Key Companies Profiled Corsair Memory Inc. (US), Adata Technology Co. Ltd. (Taiwan), Sandisk Corporation (US), Kingston Technology Corporation (US), Toshiba Corporation (Japan), Samsung Electronics Co. Ltd.(South Korea), Micron Consumer Products Group Inc. (US), Verbatim Americas LLC (US), Transcend Information Inc. (Taiwan), Intel Corporation (US), HP Inc. (US), Imation Corporation (Ojin Corporation) (US), Koninklijke Philips N.V. (Netherlands), Netac Technology Co Ltd. (China) and Teclast Electronics Co. Ltd. (China)
    Key Market Opportunities Increasing demand for better connectivity between electronic devices
    Key Market Dynamics Growing demand for usb products in automotive entertainment and infotainment systems Rising demand for consumer electronics
    Market Size 2025 38.73 (Value (USD Billion))

    FAQs

    How much is the USB devices market?

    The USB Devices Market size was valued at USD 35.05 billion in 2024.

    What is the growth rate of the USB devices market?

    The global market is projected to grow at a CAGR of 10.51% during the forecast period, 2025 to 2035.

    Which region held the largest market share in the USB devices market?

    North America had the largest share in the global market

    Who are the key players in the USB devices market?

    The key players in the market are Corsair Memory Inc. (US), Adata Technology Co. Ltd. (Taiwan), Sandisk Corporation (US), Kingston Technology Corporation (US), Toshiba Corporation (Japan), Samsung Electronics Co. Ltd.(South Korea), Micron Consumer Products Group Inc. (US), Verbatim Americas LLC (US), Transcend Information Inc. (Taiwan), Intel Corporation (US), HP Inc. (US), Imation Corporation (Ojin Corporation) (US), Koninklijke Philips N.V. (Netherlands), Netac Technology Co Ltd. (China) and Teclast Electronics Co. Ltd. (China).

    Which type led the USB devices market?

    The USB 3.0 category dominated the market in 2022.

    Which application had the largest market share in the USB devices market?

    The consumer electronics had the largest share in the global market.

    1. SECTION I: EXECUTIVE SUMMARY AND KEY HIGHLIGHTS
      1. | 1.1 EXECUTIVE SUMMARY
      2. | | 1.1.1 Market Overview
      3. | | 1.1.2 Key Findings
      4. | | 1.1.3 Market Segmentation
      5. | | 1.1.4 Competitive Landscape
      6. | | 1.1.5 Challenges and Opportunities
      7. | | 1.1.6 Future Outlook
    2. SECTION II: SCOPING, METHODOLOGY AND MARKET STRUCTURE
      1. | 2.1 MARKET INTRODUCTION
      2. | | 2.1.1 Definition
      3. | | 2.1.2 Scope of the study
      4. | | | 2.1.2.1 Research Objective
      5. | | | 2.1.2.2 Assumption
      6. | | | 2.1.2.3 Limitations
      7. | 2.2 RESEARCH METHODOLOGY
      8. | | 2.2.1 Overview
      9. | | 2.2.2 Data Mining
      10. | | 2.2.3 Secondary Research
      11. | | 2.2.4 Primary Research
      12. | | | 2.2.4.1 Primary Interviews and Information Gathering Process
      13. | | | 2.2.4.2 Breakdown of Primary Respondents
      14. | | 2.2.5 Forecasting Model
      15. | | 2.2.6 Market Size Estimation
      16. | | | 2.2.6.1 Bottom-Up Approach
      17. | | | 2.2.6.2 Top-Down Approach
      18. | | 2.2.7 Data Triangulation
      19. | | 2.2.8 Validation
    3. SECTION III: QUALITATIVE ANALYSIS
      1. | 3.1 MARKET DYNAMICS
      2. | | 3.1.1 Overview
      3. | | 3.1.2 Drivers
      4. | | 3.1.3 Restraints
      5. | | 3.1.4 Opportunities
      6. | 3.2 MARKET FACTOR ANALYSIS
      7. | | 3.2.1 Value chain Analysis
      8. | | 3.2.2 Porter's Five Forces Analysis
      9. | | | 3.2.2.1 Bargaining Power of Suppliers
      10. | | | 3.2.2.2 Bargaining Power of Buyers
      11. | | | 3.2.2.3 Threat of New Entrants
      12. | | | 3.2.2.4 Threat of Substitutes
      13. | | | 3.2.2.5 Intensity of Rivalry
      14. | | 3.2.3 COVID-19 Impact Analysis
      15. | | | 3.2.3.1 Market Impact Analysis
      16. | | | 3.2.3.2 Regional Impact
      17. | | | 3.2.3.3 Opportunity and Threat Analysis
    4. SECTION IV: QUANTITATIVE ANALYSIS
      1. | 4.1 Semiconductor & Electronics, BY Product (USD Billion)
      2. | | 4.1.1 webcam
      3. | | 4.1.2 USB flash drives
      4. | | 4.1.3 memory card readers
      5. | | 4.1.4 digital audio players
      6. | | 4.1.5 computer peripherals
      7. | | 4.1.6 scanners & printers
      8. | | 4.1.7 others
      9. | 4.2 Semiconductor & Electronics, BY Type (USD Billion)
      10. | | 4.2.1 USB 1.0
      11. | | 4.2.2 USB 2.0
      12. | | 4.2.3 USB 3.0
      13. | | 4.2.4 others
      14. | 4.3 Semiconductor & Electronics, BY Connector Type (USD Billion)
      15. | | 4.3.1 Type A
      16. | | 4.3.2 Type B
      17. | | 4.3.3 Type C
      18. | | 4.3.4 Lightning Connector
      19. | 4.4 Semiconductor & Electronics, BY Application (USD Billion)
      20. | | 4.4.1 consumer electronics
      21. | | 4.4.2 IT & telecommunication
      22. | | 4.4.3 automotive
      23. | | 4.4.4 healthcare & medical devices
      24. | | 4.4.5 others
      25. | 4.5 Semiconductor & Electronics, BY Region (USD Billion)
      26. | | 4.5.1 North America
      27. | | | 4.5.1.1 US
      28. | | | 4.5.1.2 Canada
      29. | | 4.5.2 Europe
      30. | | | 4.5.2.1 Germany
      31. | | | 4.5.2.2 UK
      32. | | | 4.5.2.3 France
      33. | | | 4.5.2.4 Russia
      34. | | | 4.5.2.5 Italy
      35. | | | 4.5.2.6 Spain
      36. | | | 4.5.2.7 Rest of Europe
      37. | | 4.5.3 APAC
      38. | | | 4.5.3.1 China
      39. | | | 4.5.3.2 India
      40. | | | 4.5.3.3 Japan
      41. | | | 4.5.3.4 South Korea
      42. | | | 4.5.3.5 Malaysia
      43. | | | 4.5.3.6 Thailand
      44. | | | 4.5.3.7 Indonesia
      45. | | | 4.5.3.8 Rest of APAC
      46. | | 4.5.4 South America
      47. | | | 4.5.4.1 Brazil
      48. | | | 4.5.4.2 Mexico
      49. | | | 4.5.4.3 Argentina
      50. | | | 4.5.4.4 Rest of South America
      51. | | 4.5.5 MEA
      52. | | | 4.5.5.1 GCC Countries
      53. | | | 4.5.5.2 South Africa
      54. | | | 4.5.5.3 Rest of MEA
    5. SECTION V: COMPETITIVE ANALYSIS
      1. | 5.1 Competitive Landscape
      2. | | 5.1.1 Overview
      3. | | 5.1.2 Competitive Analysis
      4. | | 5.1.3 Market share Analysis
      5. | | 5.1.4 Major Growth Strategy in the Semiconductor & Electronics
      6. | | 5.1.5 Competitive Benchmarking
      7. | | 5.1.6 Leading Players in Terms of Number of Developments in the Semiconductor & Electronics
      8. | | 5.1.7 Key developments and growth strategies
      9. | | | 5.1.7.1 New Product Launch/Service Deployment
      10. | | | 5.1.7.2 Merger & Acquisitions
      11. | | | 5.1.7.3 Joint Ventures
      12. | | 5.1.8 Major Players Financial Matrix
      13. | | | 5.1.8.1 Sales and Operating Income
      14. | | | 5.1.8.2 Major Players R&D Expenditure. 2023
      15. | 5.2 Company Profiles
      16. | | 5.2.1 Apple Inc (US)
      17. | | | 5.2.1.1 Financial Overview
      18. | | | 5.2.1.2 Products Offered
      19. | | | 5.2.1.3 Key Developments
      20. | | | 5.2.1.4 SWOT Analysis
      21. | | | 5.2.1.5 Key Strategies
      22. | | 5.2.2 Samsung Electronics (KR)
      23. | | | 5.2.2.1 Financial Overview
      24. | | | 5.2.2.2 Products Offered
      25. | | | 5.2.2.3 Key Developments
      26. | | | 5.2.2.4 SWOT Analysis
      27. | | | 5.2.2.5 Key Strategies
      28. | | 5.2.3 SanDisk Corporation (US)
      29. | | | 5.2.3.1 Financial Overview
      30. | | | 5.2.3.2 Products Offered
      31. | | | 5.2.3.3 Key Developments
      32. | | | 5.2.3.4 SWOT Analysis
      33. | | | 5.2.3.5 Key Strategies
      34. | | 5.2.4 Kingston Technology Company (US)
      35. | | | 5.2.4.1 Financial Overview
      36. | | | 5.2.4.2 Products Offered
      37. | | | 5.2.4.3 Key Developments
      38. | | | 5.2.4.4 SWOT Analysis
      39. | | | 5.2.4.5 Key Strategies
      40. | | 5.2.5 Transcend Information Inc (TW)
      41. | | | 5.2.5.1 Financial Overview
      42. | | | 5.2.5.2 Products Offered
      43. | | | 5.2.5.3 Key Developments
      44. | | | 5.2.5.4 SWOT Analysis
      45. | | | 5.2.5.5 Key Strategies
      46. | | 5.2.6 Lexar Media Inc (US)
      47. | | | 5.2.6.1 Financial Overview
      48. | | | 5.2.6.2 Products Offered
      49. | | | 5.2.6.3 Key Developments
      50. | | | 5.2.6.4 SWOT Analysis
      51. | | | 5.2.6.5 Key Strategies
      52. | | 5.2.7 PNY Technologies Inc (US)
      53. | | | 5.2.7.1 Financial Overview
      54. | | | 5.2.7.2 Products Offered
      55. | | | 5.2.7.3 Key Developments
      56. | | | 5.2.7.4 SWOT Analysis
      57. | | | 5.2.7.5 Key Strategies
      58. | | 5.2.8 ADATA Technology Co Ltd (TW)
      59. | | | 5.2.8.1 Financial Overview
      60. | | | 5.2.8.2 Products Offered
      61. | | | 5.2.8.3 Key Developments
      62. | | | 5.2.8.4 SWOT Analysis
      63. | | | 5.2.8.5 Key Strategies
      64. | | 5.2.9 Toshiba Corporation (JP)
      65. | | | 5.2.9.1 Financial Overview
      66. | | | 5.2.9.2 Products Offered
      67. | | | 5.2.9.3 Key Developments
      68. | | | 5.2.9.4 SWOT Analysis
      69. | | | 5.2.9.5 Key Strategies
      70. | 5.3 Appendix
      71. | | 5.3.1 References
      72. | | 5.3.2 Related Reports
    6. LIST OF FIGURES
      1. | 6.1 MARKET SYNOPSIS
      2. | 6.2 NORTH AMERICA MARKET ANALYSIS
      3. | 6.3 US MARKET ANALYSIS BY PRODUCT
      4. | 6.4 US MARKET ANALYSIS BY TYPE
      5. | 6.5 US MARKET ANALYSIS BY CONNECTOR TYPE
      6. | 6.6 US MARKET ANALYSIS BY APPLICATION
      7. | 6.7 CANADA MARKET ANALYSIS BY PRODUCT
      8. | 6.8 CANADA MARKET ANALYSIS BY TYPE
      9. | 6.9 CANADA MARKET ANALYSIS BY CONNECTOR TYPE
      10. | 6.10 CANADA MARKET ANALYSIS BY APPLICATION
      11. | 6.11 EUROPE MARKET ANALYSIS
      12. | 6.12 GERMANY MARKET ANALYSIS BY PRODUCT
      13. | 6.13 GERMANY MARKET ANALYSIS BY TYPE
      14. | 6.14 GERMANY MARKET ANALYSIS BY CONNECTOR TYPE
      15. | 6.15 GERMANY MARKET ANALYSIS BY APPLICATION
      16. | 6.16 UK MARKET ANALYSIS BY PRODUCT
      17. | 6.17 UK MARKET ANALYSIS BY TYPE
      18. | 6.18 UK MARKET ANALYSIS BY CONNECTOR TYPE
      19. | 6.19 UK MARKET ANALYSIS BY APPLICATION
      20. | 6.20 FRANCE MARKET ANALYSIS BY PRODUCT
      21. | 6.21 FRANCE MARKET ANALYSIS BY TYPE
      22. | 6.22 FRANCE MARKET ANALYSIS BY CONNECTOR TYPE
      23. | 6.23 FRANCE MARKET ANALYSIS BY APPLICATION
      24. | 6.24 RUSSIA MARKET ANALYSIS BY PRODUCT
      25. | 6.25 RUSSIA MARKET ANALYSIS BY TYPE
      26. | 6.26 RUSSIA MARKET ANALYSIS BY CONNECTOR TYPE
      27. | 6.27 RUSSIA MARKET ANALYSIS BY APPLICATION
      28. | 6.28 ITALY MARKET ANALYSIS BY PRODUCT
      29. | 6.29 ITALY MARKET ANALYSIS BY TYPE
      30. | 6.30 ITALY MARKET ANALYSIS BY CONNECTOR TYPE
      31. | 6.31 ITALY MARKET ANALYSIS BY APPLICATION
      32. | 6.32 SPAIN MARKET ANALYSIS BY PRODUCT
      33. | 6.33 SPAIN MARKET ANALYSIS BY TYPE
      34. | 6.34 SPAIN MARKET ANALYSIS BY CONNECTOR TYPE
      35. | 6.35 SPAIN MARKET ANALYSIS BY APPLICATION
      36. | 6.36 REST OF EUROPE MARKET ANALYSIS BY PRODUCT
      37. | 6.37 REST OF EUROPE MARKET ANALYSIS BY TYPE
      38. | 6.38 REST OF EUROPE MARKET ANALYSIS BY CONNECTOR TYPE
      39. | 6.39 REST OF EUROPE MARKET ANALYSIS BY APPLICATION
      40. | 6.40 APAC MARKET ANALYSIS
      41. | 6.41 CHINA MARKET ANALYSIS BY PRODUCT
      42. | 6.42 CHINA MARKET ANALYSIS BY TYPE
      43. | 6.43 CHINA MARKET ANALYSIS BY CONNECTOR TYPE
      44. | 6.44 CHINA MARKET ANALYSIS BY APPLICATION
      45. | 6.45 INDIA MARKET ANALYSIS BY PRODUCT
      46. | 6.46 INDIA MARKET ANALYSIS BY TYPE
      47. | 6.47 INDIA MARKET ANALYSIS BY CONNECTOR TYPE
      48. | 6.48 INDIA MARKET ANALYSIS BY APPLICATION
      49. | 6.49 JAPAN MARKET ANALYSIS BY PRODUCT
      50. | 6.50 JAPAN MARKET ANALYSIS BY TYPE
      51. | 6.51 JAPAN MARKET ANALYSIS BY CONNECTOR TYPE
      52. | 6.52 JAPAN MARKET ANALYSIS BY APPLICATION
      53. | 6.53 SOUTH KOREA MARKET ANALYSIS BY PRODUCT
      54. | 6.54 SOUTH KOREA MARKET ANALYSIS BY TYPE
      55. | 6.55 SOUTH KOREA MARKET ANALYSIS BY CONNECTOR TYPE
      56. | 6.56 SOUTH KOREA MARKET ANALYSIS BY APPLICATION
      57. | 6.57 MALAYSIA MARKET ANALYSIS BY PRODUCT
      58. | 6.58 MALAYSIA MARKET ANALYSIS BY TYPE
      59. | 6.59 MALAYSIA MARKET ANALYSIS BY CONNECTOR TYPE
      60. | 6.60 MALAYSIA MARKET ANALYSIS BY APPLICATION
      61. | 6.61 THAILAND MARKET ANALYSIS BY PRODUCT
      62. | 6.62 THAILAND MARKET ANALYSIS BY TYPE
      63. | 6.63 THAILAND MARKET ANALYSIS BY CONNECTOR TYPE
      64. | 6.64 THAILAND MARKET ANALYSIS BY APPLICATION
      65. | 6.65 INDONESIA MARKET ANALYSIS BY PRODUCT
      66. | 6.66 INDONESIA MARKET ANALYSIS BY TYPE
      67. | 6.67 INDONESIA MARKET ANALYSIS BY CONNECTOR TYPE
      68. | 6.68 INDONESIA MARKET ANALYSIS BY APPLICATION
      69. | 6.69 REST OF APAC MARKET ANALYSIS BY PRODUCT
      70. | 6.70 REST OF APAC MARKET ANALYSIS BY TYPE
      71. | 6.71 REST OF APAC MARKET ANALYSIS BY CONNECTOR TYPE
      72. | 6.72 REST OF APAC MARKET ANALYSIS BY APPLICATION
      73. | 6.73 SOUTH AMERICA MARKET ANALYSIS
      74. | 6.74 BRAZIL MARKET ANALYSIS BY PRODUCT
      75. | 6.75 BRAZIL MARKET ANALYSIS BY TYPE
      76. | 6.76 BRAZIL MARKET ANALYSIS BY CONNECTOR TYPE
      77. | 6.77 BRAZIL MARKET ANALYSIS BY APPLICATION
      78. | 6.78 MEXICO MARKET ANALYSIS BY PRODUCT
      79. | 6.79 MEXICO MARKET ANALYSIS BY TYPE
      80. | 6.80 MEXICO MARKET ANALYSIS BY CONNECTOR TYPE
      81. | 6.81 MEXICO MARKET ANALYSIS BY APPLICATION
      82. | 6.82 ARGENTINA MARKET ANALYSIS BY PRODUCT
      83. | 6.83 ARGENTINA MARKET ANALYSIS BY TYPE
      84. | 6.84 ARGENTINA MARKET ANALYSIS BY CONNECTOR TYPE
      85. | 6.85 ARGENTINA MARKET ANALYSIS BY APPLICATION
      86. | 6.86 REST OF SOUTH AMERICA MARKET ANALYSIS BY PRODUCT
      87. | 6.87 REST OF SOUTH AMERICA MARKET ANALYSIS BY TYPE
      88. | 6.88 REST OF SOUTH AMERICA MARKET ANALYSIS BY CONNECTOR TYPE
      89. | 6.89 REST OF SOUTH AMERICA MARKET ANALYSIS BY APPLICATION
      90. | 6.90 MEA MARKET ANALYSIS
      91. | 6.91 GCC COUNTRIES MARKET ANALYSIS BY PRODUCT
      92. | 6.92 GCC COUNTRIES MARKET ANALYSIS BY TYPE
      93. | 6.93 GCC COUNTRIES MARKET ANALYSIS BY CONNECTOR TYPE
      94. | 6.94 GCC COUNTRIES MARKET ANALYSIS BY APPLICATION
      95. | 6.95 SOUTH AFRICA MARKET ANALYSIS BY PRODUCT
      96. | 6.96 SOUTH AFRICA MARKET ANALYSIS BY TYPE
      97. | 6.97 SOUTH AFRICA MARKET ANALYSIS BY CONNECTOR TYPE
      98. | 6.98 SOUTH AFRICA MARKET ANALYSIS BY APPLICATION
      99. | 6.99 REST OF MEA MARKET ANALYSIS BY PRODUCT
      100. | 6.100 REST OF MEA MARKET ANALYSIS BY TYPE
      101. | 6.101 REST OF MEA MARKET ANALYSIS BY CONNECTOR TYPE
      102. | 6.102 REST OF MEA MARKET ANALYSIS BY APPLICATION
      103. | 6.103 KEY BUYING CRITERIA OF SEMICONDUCTOR & ELECTRONICS
      104. | 6.104 RESEARCH PROCESS OF MRFR
      105. | 6.105 DRO ANALYSIS OF SEMICONDUCTOR & ELECTRONICS
      106. | 6.106 DRIVERS IMPACT ANALYSIS: SEMICONDUCTOR & ELECTRONICS
      107. | 6.107 RESTRAINTS IMPACT ANALYSIS: SEMICONDUCTOR & ELECTRONICS
      108. | 6.108 SUPPLY / VALUE CHAIN: SEMICONDUCTOR & ELECTRONICS
      109. | 6.109 SEMICONDUCTOR & ELECTRONICS, BY PRODUCT, 2024 (% SHARE)
      110. | 6.110 SEMICONDUCTOR & ELECTRONICS, BY PRODUCT, 2024 TO 2035 (USD Billion)
      111. | 6.111 SEMICONDUCTOR & ELECTRONICS, BY TYPE, 2024 (% SHARE)
      112. | 6.112 SEMICONDUCTOR & ELECTRONICS, BY TYPE, 2024 TO 2035 (USD Billion)
      113. | 6.113 SEMICONDUCTOR & ELECTRONICS, BY CONNECTOR TYPE, 2024 (% SHARE)
      114. | 6.114 SEMICONDUCTOR & ELECTRONICS, BY CONNECTOR TYPE, 2024 TO 2035 (USD Billion)
      115. | 6.115 SEMICONDUCTOR & ELECTRONICS, BY APPLICATION, 2024 (% SHARE)
      116. | 6.116 SEMICONDUCTOR & ELECTRONICS, BY APPLICATION, 2024 TO 2035 (USD Billion)
      117. | 6.117 BENCHMARKING OF MAJOR COMPETITORS
    7. LIST OF TABLES
      1. | 7.1 LIST OF ASSUMPTIONS
      2. | | 7.1.1
      3. | 7.2 North America MARKET SIZE ESTIMATES; FORECAST
      4. | | 7.2.1 BY PRODUCT, 2025-2035 (USD Billion)
      5. | | 7.2.2 BY TYPE, 2025-2035 (USD Billion)
      6. | | 7.2.3 BY CONNECTOR TYPE, 2025-2035 (USD Billion)
      7. | | 7.2.4 BY APPLICATION, 2025-2035 (USD Billion)
      8. | 7.3 US MARKET SIZE ESTIMATES; FORECAST
      9. | | 7.3.1 BY PRODUCT, 2025-2035 (USD Billion)
      10. | | 7.3.2 BY TYPE, 2025-2035 (USD Billion)
      11. | | 7.3.3 BY CONNECTOR TYPE, 2025-2035 (USD Billion)
      12. | | 7.3.4 BY APPLICATION, 2025-2035 (USD Billion)
      13. | 7.4 Canada MARKET SIZE ESTIMATES; FORECAST
      14. | | 7.4.1 BY PRODUCT, 2025-2035 (USD Billion)
      15. | | 7.4.2 BY TYPE, 2025-2035 (USD Billion)
      16. | | 7.4.3 BY CONNECTOR TYPE, 2025-2035 (USD Billion)
      17. | | 7.4.4 BY APPLICATION, 2025-2035 (USD Billion)
      18. | 7.5 Europe MARKET SIZE ESTIMATES; FORECAST
      19. | | 7.5.1 BY PRODUCT, 2025-2035 (USD Billion)
      20. | | 7.5.2 BY TYPE, 2025-2035 (USD Billion)
      21. | | 7.5.3 BY CONNECTOR TYPE, 2025-2035 (USD Billion)
      22. | | 7.5.4 BY APPLICATION, 2025-2035 (USD Billion)
      23. | 7.6 Germany MARKET SIZE ESTIMATES; FORECAST
      24. | | 7.6.1 BY PRODUCT, 2025-2035 (USD Billion)
      25. | | 7.6.2 BY TYPE, 2025-2035 (USD Billion)
      26. | | 7.6.3 BY CONNECTOR TYPE, 2025-2035 (USD Billion)
      27. | | 7.6.4 BY APPLICATION, 2025-2035 (USD Billion)
      28. | 7.7 UK MARKET SIZE ESTIMATES; FORECAST
      29. | | 7.7.1 BY PRODUCT, 2025-2035 (USD Billion)
      30. | | 7.7.2 BY TYPE, 2025-2035 (USD Billion)
      31. | | 7.7.3 BY CONNECTOR TYPE, 2025-2035 (USD Billion)
      32. | | 7.7.4 BY APPLICATION, 2025-2035 (USD Billion)
      33. | 7.8 France MARKET SIZE ESTIMATES; FORECAST
      34. | | 7.8.1 BY PRODUCT, 2025-2035 (USD Billion)
      35. | | 7.8.2 BY TYPE, 2025-2035 (USD Billion)
      36. | | 7.8.3 BY CONNECTOR TYPE, 2025-2035 (USD Billion)
      37. | | 7.8.4 BY APPLICATION, 2025-2035 (USD Billion)
      38. | 7.9 Russia MARKET SIZE ESTIMATES; FORECAST
      39. | | 7.9.1 BY PRODUCT, 2025-2035 (USD Billion)
      40. | | 7.9.2 BY TYPE, 2025-2035 (USD Billion)
      41. | | 7.9.3 BY CONNECTOR TYPE, 2025-2035 (USD Billion)
      42. | | 7.9.4 BY APPLICATION, 2025-2035 (USD Billion)
      43. | 7.10 Italy MARKET SIZE ESTIMATES; FORECAST
      44. | | 7.10.1 BY PRODUCT, 2025-2035 (USD Billion)
      45. | | 7.10.2 BY TYPE, 2025-2035 (USD Billion)
      46. | | 7.10.3 BY CONNECTOR TYPE, 2025-2035 (USD Billion)
      47. | | 7.10.4 BY APPLICATION, 2025-2035 (USD Billion)
      48. | 7.11 Spain MARKET SIZE ESTIMATES; FORECAST
      49. | | 7.11.1 BY PRODUCT, 2025-2035 (USD Billion)
      50. | | 7.11.2 BY TYPE, 2025-2035 (USD Billion)
      51. | | 7.11.3 BY CONNECTOR TYPE, 2025-2035 (USD Billion)
      52. | | 7.11.4 BY APPLICATION, 2025-2035 (USD Billion)
      53. | 7.12 Rest of Europe MARKET SIZE ESTIMATES; FORECAST
      54. | | 7.12.1 BY PRODUCT, 2025-2035 (USD Billion)
      55. | | 7.12.2 BY TYPE, 2025-2035 (USD Billion)
      56. | | 7.12.3 BY CONNECTOR TYPE, 2025-2035 (USD Billion)
      57. | | 7.12.4 BY APPLICATION, 2025-2035 (USD Billion)
      58. | 7.13 APAC MARKET SIZE ESTIMATES; FORECAST
      59. | | 7.13.1 BY PRODUCT, 2025-2035 (USD Billion)
      60. | | 7.13.2 BY TYPE, 2025-2035 (USD Billion)
      61. | | 7.13.3 BY CONNECTOR TYPE, 2025-2035 (USD Billion)
      62. | | 7.13.4 BY APPLICATION, 2025-2035 (USD Billion)
      63. | 7.14 China MARKET SIZE ESTIMATES; FORECAST
      64. | | 7.14.1 BY PRODUCT, 2025-2035 (USD Billion)
      65. | | 7.14.2 BY TYPE, 2025-2035 (USD Billion)
      66. | | 7.14.3 BY CONNECTOR TYPE, 2025-2035 (USD Billion)
      67. | | 7.14.4 BY APPLICATION, 2025-2035 (USD Billion)
      68. | 7.15 India MARKET SIZE ESTIMATES; FORECAST
      69. | | 7.15.1 BY PRODUCT, 2025-2035 (USD Billion)
      70. | | 7.15.2 BY TYPE, 2025-2035 (USD Billion)
      71. | | 7.15.3 BY CONNECTOR TYPE, 2025-2035 (USD Billion)
      72. | | 7.15.4 BY APPLICATION, 2025-2035 (USD Billion)
      73. | 7.16 Japan MARKET SIZE ESTIMATES; FORECAST
      74. | | 7.16.1 BY PRODUCT, 2025-2035 (USD Billion)
      75. | | 7.16.2 BY TYPE, 2025-2035 (USD Billion)
      76. | | 7.16.3 BY CONNECTOR TYPE, 2025-2035 (USD Billion)
      77. | | 7.16.4 BY APPLICATION, 2025-2035 (USD Billion)
      78. | 7.17 South Korea MARKET SIZE ESTIMATES; FORECAST
      79. | | 7.17.1 BY PRODUCT, 2025-2035 (USD Billion)
      80. | | 7.17.2 BY TYPE, 2025-2035 (USD Billion)
      81. | | 7.17.3 BY CONNECTOR TYPE, 2025-2035 (USD Billion)
      82. | | 7.17.4 BY APPLICATION, 2025-2035 (USD Billion)
      83. | 7.18 Malaysia MARKET SIZE ESTIMATES; FORECAST
      84. | | 7.18.1 BY PRODUCT, 2025-2035 (USD Billion)
      85. | | 7.18.2 BY TYPE, 2025-2035 (USD Billion)
      86. | | 7.18.3 BY CONNECTOR TYPE, 2025-2035 (USD Billion)
      87. | | 7.18.4 BY APPLICATION, 2025-2035 (USD Billion)
      88. | 7.19 Thailand MARKET SIZE ESTIMATES; FORECAST
      89. | | 7.19.1 BY PRODUCT, 2025-2035 (USD Billion)
      90. | | 7.19.2 BY TYPE, 2025-2035 (USD Billion)
      91. | | 7.19.3 BY CONNECTOR TYPE, 2025-2035 (USD Billion)
      92. | | 7.19.4 BY APPLICATION, 2025-2035 (USD Billion)
      93. | 7.20 Indonesia MARKET SIZE ESTIMATES; FORECAST
      94. | | 7.20.1 BY PRODUCT, 2025-2035 (USD Billion)
      95. | | 7.20.2 BY TYPE, 2025-2035 (USD Billion)
      96. | | 7.20.3 BY CONNECTOR TYPE, 2025-2035 (USD Billion)
      97. | | 7.20.4 BY APPLICATION, 2025-2035 (USD Billion)
      98. | 7.21 Rest of APAC MARKET SIZE ESTIMATES; FORECAST
      99. | | 7.21.1 BY PRODUCT, 2025-2035 (USD Billion)
      100. | | 7.21.2 BY TYPE, 2025-2035 (USD Billion)
      101. | | 7.21.3 BY CONNECTOR TYPE, 2025-2035 (USD Billion)
      102. | | 7.21.4 BY APPLICATION, 2025-2035 (USD Billion)
      103. | 7.22 South America MARKET SIZE ESTIMATES; FORECAST
      104. | | 7.22.1 BY PRODUCT, 2025-2035 (USD Billion)
      105. | | 7.22.2 BY TYPE, 2025-2035 (USD Billion)
      106. | | 7.22.3 BY CONNECTOR TYPE, 2025-2035 (USD Billion)
      107. | | 7.22.4 BY APPLICATION, 2025-2035 (USD Billion)
      108. | 7.23 Brazil MARKET SIZE ESTIMATES; FORECAST
      109. | | 7.23.1 BY PRODUCT, 2025-2035 (USD Billion)
      110. | | 7.23.2 BY TYPE, 2025-2035 (USD Billion)
      111. | | 7.23.3 BY CONNECTOR TYPE, 2025-2035 (USD Billion)
      112. | | 7.23.4 BY APPLICATION, 2025-2035 (USD Billion)
      113. | 7.24 Mexico MARKET SIZE ESTIMATES; FORECAST
      114. | | 7.24.1 BY PRODUCT, 2025-2035 (USD Billion)
      115. | | 7.24.2 BY TYPE, 2025-2035 (USD Billion)
      116. | | 7.24.3 BY CONNECTOR TYPE, 2025-2035 (USD Billion)
      117. | | 7.24.4 BY APPLICATION, 2025-2035 (USD Billion)
      118. | 7.25 Argentina MARKET SIZE ESTIMATES; FORECAST
      119. | | 7.25.1 BY PRODUCT, 2025-2035 (USD Billion)
      120. | | 7.25.2 BY TYPE, 2025-2035 (USD Billion)
      121. | | 7.25.3 BY CONNECTOR TYPE, 2025-2035 (USD Billion)
      122. | | 7.25.4 BY APPLICATION, 2025-2035 (USD Billion)
      123. | 7.26 Rest of South America MARKET SIZE ESTIMATES; FORECAST
      124. | | 7.26.1 BY PRODUCT, 2025-2035 (USD Billion)
      125. | | 7.26.2 BY TYPE, 2025-2035 (USD Billion)
      126. | | 7.26.3 BY CONNECTOR TYPE, 2025-2035 (USD Billion)
      127. | | 7.26.4 BY APPLICATION, 2025-2035 (USD Billion)
      128. | 7.27 MEA MARKET SIZE ESTIMATES; FORECAST
      129. | | 7.27.1 BY PRODUCT, 2025-2035 (USD Billion)
      130. | | 7.27.2 BY TYPE, 2025-2035 (USD Billion)
      131. | | 7.27.3 BY CONNECTOR TYPE, 2025-2035 (USD Billion)
      132. | | 7.27.4 BY APPLICATION, 2025-2035 (USD Billion)
      133. | 7.28 GCC Countries MARKET SIZE ESTIMATES; FORECAST
      134. | | 7.28.1 BY PRODUCT, 2025-2035 (USD Billion)
      135. | | 7.28.2 BY TYPE, 2025-2035 (USD Billion)
      136. | | 7.28.3 BY CONNECTOR TYPE, 2025-2035 (USD Billion)
      137. | | 7.28.4 BY APPLICATION, 2025-2035 (USD Billion)
      138. | 7.29 South Africa MARKET SIZE ESTIMATES; FORECAST
      139. | | 7.29.1 BY PRODUCT, 2025-2035 (USD Billion)
      140. | | 7.29.2 BY TYPE, 2025-2035 (USD Billion)
      141. | | 7.29.3 BY CONNECTOR TYPE, 2025-2035 (USD Billion)
      142. | | 7.29.4 BY APPLICATION, 2025-2035 (USD Billion)
      143. | 7.30 Rest of MEA MARKET SIZE ESTIMATES; FORECAST
      144. | | 7.30.1 BY PRODUCT, 2025-2035 (USD Billion)
      145. | | 7.30.2 BY TYPE, 2025-2035 (USD Billion)
      146. | | 7.30.3 BY CONNECTOR TYPE, 2025-2035 (USD Billion)
      147. | | 7.30.4 BY APPLICATION, 2025-2035 (USD Billion)
      148. | 7.31 PRODUCT LAUNCH/PRODUCT DEVELOPMENT/APPROVAL
      149. | | 7.31.1
      150. | 7.32 ACQUISITION/PARTNERSHIP
      151. | | 7.32.1

    USB Devices Market Segmentation Tab

    USB Devices Product Outlook (USD Billion, 2018-2032)

    • Webcam
    • USB Flash Drives
    • Memory Card Readers
    • Digital Audio Players
    • Computer Peripherals
    • Scanners & Printers
    • Others

    USB Devices Type Outlook (USD Billion, 2018-2032)

    • USB 1.0
    • USB 2.0
    • USB 3.0
    • Others

    USB Devices Connector Type Outlook (USD Billion, 2018-2032)

    • Type A
    • Type B
    • Type C
    • Lightning Connector

    USB Devices Application Outlook (USD Billion, 2018-2032)

    • Consumer Electronics
    • IT & Telecommunication
    • Automotive
    • Healthcare & Medical Devices
    • Others

    USB Devices Regional Outlook (USD Billion, 2018-2032)

    • North America Outlook (USD Billion, 2018-2032)

      • North America USB Devices by Product
        • Webcam
        • USB Flash Drives
        • Memory Card Readers
        • Digital Audio Players
        • Computer Peripherals
        • Scanners & Printers
        • Others
      • North America USB Devices by Type
        • USB 1.0
        • USB 2.0
        • USB 3.0
        • Others
      • North America USB Devices by Connector Type
        • Type A
        • Type B
        • Type C
        • Lightning Connector
      • North America USB Devices by Application
        • Consumer Electronics
        • IT & Telecommunication
        • Automotive
        • Healthcare & Medical Devices
        • Others
      • US Outlook (USD Billion, 2018-2032)

      • US USB Devices by Product
        • Webcam
        • USB Flash Drives
        • Memory Card Readers
        • Digital Audio Players
        • Computer Peripherals
        • Scanners & Printers
        • Others
      • US USB Devices by Type
        • USB 1.0
        • USB 2.0
        • USB 3.0
        • Others
      • US USB Devices by Connector Type
        • Type A
        • Type B
        • Type C
        • Lightning Connector
      • US USB Devices by Application
        • Consumer Electronics
        • IT & Telecommunication
        • Automotive
        • Healthcare & Medical Devices
        • Others
      • Mexico Outlook (USD Billion, 2018-2032)

      • Mexico USB Devices by Product
        • Webcam
        • USB Flash Drives
        • Memory Card Readers
        • Digital Audio Players
        • Computer Peripherals
        • Scanners & Printers
        • Others
      • Mexico USB Devices by Type
        • USB 1.0
        • USB 2.0
        • USB 3.0
        • Others
      • Mexico USB Devices by Connector Type
        • Type A
        • Type B
        • Type C
        • Lightning Connector
        •  
      • Mexico USB Devices by Application
        • Consumer Electronics
        • IT & Telecommunication
        • Automotive
        • Healthcare & Medical Devices
        • Others
    • Europe Outlook (USD Billion, 2018-2032)

      • Europe USB Devices by Product
        • Webcam
        • USB Flash Drives
        • Memory Card Readers
        • Digital Audio Players
        • Computer Peripherals
        • Scanners & Printers
        • Others
      • Europe USB Devices by Type
        • USB 1.0
        • USB 2.0
        • USB 3.0
        • Others
      • Europe USB Devices by Connector Type
        • Type A
        • Type B
        • Type C
        • Lightning Connector
      • Europe USB Devices by Application
        • Consumer Electronics
        • IT & Telecommunication
        • Automotive
        • Healthcare & Medical Devices
        • Others
      • Germany Outlook (USD Billion, 2018-2032)

      • Germany USB Devices by Product
        • Webcam
        • USB Flash Drives
        • Memory Card Readers
        • Digital Audio Players
        • Computer Peripherals
        • Scanners & Printers
        • Others
      • Germany USB Devices by Type
        • USB 1.0
        • USB 2.0
        • USB 3.0
        • Others
      • Germany USB Devices by Connector Type
        • Type A
        • Type B
        • Type C
        • Lightning Connector
      • Germany USB Devices by Application
        • Consumer Electronics
        • IT & Telecommunication
        • Automotive
        • Healthcare & Medical Devices
        • Others
      • France Outlook (USD Billion, 2018-2032)

      • France USB Devices by Product
        • Webcam
        • USB Flash Drives
        • Memory Card Readers
        • Digital Audio Players
        • Computer Peripherals
        • Scanners & Printers
        • Others
      • France USB Devices by Type
        • USB 1.0
        • USB 2.0
        • USB 3.0
        • Others
      • France USB Devices by Connector Type
        • Type A
        • Type B
        • Type C
        • Lightning Connector
      • France USB Devices by Application
        • Consumer Electronics
        • IT & Telecommunication
        • Automotive
        • Healthcare & Medical Devices
        • Others
      • UK Outlook (USD Billion, 2018-2032)

      • UK USB Devices by Product
        • Webcam
        • USB Flash Drives
        • Memory Card Readers
        • Digital Audio Players
        • Computer Peripherals
        • Scanners & Printers
        • Others
      • UK USB Devices by Type
        • USB 1.0
        • USB 2.0
        • USB 3.0
        • Others
      • UK USB Devices by Connector Type
        • Type A
        • Type B
        • Type C
        • Lightning Connector
      • UK USB Devices by Application
        • Consumer Electronics
        • IT & Telecommunication
        • Automotive
        • Healthcare & Medical Devices
        • Others
      • ITALY Outlook (USD Billion, 2018-2032)

      • ITALY USB Devices by Product
        • Webcam
        • USB Flash Drives
        • Memory Card Readers
        • Digital Audio Players
        • Computer Peripherals
        • Scanners & Printers
        • Others
      • ITALY USB Devices by Type
        • USB 1.0
        • USB 2.0
        • USB 3.0
        • Others
      • ITALY USB Devices by Connector Type
        • Type A
        • Type B
        • Type C
        • Lightning Connector
      • ITALY USB Devices by Application
        • Consumer Electronics
        • IT & Telecommunication
        • Automotive
        • Healthcare & Medical Devices
        • Others
      • SPAIN Outlook (USD Billion, 2018-2032)

      • Spain USB Devices by Product
        • Webcam
        • USB Flash Drives
        • Memory Card Readers
        • Digital Audio Players
        • Computer Peripherals
        • Scanners & Printers
        • Others
      • Spain USB Devices by Type
        • USB 1.0
        • USB 2.0
        • USB 3.0
        • Others
      • Spain USB Devices by Connector Type
        • Type A
        • Type B
        • Type C
        • Lightning Connector
      • Spain USB Devices by Application
        • Consumer Electronics
        • IT & Telecommunication
        • Automotive
        • Healthcare & Medical Devices
        • Others
      • Rest Of Europe Outlook (USD Billion, 2018-2032)

      • Rest Of Europe USB Devices by Product
        • Webcam
        • USB Flash Drives
        • Memory Card Readers
        • Digital Audio Players
        • Computer Peripherals
        • Scanners & Printers
        • Others
      • REST OF EUROPE USB Devices by Type
        • USB 1.0
        • USB 2.0
        • USB 3.0
        • Others
      • REST OF EUROPE USB Devices by Connector Type
        • Type A
        • Type B
        • Type C
        • Lightning Connector
      • REST OF EUROPE USB Devices by Application
        • Consumer Electronics
        • IT & Telecommunication
        • Automotive
        • Healthcare & Medical Devices
        • Others
    • Asia-Pacific Outlook (USD Billion, 2018-2032)

      • Asia-Pacific USB Devices by Product
        • Webcam
        • USB Flash Drives
        • Memory Card Readers
        • Digital Audio Players
        • Computer Peripherals
        • Scanners & Printers
        • Others
      • Asia-Pacific USB Devices by Type
        • USB 1.0
        • USB 2.0
        • USB 3.0
        • Others
      • Asia-Pacific USB Devices by Connector Type
        • Type A
        • Type B
        • Type C
        • Lightning Connector
      • Asia-Pacific USB Devices by Application
        • Consumer Electronics
        • IT & Telecommunication
        • Automotive
        • Healthcare & Medical Devices
        • Others
      • China Outlook (USD Billion, 2018-2032)

      • China USB Devices by Product
        • Webcam
        • USB Flash Drives
        • Memory Card Readers
        • Digital Audio Players
        • Computer Peripherals
        • Scanners & Printers
        • Others
      • China USB Devices by Type
        • USB 1.0
        • USB 2.0
        • USB 3.0
        • Others
      • China USB Devices by Connector Type
        • Type A
        • Type B
        • Type C
        • Lightning Connector
      • China USB Devices by Application
        • Consumer Electronics
        • IT & Telecommunication
        • Automotive
        • Healthcare & Medical Devices
        • Others
      • Japan Outlook (USD Billion, 2018-2032)

      • Japan USB Devices by Product
        • Webcam
        • USB Flash Drives
        • Memory Card Readers
        • Digital Audio Players
        • Computer Peripherals
        • Scanners & Printers
        • Others
      • Japan USB Devices by Type
        • USB 1.0
        • USB 2.0
        • USB 3.0
        • Others
      • Japan USB Devices by Connector Type
        • Type A
        • Type B
        • Type C
        • Lightning Connector
      • Japan USB Devices by Application
        • Consumer Electronics
        • IT & Telecommunication
        • Automotive
        • Healthcare & Medical Devices
        • Others
      • India Outlook (USD Billion, 2018-2032)

      • India USB Devices by Product
        • Webcam
        • USB Flash Drives
        • Memory Card Readers
        • Digital Audio Players
        • Computer Peripherals
        • Scanners & Printers
        • Others
      • India USB Devices by Type
        • USB 1.0
        • USB 2.0
        • USB 3.0
        • Others
      • India USB Devices by Connector Type
        • Type A
        • Type B
        • Type C
        • Lightning Connector
      • India USB Devices by Application
        • Consumer Electronics
        • IT & Telecommunication
        • Automotive
        • Healthcare & Medical Devices
        • Others
      • Australia Outlook (USD Billion, 2018-2032)

      • Australia USB Devices by Product
        • Webcam
        • USB Flash Drives
        • Memory Card Readers
        • Digital Audio Players
        • Computer Peripherals
        • Scanners & Printers
        • Others
      • Australia USB Devices by Type
        • USB 1.0
        • USB 2.0
        • USB 3.0
        • Others
      • Australia USB Devices by Connector Type
        • Type A
        • Type B
        • Type C
        • Lightning Connector
      • Australia USB Devices by Application
        • Consumer Electronics
        • IT & Telecommunication
        • Automotive
        • Healthcare & Medical Devices
        • Others
      • Rest of Asia-Pacific Outlook (USD Billion, 2018-2032)

      • Rest of Asia-Pacific USB Devices by Product
        • Webcam
        • USB Flash Drives
        • Memory Card Readers
        • Digital Audio Players
        • Computer Peripherals
        • Scanners & Printers
        • Others
      • Rest of Asia-Pacific USB Devices by Type
        • USB 1.0
        • USB 2.0
        • USB 3.0
        • Others
      • Rest of Asia-Pacific USB Devices by Connector Type
        • Type A
        • Type B
        • Type C
        • Lightning Connector
      • Rest of Asia-Pacific USB Devices by Application
        • Consumer Electronics
        • IT & Telecommunication
        • Automotive
        • Healthcare & Medical Devices
        • Others
    • Rest of the World Outlook (USD Billion, 2018-2032)

      • Rest of the World USB Devices by Product
        • Webcam
        • USB Flash Drives
        • Memory Card Readers
        • Digital Audio Players
        • Computer Peripherals
        • Scanners & Printers
        • Others
      • Rest of the World USB Devices by Type
        • USB 1.0
        • USB 2.0
        • USB 3.0
        • Others
      • Rest of the World USB Devices by Connector Type
        • Type A
        • Type B
        • Type C
        • Lightning Connector
      • Rest of the World USB Devices by Application
        • Consumer Electronics
        • IT & Telecommunication
        • Automotive
        • Healthcare & Medical Devices
        • Others
      • Middle East Outlook (USD Billion, 2018-2032)

      • Middle East USB Devices by Product
        • Webcam
        • USB Flash Drives
        • Memory Card Readers
        • Digital Audio Players
        • Computer Peripherals
        • Scanners & Printers
        • Others
      • Middle East USB Devices by Type
        • USB 1.0
        • USB 2.0
        • USB 3.0
        • Others
      • Middle East USB Devices by Connector Type
        • Type A
        • Type B
        • Type C
        • Lightning Connector
      • Middle East USB Devices by Application
        • Consumer Electronics
        • IT & Telecommunication
        • Automotive
        • Healthcare & Medical Devices
        • Others
      • Africa Outlook (USD Billion, 2018-2032)

      • Africa USB Devices by Product
        • Webcam
        • USB Flash Drives
        • Memory Card Readers
        • Digital Audio Players
        • Computer Peripherals
        • Scanners & Printers
        • Others
      • Africa USB Devices by Type
        • USB 1.0
        • USB 2.0
        • USB 3.0
        • Others
      • Africa USB Devices by Connector Type
        • Type A
        • Type B
        • Type C
        • Lightning Connector
      • Africa USB Devices by Application
        • Consumer Electronics
        • IT & Telecommunication
        • Automotive
        • Healthcare & Medical Devices
        • Others
      • Latin America Outlook (USD Billion, 2018-2032)

      • Latin America USB Devices by Product
        • Webcam
        • USB Flash Drives
        • Memory Card Readers
        • Digital Audio Players
        • Computer Peripherals
        • Scanners & Printers
        • Others
      • Latin America USB Devices by Type
        • USB 1.0
        • USB 2.0
        • USB 3.0
        • Others
      • Latin America USB Devices by Connector Type
        • Type A
        • Type B
        • Type C
        • Lightning Connector
      • Latin America USB Devices by Application
        • Consumer Electronics
        • IT & Telecommunication
        • Automotive
        • Healthcare & Medical Devices
        • Others
    Infographic

    Free Sample Request

    Kindly complete the form below to receive a free sample of this Report

    Get Free Sample

    Customer Strories

    “I am very pleased with how market segments have been defined in a relevant way for my purposes (such as "Portable Freezers & refrigerators" and "last-mile"). In general the report is well structured. Thanks very much for your efforts.”

    Victoria Milne

    Founder
    Case Study
    Chemicals and Materials

    Compare Licence

    ×
    Features License Type
    Single User Multiuser License Enterprise User
    Price $4,950 $5,950 $7,250
    Maximum User Access Limit 1 User Upto 10 Users Unrestricted Access Throughout the Organization
    Free Customization
    Direct Access to Analyst
    Deliverable Format
    Platform Access
    Discount on Next Purchase 10% 15% 15%
    Printable Versions