• Cat-intel
  • MedIntelliX
  • Resources
  • About Us
  • Request Free Sample ×

    Kindly complete the form below to receive a free sample of this Report

    Leading companies partner with us for data-driven Insights

    clients tt-cursor

    Underground Utility Mapping Market

    ID: MRFR/IA - E/23025-HCR
    128 Pages
    Snehal Singh
    September 2025

    Underground Utility Mapping Market Research Report By Technology (Electromagnetic Induction, Ground Penetrating Radar, Laser Scanning, Acoustic Emission, Radio Detection), By Deployment (In-house, Outsourced), By End-Use Sector (Construction, Utilities, Engineering, Telecommunications), By Application (Damage Prevention, Asset Management, Planning and Design, Utility Relocation), By Data Type (2D Mapping, 3D Mapping, Point Data, Line Data) and By Regional (North America, Europe, South America, Asia Pacific, Middle East and Africa) - Forecast...

    Share:
    Download PDF ×

    We do not share your information with anyone. However, we may send you emails based on your report interest from time to time. You may contact us at any time to opt-out.

    Underground Utility Mapping Market Research Report - Forecast till 2034 Infographic
    Purchase Options
    $ 4,950.0
    $ 5,950.0
    $ 7,250.0
    Table of Contents

    Underground Utility Mapping Market Summary

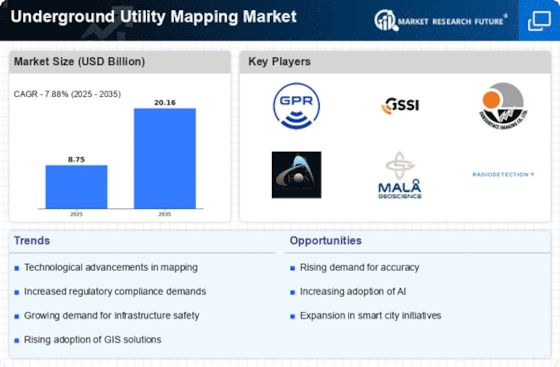
    The Global Underground Utility Mapping Market is projected to grow significantly from 8.75 USD Billion in 2024 to 20.2 USD Billion by 2035.

    Key Market Trends & Highlights

    Underground Utility Mapping Key Trends and Highlights

    • The market is expected to experience a compound annual growth rate (CAGR) of 7.88% from 2025 to 2035.
    • By 2035, the market valuation is anticipated to reach 20.2 USD Billion, reflecting robust growth.
    • In 2024, the market is valued at 8.75 USD Billion, indicating a strong foundation for future expansion.
    • Growing adoption of advanced mapping technologies due to increasing infrastructure development is a major market driver.

    Market Size & Forecast

    2024 Market Size 8.75 (USD Billion)
    2035 Market Size 20.2 (USD Billion)
    CAGR (2025-2035) 7.88%

    Major Players

    GSSI, Leica Geosystems, Rycom Instruments, Inc., Pure Technologies, VTrack Systems Pty Ltd, x Co., LLC, Mettler-Toledo International Inc., Utility Survey Systems Ltd., VivaxMetrotech Corp., EarthData, Inc., Subsurface Utility Engineering Inc., Radiodetection Ltd. (Hexagon), Penetrox, Atlas Copco, ABCutieye Ltd.

    Underground Utility Mapping Market Trends

    There is expected to be a rapid increase in demand in the Global market of Underground Utility Mapping Market as the underground utility networks are ever-expanding in their structure and becoming more complicated. Improving safety during excavation and construction works, growing recognition of the necessity of the management of underground assets, and legal requirements for utility mapping are the reasons fuelling the market for utility mapping.

    Investing in GPR and LiDAR technologies for mapping purposes appears to be one of the trends that are likely to develop over time. Recent trends have shown, however, that there is a move towards more mobile and virtual or cloud-based mapping platforms which allow users to access data in real-time and facilitate better teamwork between the parties involved.

    The increasing complexity of urban infrastructure necessitates advanced underground utility mapping techniques to enhance safety and efficiency in construction and maintenance activities.

    U.S. Department of Transportation

    Underground Utility Mapping Market Drivers

    Market Growth Projections

    The Global Underground Utility Mapping Market Industry is poised for substantial growth, with projections indicating a market size of 8.75 USD Billion in 2024 and an anticipated increase to 20.2 USD Billion by 2035. This growth reflects a compound annual growth rate of 7.88% from 2025 to 2035, driven by various factors including technological advancements, regulatory compliance, and rising awareness of utility location services. The market's expansion is indicative of the increasing importance of accurate utility mapping in infrastructure development and urban planning.

    Increasing Infrastructure Development

    The ongoing expansion of infrastructure projects globally drives the demand for the Global Underground Utility Mapping Market Industry. As urbanization accelerates, cities require extensive utility mapping to ensure the safe installation and maintenance of utilities such as water, electricity, and telecommunications. For instance, in 2024, the market is projected to reach 8.75 USD Billion, reflecting the necessity for accurate mapping to prevent costly disruptions during construction. This trend is expected to continue as governments invest in smart city initiatives, further propelling the market's growth.

    Regulatory Compliance and Safety Standards

    The enforcement of stringent regulations regarding utility management and safety standards significantly influences the Global Underground Utility Mapping Market Industry. Governments worldwide are increasingly mandating accurate utility mapping to mitigate risks associated with underground utilities. For example, compliance with regulations can prevent accidents and enhance public safety, thereby increasing the demand for professional mapping services. As a result, the market is expected to grow at a compound annual growth rate of 7.88% from 2025 to 2035, reflecting the critical role of regulatory frameworks in shaping industry practices.

    Rising Awareness of Utility Location Services

    There is a growing awareness among construction and engineering firms regarding the importance of utility location services, which is a key driver for the Global Underground Utility Mapping Market Industry. This awareness stems from the need to avoid utility strikes, which can lead to severe financial and safety repercussions. As organizations recognize the value of investing in comprehensive mapping solutions, the market is likely to experience substantial growth. The increasing number of training programs and workshops aimed at educating stakeholders about utility mapping further supports this trend, indicating a shift towards proactive utility management.

    Environmental Considerations and Sustainability

    The increasing emphasis on environmental sustainability and responsible construction practices is shaping the Global Underground Utility Mapping Market Industry. Companies are now more inclined to adopt mapping solutions that minimize environmental impact during construction activities. This shift is driven by both regulatory pressures and public demand for sustainable practices. As a result, utility mapping is becoming integral to project planning, ensuring that underground utilities are accurately identified and managed. This trend is expected to contribute to the market's growth trajectory, aligning with global sustainability goals.

    Technological Advancements in Mapping Techniques

    Innovations in mapping technologies, including the use of ground-penetrating radar and 3D imaging, enhance the accuracy and efficiency of underground utility mapping. These advancements are pivotal for the Global Underground Utility Mapping Market Industry, as they enable better visualization of subsurface utilities, reducing the risk of damage during excavation. As these technologies become more accessible, their adoption is likely to increase, contributing to a projected market growth to 20.2 USD Billion by 2035. The integration of artificial intelligence and machine learning in mapping processes further indicates a transformative shift in how utilities are managed.

    Market Segment Insights

    Underground Utility Mapping Market Technology Insights

    The Underground Utility Mapping Market is segmented by Technology into Electromagnetic Induction, Ground Penetrating Radar, Laser Scanning, Acoustic Emission, and Radio Detection. In 2023, the largest market share is projected to be held by the technology segment of Electromagnetic Induction. The high accuracy of this technique, combined with its cost-effectiveness, is the chief reason for this projection. The fastest growth over this period is expected to be experienced by Ground Penetrating Radar, as this technique is uniquely able to penetrate into the ground more intensely and, therefore, supply a more detailed image than the other segment technologies.

    Laser Scanning is also expected to garner significant interest overall thanks to its unique attribute of being able to create 3D models of underground utilities. Still, the technologies of Acoustic Emission and Radio Detection will likely take a smaller share of the segment’s market. Factors such as an increase in demand for accurate and efficient utility mapping services across the construction, telecommunication, and transportation industries, along with the need for infrastructural expansion and the rising complexity in utility networks, are driving market growth.

    The highest growth is expected in the Asia-Pacific region, where a corresponding need for the services in infrastructural development projects is likely to drive demand.

    Source: Primary Research, Secondary Research, MRFR Database and Analyst Review

    Underground Utility Mapping Market Deployment Insights

    The deployment segment of the Underground Utility Mapping Market is further segmented into In-house and Outsourced. Among these, the Outsourced segment captured the highest market share in 2023 but the Outsourced segment is expected to maintain the highest growth during the forecast period. The growth of the segment is attributed to the increased adoption of outsourcing by the utility companies. The adoption of outsourcing reduces the cost, increases the efficiency and allows the companies to access the specialized expertise to perform the required functions.

    The in-house segment will show a considerable growth rate during the forecast period on account of the additional need to retain the data and growing security concerns. Overall, the deployment segment is expected to show considerable contribution to the growth of the Global Underground Utility Mapping Market. Both the segments will play a crucial role in the development owing to which the segment is estimated to show considerable growth.

    Underground Utility Mapping Market End-Use Sector Insights

    The end-use sector segmentation of the Underground Utility Mapping Market offers valuable insights into the diverse applications of underground utility mapping technologies. The construction sector is projected to dominate the market in 2023, accounting for approximately 38.7% of the global revenue. This dominance is attributed to the rising construction activities worldwide, particularly in emerging economies, where infrastructure development is a key priority. Utilities, including water and electricity companies, represent another significant end-use sector, holding a share of around 29.5% in 2023.

    The increasing emphasis on asset management and aging infrastructure maintenance drives growth in this segment. Engineering and telecommunications sectors also contribute to the market, with engineering firms utilizing underground utility mapping for project planning and telecommunications companies leveraging the technology for network expansion and maintenance.

    Underground Utility Mapping Market Application Insights

    Damage Prevention holds the largest market share within the Underground Utility Mapping Market, accounting for nearly 30% of the global revenue in 2023 and is projected to maintain its dominance throughout the forecast period. The growing emphasis on preventing damage to underground utilities, coupled with stringent government regulations, has fueled the demand for damage prevention solutions. Asset Management is another significant segment, driven by the need to optimize the performance and lifespan of underground assets. Utilities are increasingly leveraging mapping technologies to track and manage their assets, enabling proactive maintenance and reducing operational costs. 

    Planning and Design applications are also witnessing substantial growth due to the increasing adoption of underground construction projects. Mapping solutions provide valuable insights for selecting optimal routes, identifying potential conflicts, and ensuring the safety of underground infrastructure. Utility Relocation is another key segment, driven by the need to accommodate new infrastructure projects and urban development. Mapping technologies facilitate the accurate identification and relocation of underground utilities, minimizing disruptions and ensuring a smooth transition during construction activities.

    Underground Utility Mapping Market Data Type Insights

    The Underground Utility Mapping Market segmentation by Data Type includes 2D Mapping, 3D Mapping, Point Data, and Line Data. Among these, the 3D Mapping segment is expected to witness the highest growth rate during the forecast period, owing to the increasing adoption of advanced technologies, such as laser scanning and ground penetrating radar, for precise mapping and visualization of underground utilities. 

    The 2D Mapping segment currently holds the largest market share due to its wide acceptance and cost-effectiveness for basic utility mapping applications. Point Data and Line Data are also gaining traction, particularly in GIS and asset management systems, for capturing and managing spatial data related to underground utilities.

    Get more detailed insights about Underground Utility Mapping Market Research Report - Forecast till 2034

    Regional Insights

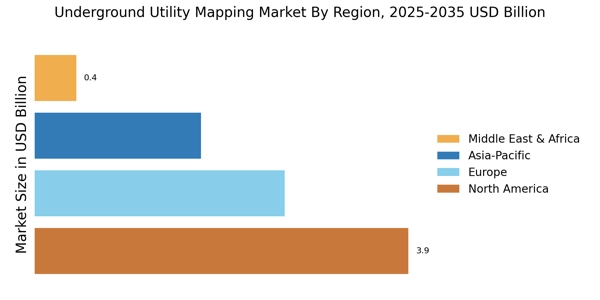
    The Underground Utility Mapping Market is segmented into North America, Europe, APAC, South America, and MEA. Among these regions, North America is expected to hold the largest market share in 2023, owing to the increasing adoption of underground utility mapping technologies by utility companies and government agencies. The region is also home to a large number of underground utility infrastructure, which is driving the demand for accurate and reliable mapping services. Europe is expected to be the second-largest market for underground utility mapping, followed by APAC.

    The APAC region is expected to experience significant growth in the coming years due to the increasing investment in infrastructure development and the growing awareness of the importance of underground utility mapping. South America and MEA are expected to be the smallest markets for underground utility mapping, but they are also expected to experience growth in the coming years.

    Underground Utility Mapping Market Regional Insights

    Source: Primary Research, Secondary Research, MRFR Database and Analyst Review

    Key Players and Competitive Insights

    Major players in the Underground Utility Mapping Market industry are investing heavily in research and development to enhance their product offerings and gain a competitive edge. They are also focusing on strategic partnerships and acquisitions to expand their market reach and customer base. Leading Underground Utility Mapping Market players are leveraging advanced technologies such as artificial intelligence (AI) and machine learning (ML) to improve the accuracy and efficiency of their mapping solutions. These technologies enable real-time data collection and analysis, providing utilities with actionable insights for better decision-making and asset management. 

    The Underground Utility Mapping Market landscape is expected to remain competitive, with key players continuously innovating and expanding their capabilities to meet the evolving needs of the industry. Among the leading players in the Underground Utility Mapping Market, GSSI stands out as a prominent provider of advanced geophysical solutions. The company offers a comprehensive suite of products and services for underground utility mapping, including ground-penetrating radar (GPR) systems, electromagnetic induction (EMI) sensors, and data collection and processing software. GSSI's GPR systems are renowned for their high-resolution imaging capabilities, enabling accurate detection and characterization of buried utilities. 

    The company also provides training and support services to help customers optimize their use of GSSI equipment and technologies. Another notable player in the Underground Utility Mapping Market is Leica Geosystems, a leading provider of surveying and mapping solutions. The company offers a range of underground mapping solutions, including laser scanners, total stations, and software for data processing and visualization. Leica Geosystems laser scanners are known for their high accuracy and speed, making them ideal for capturing detailed 3D representations of underground infrastructure. The company also provides a suite of software solutions that enable efficient data management, analysis, and presentation.

    With its strong track record and commitment to innovation, Leica Geosystems continues to be a key player in the Underground Utility Mapping Market.

    Key Companies in the Underground Utility Mapping Market market include

    Industry Developments

    The Underground Utility Mapping Market is projected to reach USD 14.87 billion by 2032, exhibiting a CAGR of 7.88% during the forecast period (2025-2034). The growing demand for accurate and reliable underground utility data for infrastructure development, coupled with the increasing adoption of advanced technologies such as GPR and LiDAR, is driving the market growth. Government initiatives and regulations mandating the use of underground utility mapping services are further contributing to the market expansion.

    Key market players are focusing on strategic partnerships and acquisitions to enhance their service offerings and expand their geographic reach. Recent advancements include the integration of artificial intelligence (AI) and machine learning (ML) algorithms to improve data accuracy and efficiency. The market is expected to witness significant growth in emerging economies, driven by rapid urbanization and infrastructure development.

    Future Outlook

    Underground Utility Mapping Market Future Outlook

    The Underground Utility Mapping Market is projected to grow at 7.88% CAGR from 2024 to 2035, driven by technological advancements, regulatory requirements, and urbanization.

    New opportunities lie in:

    • Develop AI-driven software for predictive utility mapping solutions.
    • Expand services in emerging markets with high infrastructure needs.
    • Integrate IoT technology for real-time utility monitoring and management.

    By 2035, the market is expected to achieve substantial growth, reflecting increased demand for advanced utility mapping solutions.

    Market Segmentation

    Underground Utility Mapping Market Regional Outlook

    • North America
    • Europe
    • South America
    • Asia Pacific
    • Middle East and Africa

    Underground Utility Mapping Market Data Type Outlook

    • North America
    • Europe
    • South America
    • Asia Pacific
    • Middle East and Africa

    Underground Utility Mapping Market Deployment Outlook

    • Construction
    • Utilities
    • Engineering
    • Telecommunications

    Underground Utility Mapping Market Technology Outlook

    • In-house
    • Outsourced

    Underground Utility Mapping Market Application Outlook

    • 2D Mapping
    • 3D Mapping
    • Point Data
    • Line Data

    Underground Utility Mapping Market End-Use Sector Outlook

    • Damage Prevention
    • Asset Management
    • Planning and Design
    • Utility Relocation

    Report Scope

    Report Attribute/Metric Details
    Market Size 2024    8.75 (USD Billion)
    Market Size 2025    9.44 (USD Billion)
    Market Size 2034    18.69 (USD Billion)
    Compound Annual Growth Rate (CAGR)      7.88% (2025 - 2034)
    Report Coverage Revenue Forecast, Competitive Landscape, Growth Factors, and Trends
    Base Year 2024
    Market Forecast Period 2025 - 2034
    Historical Data 2019 - 2023
    Market Forecast Units USD Billion
    Key Companies Profiled Rycom Instruments, Inc., Proceq SA, Pure Technologies, VTrack Systems Pty Ltd, Sewer Equipment Manufacturing Co., LLC, Mettler-Toledo International Inc., Utility Survey Systems Ltd., VivaxMetrotech Corp., EarthData, Inc., Subsurface Utility Engineering Inc., Radiodetection Ltd. (Hexagon), Penetrox, Atlas Copco AB, Cutieye Ltd.
    Segments Covered Technology, Deployment, End-Use Sector, Application, Data Type, Regional
    Key Market Opportunities Enhanced 3D mapping for precise asset localization AI and automation for real-time utility detection Growing demand from smart city and infrastructure projects Integration with GIS systems for data management and analysis Rising environmental concerns and the need for sustainable solutions
    Key Market Dynamics Increasing Infrastructure Development Growing Adoption of Geographic Information Systems GIS Technological Advancements in Mapping and Data Analysis Government Regulations and Safety Concerns Rise in Utility Relocation and Maintenance Projects
    Countries Covered North America, Europe, APAC, South America, MEA

    Market Highlights

    Author
    Snehal Singh
    Assistant Manager - Research

    High acumen in analyzing complex macro & micro markets with more than 6 years of work experience in the field of market research. By implementing her analytical skills in forecasting and estimation into market research reports, she has expertise in Packaging, Construction, and Equipment domains. She handles a team size of 20-25 resources and ensures smooth running of the projects, associated marketing activities, and client servicing.

    Leave a Comment

    FAQs

    What is the market size of the Global Underground Utility Mapping Market?

    The Underground Utility Mapping Market size was valued at USD 8.75 billion in 2024 and is projected to reach USD 18.69 billion by 2034, exhibiting a CAGR of 7.88% during the forecast period.

    Which region is expected to dominate the Global Underground Utility Mapping Market?

    North America is expected to dominate the Underground Utility Mapping Market throughout the forecast period. The region's dominance can be attributed to the presence of developed infrastructure, stringent regulations regarding underground utility mapping, and technological advancements in the field.

    What is the key application of Underground Utility Mapping?

    Underground Utility Mapping finds applications across various sectors, including infrastructure development, construction, and excavation. It helps prevent damage to underground utilities during construction projects, ensuring the safety of workers and the general public.

    Who are the key competitors in the Global Underground Utility Mapping Market?

    Prominent players in the Underground Utility Mapping Market include Leica Geosystems, Trimble Inc., Ditch Witch, Vermeer Corporation, and Vivax-Metrotech.

    What are the growth drivers for the Global Underground Utility Mapping Market?

    The growth of the Underground Utility Mapping Market can be attributed to increasing urbanization, rising demand for infrastructure development, and growing awareness of the importance of accurate underground utility mapping to prevent accidents and disruptions.

    What are the challenges faced by the Global Underground Utility Mapping Market?

    The Underground Utility Mapping Market faces challenges such as the high cost of equipment and software, the need for skilled professionals to operate the equipment, and the complexity of mapping underground utilities in dense urban areas.

    What are the future trends in the Global Underground Utility Mapping Market?

    The future of the Underground Utility Mapping Market is expected to be driven by advancements in technology, such as the integration of AI, machine learning, and robotics. These advancements will enhance the accuracy and efficiency of underground utility mapping, leading to improved safety and reduced project costs.

    What is the impact of COVID-19 on the Global Underground Utility Mapping Market?

    The COVID-19 pandemic had a moderate impact on the Global Underground Utility Mapping Market. While some projects were delayed due to lockdowns and travel restrictions, the market witnessed a rebound in demand as infrastructure projects resumed and governments prioritized digitalization initiatives.

    What are the key trends in the Global Underground Utility Mapping Market?

    Key trends shaping the Underground Utility Mapping Market include the adoption of cloud-based solutions, the rise of 3D mapping, and the integration of real-time data visualization tools. These trends are driven by the need for improved collaboration, enhanced decision-making, and increased efficiency in underground utility mapping projects.

    What are the emerging opportunities in the Global Underground Utility Mapping Market?

    Emerging opportunities in the Underground Utility Mapping Market include the growing adoption of GIS (Geographic Information Systems) for underground utility mapping, the development of autonomous mapping vehicles, and the use of AI for data analysis and predictive maintenance. These opportunities present significant growth potential for market players.

    1. 'TABLE OF CONTENTS
    2. EXECUTIVE SUMMARY
      1. Market Overview
      2. Key Findings
      3. Market Segmentation
      4. Competitive Landscape
      5. Challenges and Opportunities
      6. Future Outlook
    3. MARKET INTRODUCTION
      1. Definition
      2. Scope of the study
    4. Research Objective
      1. Assumption
        1. Limitations
    5. RESEARCH
    6. METHODOLOGY
      1. Overview
      2. Data Mining
      3. Secondary Research
      4. Primary Research
        1. Primary Interviews and Information Gathering
    7. Process
      1. Breakdown of Primary Respondents
      2. Forecasting Model
      3. Market Size Estimation
        1. Bottom-Up Approach
        2. Top-Down
    8. Approach
      1. Data Triangulation
      2. Validation
    9. MARKET
    10. DYNAMICS
      1. Overview
      2. Drivers
      3. Restraints
    11. Opportunities
    12. MARKET FACTOR ANALYSIS
      1. Value chain Analysis
      2. Porter''s Five Forces Analysis
        1. Bargaining Power of Suppliers
        2. Bargaining Power of Buyers
        3. Threat of New Entrants
        4. Threat of Substitutes
        5. Intensity of Rivalry
      3. COVID-19
    13. Impact Analysis
      1. Market Impact Analysis
        1. Regional Impact
        2. Opportunity and Threat Analysis
    14. UNDERGROUND
    15. UTILITY MAPPING MARKET, BY TECHNOLOGY (USD BILLION)
      1. Electromagnetic Induction
      2. Ground Penetrating Radar
      3. Laser Scanning
      4. Acoustic
    16. Emission
      1. Radio Detection
    17. UNDERGROUND UTILITY MAPPING MARKET,
    18. BY DEPLOYMENT (USD BILLION)
      1. In-house
      2. Outsourced
    19. UNDERGROUND
    20. UTILITY MAPPING MARKET, BY END-USE SECTOR (USD BILLION)
      1. Construction
      2. Utilities
      3. Engineering
      4. Telecommunications
    21. UNDERGROUND UTILITY MAPPING MARKET, BY APPLICATION (USD BILLION)
      1. Damage
    22. Prevention
      1. Asset Management
      2. Planning and Design
    23. Utility Relocation
    24. UNDERGROUND UTILITY MAPPING MARKET, BY DATA TYPE (USD
    25. BILLION)
      1. 2D Mapping
      2. 3D Mapping
      3. Point Data
      4. Line Data
    26. UNDERGROUND UTILITY MAPPING MARKET, BY REGIONAL (USD
    27. BILLION)
      1. North America
        1. US
        2. Canada
    28. Europe
      1. Germany
        1. UK
        2. France
    29. Russia
      1. Italy
        1. Spain
        2. Rest of Europe
      2. APAC
        1. China
        2. India
        3. Japan
    30. South Korea
      1. Malaysia
        1. Thailand
        2. Indonesia
        3. Rest of APAC
      2. South America
        1. Brazil
    31. Mexico
      1. Argentina
        1. Rest of South America
      2. MEA
        1. GCC Countries
        2. South Africa
        3. Rest of MEA
    32. COMPETITIVE LANDSCAPE
      1. Overview
    33. Competitive Analysis
      1. Market share Analysis
      2. Major Growth
    34. Strategy in the Underground Utility Mapping Market
      1. Competitive Benchmarking
      2. Leading Players in Terms of Number of Developments in the Underground
    35. Utility Mapping Market
      1. Key developments and growth strategies
    36. New Product Launch/Service Deployment
      1. Merger & Acquisitions
        1. Joint Ventures
      2. Major Players Financial Matrix
    37. Sales and Operating Income
      1. Major Players R&D Expenditure. 2023
    38. COMPANY PROFILES
      1. Rycom Instruments, Inc.
        1. Financial
    39. Overview
      1. Products Offered
        1. Key Developments
    40. SWOT Analysis
      1. Key Strategies
      2. Proceq SA
        1. Financial
    41. Overview
      1. Products Offered
        1. Key Developments
    42. SWOT Analysis
      1. Key Strategies
      2. Pure Technologies
    43. Financial Overview
      1. Products Offered
        1. Key Developments
        2. SWOT Analysis
        3. Key Strategies
      2. VTrack Systems
    44. Pty Ltd
      1. Financial Overview
        1. Products Offered
    45. Key Developments
      1. SWOT Analysis
        1. Key Strategies
    46. Sewer Equipment Manufacturing Co., LLC
      1. Financial Overview
    47. Products Offered
      1. Key Developments
        1. SWOT Analysis
        2. Key Strategies
      2. MettlerToledo International Inc.
    48. Financial Overview
      1. Products Offered
        1. Key Developments
        2. SWOT Analysis
        3. Key Strategies
      2. Utility Survey
    49. Systems Ltd.
      1. Financial Overview
        1. Products Offered
        2. Key Developments
        3. SWOT Analysis
        4. Key Strategies
      2. VivaxMetrotech Corp.
        1. Financial Overview
    50. Products Offered
      1. Key Developments
        1. SWOT Analysis
        2. Key Strategies
        3. Financial Overview
    51. Products Offered
      1. Key Developments
        1. SWOT Analysis
        2. Key Strategies
      2. EarthData, Inc.
        1. Financial Overview
        2. Products Offered
        3. Key Developments
        4. SWOT
    52. Analysis
      1. Key Strategies
      2. Subsurface Utility Engineering
    53. Inc.
      1. Financial Overview
        1. Products Offered
    54. Key Developments
      1. SWOT Analysis
        1. Key Strategies
      2. Radiodetection Ltd. (Hexagon)
        1. Financial Overview
    55. Products Offered
      1. Key Developments
        1. SWOT Analysis
        2. Key Strategies
      2. Penetrox
        1. Financial Overview
        2. Products Offered
        3. Key Developments
        4. SWOT
    56. Analysis
      1. Key Strategies
      2. Atlas Copco AB
    57. Financial Overview
      1. Products Offered
        1. Key Developments
        2. SWOT Analysis
        3. Key Strategies
      2. Cutieye
    58. Ltd.
      1. Financial Overview
        1. Products Offered
    59. Key Developments
      1. SWOT Analysis
        1. Key Strategies
    60. APPENDIX
      1. References
      2. Related Reports
    61. UTILITY MAPPING MARKET SIZE ESTIMATES & FORECAST, BY TECHNOLOGY, 2019-2032 (USD
    62. BILLIONS)
    63. & FORECAST, BY DEPLOYMENT, 2019-2032 (USD BILLIONS)
    64. UNDERGROUND UTILITY MAPPING MARKET SIZE ESTIMATES & FORECAST, BY END-USE SECTOR,
    65. 2032 (USD BILLIONS)
    66. MARKET SIZE ESTIMATES & FORECAST, BY APPLICATION, 2019-2032 (USD BILLIONS)
    67. FORECAST, BY DATA TYPE, 2019-2032 (USD BILLIONS)
    68. UTILITY MAPPING MARKET SIZE ESTIMATES & FORECAST, BY REGIONAL, 2019-2032 (USD
    69. BILLIONS)
    70. FORECAST, BY TECHNOLOGY, 2019-2032 (USD BILLIONS)
    71. UTILITY MAPPING MARKET SIZE ESTIMATES & FORECAST, BY DEPLOYMENT, 2019-2032 (USD
    72. BILLIONS)
    73. FORECAST, BY END-USE SECTOR, 2019-2032 (USD BILLIONS)
    74. UTILITY MAPPING MARKET SIZE ESTIMATES & FORECAST, BY APPLICATION, 2019-2032
    75. (USD BILLIONS)
    76. & FORECAST, BY DATA TYPE, 2019-2032 (USD BILLIONS)
    77. UTILITY MAPPING MARKET SIZE ESTIMATES & FORECAST, BY REGIONAL, 2019-2032 (USD
    78. BILLIONS)
    79. & FORECAST, BY TECHNOLOGY, 2019-2032 (USD BILLIONS)
    80. UTILITY MAPPING MARKET SIZE ESTIMATES & FORECAST, BY DEPLOYMENT, 2019-2032 (USD
    81. BILLIONS)
    82. & FORECAST, BY END-USE SECTOR, 2019-2032 (USD BILLIONS)
    83. UNDERGROUND UTILITY MAPPING MARKET SIZE ESTIMATES & FORECAST, BY APPLICATION,
    84. 2032 (USD BILLIONS)
    85. SIZE ESTIMATES & FORECAST, BY DATA TYPE, 2019-2032 (USD BILLIONS)
    86. CANADA UNDERGROUND UTILITY MAPPING MARKET SIZE ESTIMATES & FORECAST, BY
    87. REGIONAL, 2019-2032 (USD BILLIONS)
    88. MARKET SIZE ESTIMATES & FORECAST, BY TECHNOLOGY, 2019-2032 (USD BILLIONS)
    89. BY DEPLOYMENT, 2019-2032 (USD BILLIONS)
    90. MAPPING MARKET SIZE ESTIMATES & FORECAST, BY END-USE SECTOR, 2019-2032 (USD
    91. BILLIONS)
    92. & FORECAST, BY APPLICATION, 2019-2032 (USD BILLIONS)
    93. UNDERGROUND UTILITY MAPPING MARKET SIZE ESTIMATES & FORECAST, BY DATA TYPE,
    94. 2032 (USD BILLIONS)
    95. SIZE ESTIMATES & FORECAST, BY REGIONAL, 2019-2032 (USD BILLIONS)
    96. GERMANY UNDERGROUND UTILITY MAPPING MARKET SIZE ESTIMATES & FORECAST, BY
    97. TECHNOLOGY, 2019-2032 (USD BILLIONS)
    98. MAPPING MARKET SIZE ESTIMATES & FORECAST, BY DEPLOYMENT, 2019-2032 (USD BILLIONS)
    99. FORECAST, BY END-USE SECTOR, 2019-2032 (USD BILLIONS)
    100. UTILITY MAPPING MARKET SIZE ESTIMATES & FORECAST, BY APPLICATION, 2019-2032
    101. (USD BILLIONS)
    102. & FORECAST, BY DATA TYPE, 2019-2032 (USD BILLIONS)
    103. UTILITY MAPPING MARKET SIZE ESTIMATES & FORECAST, BY REGIONAL, 2019-2032 (USD
    104. BILLIONS)
    105. FORECAST, BY TECHNOLOGY, 2019-2032 (USD BILLIONS)
    106. UTILITY MAPPING MARKET SIZE ESTIMATES & FORECAST, BY DEPLOYMENT, 2019-2032 (USD
    107. BILLIONS)
    108. FORECAST, BY END-USE SECTOR, 2019-2032 (USD BILLIONS)
    109. UTILITY MAPPING MARKET SIZE ESTIMATES & FORECAST, BY APPLICATION, 2019-2032
    110. (USD BILLIONS)
    111. & FORECAST, BY DATA TYPE, 2019-2032 (USD BILLIONS)
    112. UTILITY MAPPING MARKET SIZE ESTIMATES & FORECAST, BY REGIONAL, 2019-2032 (USD
    113. BILLIONS)
    114. & FORECAST, BY TECHNOLOGY, 2019-2032 (USD BILLIONS)
    115. UTILITY MAPPING MARKET SIZE ESTIMATES & FORECAST, BY DEPLOYMENT, 2019-2032 (USD
    116. BILLIONS)
    117. & FORECAST, BY END-USE SECTOR, 2019-2032 (USD BILLIONS)
    118. UNDERGROUND UTILITY MAPPING MARKET SIZE ESTIMATES & FORECAST, BY APPLICATION,
    119. 2032 (USD BILLIONS)
    120. SIZE ESTIMATES & FORECAST, BY DATA TYPE, 2019-2032 (USD BILLIONS)
    121. FRANCE UNDERGROUND UTILITY MAPPING MARKET SIZE ESTIMATES & FORECAST, BY
    122. REGIONAL, 2019-2032 (USD BILLIONS)
    123. MARKET SIZE ESTIMATES & FORECAST, BY TECHNOLOGY, 2019-2032 (USD BILLIONS)
    124. BY DEPLOYMENT, 2019-2032 (USD BILLIONS)
    125. MAPPING MARKET SIZE ESTIMATES & FORECAST, BY END-USE SECTOR, 2019-2032 (USD
    126. BILLIONS)
    127. & FORECAST, BY APPLICATION, 2019-2032 (USD BILLIONS)
    128. UNDERGROUND UTILITY MAPPING MARKET SIZE ESTIMATES & FORECAST, BY DATA TYPE,
    129. 2032 (USD BILLIONS)
    130. SIZE ESTIMATES & FORECAST, BY REGIONAL, 2019-2032 (USD BILLIONS)
    131. ITALY UNDERGROUND UTILITY MAPPING MARKET SIZE ESTIMATES & FORECAST, BY TECHNOLOGY,
    132. 2032 (USD BILLIONS)
    133. SIZE ESTIMATES & FORECAST, BY DEPLOYMENT, 2019-2032 (USD BILLIONS)
    134. ITALY UNDERGROUND UTILITY MAPPING MARKET SIZE ESTIMATES & FORECAST, BY END-USE
    135. SECTOR, 2019-2032 (USD BILLIONS)
    136. MARKET SIZE ESTIMATES & FORECAST, BY APPLICATION, 2019-2032 (USD BILLIONS)
    137. BY DATA TYPE, 2019-2032 (USD BILLIONS)
    138. MAPPING MARKET SIZE ESTIMATES & FORECAST, BY REGIONAL, 2019-2032 (USD BILLIONS)
    139. BY TECHNOLOGY, 2019-2032 (USD BILLIONS)
    140. MAPPING MARKET SIZE ESTIMATES & FORECAST, BY DEPLOYMENT, 2019-2032 (USD BILLIONS)
    141. BY END-USE SECTOR, 2019-2032 (USD BILLIONS)
    142. MAPPING MARKET SIZE ESTIMATES & FORECAST, BY APPLICATION, 2019-2032 (USD BILLIONS)
    143. BY DATA TYPE, 2019-2032 (USD BILLIONS)
    144. MAPPING MARKET SIZE ESTIMATES & FORECAST, BY REGIONAL, 2019-2032 (USD BILLIONS)
    145. & FORECAST, BY TECHNOLOGY, 2019-2032 (USD BILLIONS)
    146. EUROPE UNDERGROUND UTILITY MAPPING MARKET SIZE ESTIMATES & FORECAST, BY DEPLOYMENT,
    147. 2032 (USD BILLIONS)
    148. MARKET SIZE ESTIMATES & FORECAST, BY END-USE SECTOR, 2019-2032 (USD BILLIONS)
    149. & FORECAST, BY APPLICATION, 2019-2032 (USD BILLIONS)
    150. EUROPE UNDERGROUND UTILITY MAPPING MARKET SIZE ESTIMATES & FORECAST, BY DATA
    151. TYPE, 2019-2032 (USD BILLIONS)
    152. MAPPING MARKET SIZE ESTIMATES & FORECAST, BY REGIONAL, 2019-2032 (USD BILLIONS)
    153. BY TECHNOLOGY, 2019-2032 (USD BILLIONS)
    154. MAPPING MARKET SIZE ESTIMATES & FORECAST, BY DEPLOYMENT, 2019-2032 (USD BILLIONS)
    155. BY END-USE SECTOR, 2019-2032 (USD BILLIONS)
    156. MAPPING MARKET SIZE ESTIMATES & FORECAST, BY APPLICATION, 2019-2032 (USD BILLIONS)
    157. BY DATA TYPE, 2019-2032 (USD BILLIONS)
    158. MAPPING MARKET SIZE ESTIMATES & FORECAST, BY REGIONAL, 2019-2032 (USD BILLIONS)
    159. BY TECHNOLOGY, 2019-2032 (USD BILLIONS)
    160. MAPPING MARKET SIZE ESTIMATES & FORECAST, BY DEPLOYMENT, 2019-2032 (USD BILLIONS)
    161. BY END-USE SECTOR, 2019-2032 (USD BILLIONS)
    162. MAPPING MARKET SIZE ESTIMATES & FORECAST, BY APPLICATION, 2019-2032 (USD BILLIONS)
    163. BY DATA TYPE, 2019-2032 (USD BILLIONS)
    164. MAPPING MARKET SIZE ESTIMATES & FORECAST, BY REGIONAL, 2019-2032 (USD BILLIONS)
    165. BY TECHNOLOGY, 2019-2032 (USD BILLIONS)
    166. MAPPING MARKET SIZE ESTIMATES & FORECAST, BY DEPLOYMENT, 2019-2032 (USD BILLIONS)
    167. BY END-USE SECTOR, 2019-2032 (USD BILLIONS)
    168. MAPPING MARKET SIZE ESTIMATES & FORECAST, BY APPLICATION, 2019-2032 (USD BILLIONS)
    169. BY DATA TYPE, 2019-2032 (USD BILLIONS)
    170. MAPPING MARKET SIZE ESTIMATES & FORECAST, BY REGIONAL, 2019-2032 (USD BILLIONS)
    171. BY TECHNOLOGY, 2019-2032 (USD BILLIONS)
    172. MAPPING MARKET SIZE ESTIMATES & FORECAST, BY DEPLOYMENT, 2019-2032 (USD BILLIONS)
    173. BY END-USE SECTOR, 2019-2032 (USD BILLIONS)
    174. MAPPING MARKET SIZE ESTIMATES & FORECAST, BY APPLICATION, 2019-2032 (USD BILLIONS)
    175. BY DATA TYPE, 2019-2032 (USD BILLIONS)
    176. MAPPING MARKET SIZE ESTIMATES & FORECAST, BY REGIONAL, 2019-2032 (USD BILLIONS)
    177. FORECAST, BY TECHNOLOGY, 2019-2032 (USD BILLIONS)
    178. UTILITY MAPPING MARKET SIZE ESTIMATES & FORECAST, BY DEPLOYMENT, 2019-2032 (USD
    179. BILLIONS)
    180. & FORECAST, BY END-USE SECTOR, 2019-2032 (USD BILLIONS)
    181. KOREA UNDERGROUND UTILITY MAPPING MARKET SIZE ESTIMATES & FORECAST, BY APPLICATION,
    182. 2032 (USD BILLIONS)
    183. MARKET SIZE ESTIMATES & FORECAST, BY DATA TYPE, 2019-2032 (USD BILLIONS)
    184. FORECAST, BY REGIONAL, 2019-2032 (USD BILLIONS)
    185. UTILITY MAPPING MARKET SIZE ESTIMATES & FORECAST, BY TECHNOLOGY, 2019-2032 (USD
    186. BILLIONS)
    187. & FORECAST, BY DEPLOYMENT, 2019-2032 (USD BILLIONS)
    188. UNDERGROUND UTILITY MAPPING MARKET SIZE ESTIMATES & FORECAST, BY END-USE SECTOR,
    189. 2032 (USD BILLIONS)
    190. SIZE ESTIMATES & FORECAST, BY APPLICATION, 2019-2032 (USD BILLIONS)
    191. MALAYSIA UNDERGROUND UTILITY MAPPING MARKET SIZE ESTIMATES & FORECAST,
    192. BY DATA TYPE, 2019-2032 (USD BILLIONS)
    193. MAPPING MARKET SIZE ESTIMATES & FORECAST, BY REGIONAL, 2019-2032 (USD BILLIONS)
    194. FORECAST, BY TECHNOLOGY, 2019-2032 (USD BILLIONS)
    195. UTILITY MAPPING MARKET SIZE ESTIMATES & FORECAST, BY DEPLOYMENT, 2019-2032 (USD
    196. BILLIONS)
    197. & FORECAST, BY END-USE SECTOR, 2019-2032 (USD BILLIONS)
    198. UNDERGROUND UTILITY MAPPING MARKET SIZE ESTIMATES & FORECAST, BY APPLICATION,
    199. 2032 (USD BILLIONS)
    200. SIZE ESTIMATES & FORECAST, BY DATA TYPE, 2019-2032 (USD BILLIONS)
    201. THAILAND UNDERGROUND UTILITY MAPPING MARKET SIZE ESTIMATES & FORECAST,
    202. BY REGIONAL, 2019-2032 (USD BILLIONS)
    203. MAPPING MARKET SIZE ESTIMATES & FORECAST, BY TECHNOLOGY, 2019-2032 (USD BILLIONS)
    204. FORECAST, BY DEPLOYMENT, 2019-2032 (USD BILLIONS)
    205. UTILITY MAPPING MARKET SIZE ESTIMATES & FORECAST, BY END-USE SECTOR, 2019-2032
    206. (USD BILLIONS)
    207. ESTIMATES & FORECAST, BY APPLICATION, 2019-2032 (USD BILLIONS)
    208. INDONESIA UNDERGROUND UTILITY MAPPING MARKET SIZE ESTIMATES & FORECAST, BY DATA
    209. TYPE, 2019-2032 (USD BILLIONS)
    210. MARKET SIZE ESTIMATES & FORECAST, BY REGIONAL, 2019-2032 (USD BILLIONS)
    211. FORECAST, BY TECHNOLOGY, 2019-2032 (USD BILLIONS)
    212. UNDERGROUND UTILITY MAPPING MARKET SIZE ESTIMATES & FORECAST, BY DEPLOYMENT,
    213. 2032 (USD BILLIONS)
    214. MARKET SIZE ESTIMATES & FORECAST, BY END-USE SECTOR, 2019-2032 (USD BILLIONS)
    215. & FORECAST, BY APPLICATION, 2019-2032 (USD BILLIONS)
    216. APAC UNDERGROUND UTILITY MAPPING MARKET SIZE ESTIMATES & FORECAST, BY DATA TYPE,
    217. 2032 (USD BILLIONS)
    218. MARKET SIZE ESTIMATES & FORECAST, BY REGIONAL, 2019-2032 (USD BILLIONS)
    219. FORECAST, BY TECHNOLOGY, 2019-2032 (USD BILLIONS)
    220. UNDERGROUND UTILITY MAPPING MARKET SIZE ESTIMATES & FORECAST, BY DEPLOYMENT,
    221. 2032 (USD BILLIONS)
    222. MARKET SIZE ESTIMATES & FORECAST, BY END-USE SECTOR, 2019-2032 (USD BILLIONS)
    223. & FORECAST, BY APPLICATION, 2019-2032 (USD BILLIONS)
    224. AMERICA UNDERGROUND UTILITY MAPPING MARKET SIZE ESTIMATES & FORECAST, BY DATA
    225. TYPE, 2019-2032 (USD BILLIONS)
    226. MAPPING MARKET SIZE ESTIMATES & FORECAST, BY REGIONAL, 2019-2032 (USD BILLIONS)
    227. FORECAST, BY TECHNOLOGY, 2019-2032 (USD BILLIONS)
    228. UTILITY MAPPING MARKET SIZE ESTIMATES & FORECAST, BY DEPLOYMENT, 2019-2032 (USD
    229. BILLIONS)
    230. & FORECAST, BY END-USE SECTOR, 2019-2032 (USD BILLIONS)
    231. UNDERGROUND UTILITY MAPPING MARKET SIZE ESTIMATES & FORECAST, BY APPLICATION,
    232. 2032 (USD BILLIONS)
    233. SIZE ESTIMATES & FORECAST, BY DATA TYPE, 2019-2032 (USD BILLIONS)
    234. BRAZIL UNDERGROUND UTILITY MAPPING MARKET SIZE ESTIMATES & FORECAST, BY
    235. REGIONAL, 2019-2032 (USD BILLIONS)
    236. MARKET SIZE ESTIMATES & FORECAST, BY TECHNOLOGY, 2019-2032 (USD BILLIONS)
    237. BY DEPLOYMENT, 2019-2032 (USD BILLIONS)
    238. MAPPING MARKET SIZE ESTIMATES & FORECAST, BY END-USE SECTOR, 2019-2032 (USD
    239. BILLIONS)
    240. & FORECAST, BY APPLICATION, 2019-2032 (USD BILLIONS)
    241. UNDERGROUND UTILITY MAPPING MARKET SIZE ESTIMATES & FORECAST, BY DATA TYPE,
    242. 2032 (USD BILLIONS)
    243. SIZE ESTIMATES & FORECAST, BY REGIONAL, 2019-2032 (USD BILLIONS)
    244. ARGENTINA UNDERGROUND UTILITY MAPPING MARKET SIZE ESTIMATES & FORECAST,
    245. BY TECHNOLOGY, 2019-2032 (USD BILLIONS)
    246. MAPPING MARKET SIZE ESTIMATES & FORECAST, BY DEPLOYMENT, 2019-2032 (USD BILLIONS)
    247. FORECAST, BY END-USE SECTOR, 2019-2032 (USD BILLIONS)
    248. UNDERGROUND UTILITY MAPPING MARKET SIZE ESTIMATES & FORECAST, BY APPLICATION,
    249. 2032 (USD BILLIONS)
    250. MARKET SIZE ESTIMATES & FORECAST, BY DATA TYPE, 2019-2032 (USD BILLIONS)
    251. BY REGIONAL, 2019-2032 (USD BILLIONS)
    252. UTILITY MAPPING MARKET SIZE ESTIMATES & FORECAST, BY TECHNOLOGY, 2019-2032 (USD
    253. BILLIONS)
    254. SIZE ESTIMATES & FORECAST, BY DEPLOYMENT, 2019-2032 (USD BILLIONS)
    255. REST OF SOUTH AMERICA UNDERGROUND UTILITY MAPPING MARKET SIZE ESTIMATES &
    256. FORECAST, BY END-USE SECTOR, 2019-2032 (USD BILLIONS)
    257. AMERICA UNDERGROUND UTILITY MAPPING MARKET SIZE ESTIMATES & FORECAST, BY APPLICATION,
    258. 2032 (USD BILLIONS)
    259. MAPPING MARKET SIZE ESTIMATES & FORECAST, BY DATA TYPE, 2019-2032 (USD BILLIONS)
    260. & FORECAST, BY REGIONAL, 2019-2032 (USD BILLIONS)
    261. UTILITY MAPPING MARKET SIZE ESTIMATES & FORECAST, BY TECHNOLOGY, 2019-2032 (USD
    262. BILLIONS)
    263. & FORECAST, BY DEPLOYMENT, 2019-2032 (USD BILLIONS)
    264. UTILITY MAPPING MARKET SIZE ESTIMATES & FORECAST, BY END-USE SECTOR, 2019-2032
    265. (USD BILLIONS)
    266. & FORECAST, BY APPLICATION, 2019-2032 (USD BILLIONS)
    267. UTILITY MAPPING MARKET SIZE ESTIMATES & FORECAST, BY DATA TYPE, 2019-2032 (USD
    268. BILLIONS)
    269. & FORECAST, BY REGIONAL, 2019-2032 (USD BILLIONS)
    270. UNDERGROUND UTILITY MAPPING MARKET SIZE ESTIMATES & FORECAST, BY TECHNOLOGY,
    271. 2032 (USD BILLIONS)
    272. MARKET SIZE ESTIMATES & FORECAST, BY DEPLOYMENT, 2019-2032 (USD BILLIONS)
    273. FORECAST, BY END-USE SECTOR, 2019-2032 (USD BILLIONS)
    274. UNDERGROUND UTILITY MAPPING MARKET SIZE ESTIMATES & FORECAST, BY APPLICATION,
    275. 2032 (USD BILLIONS)
    276. MARKET SIZE ESTIMATES & FORECAST, BY DATA TYPE, 2019-2032 (USD BILLIONS)
    277. FORECAST, BY REGIONAL, 2019-2032 (USD BILLIONS)
    278. UTILITY MAPPING MARKET SIZE ESTIMATES & FORECAST, BY TECHNOLOGY, 2019-2032 (USD
    279. BILLIONS)
    280. ESTIMATES & FORECAST, BY DEPLOYMENT, 2019-2032 (USD BILLIONS)
    281. SOUTH AFRICA UNDERGROUND UTILITY MAPPING MARKET SIZE ESTIMATES & FORECAST, BY
    282. END-USE SECTOR, 2019-2032 (USD BILLIONS)
    283. UTILITY MAPPING MARKET SIZE ESTIMATES & FORECAST, BY APPLICATION, 2019-2032
    284. (USD BILLIONS)
    285. SIZE ESTIMATES & FORECAST, BY DATA TYPE, 2019-2032 (USD BILLIONS)
    286. SOUTH AFRICA UNDERGROUND UTILITY MAPPING MARKET SIZE ESTIMATES & FORECAST,
    287. BY REGIONAL, 2019-2032 (USD BILLIONS)
    288. MAPPING MARKET SIZE ESTIMATES & FORECAST, BY TECHNOLOGY, 2019-2032 (USD BILLIONS)
    289. FORECAST, BY DEPLOYMENT, 2019-2032 (USD BILLIONS)
    290. UTILITY MAPPING MARKET SIZE ESTIMATES & FORECAST, BY END-USE SECTOR, 2019-2032
    291. (USD BILLIONS)
    292. ESTIMATES & FORECAST, BY APPLICATION, 2019-2032 (USD BILLIONS)
    293. REST OF MEA UNDERGROUND UTILITY MAPPING MARKET SIZE ESTIMATES & FORECAST, BY
    294. DATA TYPE, 2019-2032 (USD BILLIONS)
    295. MAPPING MARKET SIZE ESTIMATES & FORECAST, BY REGIONAL, 2019-2032 (USD BILLIONS)
    296. AMERICA UNDERGROUND UTILITY MAPPING MARKET ANALYSIS
    297. UTILITY MAPPING MARKET ANALYSIS BY TECHNOLOGY
    298. MAPPING MARKET ANALYSIS BY DEPLOYMENT
    299. MARKET ANALYSIS BY END-USE SECTOR
    300. MARKET ANALYSIS BY APPLICATION
    301. ANALYSIS BY DATA TYPE
    302. BY REGIONAL
    303. TECHNOLOGY
    304. DEPLOYMENT
    305. END-USE SECTOR
    306. BY APPLICATION
    307. BY DATA TYPE
    308. BY REGIONAL
    309. SECTOR
    310. UK UNDERGROUND UTILITY MAPPING MARKET ANALYSIS BY END-USE SECTOR
    311. UK UNDERGROUND UTILITY MAPPING MARKET ANALYSIS BY APPLICATION
    312. UK UNDERGROUND UTILITY MAPPING MARKET ANALYSIS BY DATA TYPE
    313. UNDERGROUND UTILITY MAPPING MARKET ANALYSIS BY REGIONAL
    314. UNDERGROUND UTILITY MAPPING MARKET ANALYSIS BY TECHNOLOGY
    315. UNDERGROUND UTILITY MAPPING MARKET ANALYSIS BY DEPLOYMENT
    316. UNDERGROUND UTILITY MAPPING MARKET ANALYSIS BY END-USE SECTOR
    317. UNDERGROUND UTILITY MAPPING MARKET ANALYSIS BY APPLICATION
    318. UNDERGROUND UTILITY MAPPING MARKET ANALYSIS BY DATA TYPE
    319. UNDERGROUND UTILITY MAPPING MARKET ANALYSIS BY REGIONAL
    320. UNDERGROUND UTILITY MAPPING MARKET ANALYSIS BY TECHNOLOGY
    321. UNDERGROUND UTILITY MAPPING MARKET ANALYSIS BY DEPLOYMENT
    322. UNDERGROUND UTILITY MAPPING MARKET ANALYSIS BY END-USE SECTOR
    323. UNDERGROUND UTILITY MAPPING MARKET ANALYSIS BY APPLICATION
    324. UNDERGROUND UTILITY MAPPING MARKET ANALYSIS BY DATA TYPE
    325. UNDERGROUND UTILITY MAPPING MARKET ANALYSIS BY REGIONAL
    326. UTILITY MAPPING MARKET ANALYSIS BY TECHNOLOGY
    327. UTILITY MAPPING MARKET ANALYSIS BY DEPLOYMENT
    328. UTILITY MAPPING MARKET ANALYSIS BY END-USE SECTOR
    329. UTILITY MAPPING MARKET ANALYSIS BY APPLICATION
    330. UTILITY MAPPING MARKET ANALYSIS BY DATA TYPE
    331. UTILITY MAPPING MARKET ANALYSIS BY REGIONAL
    332. MAPPING MARKET ANALYSIS BY TECHNOLOGY
    333. MAPPING MARKET ANALYSIS BY DEPLOYMENT
    334. MAPPING MARKET ANALYSIS BY END-USE SECTOR
    335. MAPPING MARKET ANALYSIS BY APPLICATION
    336. MAPPING MARKET ANALYSIS BY DATA TYPE
    337. MAPPING MARKET ANALYSIS BY REGIONAL
    338. UTILITY MAPPING MARKET ANALYSIS BY TECHNOLOGY
    339. UTILITY MAPPING MARKET ANALYSIS BY DEPLOYMENT
    340. UTILITY MAPPING MARKET ANALYSIS BY END-USE SECTOR
    341. UNDERGROUND UTILITY MAPPING MARKET ANALYSIS BY APPLICATION
    342. OF EUROPE UNDERGROUND UTILITY MAPPING MARKET ANALYSIS BY DATA TYPE
    343. REST OF EUROPE UNDERGROUND UTILITY MAPPING MARKET ANALYSIS BY REGIONAL
    344. APAC UNDERGROUND UTILITY MAPPING MARKET ANALYSIS
    345. UTILITY MAPPING MARKET ANALYSIS BY TECHNOLOGY
    346. UTILITY MAPPING MARKET ANALYSIS BY DEPLOYMENT
    347. UTILITY MAPPING MARKET ANALYSIS BY END-USE SECTOR
    348. UTILITY MAPPING MARKET ANALYSIS BY APPLICATION
    349. UTILITY MAPPING MARKET ANALYSIS BY DATA TYPE
    350. UTILITY MAPPING MARKET ANALYSIS BY REGIONAL
    351. MAPPING MARKET ANALYSIS BY TECHNOLOGY
    352. MAPPING MARKET ANALYSIS BY DEPLOYMENT
    353. MAPPING MARKET ANALYSIS BY END-USE SECTOR
    354. MAPPING MARKET ANALYSIS BY APPLICATION
    355. MAPPING MARKET ANALYSIS BY DATA TYPE
    356. MAPPING MARKET ANALYSIS BY REGIONAL
    357. MARKET ANALYSIS BY TECHNOLOGY
    358. MARKET ANALYSIS BY DEPLOYMENT
    359. MARKET ANALYSIS BY END-USE SECTOR
    360. MARKET ANALYSIS BY APPLICATION
    361. MARKET ANALYSIS BY DATA TYPE
    362. MARKET ANALYSIS BY REGIONAL
    363. MARKET ANALYSIS BY TECHNOLOGY
    364. MARKET ANALYSIS BY DEPLOYMENT
    365. MARKET ANALYSIS BY END-USE SECTOR
    366. MAPPING MARKET ANALYSIS BY APPLICATION
    367. UTILITY MAPPING MARKET ANALYSIS BY DATA TYPE
    368. UTILITY MAPPING MARKET ANALYSIS BY REGIONAL
    369. UTILITY MAPPING MARKET ANALYSIS BY TECHNOLOGY
    370. UTILITY MAPPING MARKET ANALYSIS BY DEPLOYMENT
    371. UTILITY MAPPING MARKET ANALYSIS BY END-USE SECTOR
    372. UTILITY MAPPING MARKET ANALYSIS BY APPLICATION
    373. UTILITY MAPPING MARKET ANALYSIS BY DATA TYPE
    374. UTILITY MAPPING MARKET ANALYSIS BY REGIONAL
    375. UTILITY MAPPING MARKET ANALYSIS BY TECHNOLOGY
    376. UTILITY MAPPING MARKET ANALYSIS BY DEPLOYMENT
    377. UTILITY MAPPING MARKET ANALYSIS BY END-USE SECTOR
    378. UTILITY MAPPING MARKET ANALYSIS BY APPLICATION
    379. UTILITY MAPPING MARKET ANALYSIS BY DATA TYPE
    380. UTILITY MAPPING MARKET ANALYSIS BY REGIONAL
    381. UTILITY MAPPING MARKET ANALYSIS BY TECHNOLOGY
    382. UTILITY MAPPING MARKET ANALYSIS BY DEPLOYMENT
    383. UTILITY MAPPING MARKET ANALYSIS BY END-USE SECTOR
    384. UTILITY MAPPING MARKET ANALYSIS BY APPLICATION
    385. UTILITY MAPPING MARKET ANALYSIS BY DATA TYPE
    386. UTILITY MAPPING MARKET ANALYSIS BY REGIONAL
    387. UTILITY MAPPING MARKET ANALYSIS BY TECHNOLOGY
    388. UTILITY MAPPING MARKET ANALYSIS BY DEPLOYMENT
    389. UTILITY MAPPING MARKET ANALYSIS BY END-USE SECTOR
    390. UNDERGROUND UTILITY MAPPING MARKET ANALYSIS BY APPLICATION
    391. OF APAC UNDERGROUND UTILITY MAPPING MARKET ANALYSIS BY DATA TYPE
    392. REST OF APAC UNDERGROUND UTILITY MAPPING MARKET ANALYSIS BY REGIONAL
    393. SOUTH AMERICA UNDERGROUND UTILITY MAPPING MARKET ANALYSIS
    394. BRAZIL UNDERGROUND UTILITY MAPPING MARKET ANALYSIS BY TECHNOLOGY
    395. BRAZIL UNDERGROUND UTILITY MAPPING MARKET ANALYSIS BY DEPLOYMENT
    396. BRAZIL UNDERGROUND UTILITY MAPPING MARKET ANALYSIS BY END-USE SECTOR
    397. BRAZIL UNDERGROUND UTILITY MAPPING MARKET ANALYSIS BY APPLICATION
    398. BRAZIL UNDERGROUND UTILITY MAPPING MARKET ANALYSIS BY DATA TYPE
    399. BRAZIL UNDERGROUND UTILITY MAPPING MARKET ANALYSIS BY REGIONAL
    400. MEXICO UNDERGROUND UTILITY MAPPING MARKET ANALYSIS BY TECHNOLOGY
    401. MEXICO UNDERGROUND UTILITY MAPPING MARKET ANALYSIS BY DEPLOYMENT
    402. MEXICO UNDERGROUND UTILITY MAPPING MARKET ANALYSIS BY END-USE SECTOR
    403. MEXICO UNDERGROUND UTILITY MAPPING MARKET ANALYSIS BY APPLICATION
    404. MEXICO UNDERGROUND UTILITY MAPPING MARKET ANALYSIS BY DATA TYPE
    405. MEXICO UNDERGROUND UTILITY MAPPING MARKET ANALYSIS BY REGIONAL
    406. ARGENTINA UNDERGROUND UTILITY MAPPING MARKET ANALYSIS BY TECHNOLOGY
    407. ARGENTINA UNDERGROUND UTILITY MAPPING MARKET ANALYSIS BY DEPLOYMENT
    408. ARGENTINA UNDERGROUND UTILITY MAPPING MARKET ANALYSIS BY END-USE SECTOR
    409. TYPE
    410. REGIONAL
    411. ANALYSIS BY TECHNOLOGY
    412. MAPPING MARKET ANALYSIS BY DEPLOYMENT
    413. UTILITY MAPPING MARKET ANALYSIS BY END-USE SECTOR
    414. AMERICA UNDERGROUND UTILITY MAPPING MARKET ANALYSIS BY APPLICATION
    415. REST OF SOUTH AMERICA UNDERGROUND UTILITY MAPPING MARKET ANALYSIS BY DATA TYPE
    416. BY REGIONAL
    417. SECTOR
    418. BY APPLICATION
    419. ANALYSIS BY DATA TYPE
    420. MARKET ANALYSIS BY REGIONAL
    421. MARKET ANALYSIS BY TECHNOLOGY
    422. MAPPING MARKET ANALYSIS BY DEPLOYMENT
    423. UTILITY MAPPING MARKET ANALYSIS BY END-USE SECTOR
    424. UNDERGROUND UTILITY MAPPING MARKET ANALYSIS BY APPLICATION
    425. AFRICA UNDERGROUND UTILITY MAPPING MARKET ANALYSIS BY DATA TYPE
    426. SOUTH AFRICA UNDERGROUND UTILITY MAPPING MARKET ANALYSIS BY REGIONAL
    427. REST OF MEA UNDERGROUND UTILITY MAPPING MARKET ANALYSIS BY TECHNOLOGY
    428. REST OF MEA UNDERGROUND UTILITY MAPPING MARKET ANALYSIS BY DEPLOYMENT
    429. REST OF MEA UNDERGROUND UTILITY MAPPING MARKET ANALYSIS BY END-USE SECTOR
    430. TYPE
    431. REGIONAL
    432. UTILITY MAPPING MARKET
    433. MAPPING MARKET
    434. MAPPING MARKET
    435. MARKET
    436. (% SHARE)
    437. TO 2032 (USD Billions)
    438. DEPLOYMENT, 2024 (% SHARE)
    439. BY DEPLOYMENT, 2019 TO 2032 (USD Billions)
    440. MAPPING MARKET, BY END-USE SECTOR, 2024 (% SHARE)
    441. UTILITY MAPPING MARKET, BY END-USE SECTOR, 2019 TO 2032 (USD Billions)
    442. UNDERGROUND UTILITY MAPPING MARKET, BY APPLICATION, 2024 (% SHARE)
    443. UNDERGROUND UTILITY MAPPING MARKET, BY APPLICATION, 2019 TO 2032 (USD Billions)
    444. (USD Billions)
    445. (% SHARE)
    446. TO 2032 (USD Billions)

    Underground Utility Mapping Market Segmentation

    • Underground Utility Mapping Market By Technology (USD Billion, 2019-2032)

      • Electromagnetic Induction
      • Ground Penetrating Radar
      • Laser Scanning
      • Acoustic Emission
      • Radio Detection

    • Underground Utility Mapping Market By Deployment (USD Billion, 2019-2032)

      • In-house
      • Outsourced

    • Underground Utility Mapping Market By End-Use Sector (USD Billion, 2019-2032)

      • Construction
      • Utilities
      • Engineering
      • Telecommunications

    • Underground Utility Mapping Market By Application (USD Billion, 2019-2032)

      • Damage Prevention
      • Asset Management
      • Planning and Design
      • Utility Relocation

    • Underground Utility Mapping Market By Data Type (USD Billion, 2019-2032)

      • 2D Mapping
      • 3D Mapping
      • Point Data
      • Line Data

    • Underground Utility Mapping Market By Regional (USD Billion, 2019-2032)

      • North America
      • Europe
      • South America
      • Asia Pacific
      • Middle East and Africa

    Underground Utility Mapping Market Regional Outlook (USD Billion, 2019-2032)


    • North America Outlook (USD Billion, 2019-2032)

      • North America Underground Utility Mapping Market by Technology Type

        • Electromagnetic Induction
        • Ground Penetrating Radar
        • Laser Scanning
        • Acoustic Emission
        • Radio Detection
      • North America Underground Utility Mapping Market by Deployment Type

        • In-house
        • Outsourced
      • North America Underground Utility Mapping Market by End-Use Sector Type

        • Construction
        • Utilities
        • Engineering
        • Telecommunications
      • North America Underground Utility Mapping Market by Application Type

        • Damage Prevention
        • Asset Management
        • Planning and Design
        • Utility Relocation
      • North America Underground Utility Mapping Market by Data Type

        • 2D Mapping
        • 3D Mapping
        • Point Data
        • Line Data
      • North America Underground Utility Mapping Market by Regional Type

        • US
        • Canada
      • US Outlook (USD Billion, 2019-2032)
      • US Underground Utility Mapping Market by Technology Type

        • Electromagnetic Induction
        • Ground Penetrating Radar
        • Laser Scanning
        • Acoustic Emission
        • Radio Detection
      • US Underground Utility Mapping Market by Deployment Type

        • In-house
        • Outsourced
      • US Underground Utility Mapping Market by End-Use Sector Type

        • Construction
        • Utilities
        • Engineering
        • Telecommunications
      • US Underground Utility Mapping Market by Application Type

        • Damage Prevention
        • Asset Management
        • Planning and Design
        • Utility Relocation
      • US Underground Utility Mapping Market by Data Type

        • 2D Mapping
        • 3D Mapping
        • Point Data
        • Line Data
      • CANADA Outlook (USD Billion, 2019-2032)
      • CANADA Underground Utility Mapping Market by Technology Type

        • Electromagnetic Induction
        • Ground Penetrating Radar
        • Laser Scanning
        • Acoustic Emission
        • Radio Detection
      • CANADA Underground Utility Mapping Market by Deployment Type

        • In-house
        • Outsourced
      • CANADA Underground Utility Mapping Market by End-Use Sector Type

        • Construction
        • Utilities
        • Engineering
        • Telecommunications
      • CANADA Underground Utility Mapping Market by Application Type

        • Damage Prevention
        • Asset Management
        • Planning and Design
        • Utility Relocation
      • CANADA Underground Utility Mapping Market by Data Type

        • 2D Mapping
        • 3D Mapping
        • Point Data
        • Line Data
    • Europe Outlook (USD Billion, 2019-2032)

      • Europe Underground Utility Mapping Market by Technology Type

        • Electromagnetic Induction
        • Ground Penetrating Radar
        • Laser Scanning
        • Acoustic Emission
        • Radio Detection
      • Europe Underground Utility Mapping Market by Deployment Type

        • In-house
        • Outsourced
      • Europe Underground Utility Mapping Market by End-Use Sector Type

        • Construction
        • Utilities
        • Engineering
        • Telecommunications
      • Europe Underground Utility Mapping Market by Application Type

        • Damage Prevention
        • Asset Management
        • Planning and Design
        • Utility Relocation
      • Europe Underground Utility Mapping Market by Data Type

        • 2D Mapping
        • 3D Mapping
        • Point Data
        • Line Data
      • Europe Underground Utility Mapping Market by Regional Type

        • Germany
        • UK
        • France
        • Russia
        • Italy
        • Spain
        • Rest of Europe
      • GERMANY Outlook (USD Billion, 2019-2032)
      • GERMANY Underground Utility Mapping Market by Technology Type

        • Electromagnetic Induction
        • Ground Penetrating Radar
        • Laser Scanning
        • Acoustic Emission
        • Radio Detection
      • GERMANY Underground Utility Mapping Market by Deployment Type

        • In-house
        • Outsourced
      • GERMANY Underground Utility Mapping Market by End-Use Sector Type

        • Construction
        • Utilities
        • Engineering
        • Telecommunications
      • GERMANY Underground Utility Mapping Market by Application Type

        • Damage Prevention
        • Asset Management
        • Planning and Design
        • Utility Relocation
      • GERMANY Underground Utility Mapping Market by Data Type

        • 2D Mapping
        • 3D Mapping
        • Point Data
        • Line Data
      • UK Outlook (USD Billion, 2019-2032)
      • UK Underground Utility Mapping Market by Technology Type

        • Electromagnetic Induction
        • Ground Penetrating Radar
        • Laser Scanning
        • Acoustic Emission
        • Radio Detection
      • UK Underground Utility Mapping Market by Deployment Type

        • In-house
        • Outsourced
      • UK Underground Utility Mapping Market by End-Use Sector Type

        • Construction
        • Utilities
        • Engineering
        • Telecommunications
      • UK Underground Utility Mapping Market by Application Type

        • Damage Prevention
        • Asset Management
        • Planning and Design
        • Utility Relocation
      • UK Underground Utility Mapping Market by Data Type

        • 2D Mapping
        • 3D Mapping
        • Point Data
        • Line Data
      • FRANCE Outlook (USD Billion, 2019-2032)
      • FRANCE Underground Utility Mapping Market by Technology Type

        • Electromagnetic Induction
        • Ground Penetrating Radar
        • Laser Scanning
        • Acoustic Emission
        • Radio Detection
      • FRANCE Underground Utility Mapping Market by Deployment Type

        • In-house
        • Outsourced
      • FRANCE Underground Utility Mapping Market by End-Use Sector Type

        • Construction
        • Utilities
        • Engineering
        • Telecommunications
      • FRANCE Underground Utility Mapping Market by Application Type

        • Damage Prevention
        • Asset Management
        • Planning and Design
        • Utility Relocation
      • FRANCE Underground Utility Mapping Market by Data Type

        • 2D Mapping
        • 3D Mapping
        • Point Data
        • Line Data
      • RUSSIA Outlook (USD Billion, 2019-2032)
      • RUSSIA Underground Utility Mapping Market by Technology Type

        • Electromagnetic Induction
        • Ground Penetrating Radar
        • Laser Scanning
        • Acoustic Emission
        • Radio Detection
      • RUSSIA Underground Utility Mapping Market by Deployment Type

        • In-house
        • Outsourced
      • RUSSIA Underground Utility Mapping Market by End-Use Sector Type

        • Construction
        • Utilities
        • Engineering
        • Telecommunications
      • RUSSIA Underground Utility Mapping Market by Application Type

        • Damage Prevention
        • Asset Management
        • Planning and Design
        • Utility Relocation
      • RUSSIA Underground Utility Mapping Market by Data Type

        • 2D Mapping
        • 3D Mapping
        • Point Data
        • Line Data
      • ITALY Outlook (USD Billion, 2019-2032)
      • ITALY Underground Utility Mapping Market by Technology Type

        • Electromagnetic Induction
        • Ground Penetrating Radar
        • Laser Scanning
        • Acoustic Emission
        • Radio Detection
      • ITALY Underground Utility Mapping Market by Deployment Type

        • In-house
        • Outsourced
      • ITALY Underground Utility Mapping Market by End-Use Sector Type

        • Construction
        • Utilities
        • Engineering
        • Telecommunications
      • ITALY Underground Utility Mapping Market by Application Type

        • Damage Prevention
        • Asset Management
        • Planning and Design
        • Utility Relocation
      • ITALY Underground Utility Mapping Market by Data Type

        • 2D Mapping
        • 3D Mapping
        • Point Data
        • Line Data
      • SPAIN Outlook (USD Billion, 2019-2032)
      • SPAIN Underground Utility Mapping Market by Technology Type

        • Electromagnetic Induction
        • Ground Penetrating Radar
        • Laser Scanning
        • Acoustic Emission
        • Radio Detection
      • SPAIN Underground Utility Mapping Market by Deployment Type

        • In-house
        • Outsourced
      • SPAIN Underground Utility Mapping Market by End-Use Sector Type

        • Construction
        • Utilities
        • Engineering
        • Telecommunications
      • SPAIN Underground Utility Mapping Market by Application Type

        • Damage Prevention
        • Asset Management
        • Planning and Design
        • Utility Relocation
      • SPAIN Underground Utility Mapping Market by Data Type

        • 2D Mapping
        • 3D Mapping
        • Point Data
        • Line Data
      • REST OF EUROPE Outlook (USD Billion, 2019-2032)
      • REST OF EUROPE Underground Utility Mapping Market by Technology Type

        • Electromagnetic Induction
        • Ground Penetrating Radar
        • Laser Scanning
        • Acoustic Emission
        • Radio Detection
      • REST OF EUROPE Underground Utility Mapping Market by Deployment Type

        • In-house
        • Outsourced
      • REST OF EUROPE Underground Utility Mapping Market by End-Use Sector Type

        • Construction
        • Utilities
        • Engineering
        • Telecommunications
      • REST OF EUROPE Underground Utility Mapping Market by Application Type

        • Damage Prevention
        • Asset Management
        • Planning and Design
        • Utility Relocation
      • REST OF EUROPE Underground Utility Mapping Market by Data Type

        • 2D Mapping
        • 3D Mapping
        • Point Data
        • Line Data
    • APAC Outlook (USD Billion, 2019-2032)

      • APAC Underground Utility Mapping Market by Technology Type

        • Electromagnetic Induction
        • Ground Penetrating Radar
        • Laser Scanning
        • Acoustic Emission
        • Radio Detection
      • APAC Underground Utility Mapping Market by Deployment Type

        • In-house
        • Outsourced
      • APAC Underground Utility Mapping Market by End-Use Sector Type

        • Construction
        • Utilities
        • Engineering
        • Telecommunications
      • APAC Underground Utility Mapping Market by Application Type

        • Damage Prevention
        • Asset Management
        • Planning and Design
        • Utility Relocation
      • APAC Underground Utility Mapping Market by Data Type

        • 2D Mapping
        • 3D Mapping
        • Point Data
        • Line Data
      • APAC Underground Utility Mapping Market by Regional Type

        • China
        • India
        • Japan
        • South Korea
        • Malaysia
        • Thailand
        • Indonesia
        • Rest of APAC
      • CHINA Outlook (USD Billion, 2019-2032)
      • CHINA Underground Utility Mapping Market by Technology Type

        • Electromagnetic Induction
        • Ground Penetrating Radar
        • Laser Scanning
        • Acoustic Emission
        • Radio Detection
      • CHINA Underground Utility Mapping Market by Deployment Type

        • In-house
        • Outsourced
      • CHINA Underground Utility Mapping Market by End-Use Sector Type

        • Construction
        • Utilities
        • Engineering
        • Telecommunications
      • CHINA Underground Utility Mapping Market by Application Type

        • Damage Prevention
        • Asset Management
        • Planning and Design
        • Utility Relocation
      • CHINA Underground Utility Mapping Market by Data Type

        • 2D Mapping
        • 3D Mapping
        • Point Data
        • Line Data
      • INDIA Outlook (USD Billion, 2019-2032)
      • INDIA Underground Utility Mapping Market by Technology Type

        • Electromagnetic Induction
        • Ground Penetrating Radar
        • Laser Scanning
        • Acoustic Emission
        • Radio Detection
      • INDIA Underground Utility Mapping Market by Deployment Type

        • In-house
        • Outsourced
      • INDIA Underground Utility Mapping Market by End-Use Sector Type

        • Construction
        • Utilities
        • Engineering
        • Telecommunications
      • INDIA Underground Utility Mapping Market by Application Type

        • Damage Prevention
        • Asset Management
        • Planning and Design
        • Utility Relocation
      • INDIA Underground Utility Mapping Market by Data Type

        • 2D Mapping
        • 3D Mapping
        • Point Data
        • Line Data
      • JAPAN Outlook (USD Billion, 2019-2032)
      • JAPAN Underground Utility Mapping Market by Technology Type

        • Electromagnetic Induction
        • Ground Penetrating Radar
        • Laser Scanning
        • Acoustic Emission
        • Radio Detection
      • JAPAN Underground Utility Mapping Market by Deployment Type

        • In-house
        • Outsourced
      • JAPAN Underground Utility Mapping Market by End-Use Sector Type

        • Construction
        • Utilities
        • Engineering
        • Telecommunications
      • JAPAN Underground Utility Mapping Market by Application Type

        • Damage Prevention
        • Asset Management
        • Planning and Design
        • Utility Relocation
      • JAPAN Underground Utility Mapping Market by Data Type

        • 2D Mapping
        • 3D Mapping
        • Point Data
        • Line Data
      • SOUTH KOREA Outlook (USD Billion, 2019-2032)
      • SOUTH KOREA Underground Utility Mapping Market by Technology Type

        • Electromagnetic Induction
        • Ground Penetrating Radar
        • Laser Scanning
        • Acoustic Emission
        • Radio Detection
      • SOUTH KOREA Underground Utility Mapping Market by Deployment Type

        • In-house
        • Outsourced
      • SOUTH KOREA Underground Utility Mapping Market by End-Use Sector Type

        • Construction
        • Utilities
        • Engineering
        • Telecommunications
      • SOUTH KOREA Underground Utility Mapping Market by Application Type

        • Damage Prevention
        • Asset Management
        • Planning and Design
        • Utility Relocation
      • SOUTH KOREA Underground Utility Mapping Market by Data Type

        • 2D Mapping
        • 3D Mapping
        • Point Data
        • Line Data
      • MALAYSIA Outlook (USD Billion, 2019-2032)
      • MALAYSIA Underground Utility Mapping Market by Technology Type

        • Electromagnetic Induction
        • Ground Penetrating Radar
        • Laser Scanning
        • Acoustic Emission
        • Radio Detection
      • MALAYSIA Underground Utility Mapping Market by Deployment Type

        • In-house
        • Outsourced
      • MALAYSIA Underground Utility Mapping Market by End-Use Sector Type

        • Construction
        • Utilities
        • Engineering
        • Telecommunications
      • MALAYSIA Underground Utility Mapping Market by Application Type

        • Damage Prevention
        • Asset Management
        • Planning and Design
        • Utility Relocation
      • MALAYSIA Underground Utility Mapping Market by Data Type

        • 2D Mapping
        • 3D Mapping
        • Point Data
        • Line Data
      • THAILAND Outlook (USD Billion, 2019-2032)
      • THAILAND Underground Utility Mapping Market by Technology Type

        • Electromagnetic Induction
        • Ground Penetrating Radar
        • Laser Scanning
        • Acoustic Emission
        • Radio Detection
      • THAILAND Underground Utility Mapping Market by Deployment Type

        • In-house
        • Outsourced
      • THAILAND Underground Utility Mapping Market by End-Use Sector Type

        • Construction
        • Utilities
        • Engineering
        • Telecommunications
      • THAILAND Underground Utility Mapping Market by Application Type

        • Damage Prevention
        • Asset Management
        • Planning and Design
        • Utility Relocation
      • THAILAND Underground Utility Mapping Market by Data Type

        • 2D Mapping
        • 3D Mapping
        • Point Data
        • Line Data
      • INDONESIA Outlook (USD Billion, 2019-2032)
      • INDONESIA Underground Utility Mapping Market by Technology Type

        • Electromagnetic Induction
        • Ground Penetrating Radar
        • Laser Scanning
        • Acoustic Emission
        • Radio Detection
      • INDONESIA Underground Utility Mapping Market by Deployment Type

        • In-house
        • Outsourced
      • INDONESIA Underground Utility Mapping Market by End-Use Sector Type

        • Construction
        • Utilities
        • Engineering
        • Telecommunications
      • INDONESIA Underground Utility Mapping Market by Application Type

        • Damage Prevention
        • Asset Management
        • Planning and Design
        • Utility Relocation
      • INDONESIA Underground Utility Mapping Market by Data Type

        • 2D Mapping
        • 3D Mapping
        • Point Data
        • Line Data
      • REST OF APAC Outlook (USD Billion, 2019-2032)
      • REST OF APAC Underground Utility Mapping Market by Technology Type

        • Electromagnetic Induction
        • Ground Penetrating Radar
        • Laser Scanning
        • Acoustic Emission
        • Radio Detection
      • REST OF APAC Underground Utility Mapping Market by Deployment Type

        • In-house
        • Outsourced
      • REST OF APAC Underground Utility Mapping Market by End-Use Sector Type

        • Construction
        • Utilities
        • Engineering
        • Telecommunications
      • REST OF APAC Underground Utility Mapping Market by Application Type

        • Damage Prevention
        • Asset Management
        • Planning and Design
        • Utility Relocation
      • REST OF APAC Underground Utility Mapping Market by Data Type

        • 2D Mapping
        • 3D Mapping
        • Point Data
        • Line Data
    • South America Outlook (USD Billion, 2019-2032)

      • South America Underground Utility Mapping Market by Technology Type

        • Electromagnetic Induction
        • Ground Penetrating Radar
        • Laser Scanning
        • Acoustic Emission
        • Radio Detection
      • South America Underground Utility Mapping Market by Deployment Type

        • In-house
        • Outsourced
      • South America Underground Utility Mapping Market by End-Use Sector Type

        • Construction
        • Utilities
        • Engineering
        • Telecommunications
      • South America Underground Utility Mapping Market by Application Type

        • Damage Prevention
        • Asset Management
        • Planning and Design
        • Utility Relocation
      • South America Underground Utility Mapping Market by Data Type

        • 2D Mapping
        • 3D Mapping
        • Point Data
        • Line Data
      • South America Underground Utility Mapping Market by Regional Type

        • Brazil
        • Mexico
        • Argentina
        • Rest of South America
      • BRAZIL Outlook (USD Billion, 2019-2032)
      • BRAZIL Underground Utility Mapping Market by Technology Type

        • Electromagnetic Induction
        • Ground Penetrating Radar
        • Laser Scanning
        • Acoustic Emission
        • Radio Detection
      • BRAZIL Underground Utility Mapping Market by Deployment Type

        • In-house
        • Outsourced
      • BRAZIL Underground Utility Mapping Market by End-Use Sector Type

        • Construction
        • Utilities
        • Engineering
        • Telecommunications
      • BRAZIL Underground Utility Mapping Market by Application Type

        • Damage Prevention
        • Asset Management
        • Planning and Design
        • Utility Relocation
      • BRAZIL Underground Utility Mapping Market by Data Type

        • 2D Mapping
        • 3D Mapping
        • Point Data
        • Line Data
      • MEXICO Outlook (USD Billion, 2019-2032)
      • MEXICO Underground Utility Mapping Market by Technology Type

        • Electromagnetic Induction
        • Ground Penetrating Radar
        • Laser Scanning
        • Acoustic Emission
        • Radio Detection
      • MEXICO Underground Utility Mapping Market by Deployment Type

        • In-house
        • Outsourced
      • MEXICO Underground Utility Mapping Market by End-Use Sector Type

        • Construction
        • Utilities
        • Engineering
        • Telecommunications
      • MEXICO Underground Utility Mapping Market by Application Type

        • Damage Prevention
        • Asset Management
        • Planning and Design
        • Utility Relocation
      • MEXICO Underground Utility Mapping Market by Data Type

        • 2D Mapping
        • 3D Mapping
        • Point Data
        • Line Data
      • ARGENTINA Outlook (USD Billion, 2019-2032)
      • ARGENTINA Underground Utility Mapping Market by Technology Type

        • Electromagnetic Induction
        • Ground Penetrating Radar
        • Laser Scanning
        • Acoustic Emission
        • Radio Detection
      • ARGENTINA Underground Utility Mapping Market by Deployment Type

        • In-house
        • Outsourced
      • ARGENTINA Underground Utility Mapping Market by End-Use Sector Type

        • Construction
        • Utilities
        • Engineering
        • Telecommunications
      • ARGENTINA Underground Utility Mapping Market by Application Type

        • Damage Prevention
        • Asset Management
        • Planning and Design
        • Utility Relocation
      • ARGENTINA Underground Utility Mapping Market by Data Type

        • 2D Mapping
        • 3D Mapping
        • Point Data
        • Line Data
      • REST OF SOUTH AMERICA Outlook (USD Billion, 2019-2032)
      • REST OF SOUTH AMERICA Underground Utility Mapping Market by Technology Type

        • Electromagnetic Induction
        • Ground Penetrating Radar
        • Laser Scanning
        • Acoustic Emission
        • Radio Detection
      • REST OF SOUTH AMERICA Underground Utility Mapping Market by Deployment Type

        • In-house
        • Outsourced
      • REST OF SOUTH AMERICA Underground Utility Mapping Market by End-Use Sector Type

        • Construction
        • Utilities
        • Engineering
        • Telecommunications
      • REST OF SOUTH AMERICA Underground Utility Mapping Market by Application Type

        • Damage Prevention
        • Asset Management
        • Planning and Design
        • Utility Relocation
      • REST OF SOUTH AMERICA Underground Utility Mapping Market by Data Type

        • 2D Mapping
        • 3D Mapping
        • Point Data
        • Line Data
    • MEA Outlook (USD Billion, 2019-2032)

      • MEA Underground Utility Mapping Market by Technology Type

        • Electromagnetic Induction
        • Ground Penetrating Radar
        • Laser Scanning
        • Acoustic Emission
        • Radio Detection
      • MEA Underground Utility Mapping Market by Deployment Type

        • In-house
        • Outsourced
      • MEA Underground Utility Mapping Market by End-Use Sector Type

        • Construction
        • Utilities
        • Engineering
        • Telecommunications
      • MEA Underground Utility Mapping Market by Application Type

        • Damage Prevention
        • Asset Management
        • Planning and Design
        • Utility Relocation
      • MEA Underground Utility Mapping Market by Data Type

        • 2D Mapping
        • 3D Mapping
        • Point Data
        • Line Data
      • MEA Underground Utility Mapping Market by Regional Type

        • GCC Countries
        • South Africa
        • Rest of MEA
      • GCC COUNTRIES Outlook (USD Billion, 2019-2032)
      • GCC COUNTRIES Underground Utility Mapping Market by Technology Type

        • Electromagnetic Induction
        • Ground Penetrating Radar
        • Laser Scanning
        • Acoustic Emission
        • Radio Detection
      • GCC COUNTRIES Underground Utility Mapping Market by Deployment Type

        • In-house
        • Outsourced
      • GCC COUNTRIES Underground Utility Mapping Market by End-Use Sector Type

        • Construction
        • Utilities
        • Engineering
        • Telecommunications
      • GCC COUNTRIES Underground Utility Mapping Market by Application Type

        • Damage Prevention
        • Asset Management
        • Planning and Design
        • Utility Relocation
      • GCC COUNTRIES Underground Utility Mapping Market by Data Type

        • 2D Mapping
        • 3D Mapping
        • Point Data
        • Line Data
      • SOUTH AFRICA Outlook (USD Billion, 2019-2032)
      • SOUTH AFRICA Underground Utility Mapping Market by Technology Type

        • Electromagnetic Induction
        • Ground Penetrating Radar
        • Laser Scanning
        • Acoustic Emission
        • Radio Detection
      • SOUTH AFRICA Underground Utility Mapping Market by Deployment Type

        • In-house
        • Outsourced
      • SOUTH AFRICA Underground Utility Mapping Market by End-Use Sector Type

        • Construction
        • Utilities
        • Engineering
        • Telecommunications
      • SOUTH AFRICA Underground Utility Mapping Market by Application Type

        • Damage Prevention
        • Asset Management
        • Planning and Design
        • Utility Relocation
      • SOUTH AFRICA Underground Utility Mapping Market by Data Type

        • 2D Mapping
        • 3D Mapping
        • Point Data
        • Line Data
      • REST OF MEA Outlook (USD Billion, 2019-2032)
      • REST OF MEA Underground Utility Mapping Market by Technology Type

        • Electromagnetic Induction
        • Ground Penetrating Radar
        • Laser Scanning
        • Acoustic Emission
        • Radio Detection
      • REST OF MEA Underground Utility Mapping Market by Deployment Type

        • In-house
        • Outsourced
      • REST OF MEA Underground Utility Mapping Market by End-Use Sector Type

        • Construction
        • Utilities
        • Engineering
        • Telecommunications
      • REST OF MEA Underground Utility Mapping Market by Application Type

        • Damage Prevention
        • Asset Management
        • Planning and Design
        • Utility Relocation
      • REST OF MEA Underground Utility Mapping Market by Data Type

        • 2D Mapping
        • 3D Mapping
        • Point Data
        • Line Data


    Report Infographic
    Free Sample Request

    Kindly complete the form below to receive a free sample of this Report

    Customer Strories

    “I am very pleased with how market segments have been defined in a relevant way for my purposes (such as "Portable Freezers & refrigerators" and "last-mile"). In general the report is well structured. Thanks very much for your efforts.”

    Victoria Milne Founder
    Case Study

    Chemicals and Materials