• Cat-intel
  • MedIntelliX
  • Resources
  • About Us
  • Request Free Sample ×

    Kindly complete the form below to receive a free sample of this Report

    Leading companies partner with us for data-driven Insights

    clients tt-cursor

    Transparent Digital Signage Coolers Market

    ID: MRFR/ICT/26389-HCR
    100 Pages
    Ankit Gupta
    September 2025

    Transparent Digital Signage Coolers Market Research Report By Product Type (Inline Transparent Coolers, Island Transparent Coolers, Back Bar Transparent Coolers), By Capacity (Below 100 Liters, 100-300 Liters, 300-500 Liters, 500 Liters and Above), By End User (Food Retail, Beverage Retail, Grocery Stores, Convenience Stores, Pharmacies), By Display Type (LCD Display, LED Display, OLED Display), By Connectivity (Wi-Fi Connectivity, Bluetooth Connectivity, NFC Connectivity) and By Regional (North America, Europe, South America, Asia Pacific, ...

    Share:
    Download PDF ×

    We do not share your information with anyone. However, we may send you emails based on your report interest from time to time. You may contact us at any time to opt-out.

    Transparent Digital Signage Coolers Market Research Report - Global Forecast till 2034 Infographic
    Purchase Options
    $ 4,950.0
    $ 5,950.0
    $ 7,250.0
    Table of Contents

    Transparent Digital Signage Coolers Market Summary

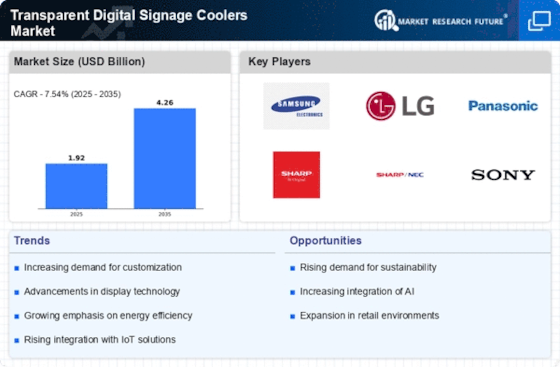
    The Global Transparent Digital Signage Coolers Market is projected to grow from 1.82 USD Billion in 2024 to 4.26 USD Billion by 2035.

    Key Market Trends & Highlights

    Transparent Digital Signage Coolers Key Trends and Highlights

    • The market is expected to witness a compound annual growth rate of 8.03 percent from 2025 to 2035.
    • By 2035, the market valuation is anticipated to reach 4.26 USD Billion, indicating robust growth.
    • In 2024, the market is valued at 1.82 USD Billion, reflecting a strong foundation for future expansion.
    • Growing adoption of transparent digital signage due to increasing demand for innovative retail solutions is a major market driver.

    Market Size & Forecast

    2024 Market Size 1.82 (USD Billion)
    2035 Market Size 4.26 (USD Billion)
    CAGR (2025-2035) 8.03%

    Major Players

    Samsung Electronics, LG Electronics, Sony, Sanyo, Neology, Xtreme Technologies, Jetmobile, Armagard, Elo Touch Solutions, Scala, Sharp, Toshiba, BrightSign, NoviSign, Cooler Cases, Ionex, Gemini

    Transparent Digital Signage Coolers Market Trends

    The growing popularity of digital out-of-home advertising and self-service retail stores are some of the factors that propel the use of transparent digital signage coolers. Some of the markets that can be tapped within the transparent digital signage coolers include emerging markets where there are new technologies and new potential markets.

    Emerging tendencies of internal advertising using transparent digital signage coolers include the application of artificial intelligence or machine learning specifically for the analysis of consumer sentiments, adopting the changes that help leverage the cloud, and trying out new geometries and materials. Machine Learning and Artificial Intelligence are being focused more on enhancing the productivity and efficiency of such campaigns, whereas anything related to content management and deployment is saved with the use of such oriented technological infrastructure. The adoption of new patterns, such as curved screens or transparent screens other than flat screens, is on the rise.

    The increasing demand for innovative retail solutions is driving the adoption of transparent digital signage coolers, which enhance product visibility while providing an engaging customer experience.

    U.S. Department of Commerce

    Transparent Digital Signage Coolers Market Drivers

    Market Growth Projections

    The Global Transparent Digital Signage Coolers Market Industry is poised for substantial growth, with projections indicating a market size of 1.82 USD Billion in 2024 and an anticipated increase to 4.26 USD Billion by 2035. This growth trajectory suggests a robust CAGR of 8.03% from 2025 to 2035, driven by factors such as technological advancements, increasing demand for interactive advertising, and a focus on brand visibility. The evolving landscape of retail and advertising continues to create opportunities for transparent digital signage coolers, positioning them as a vital component of modern marketing strategies.

    Growth of the E-commerce Sector

    The growth of the e-commerce sector positively impacts the Global Transparent Digital Signage Coolers Market Industry. As online shopping continues to expand, brick-and-mortar stores are compelled to enhance in-store experiences to attract customers. Transparent coolers provide an opportunity to showcase products in an engaging manner, bridging the gap between online and offline shopping experiences. Retailers are increasingly adopting these solutions to create visually appealing displays that draw customers into stores. This trend is expected to drive market growth, as businesses adapt to changing consumer preferences and seek innovative ways to enhance the shopping experience.

    Increasing Focus on Brand Visibility

    The Global Transparent Digital Signage Coolers Market Industry is driven by an increasing focus on brand visibility among businesses. Companies recognize the importance of standing out in a competitive landscape, and transparent coolers serve as an effective medium for brand promotion. By displaying products alongside engaging digital content, brands can capture consumer attention and enhance their market presence. This trend is particularly prevalent in retail environments, where visual merchandising plays a crucial role in influencing purchasing decisions. As a result, the market is expected to grow at a CAGR of 8.03% from 2025 to 2035, reflecting the ongoing commitment to innovative advertising solutions.

    Regulatory Support for Digital Signage

    Regulatory support for digital signage plays a crucial role in the Global Transparent Digital Signage Coolers Market Industry. Governments worldwide are increasingly recognizing the potential of digital signage as a tool for economic growth and consumer engagement. Policies that promote the use of digital displays in public spaces and commercial environments facilitate market expansion. Additionally, regulations that ensure safety and environmental standards contribute to the credibility of transparent coolers. As these supportive frameworks evolve, they are likely to encourage more businesses to invest in transparent digital signage solutions, further propelling market growth.

    Rising Demand for Interactive Advertising

    The Global Transparent Digital Signage Coolers Market Industry experiences a surge in demand for interactive advertising solutions. Retailers increasingly seek innovative ways to engage consumers, and transparent coolers provide a unique platform for showcasing products while delivering dynamic content. This trend is particularly evident in the food and beverage sector, where brands utilize transparent signage to enhance customer experience. As a result, the market is projected to reach 1.82 USD Billion in 2024, reflecting a growing recognition of the value of interactive displays in driving sales and customer engagement.

    Technological Advancements in Display Technology

    Technological advancements in display technology significantly influence the Global Transparent Digital Signage Coolers Market Industry. Innovations such as OLED and LCD technologies enhance the visual appeal and energy efficiency of transparent coolers. These advancements allow for high-definition graphics and vibrant colors, attracting consumer attention. As businesses prioritize sustainability, energy-efficient solutions become increasingly appealing. The integration of smart technology further enhances functionality, enabling remote management and content updates. This evolution in display technology is likely to contribute to the market's growth, with projections indicating a rise to 4.26 USD Billion by 2035.

    Market Segment Insights

    Transparent Digital Signage Coolers Market Product Type Insights

    The Transparent Digital Signage Coolers Market 2023 is segmented by product type as inline transparent coolers, island transparent coolers and Back Bar Transparent Coolers. The inline transparent coolers segment is expected to hold the largest market share in 2023 with over 40% of its revenue share in the global market due to the increasing popularity of inline transparent coolers in retail stores and other commercial places, where they are placed in the middle of the aisles or against the walls for better access to the customers.

    Additionally, inline transparent coolers are much more energy efficient than traditional coolers, which further drives its preference over other types of transparent coolers.The growth rate of the island transparent coolers is the highest as it is the largest type of transparent digital signage coolers and is placed in the center of stores or other high-traffic areas. The segment is characterized by the increasing demand for island transparent coolers in all types of large retail places, including supermarkets and convenience stores where different products need to be displayed.

    Overall, the back bar transparent coolers segment is forecasted to hold a significant revenue share of the market from 2024 to 2032, and due to its usage, which is mostly in the restaurant and hotel industry, this product type is forecasted to also experience a high growth rate.

    Figure2: Transparent Digital Signage Coolers Market, By Product Type, 2023 & 2032

    Source: Primary Research, Secondary Research, Market Research Future Database and Analyst Review

    Transparent Digital Signage Coolers Market Capacity Insights

    The Transparent Digital Signage Coolers Market is segmented by capacity into Below 100 Liters, 100-300 Liters, 300-500 Liters, and 500 Liters and Above. Among these segments, the 100-300 Liters segment is expected to hold the largest share of the market in 2023, accounting for approximately 40% of the Transparent Digital Signage Coolers Market revenue.

    The demand for 100-300 Liters transparent digital signage coolers is attributed to their versatility and suitability for various applications, including retail stores, restaurants, and healthcare facilities.The 300-500 Liters segment is also expected to experience significant growth over the forecast period, driven by the increasing adoption of larger-sized coolers in supermarkets and hypermarkets.

    Transparent Digital Signage Coolers Market End User Insights

    The end user segment of the Transparent Digital Signage Coolers Market is diverse, comprising various industries that utilize these coolers for product display and advertising. Key end users include: Food Retail: Supermarkets, hypermarkets, and convenience stores widely employ transparent digital signage coolers to showcase fresh produce, beverages, and perishable food items. The market in this segment is driven by the need to enhance product visibility and promote impulse purchases. Beverage Retail: Beverage companies leverage transparent digital signage coolers to promote their products in bars, restaurants, and convenience stores.These coolers effectively capture consumer attention and influence purchasing decisions.

    Grocery Stores: Grocery stores utilize transparent digital signage coolers to display a wide range of products, including dairy, deli items, and pre-packaged foods. They help increase sales by providing product information and enticing customers with visually appealing displays. Convenience Stores: Convenience stores rely on transparent digital signage coolers to maximize space and promote high-margin products. These coolers enable stores to showcase a variety of beverages, snacks, and ready-to-eat items.Pharmacies: Pharmacies use transparent digital signage coolers to display over-the-counter medications, health and beauty products, and other items. They provide essential product information and enhance the customer experience.

    The Transparent Digital Signage Coolers Market is expected to witness continued growth in the coming years, driven by technological advancements, increasing demand for digital signage solutions, and the expansion of the retail industry.

    Transparent Digital Signage Coolers Market Display Type Insights

    The Transparent Digital Signage Coolers Market is segmented based on Display Type into LCD Display, LED Display, and OLED Display. Among these segments, the LED Display segment is anticipated to hold the largest revenue share during the forecast period owing to its superior brightness, energy efficiency, and longer lifespan compared to LCD and OLED displays. The high demand for LED displays in various commercial applications, including retail stores, restaurants, and corporate offices, is driving the growth of this segment.

    For instance, the Transparent Digital Signage Coolers Market revenue for the LED Display segment is projected to reach USD 1.2 billion by 2024, exhibiting a robust growth rate of 8.5%.The increasing adoption of Transparent Digital Signage Coolers with LED displays in various end-use industries is attributed to the enhanced visual experience and captivating content delivery they offer.

    Transparent Digital Signage Coolers Market Connectivity Insights

    The connectivity segment plays a crucial role in the Transparent Digital Signage Coolers Market. Wi-Fi, Bluetooth, and NFC are the dominant connectivity technologies used in transparent digital signage coolers. Wi-Fi connectivity offers seamless integration with existing networks, enabling remote management and content updates. Bluetooth connectivity provides proximity-based interactions, allowing users to access product information or make purchases via their smartphones.

    NFC connectivity enables quick and secure transactions by simply tapping a compatible device on the cooler, enhancing customer convenience.The Transparent Digital Signage Coolers Market revenue is expected to reach USD 1.66 billion in 2023, with Wi-Fi Connectivity accounting for a significant share. The growing adoption of smart devices and the increasing demand for interactive customer experiences are driving the growth of the connectivity segment in the Transparent Digital Signage Coolers Market.

    Get more detailed insights about Transparent Digital Signage Coolers Market Research Report - Global Forecast till 2034

    Regional Insights

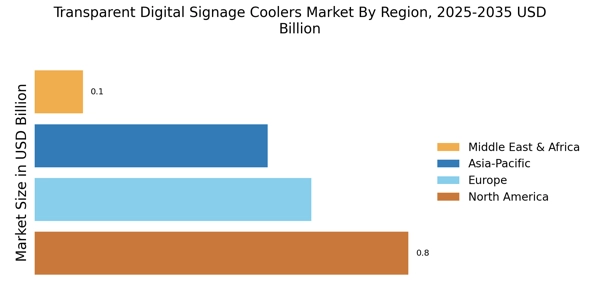
    The regional market segmentation includes North America, Europe, APAC, South America, and MEA. North America held the largest market share in 2023, owing to the early adoption of advanced technologies and the presence of key players in the region. Europe is expected to witness significant growth due to increasing demand for digital signage solutions in the retail and hospitality sectors. The APAC region is projected to be the fastest-growing market, driven by rapid urbanization and economic growth. South America and MEA are expected to witness steady growth due to increasing investments in infrastructure and tourism.

    Figure3: Transparent Digital Signage Coolers Market, By Regional, 2023 & 2032

    Transparent Digital Signage Coolers Market Regional Insights

    Source: Primary Research, Secondary Research, Market Research Future Database and Analyst Review

    Key Players and Competitive Insights

    Key players in the Transparent Digital Signage Coolers Market industry are steadily working towards increasing market share through investment in research and development, as well as by expanding their product portfolios. The Transparent Digital Signage Coolers Market is highly competitive, having a large number of market players. Leading players in the Transparent Digital Signage Coolers Market are trying to capture the lucrative market by focusing on product innovation through research and development, strategic alliances, and expanded presence in the consumer market.

    Transparent Digital Signage Coolers Market is very dynamic, with both established and emerging market players trying to establish their value proposition with customers.Samsung Electronics is one of the leading players in the Transparent Digital Signage Coolers Market, which has a wide variety of Transparent Digital Signage Cooler solutions. Samsung Electronics, having one of the most advanced display technologies and distribution networks, enjoys a strong presence in the Transparent Digital Signage Coolers Market. The company provides advanced, visually appealing products, which also prove to be useful advertising products.

    Samsung Electronics has been able to establish its leading position in the transparent digital signage coolers market on account of its customer-centric innovation and research and development, as well as its ability to provide cutting-edge products in the industry.LG Electronics is another leading player in the Transparent Digital Signage Coolers Market, having a full range of products to cater to the varying needs of the customers. LG’s products in the Transparent Digital Signage Coolers Market are known for their aesthetic values, sleek designs, energy efficiency, and ease of use.

    The company, with a strong network of partners, is also able to cover a wide range of customers in the industry. LG Electronics' strong positioning in the market is due to its focus on research and development, providing value-added products and solutions, and commitment to sustainability.

    Key Companies in the Transparent Digital Signage Coolers Market market include

    Industry Developments

    The Transparent Digital Signage Coolers Market is projected to grow from USD 1.66 billion in 2023 to USD 3.19 billion by 2032, exhibiting a CAGR of 7.54% during the forecast period. The increasing demand for digital signage in various commercial establishments, such as retail stores, restaurants, and corporate offices, is driving the market growth. Additionally, the growing adoption of the Internet of Things (IoT) and wireless technologies is enabling remote monitoring and control of these coolers, enhancing their functionality and convenience.

    Furthermore, the rising popularity of interactive digital signage, which allows customers to engage with products and services, is contributing to the market expansion.

    Future Outlook

    Transparent Digital Signage Coolers Market Future Outlook

    The Transparent Digital Signage Coolers Market is projected to grow at 8.03% CAGR from 2024 to 2035, driven by technological advancements and increasing demand for interactive displays.

    New opportunities lie in:

    • Develop eco-friendly cooling technologies to enhance energy efficiency.
    • Integrate AI-driven analytics for personalized customer engagement.
    • Expand into emerging markets with tailored marketing strategies.

    By 2035, the market is expected to achieve substantial growth, solidifying its position as a key player in digital signage.

    Market Segmentation

    Transparent Digital Signage Coolers Market Capacity Outlook

    • Below 100 Liters
    • 100-300 Liters
    • 300-500 Liters
    • 500 Liters and Above

    Transparent Digital Signage Coolers Market End User Outlook

    • Food Retail
    • Beverage Retail
    • Grocery Stores
    • Convenience Stores
    • Pharmacies

    Transparent Digital Signage Coolers Market Regional Outlook

    • North America
    • Europe
    • South America
    • Asia Pacific
    • Middle East and Africa

    Transparent Digital Signage Coolers Market Connectivity Outlook

    • Wi-Fi Connectivity
    • Bluetooth Connectivity
    • NFC Connectivity

    Transparent Digital Signage Coolers Market Display Type Outlook

    • LCD Display
    • LED Display
    • OLED Display

    Transparent Digital Signage Coolers Market Product Type Outlook

    • Inline Transparent Coolers
    • Island Transparent Coolers
    • Back Bar Transparent Coolers

    Report Scope

    Report Attribute/Metric Details
    Market Size 2024 1.91 (USD Billion)
    Market Size 2025 2.59 (USD Billion)
    Market Size 2034 3.96 (USD Billion)
    Compound Annual Growth Rate (CAGR) 7.54% (2025 - 2034)
    Report Coverage Revenue Forecast, Competitive Landscape, Growth Factors, and Trends
    Base Year 2024
    Market Forecast Period 2025 - 2034
    Historical Data 2019 - 2023
    Market Forecast Units USD Billion
    Key Companies Profiled Sony, Sanyo, Neology, Xtreme Technologies, Jetmobile, Armagard, Elo Touch Solutions, Scala, Sharp, Toshiba, BrightSign, NoviSign, Cooler Cases, Ionex, Gemini
    Segments Covered Product Type, Capacity, End User, Display Type, Connectivity, Regional
    Key Market Opportunities 1 Increasing Adoption of Digital Signage in Retail2 Growing Demand for EnergyEfficient Appliances3 Expanding Use in Healthcare and Hospitality4 Integration with Artificial Intelligence 5 Innovations in Touchscreen and Interactive Technologies
    Key Market Dynamics Rising demand for interactive displays Growing adoption in retail and hospitality Technological advancements Integration of IoT and AI Focus on energy efficiency
    Countries Covered North America, Europe, APAC, South America, MEA

    Market Highlights

    Author
    Ankit Gupta
    Senior Research Analyst

    Ankit Gupta is an analyst in market research industry in ICT and SEMI industry. With post-graduation in "Telecom and Marketing Management" and graduation in "Electronics and Telecommunication" vertical he is well versed with recent development in ICT industry as a whole. Having worked on more than 150+ reports including consultation for fortune 500 companies such as Microsoft and Rio Tinto in identifying solutions with respect to business problems his opinions are inclined towards mixture of technical and managerial aspects.

    Leave a Comment

    FAQs

    What was the current market size of the Transparent Digital Signage Coolers Market?

    As of 2023, the Transparent Digital Signage Coolers Market size was valued at approximately USD 1.78 Billion.

    What are the key factors driving the growth of the Transparent Digital Signage Coolers Market?

    The growth of the market is primarily attributed to the increasing adoption of digital signage solutions, rising demand for interactive and engaging customer experiences, and the growing popularity of transparent displays.

    What is the projected CAGR of the Transparent Digital Signage Coolers Market?

    The market is anticipated to expand at a CAGR of 7.54% from 2025 to 2034.

    Which region is expected to dominate the Transparent Digital Signage Coolers Market?

    North America is anticipated to hold a significant market share due to the early adoption of advanced technologies and a strong retail sector.

    Who are the major players in the Transparent Digital Signage Coolers Market?

    Some of the key players include Samsung Electronics, LG Electronics, NEC Display Solutions, Sharp NEC Display Solutions, and Leyard.

    What are the key applications of Transparent Digital Signage Coolers?

    Transparent digital signage coolers are primarily used in retail stores, restaurants, and other commercial establishments for product promotion, menu display, and interactive customer engagement.

    What are the future trends expected to shape the Transparent Digital Signage Coolers Market?

    Emerging trends include the integration of AI and IoT technologies, the adoption of cloud-based solutions, and the increasing demand for customized and interactive digital signage experiences.

    What is the expected market size of the Transparent Digital Signage Coolers Market by the end of the forecast period?

    The market is projected to reach a valuation of approximately USD 3.191 Billion by 2032.

    What are the challenges faced by the Transparent Digital Signage Coolers Market?

    Challenges include high initial investment costs, concerns over durability and maintenance, and the availability of alternative digital signage solutions.

    What are the opportunities for growth in the Transparent Digital Signage Coolers Market?

    Growth opportunities arise from the increasing demand for immersive and engaging customer experiences, the expansion of the retail and hospitality sectors, and advancements in display technologies.

    1. 'TABLE OF CONTENTS
    2. EXECUTIVE SUMMARY
    3. Market Overview
      1. Key Findings
      2. Market Segmentation
    4. Competitive Landscape
      1. Challenges and Opportunities
      2. Future Outlook
    5. MARKET INTRODUCTION
      1. Definition
      2. Scope of the study
        1. Research Objective
        2. Assumption
        3. Limitations
    6. RESEARCH METHODOLOGY
      1. Overview
    7. Data Mining
      1. Secondary Research
      2. Primary Research
    8. Primary Interviews and Information Gathering Process
      1. Breakdown of Primary
    9. Respondents
      1. Forecasting Model
      2. Market Size Estimation
    10. Bottom-Up Approach
      1. Top-Down Approach
      2. Data Triangulation
      3. Validation
    11. MARKET DYNAMICS
      1. Overview
      2. Drivers
      3. Restraints
      4. Opportunities
    12. MARKET FACTOR ANALYSIS
      1. Value chain Analysis
      2. Porter''s Five Forces
    13. Analysis
      1. Bargaining Power of Suppliers
        1. Bargaining Power
    14. of Buyers
      1. Threat of New Entrants
        1. Threat of Substitutes
        2. Intensity of Rivalry
      2. COVID-19 Impact Analysis
    15. Market Impact Analysis
      1. Regional Impact
        1. Opportunity and
    16. Threat Analysis
    17. TRANSPARENT DIGITAL SIGNAGE COOLERS MARKET,
    18. BY PRODUCT TYPE (USD BILLION)
      1. Inline Transparent Coolers
      2. Island
    19. Transparent Coolers
      1. Back Bar Transparent Coolers
    20. TRANSPARENT
    21. DIGITAL SIGNAGE COOLERS MARKET, BY CAPACITY (USD BILLION)
      1. Below 100 Liters
      2. 100-300 Liters
      3. 300-500 Liters
      4. 500 Liters and Above
    22. TRANSPARENT DIGITAL SIGNAGE COOLERS MARKET, BY END USER (USD BILLION)
      1. Food Retail
      2. Beverage Retail
      3. Grocery Stores
    23. Convenience Stores
      1. Pharmacies
    24. TRANSPARENT DIGITAL SIGNAGE COOLERS
    25. MARKET, BY DISPLAY TYPE (USD BILLION)
      1. LCD Display
      2. LED Display
      3. OLED Display
    26. TRANSPARENT DIGITAL SIGNAGE COOLERS MARKET, BY
    27. CONNECTIVITY (USD BILLION)
      1. Wi-Fi Connectivity
      2. Bluetooth
    28. Connectivity
      1. NFC Connectivity
    29. TRANSPARENT DIGITAL SIGNAGE
    30. COOLERS MARKET, BY REGIONAL (USD BILLION)
      1. North America
    31. US
      1. Canada
      2. Europe
        1. Germany
        2. UK
        3. France
        4. Russia
        5. Italy
        6. Spain
        7. Rest of Europe
      3. APAC
        1. China
    32. India
      1. Japan
        1. South Korea
        2. Malaysia
    33. Thailand
      1. Indonesia
        1. Rest of APAC
      2. South America
        1. Brazil
        2. Mexico
        3. Argentina
    34. Rest of South America
      1. MEA
        1. GCC Countries
    35. South Africa
      1. Rest of MEA
    36. COMPETITIVE LANDSCAPE
      1. Overview
      2. Competitive Analysis
      3. Market share Analysis
      4. Major Growth Strategy in the Transparent Digital Signage Coolers Market
      5. Competitive Benchmarking
      6. Leading Players in Terms of Number
    37. of Developments in the Transparent Digital Signage Coolers Market
      1. Key
    38. developments and growth strategies
      1. New Product Launch/Service Deployment
        1. Merger & Acquisitions
        2. Joint Ventures
    39. Major Players Financial Matrix
      1. Sales and Operating Income
    40. Major Players R&D Expenditure. 2023
    41. COMPANY PROFILES
      1. Sony
        1. Financial Overview
        2. Products Offered
        3. Key
    42. Developments
      1. SWOT Analysis
        1. Key Strategies
    43. Sanyo
      1. Financial Overview
        1. Products Offered
    44. Key Developments
      1. SWOT Analysis
        1. Key Strategies
    45. Neology
      1. Financial Overview
        1. Products Offered
    46. Key Developments
      1. SWOT Analysis
        1. Key Strategies
    47. Xtreme Technologies
      1. Financial Overview
        1. Products Offered
        2. Key Developments
        3. SWOT Analysis
        4. Key Strategies
      2. Jetmobile
        1. Financial Overview
        2. Products Offered
        3. Key Developments
        4. SWOT Analysis
        5. Key Strategies
      3. Armagard
        1. Financial Overview
        2. Products Offered
        3. Key Developments
        4. SWOT Analysis
        5. Key Strategies
      4. Elo Touch Solutions
        1. Financial Overview
        2. Products
    48. Offered
      1. Key Developments
        1. SWOT Analysis
    49. Key Strategies
      1. Scala
        1. Financial Overview
    50. Products Offered
      1. Key Developments
        1. SWOT Analysis
        2. Key Strategies
      2. Sharp
        1. Financial Overview
        2. Products Offered
        3. Key Developments
        4. SWOT Analysis
        5. Key Strategies
      3. Toshiba
        1. Financial Overview
        2. Products Offered
        3. Key Developments
        4. SWOT
    51. Analysis
      1. Key Strategies
      2. BrightSign
        1. Financial
    52. Overview
      1. Products Offered
        1. Key Developments
    53. SWOT Analysis
      1. Key Strategies
      2. NoviSign
    54. Financial Overview
      1. Products Offered
        1. Key Developments
        2. SWOT Analysis
        3. Key Strategies
      2. Cooler Cases
        1. Financial Overview
        2. Products Offered
    55. Key Developments
      1. SWOT Analysis
        1. Key Strategies
      2. Ionex
        1. Financial Overview
        2. Products Offered
        3. Key Developments
        4. SWOT Analysis
        5. Key
    56. Strategies
      1. Gemini
        1. Financial Overview
    57. Products Offered
      1. Key Developments
        1. SWOT Analysis
        2. Key Strategies
    58. APPENDIX
      1. References
    59. Related Reports
    60. & FORECAST, BY PRODUCT TYPE, 2019-2032 (USD BILLIONS)
    61. TRANSPARENT DIGITAL SIGNAGE COOLERS MARKET SIZE ESTIMATES & FORECAST, BY CAPACITY,
    62. 2032 (USD BILLIONS)
    63. COOLERS MARKET SIZE ESTIMATES & FORECAST, BY END USER, 2019-2032 (USD BILLIONS)
    64. & FORECAST, BY DISPLAY TYPE, 2019-2032 (USD BILLIONS)
    65. TRANSPARENT DIGITAL SIGNAGE COOLERS MARKET SIZE ESTIMATES & FORECAST, BY CONNECTIVITY,
    66. 2032 (USD BILLIONS)
    67. COOLERS MARKET SIZE ESTIMATES & FORECAST, BY REGIONAL, 2019-2032 (USD BILLIONS)
    68. FORECAST, BY PRODUCT TYPE, 2019-2032 (USD BILLIONS)
    69. DIGITAL SIGNAGE COOLERS MARKET SIZE ESTIMATES & FORECAST, BY CAPACITY, 2019-2032
    70. (USD BILLIONS)
    71. ESTIMATES & FORECAST, BY END USER, 2019-2032 (USD BILLIONS)
    72. US TRANSPARENT DIGITAL SIGNAGE COOLERS MARKET SIZE ESTIMATES & FORECAST, BY
    73. DISPLAY TYPE, 2019-2032 (USD BILLIONS)
    74. COOLERS MARKET SIZE ESTIMATES & FORECAST, BY CONNECTIVITY, 2019-2032 (USD BILLIONS)
    75. FORECAST, BY REGIONAL, 2019-2032 (USD BILLIONS)
    76. DIGITAL SIGNAGE COOLERS MARKET SIZE ESTIMATES & FORECAST, BY PRODUCT TYPE, 2019-2032
    77. (USD BILLIONS)
    78. SIZE ESTIMATES & FORECAST, BY CAPACITY, 2019-2032 (USD BILLIONS)
    79. CANADA TRANSPARENT DIGITAL SIGNAGE COOLERS MARKET SIZE ESTIMATES & FORECAST,
    80. BY END USER, 2019-2032 (USD BILLIONS)
    81. SIGNAGE COOLERS MARKET SIZE ESTIMATES & FORECAST, BY DISPLAY TYPE, 2019-2032
    82. (USD BILLIONS)
    83. SIZE ESTIMATES & FORECAST, BY CONNECTIVITY, 2019-2032 (USD BILLIONS)
    84. CANADA TRANSPARENT DIGITAL SIGNAGE COOLERS MARKET SIZE ESTIMATES & FORECAST,
    85. BY REGIONAL, 2019-2032 (USD BILLIONS)
    86. SIGNAGE COOLERS MARKET SIZE ESTIMATES & FORECAST, BY PRODUCT TYPE, 2019-2032
    87. (USD BILLIONS)
    88. SIZE ESTIMATES & FORECAST, BY CAPACITY, 2019-2032 (USD BILLIONS)
    89. EUROPE TRANSPARENT DIGITAL SIGNAGE COOLERS MARKET SIZE ESTIMATES & FORECAST,
    90. BY END USER, 2019-2032 (USD BILLIONS)
    91. SIGNAGE COOLERS MARKET SIZE ESTIMATES & FORECAST, BY DISPLAY TYPE, 2019-2032
    92. (USD BILLIONS)
    93. SIZE ESTIMATES & FORECAST, BY CONNECTIVITY, 2019-2032 (USD BILLIONS)
    94. EUROPE TRANSPARENT DIGITAL SIGNAGE COOLERS MARKET SIZE ESTIMATES & FORECAST,
    95. BY REGIONAL, 2019-2032 (USD BILLIONS)
    96. SIGNAGE COOLERS MARKET SIZE ESTIMATES & FORECAST, BY PRODUCT TYPE, 2019-2032
    97. (USD BILLIONS)
    98. SIZE ESTIMATES & FORECAST, BY CAPACITY, 2019-2032 (USD BILLIONS)
    99. GERMANY TRANSPARENT DIGITAL SIGNAGE COOLERS MARKET SIZE ESTIMATES & FORECAST,
    100. BY END USER, 2019-2032 (USD BILLIONS)
    101. SIGNAGE COOLERS MARKET SIZE ESTIMATES & FORECAST, BY DISPLAY TYPE, 2019-2032
    102. (USD BILLIONS)
    103. SIZE ESTIMATES & FORECAST, BY CONNECTIVITY, 2019-2032 (USD BILLIONS)
    104. GERMANY TRANSPARENT DIGITAL SIGNAGE COOLERS MARKET SIZE ESTIMATES & FORECAST,
    105. BY REGIONAL, 2019-2032 (USD BILLIONS)
    106. COOLERS MARKET SIZE ESTIMATES & FORECAST, BY PRODUCT TYPE, 2019-2032 (USD BILLIONS)
    107. FORECAST, BY CAPACITY, 2019-2032 (USD BILLIONS)
    108. SIGNAGE COOLERS MARKET SIZE ESTIMATES & FORECAST, BY END USER, 2019-2032 (USD
    109. BILLIONS)
    110. & FORECAST, BY DISPLAY TYPE, 2019-2032 (USD BILLIONS)
    111. DIGITAL SIGNAGE COOLERS MARKET SIZE ESTIMATES & FORECAST, BY CONNECTIVITY, 2019-2032
    112. (USD BILLIONS)
    113. ESTIMATES & FORECAST, BY REGIONAL, 2019-2032 (USD BILLIONS)
    114. FRANCE TRANSPARENT DIGITAL SIGNAGE COOLERS MARKET SIZE ESTIMATES & FORECAST,
    115. BY PRODUCT TYPE, 2019-2032 (USD BILLIONS)
    116. SIGNAGE COOLERS MARKET SIZE ESTIMATES & FORECAST, BY CAPACITY, 2019-2032 (USD
    117. BILLIONS)
    118. ESTIMATES & FORECAST, BY END USER, 2019-2032 (USD BILLIONS)
    119. FRANCE TRANSPARENT DIGITAL SIGNAGE COOLERS MARKET SIZE ESTIMATES & FORECAST,
    120. BY DISPLAY TYPE, 2019-2032 (USD BILLIONS)
    121. SIGNAGE COOLERS MARKET SIZE ESTIMATES & FORECAST, BY CONNECTIVITY, 2019-2032
    122. (USD BILLIONS)
    123. SIZE ESTIMATES & FORECAST, BY REGIONAL, 2019-2032 (USD BILLIONS)
    124. RUSSIA TRANSPARENT DIGITAL SIGNAGE COOLERS MARKET SIZE ESTIMATES & FORECAST,
    125. BY PRODUCT TYPE, 2019-2032 (USD BILLIONS)
    126. SIGNAGE COOLERS MARKET SIZE ESTIMATES & FORECAST, BY CAPACITY, 2019-2032 (USD
    127. BILLIONS)
    128. ESTIMATES & FORECAST, BY END USER, 2019-2032 (USD BILLIONS)
    129. RUSSIA TRANSPARENT DIGITAL SIGNAGE COOLERS MARKET SIZE ESTIMATES & FORECAST,
    130. BY DISPLAY TYPE, 2019-2032 (USD BILLIONS)
    131. SIGNAGE COOLERS MARKET SIZE ESTIMATES & FORECAST, BY CONNECTIVITY, 2019-2032
    132. (USD BILLIONS)
    133. SIZE ESTIMATES & FORECAST, BY REGIONAL, 2019-2032 (USD BILLIONS)
    134. ITALY TRANSPARENT DIGITAL SIGNAGE COOLERS MARKET SIZE ESTIMATES & FORECAST,
    135. BY PRODUCT TYPE, 2019-2032 (USD BILLIONS)
    136. SIGNAGE COOLERS MARKET SIZE ESTIMATES & FORECAST, BY CAPACITY, 2019-2032 (USD
    137. BILLIONS)
    138. ESTIMATES & FORECAST, BY END USER, 2019-2032 (USD BILLIONS)
    139. ITALY TRANSPARENT DIGITAL SIGNAGE COOLERS MARKET SIZE ESTIMATES & FORECAST,
    140. BY DISPLAY TYPE, 2019-2032 (USD BILLIONS)
    141. SIGNAGE COOLERS MARKET SIZE ESTIMATES & FORECAST, BY CONNECTIVITY, 2019-2032
    142. (USD BILLIONS)
    143. SIZE ESTIMATES & FORECAST, BY REGIONAL, 2019-2032 (USD BILLIONS)
    144. SPAIN TRANSPARENT DIGITAL SIGNAGE COOLERS MARKET SIZE ESTIMATES & FORECAST,
    145. BY PRODUCT TYPE, 2019-2032 (USD BILLIONS)
    146. SIGNAGE COOLERS MARKET SIZE ESTIMATES & FORECAST, BY CAPACITY, 2019-2032 (USD
    147. BILLIONS)
    148. ESTIMATES & FORECAST, BY END USER, 2019-2032 (USD BILLIONS)
    149. SPAIN TRANSPARENT DIGITAL SIGNAGE COOLERS MARKET SIZE ESTIMATES & FORECAST,
    150. BY DISPLAY TYPE, 2019-2032 (USD BILLIONS)
    151. SIGNAGE COOLERS MARKET SIZE ESTIMATES & FORECAST, BY CONNECTIVITY, 2019-2032
    152. (USD BILLIONS)
    153. SIZE ESTIMATES & FORECAST, BY REGIONAL, 2019-2032 (USD BILLIONS)
    154. REST OF EUROPE TRANSPARENT DIGITAL SIGNAGE COOLERS MARKET SIZE ESTIMATES &
    155. FORECAST, BY PRODUCT TYPE, 2019-2032 (USD BILLIONS)
    156. TRANSPARENT DIGITAL SIGNAGE COOLERS MARKET SIZE ESTIMATES & FORECAST, BY CAPACITY,
    157. 2032 (USD BILLIONS)
    158. COOLERS MARKET SIZE ESTIMATES & FORECAST, BY END USER, 2019-2032 (USD BILLIONS)
    159. & FORECAST, BY DISPLAY TYPE, 2019-2032 (USD BILLIONS)
    160. EUROPE TRANSPARENT DIGITAL SIGNAGE COOLERS MARKET SIZE ESTIMATES & FORECAST,
    161. BY CONNECTIVITY, 2019-2032 (USD BILLIONS)
    162. DIGITAL SIGNAGE COOLERS MARKET SIZE ESTIMATES & FORECAST, BY REGIONAL, 2019-2032
    163. (USD BILLIONS)
    164. ESTIMATES & FORECAST, BY PRODUCT TYPE, 2019-2032 (USD BILLIONS)
    165. APAC TRANSPARENT DIGITAL SIGNAGE COOLERS MARKET SIZE ESTIMATES & FORECAST,
    166. BY CAPACITY, 2019-2032 (USD BILLIONS)
    167. COOLERS MARKET SIZE ESTIMATES & FORECAST, BY END USER, 2019-2032 (USD BILLIONS)
    168. FORECAST, BY DISPLAY TYPE, 2019-2032 (USD BILLIONS)
    169. DIGITAL SIGNAGE COOLERS MARKET SIZE ESTIMATES & FORECAST, BY CONNECTIVITY, 2019-2032
    170. (USD BILLIONS)
    171. ESTIMATES & FORECAST, BY REGIONAL, 2019-2032 (USD BILLIONS)
    172. CHINA TRANSPARENT DIGITAL SIGNAGE COOLERS MARKET SIZE ESTIMATES & FORECAST,
    173. BY PRODUCT TYPE, 2019-2032 (USD BILLIONS)
    174. SIGNAGE COOLERS MARKET SIZE ESTIMATES & FORECAST, BY CAPACITY, 2019-2032 (USD
    175. BILLIONS)
    176. ESTIMATES & FORECAST, BY END USER, 2019-2032 (USD BILLIONS)
    177. CHINA TRANSPARENT DIGITAL SIGNAGE COOLERS MARKET SIZE ESTIMATES & FORECAST,
    178. BY DISPLAY TYPE, 2019-2032 (USD BILLIONS)
    179. SIGNAGE COOLERS MARKET SIZE ESTIMATES & FORECAST, BY CONNECTIVITY, 2019-2032
    180. (USD BILLIONS)
    181. SIZE ESTIMATES & FORECAST, BY REGIONAL, 2019-2032 (USD BILLIONS)
    182. INDIA TRANSPARENT DIGITAL SIGNAGE COOLERS MARKET SIZE ESTIMATES & FORECAST,
    183. BY PRODUCT TYPE, 2019-2032 (USD BILLIONS)
    184. SIGNAGE COOLERS MARKET SIZE ESTIMATES & FORECAST, BY CAPACITY, 2019-2032 (USD
    185. BILLIONS)
    186. ESTIMATES & FORECAST, BY END USER, 2019-2032 (USD BILLIONS)
    187. INDIA TRANSPARENT DIGITAL SIGNAGE COOLERS MARKET SIZE ESTIMATES & FORECAST,
    188. BY DISPLAY TYPE, 2019-2032 (USD BILLIONS)
    189. SIGNAGE COOLERS MARKET SIZE ESTIMATES & FORECAST, BY CONNECTIVITY, 2019-2032
    190. (USD BILLIONS)
    191. SIZE ESTIMATES & FORECAST, BY REGIONAL, 2019-2032 (USD BILLIONS)
    192. JAPAN TRANSPARENT DIGITAL SIGNAGE COOLERS MARKET SIZE ESTIMATES & FORECAST,
    193. BY PRODUCT TYPE, 2019-2032 (USD BILLIONS)
    194. SIGNAGE COOLERS MARKET SIZE ESTIMATES & FORECAST, BY CAPACITY, 2019-2032 (USD
    195. BILLIONS)
    196. ESTIMATES & FORECAST, BY END USER, 2019-2032 (USD BILLIONS)
    197. JAPAN TRANSPARENT DIGITAL SIGNAGE COOLERS MARKET SIZE ESTIMATES & FORECAST,
    198. BY DISPLAY TYPE, 2019-2032 (USD BILLIONS)
    199. SIGNAGE COOLERS MARKET SIZE ESTIMATES & FORECAST, BY CONNECTIVITY, 2019-2032
    200. (USD BILLIONS)
    201. SIZE ESTIMATES & FORECAST, BY REGIONAL, 2019-2032 (USD BILLIONS)
    202. SOUTH KOREA TRANSPARENT DIGITAL SIGNAGE COOLERS MARKET SIZE ESTIMATES &
    203. FORECAST, BY PRODUCT TYPE, 2019-2032 (USD BILLIONS)
    204. TRANSPARENT DIGITAL SIGNAGE COOLERS MARKET SIZE ESTIMATES & FORECAST, BY CAPACITY,
    205. 2032 (USD BILLIONS)
    206. COOLERS MARKET SIZE ESTIMATES & FORECAST, BY END USER, 2019-2032 (USD BILLIONS)
    207. & FORECAST, BY DISPLAY TYPE, 2019-2032 (USD BILLIONS)
    208. KOREA TRANSPARENT DIGITAL SIGNAGE COOLERS MARKET SIZE ESTIMATES & FORECAST,
    209. BY CONNECTIVITY, 2019-2032 (USD BILLIONS)
    210. DIGITAL SIGNAGE COOLERS MARKET SIZE ESTIMATES & FORECAST, BY REGIONAL, 2019-2032
    211. (USD BILLIONS)
    212. SIZE ESTIMATES & FORECAST, BY PRODUCT TYPE, 2019-2032 (USD BILLIONS)
    213. MALAYSIA TRANSPARENT DIGITAL SIGNAGE COOLERS MARKET SIZE ESTIMATES & FORECAST,
    214. BY CAPACITY, 2019-2032 (USD BILLIONS)
    215. SIGNAGE COOLERS MARKET SIZE ESTIMATES & FORECAST, BY END USER, 2019-2032 (USD
    216. BILLIONS)
    217. ESTIMATES & FORECAST, BY DISPLAY TYPE, 2019-2032 (USD BILLIONS)
    218. MALAYSIA TRANSPARENT DIGITAL SIGNAGE COOLERS MARKET SIZE ESTIMATES & FORECAST,
    219. BY CONNECTIVITY, 2019-2032 (USD BILLIONS)
    220. DIGITAL SIGNAGE COOLERS MARKET SIZE ESTIMATES & FORECAST, BY REGIONAL, 2019-2032
    221. (USD BILLIONS)
    222. SIZE ESTIMATES & FORECAST, BY PRODUCT TYPE, 2019-2032 (USD BILLIONS)
    223. THAILAND TRANSPARENT DIGITAL SIGNAGE COOLERS MARKET SIZE ESTIMATES & FORECAST,
    224. BY CAPACITY, 2019-2032 (USD BILLIONS)
    225. SIGNAGE COOLERS MARKET SIZE ESTIMATES & FORECAST, BY END USER, 2019-2032 (USD
    226. BILLIONS)
    227. ESTIMATES & FORECAST, BY DISPLAY TYPE, 2019-2032 (USD BILLIONS)
    228. THAILAND TRANSPARENT DIGITAL SIGNAGE COOLERS MARKET SIZE ESTIMATES & FORECAST,
    229. BY CONNECTIVITY, 2019-2032 (USD BILLIONS)
    230. DIGITAL SIGNAGE COOLERS MARKET SIZE ESTIMATES & FORECAST, BY REGIONAL, 2019-2032
    231. (USD BILLIONS)
    232. SIZE ESTIMATES & FORECAST, BY PRODUCT TYPE, 2019-2032 (USD BILLIONS)
    233. INDONESIA TRANSPARENT DIGITAL SIGNAGE COOLERS MARKET SIZE ESTIMATES & FORECAST,
    234. BY CAPACITY, 2019-2032 (USD BILLIONS)
    235. SIGNAGE COOLERS MARKET SIZE ESTIMATES & FORECAST, BY END USER, 2019-2032 (USD
    236. BILLIONS)
    237. SIZE ESTIMATES & FORECAST, BY DISPLAY TYPE, 2019-2032 (USD BILLIONS)
    238. INDONESIA TRANSPARENT DIGITAL SIGNAGE COOLERS MARKET SIZE ESTIMATES & FORECAST,
    239. BY CONNECTIVITY, 2019-2032 (USD BILLIONS)
    240. DIGITAL SIGNAGE COOLERS MARKET SIZE ESTIMATES & FORECAST, BY REGIONAL, 2019-2032
    241. (USD BILLIONS)
    242. MARKET SIZE ESTIMATES & FORECAST, BY PRODUCT TYPE, 2019-2032 (USD BILLIONS)
    243. & FORECAST, BY CAPACITY, 2019-2032 (USD BILLIONS)
    244. TRANSPARENT DIGITAL SIGNAGE COOLERS MARKET SIZE ESTIMATES & FORECAST, BY END
    245. USER, 2019-2032 (USD BILLIONS)
    246. SIGNAGE COOLERS MARKET SIZE ESTIMATES & FORECAST, BY DISPLAY TYPE, 2019-2032
    247. (USD BILLIONS)
    248. MARKET SIZE ESTIMATES & FORECAST, BY CONNECTIVITY, 2019-2032 (USD BILLIONS)
    249. & FORECAST, BY REGIONAL, 2019-2032 (USD BILLIONS)
    250. TRANSPARENT DIGITAL SIGNAGE COOLERS MARKET SIZE ESTIMATES & FORECAST, BY PRODUCT
    251. TYPE, 2019-2032 (USD BILLIONS)
    252. SIGNAGE COOLERS MARKET SIZE ESTIMATES & FORECAST, BY CAPACITY, 2019-2032 (USD
    253. BILLIONS)
    254. SIZE ESTIMATES & FORECAST, BY END USER, 2019-2032 (USD BILLIONS)
    255. SOUTH AMERICA TRANSPARENT DIGITAL SIGNAGE COOLERS MARKET SIZE ESTIMATES &
    256. FORECAST, BY DISPLAY TYPE, 2019-2032 (USD BILLIONS)
    257. TRANSPARENT DIGITAL SIGNAGE COOLERS MARKET SIZE ESTIMATES & FORECAST, BY CONNECTIVITY,
    258. 2032 (USD BILLIONS)
    259. COOLERS MARKET SIZE ESTIMATES & FORECAST, BY REGIONAL, 2019-2032 (USD BILLIONS)
    260. & FORECAST, BY PRODUCT TYPE, 2019-2032 (USD BILLIONS)
    261. TRANSPARENT DIGITAL SIGNAGE COOLERS MARKET SIZE ESTIMATES & FORECAST, BY CAPACITY,
    262. 2032 (USD BILLIONS)
    263. MARKET SIZE ESTIMATES & FORECAST, BY END USER, 2019-2032 (USD BILLIONS)
    264. FORECAST, BY DISPLAY TYPE, 2019-2032 (USD BILLIONS)
    265. DIGITAL SIGNAGE COOLERS MARKET SIZE ESTIMATES & FORECAST, BY CONNECTIVITY, 2019-2032
    266. (USD BILLIONS)
    267. SIZE ESTIMATES & FORECAST, BY REGIONAL, 2019-2032 (USD BILLIONS)
    268. MEXICO TRANSPARENT DIGITAL SIGNAGE COOLERS MARKET SIZE ESTIMATES & FORECAST,
    269. BY PRODUCT TYPE, 2019-2032 (USD BILLIONS)
    270. SIGNAGE COOLERS MARKET SIZE ESTIMATES & FORECAST, BY CAPACITY, 2019-2032 (USD
    271. BILLIONS)
    272. ESTIMATES & FORECAST, BY END USER, 2019-2032 (USD BILLIONS)
    273. MEXICO TRANSPARENT DIGITAL SIGNAGE COOLERS MARKET SIZE ESTIMATES & FORECAST,
    274. BY DISPLAY TYPE, 2019-2032 (USD BILLIONS)
    275. SIGNAGE COOLERS MARKET SIZE ESTIMATES & FORECAST, BY CONNECTIVITY, 2019-2032
    276. (USD BILLIONS)
    277. SIZE ESTIMATES & FORECAST, BY REGIONAL, 2019-2032 (USD BILLIONS)
    278. ARGENTINA TRANSPARENT DIGITAL SIGNAGE COOLERS MARKET SIZE ESTIMATES & FORECAST,
    279. BY PRODUCT TYPE, 2019-2032 (USD BILLIONS)
    280. DIGITAL SIGNAGE COOLERS MARKET SIZE ESTIMATES & FORECAST, BY CAPACITY, 2019-2032
    281. (USD BILLIONS)
    282. SIZE ESTIMATES & FORECAST, BY END USER, 2019-2032 (USD BILLIONS)
    283. ARGENTINA TRANSPARENT DIGITAL SIGNAGE COOLERS MARKET SIZE ESTIMATES & FORECAST,
    284. BY DISPLAY TYPE, 2019-2032 (USD BILLIONS)
    285. DIGITAL SIGNAGE COOLERS MARKET SIZE ESTIMATES & FORECAST, BY CONNECTIVITY, 2019-2032
    286. (USD BILLIONS)
    287. SIZE ESTIMATES & FORECAST, BY REGIONAL, 2019-2032 (USD BILLIONS)
    288. REST OF SOUTH AMERICA TRANSPARENT DIGITAL SIGNAGE COOLERS MARKET SIZE ESTIMATES
    289. & FORECAST, BY PRODUCT TYPE, 2019-2032 (USD BILLIONS)
    290. OF SOUTH AMERICA TRANSPARENT DIGITAL SIGNAGE COOLERS MARKET SIZE ESTIMATES &
    291. FORECAST, BY CAPACITY, 2019-2032 (USD BILLIONS)
    292. TRANSPARENT DIGITAL SIGNAGE COOLERS MARKET SIZE ESTIMATES & FORECAST, BY END
    293. USER, 2019-2032 (USD BILLIONS)
    294. DIGITAL SIGNAGE COOLERS MARKET SIZE ESTIMATES & FORECAST, BY DISPLAY TYPE, 2019-2032
    295. (USD BILLIONS)
    296. COOLERS MARKET SIZE ESTIMATES & FORECAST, BY CONNECTIVITY, 2019-2032 (USD BILLIONS)
    297. SIZE ESTIMATES & FORECAST, BY REGIONAL, 2019-2032 (USD BILLIONS)
    298. MEA TRANSPARENT DIGITAL SIGNAGE COOLERS MARKET SIZE ESTIMATES & FORECAST,
    299. BY PRODUCT TYPE, 2019-2032 (USD BILLIONS)
    300. SIGNAGE COOLERS MARKET SIZE ESTIMATES & FORECAST, BY CAPACITY, 2019-2032 (USD
    301. BILLIONS)
    302. & FORECAST, BY END USER, 2019-2032 (USD BILLIONS)
    303. DIGITAL SIGNAGE COOLERS MARKET SIZE ESTIMATES & FORECAST, BY DISPLAY TYPE, 2019-2032
    304. (USD BILLIONS)
    305. ESTIMATES & FORECAST, BY CONNECTIVITY, 2019-2032 (USD BILLIONS)
    306. MEA TRANSPARENT DIGITAL SIGNAGE COOLERS MARKET SIZE ESTIMATES & FORECAST,
    307. BY REGIONAL, 2019-2032 (USD BILLIONS)
    308. DIGITAL SIGNAGE COOLERS MARKET SIZE ESTIMATES & FORECAST, BY PRODUCT TYPE, 2019-2032
    309. (USD BILLIONS)
    310. MARKET SIZE ESTIMATES & FORECAST, BY CAPACITY, 2019-2032 (USD BILLIONS)
    311. & FORECAST, BY END USER, 2019-2032 (USD BILLIONS)
    312. TRANSPARENT DIGITAL SIGNAGE COOLERS MARKET SIZE ESTIMATES & FORECAST, BY DISPLAY
    313. TYPE, 2019-2032 (USD BILLIONS)
    314. SIGNAGE COOLERS MARKET SIZE ESTIMATES & FORECAST, BY CONNECTIVITY, 2019-2032
    315. (USD BILLIONS)
    316. MARKET SIZE ESTIMATES & FORECAST, BY REGIONAL, 2019-2032 (USD BILLIONS)
    317. & FORECAST, BY PRODUCT TYPE, 2019-2032 (USD BILLIONS)
    318. AFRICA TRANSPARENT DIGITAL SIGNAGE COOLERS MARKET SIZE ESTIMATES & FORECAST,
    319. BY CAPACITY, 2019-2032 (USD BILLIONS)
    320. DIGITAL SIGNAGE COOLERS MARKET SIZE ESTIMATES & FORECAST, BY END USER, 2019-2032
    321. (USD BILLIONS)
    322. MARKET SIZE ESTIMATES & FORECAST, BY DISPLAY TYPE, 2019-2032 (USD BILLIONS)
    323. & FORECAST, BY CONNECTIVITY, 2019-2032 (USD BILLIONS)
    324. AFRICA TRANSPARENT DIGITAL SIGNAGE COOLERS MARKET SIZE ESTIMATES & FORECAST,
    325. BY REGIONAL, 2019-2032 (USD BILLIONS)
    326. SIGNAGE COOLERS MARKET SIZE ESTIMATES & FORECAST, BY PRODUCT TYPE, 2019-2032
    327. (USD BILLIONS)
    328. MARKET SIZE ESTIMATES & FORECAST, BY CAPACITY, 2019-2032 (USD BILLIONS)
    329. & FORECAST, BY END USER, 2019-2032 (USD BILLIONS)
    330. TRANSPARENT DIGITAL SIGNAGE COOLERS MARKET SIZE ESTIMATES & FORECAST, BY DISPLAY
    331. TYPE, 2019-2032 (USD BILLIONS)
    332. SIGNAGE COOLERS MARKET SIZE ESTIMATES & FORECAST, BY CONNECTIVITY, 2019-2032
    333. (USD BILLIONS)
    334. MARKET SIZE ESTIMATES & FORECAST, BY REGIONAL, 2019-2032 (USD BILLIONS)
    335. NORTH AMERICA TRANSPARENT DIGITAL SIGNAGE COOLERS MARKET ANALYSIS
    336. US TRANSPARENT DIGITAL SIGNAGE COOLERS MARKET ANALYSIS BY PRODUCT TYPE
    337. US TRANSPARENT DIGITAL SIGNAGE COOLERS MARKET ANALYSIS BY CAPACITY
    338. US TRANSPARENT DIGITAL SIGNAGE COOLERS MARKET ANALYSIS BY END USER
    339. US TRANSPARENT DIGITAL SIGNAGE COOLERS MARKET ANALYSIS BY DISPLAY TYPE
    340. US TRANSPARENT DIGITAL SIGNAGE COOLERS MARKET ANALYSIS BY CONNECTIVITY
    341. US TRANSPARENT DIGITAL SIGNAGE COOLERS MARKET ANALYSIS BY REGIONAL
    342. CANADA TRANSPARENT DIGITAL SIGNAGE COOLERS MARKET ANALYSIS BY PRODUCT TYPE
    343. USER
    344. BY DISPLAY TYPE
    345. ANALYSIS BY CONNECTIVITY
    346. MARKET ANALYSIS BY REGIONAL
    347. COOLERS MARKET ANALYSIS
    348. MARKET ANALYSIS BY PRODUCT TYPE
    349. COOLERS MARKET ANALYSIS BY CAPACITY
    350. SIGNAGE COOLERS MARKET ANALYSIS BY END USER
    351. DIGITAL SIGNAGE COOLERS MARKET ANALYSIS BY DISPLAY TYPE
    352. TRANSPARENT DIGITAL SIGNAGE COOLERS MARKET ANALYSIS BY CONNECTIVITY
    353. GERMANY TRANSPARENT DIGITAL SIGNAGE COOLERS MARKET ANALYSIS BY REGIONAL
    354. TYPE
    355. CONNECTIVITY
    356. BY REGIONAL
    357. BY PRODUCT TYPE
    358. ANALYSIS BY CAPACITY
    359. MARKET ANALYSIS BY END USER
    360. COOLERS MARKET ANALYSIS BY DISPLAY TYPE
    361. SIGNAGE COOLERS MARKET ANALYSIS BY CONNECTIVITY
    362. DIGITAL SIGNAGE COOLERS MARKET ANALYSIS BY REGIONAL
    363. DIGITAL SIGNAGE COOLERS MARKET ANALYSIS BY PRODUCT TYPE
    364. TRANSPARENT DIGITAL SIGNAGE COOLERS MARKET ANALYSIS BY CAPACITY
    365. RUSSIA TRANSPARENT DIGITAL SIGNAGE COOLERS MARKET ANALYSIS BY END USER
    366. RUSSIA TRANSPARENT DIGITAL SIGNAGE COOLERS MARKET ANALYSIS BY DISPLAY TYPE
    367. TYPE
    368. BY CAPACITY
    369. BY END USER
    370. BY DISPLAY TYPE
    371. ANALYSIS BY CONNECTIVITY
    372. MARKET ANALYSIS BY REGIONAL
    373. MARKET ANALYSIS BY PRODUCT TYPE
    374. COOLERS MARKET ANALYSIS BY CAPACITY
    375. COOLERS MARKET ANALYSIS BY END USER
    376. COOLERS MARKET ANALYSIS BY DISPLAY TYPE
    377. SIGNAGE COOLERS MARKET ANALYSIS BY CONNECTIVITY
    378. DIGITAL SIGNAGE COOLERS MARKET ANALYSIS BY REGIONAL
    379. TRANSPARENT DIGITAL SIGNAGE COOLERS MARKET ANALYSIS BY PRODUCT TYPE
    380. REST OF EUROPE TRANSPARENT DIGITAL SIGNAGE COOLERS MARKET ANALYSIS BY CAPACITY
    381. BY END USER
    382. MARKET ANALYSIS BY DISPLAY TYPE
    383. SIGNAGE COOLERS MARKET ANALYSIS BY CONNECTIVITY
    384. TRANSPARENT DIGITAL SIGNAGE COOLERS MARKET ANALYSIS BY REGIONAL
    385. APAC TRANSPARENT DIGITAL SIGNAGE COOLERS MARKET ANALYSIS
    386. TRANSPARENT DIGITAL SIGNAGE COOLERS MARKET ANALYSIS BY PRODUCT TYPE
    387. CHINA TRANSPARENT DIGITAL SIGNAGE COOLERS MARKET ANALYSIS BY CAPACITY
    388. CHINA TRANSPARENT DIGITAL SIGNAGE COOLERS MARKET ANALYSIS BY END USER
    389. CHINA TRANSPARENT DIGITAL SIGNAGE COOLERS MARKET ANALYSIS BY DISPLAY TYPE
    390. TYPE
    391. BY CAPACITY
    392. BY END USER
    393. BY DISPLAY TYPE
    394. ANALYSIS BY CONNECTIVITY
    395. MARKET ANALYSIS BY REGIONAL
    396. MARKET ANALYSIS BY PRODUCT TYPE
    397. COOLERS MARKET ANALYSIS BY CAPACITY
    398. COOLERS MARKET ANALYSIS BY END USER
    399. COOLERS MARKET ANALYSIS BY DISPLAY TYPE
    400. SIGNAGE COOLERS MARKET ANALYSIS BY CONNECTIVITY
    401. DIGITAL SIGNAGE COOLERS MARKET ANALYSIS BY REGIONAL
    402. TRANSPARENT DIGITAL SIGNAGE COOLERS MARKET ANALYSIS BY PRODUCT TYPE
    403. SOUTH KOREA TRANSPARENT DIGITAL SIGNAGE COOLERS MARKET ANALYSIS BY CAPACITY
    404. BY END USER
    405. ANALYSIS BY DISPLAY TYPE
    406. COOLERS MARKET ANALYSIS BY CONNECTIVITY
    407. DIGITAL SIGNAGE COOLERS MARKET ANALYSIS BY REGIONAL
    408. DIGITAL SIGNAGE COOLERS MARKET ANALYSIS BY PRODUCT TYPE
    409. TRANSPARENT DIGITAL SIGNAGE COOLERS MARKET ANALYSIS BY CAPACITY
    410. MALAYSIA TRANSPARENT DIGITAL SIGNAGE COOLERS MARKET ANALYSIS BY END USER
    411. MALAYSIA TRANSPARENT DIGITAL SIGNAGE COOLERS MARKET ANALYSIS BY DISPLAY TYPE
    412. CONNECTIVITY
    413. ANALYSIS BY REGIONAL
    414. MARKET ANALYSIS BY PRODUCT TYPE
    415. COOLERS MARKET ANALYSIS BY CAPACITY
    416. SIGNAGE COOLERS MARKET ANALYSIS BY END USER
    417. DIGITAL SIGNAGE COOLERS MARKET ANALYSIS BY DISPLAY TYPE
    418. TRANSPARENT DIGITAL SIGNAGE COOLERS MARKET ANALYSIS BY CONNECTIVITY
    419. THAILAND TRANSPARENT DIGITAL SIGNAGE COOLERS MARKET ANALYSIS BY REGIONAL
    420. TYPE
    421. BY CAPACITY
    422. ANALYSIS BY END USER
    423. MARKET ANALYSIS BY DISPLAY TYPE
    424. COOLERS MARKET ANALYSIS BY CONNECTIVITY
    425. DIGITAL SIGNAGE COOLERS MARKET ANALYSIS BY REGIONAL
    426. TRANSPARENT DIGITAL SIGNAGE COOLERS MARKET ANALYSIS BY PRODUCT TYPE
    427. REST OF APAC TRANSPARENT DIGITAL SIGNAGE COOLERS MARKET ANALYSIS BY CAPACITY
    428. BY END USER
    429. ANALYSIS BY DISPLAY TYPE
    430. COOLERS MARKET ANALYSIS BY CONNECTIVITY
    431. DIGITAL SIGNAGE COOLERS MARKET ANALYSIS BY REGIONAL
    432. TRANSPARENT DIGITAL SIGNAGE COOLERS MARKET ANALYSIS
    433. DIGITAL SIGNAGE COOLERS MARKET ANALYSIS BY PRODUCT TYPE
    434. TRANSPARENT DIGITAL SIGNAGE COOLERS MARKET ANALYSIS BY CAPACITY
    435. BRAZIL TRANSPARENT DIGITAL SIGNAGE COOLERS MARKET ANALYSIS BY END USER
    436. BRAZIL TRANSPARENT DIGITAL SIGNAGE COOLERS MARKET ANALYSIS BY DISPLAY TYPE
    437. CONNECTIVITY
    438. ANALYSIS BY REGIONAL
    439. MARKET ANALYSIS BY PRODUCT TYPE
    440. COOLERS MARKET ANALYSIS BY CAPACITY
    441. SIGNAGE COOLERS MARKET ANALYSIS BY END USER
    442. DIGITAL SIGNAGE COOLERS MARKET ANALYSIS BY DISPLAY TYPE
    443. TRANSPARENT DIGITAL SIGNAGE COOLERS MARKET ANALYSIS BY CONNECTIVITY
    444. MEXICO TRANSPARENT DIGITAL SIGNAGE COOLERS MARKET ANALYSIS BY REGIONAL
    445. TYPE
    446. BY CAPACITY
    447. ANALYSIS BY END USER
    448. MARKET ANALYSIS BY DISPLAY TYPE
    449. SIGNAGE COOLERS MARKET ANALYSIS BY CONNECTIVITY
    450. DIGITAL SIGNAGE COOLERS MARKET ANALYSIS BY REGIONAL
    451. AMERICA TRANSPARENT DIGITAL SIGNAGE COOLERS MARKET ANALYSIS BY PRODUCT TYPE
    452. BY CAPACITY
    453. COOLERS MARKET ANALYSIS BY END USER
    454. DIGITAL SIGNAGE COOLERS MARKET ANALYSIS BY DISPLAY TYPE
    455. SOUTH AMERICA TRANSPARENT DIGITAL SIGNAGE COOLERS MARKET ANALYSIS BY CONNECTIVITY
    456. ANALYSIS BY REGIONAL
    457. ANALYSIS
    458. ANALYSIS BY PRODUCT TYPE
    459. COOLERS MARKET ANALYSIS BY CAPACITY
    460. DIGITAL SIGNAGE COOLERS MARKET ANALYSIS BY END USER
    461. TRANSPARENT DIGITAL SIGNAGE COOLERS MARKET ANALYSIS BY DISPLAY TYPE
    462. GCC COUNTRIES TRANSPARENT DIGITAL SIGNAGE COOLERS MARKET ANALYSIS BY CONNECTIVITY
    463. BY REGIONAL
    464. ANALYSIS BY PRODUCT TYPE
    465. COOLERS MARKET ANALYSIS BY CAPACITY
    466. SIGNAGE COOLERS MARKET ANALYSIS BY END USER
    467. DIGITAL SIGNAGE COOLERS MARKET ANALYSIS BY DISPLAY TYPE
    468. AFRICA TRANSPARENT DIGITAL SIGNAGE COOLERS MARKET ANALYSIS BY CONNECTIVITY
    469. SOUTH AFRICA TRANSPARENT DIGITAL SIGNAGE COOLERS MARKET ANALYSIS BY REGIONAL
    470. BY PRODUCT TYPE
    471. MARKET ANALYSIS BY CAPACITY
    472. COOLERS MARKET ANALYSIS BY END USER
    473. SIGNAGE COOLERS MARKET ANALYSIS BY DISPLAY TYPE
    474. DIGITAL SIGNAGE COOLERS MARKET ANALYSIS BY CONNECTIVITY
    475. MEA TRANSPARENT DIGITAL SIGNAGE COOLERS MARKET ANALYSIS BY REGIONAL
    476. KEY BUYING CRITERIA OF TRANSPARENT DIGITAL SIGNAGE COOLERS MARKET
    477. RESEARCH PROCESS OF MRFR
    478. SIGNAGE COOLERS MARKET
    479. SIGNAGE COOLERS MARKET
    480. DIGITAL SIGNAGE COOLERS MARKET
    481. DIGITAL SIGNAGE COOLERS MARKET
    482. MARKET, BY PRODUCT TYPE, 2024 (% SHARE)
    483. COOLERS MARKET, BY PRODUCT TYPE, 2019 TO 2032 (USD Billions)
    484. DIGITAL SIGNAGE COOLERS MARKET, BY CAPACITY, 2024 (% SHARE)
    485. DIGITAL SIGNAGE COOLERS MARKET, BY CAPACITY, 2019 TO 2032 (USD Billions)
    486. TRANSPARENT DIGITAL SIGNAGE COOLERS MARKET, BY END USER, 2024 (% SHARE)
    487. (USD Billions)
    488. DISPLAY TYPE, 2024 (% SHARE)
    489. MARKET, BY DISPLAY TYPE, 2019 TO 2032 (USD Billions)
    490. DIGITAL SIGNAGE COOLERS MARKET, BY CONNECTIVITY, 2024 (% SHARE)
    491. TRANSPARENT DIGITAL SIGNAGE COOLERS MARKET, BY CONNECTIVITY, 2019 TO 2032 (USD Billions)
    492. (% SHARE)
    493. TO 2032 (USD Billions)

    Transparent Digital Signage Coolers Market Segmentation


    • Transparent Digital Signage Coolers Market By Product Type (USD Billion, 2019-2032)

      • Inline Transparent Coolers
      • Island Transparent Coolers
      • Back Bar Transparent Coolers

    • Transparent Digital Signage Coolers Market By Capacity (USD Billion, 2019-2032)

      • Below 100 Liters
      • 100-300 Liters
      • 300-500 Liters
      • 500 Liters and Above

    • Transparent Digital Signage Coolers Market By End User (USD Billion, 2019-2032)

      • Food Retail
      • Beverage Retail
      • Grocery Stores
      • Convenience Stores
      • Pharmacies

    • Transparent Digital Signage Coolers Market By Display Type (USD Billion, 2019-2032)

      • LCD Display
      • LED Display
      • OLED Display

    • Transparent Digital Signage Coolers Market By Connectivity (USD Billion, 2019-2032)

      • Wi-Fi Connectivity
      • Bluetooth Connectivity
      • NFC Connectivity

    • Transparent Digital Signage Coolers Market By Regional (USD Billion, 2019-2032)

      • North America
      • Europe
      • South America
      • Asia Pacific
      • Middle East and Africa

    Transparent Digital Signage Coolers Market Regional Outlook (USD Billion, 2019-2032)


    • North America Outlook (USD Billion, 2019-2032)

      • North America Transparent Digital Signage Coolers Market by Product Type

        • Inline Transparent Coolers
        • Island Transparent Coolers
        • Back Bar Transparent Coolers
      • North America Transparent Digital Signage Coolers Market by Capacity Type

        • Below 100 Liters
        • 100-300 Liters
        • 300-500 Liters
        • 500 Liters and Above
      • North America Transparent Digital Signage Coolers Market by End User Type

        • Food Retail
        • Beverage Retail
        • Grocery Stores
        • Convenience Stores
        • Pharmacies
      • North America Transparent Digital Signage Coolers Market by Display Type

        • LCD Display
        • LED Display
        • OLED Display
      • North America Transparent Digital Signage Coolers Market by Connectivity Type

        • Wi-Fi Connectivity
        • Bluetooth Connectivity
        • NFC Connectivity
      • North America Transparent Digital Signage Coolers Market by Regional Type

        • US
        • Canada
      • US Outlook (USD Billion, 2019-2032)
      • US Transparent Digital Signage Coolers Market by Product Type

        • Inline Transparent Coolers
        • Island Transparent Coolers
        • Back Bar Transparent Coolers
      • US Transparent Digital Signage Coolers Market by Capacity Type

        • Below 100 Liters
        • 100-300 Liters
        • 300-500 Liters
        • 500 Liters and Above
      • US Transparent Digital Signage Coolers Market by End User Type

        • Food Retail
        • Beverage Retail
        • Grocery Stores
        • Convenience Stores
        • Pharmacies
      • US Transparent Digital Signage Coolers Market by Display Type

        • LCD Display
        • LED Display
        • OLED Display
      • US Transparent Digital Signage Coolers Market by Connectivity Type

        • Wi-Fi Connectivity
        • Bluetooth Connectivity
        • NFC Connectivity
      • CANADA Outlook (USD Billion, 2019-2032)
      • CANADA Transparent Digital Signage Coolers Market by Product Type

        • Inline Transparent Coolers
        • Island Transparent Coolers
        • Back Bar Transparent Coolers
      • CANADA Transparent Digital Signage Coolers Market by Capacity Type

        • Below 100 Liters
        • 100-300 Liters
        • 300-500 Liters
        • 500 Liters and Above
      • CANADA Transparent Digital Signage Coolers Market by End User Type

        • Food Retail
        • Beverage Retail
        • Grocery Stores
        • Convenience Stores
        • Pharmacies
      • CANADA Transparent Digital Signage Coolers Market by Display Type

        • LCD Display
        • LED Display
        • OLED Display
      • CANADA Transparent Digital Signage Coolers Market by Connectivity Type

        • Wi-Fi Connectivity
        • Bluetooth Connectivity
        • NFC Connectivity
    • Europe Outlook (USD Billion, 2019-2032)

      • Europe Transparent Digital Signage Coolers Market by Product Type

        • Inline Transparent Coolers
        • Island Transparent Coolers
        • Back Bar Transparent Coolers
      • Europe Transparent Digital Signage Coolers Market by Capacity Type

        • Below 100 Liters
        • 100-300 Liters
        • 300-500 Liters
        • 500 Liters and Above
      • Europe Transparent Digital Signage Coolers Market by End User Type

        • Food Retail
        • Beverage Retail
        • Grocery Stores
        • Convenience Stores
        • Pharmacies
      • Europe Transparent Digital Signage Coolers Market by Display Type

        • LCD Display
        • LED Display
        • OLED Display
      • Europe Transparent Digital Signage Coolers Market by Connectivity Type

        • Wi-Fi Connectivity
        • Bluetooth Connectivity
        • NFC Connectivity
      • Europe Transparent Digital Signage Coolers Market by Regional Type

        • Germany
        • UK
        • France
        • Russia
        • Italy
        • Spain
        • Rest of Europe
      • GERMANY Outlook (USD Billion, 2019-2032)
      • GERMANY Transparent Digital Signage Coolers Market by Product Type

        • Inline Transparent Coolers
        • Island Transparent Coolers
        • Back Bar Transparent Coolers
      • GERMANY Transparent Digital Signage Coolers Market by Capacity Type

        • Below 100 Liters
        • 100-300 Liters
        • 300-500 Liters
        • 500 Liters and Above
      • GERMANY Transparent Digital Signage Coolers Market by End User Type

        • Food Retail
        • Beverage Retail
        • Grocery Stores
        • Convenience Stores
        • Pharmacies
      • GERMANY Transparent Digital Signage Coolers Market by Display Type

        • LCD Display
        • LED Display
        • OLED Display
      • GERMANY Transparent Digital Signage Coolers Market by Connectivity Type

        • Wi-Fi Connectivity
        • Bluetooth Connectivity
        • NFC Connectivity
      • UK Outlook (USD Billion, 2019-2032)
      • UK Transparent Digital Signage Coolers Market by Product Type

        • Inline Transparent Coolers
        • Island Transparent Coolers
        • Back Bar Transparent Coolers
      • UK Transparent Digital Signage Coolers Market by Capacity Type

        • Below 100 Liters
        • 100-300 Liters
        • 300-500 Liters
        • 500 Liters and Above
      • UK Transparent Digital Signage Coolers Market by End User Type

        • Food Retail
        • Beverage Retail
        • Grocery Stores
        • Convenience Stores
        • Pharmacies
      • UK Transparent Digital Signage Coolers Market by Display Type

        • LCD Display
        • LED Display
        • OLED Display
      • UK Transparent Digital Signage Coolers Market by Connectivity Type

        • Wi-Fi Connectivity
        • Bluetooth Connectivity
        • NFC Connectivity
      • FRANCE Outlook (USD Billion, 2019-2032)
      • FRANCE Transparent Digital Signage Coolers Market by Product Type

        • Inline Transparent Coolers
        • Island Transparent Coolers
        • Back Bar Transparent Coolers
      • FRANCE Transparent Digital Signage Coolers Market by Capacity Type

        • Below 100 Liters
        • 100-300 Liters
        • 300-500 Liters
        • 500 Liters and Above
      • FRANCE Transparent Digital Signage Coolers Market by End User Type

        • Food Retail
        • Beverage Retail
        • Grocery Stores
        • Convenience Stores
        • Pharmacies
      • FRANCE Transparent Digital Signage Coolers Market by Display Type

        • LCD Display
        • LED Display
        • OLED Display
      • FRANCE Transparent Digital Signage Coolers Market by Connectivity Type

        • Wi-Fi Connectivity
        • Bluetooth Connectivity
        • NFC Connectivity
      • RUSSIA Outlook (USD Billion, 2019-2032)
      • RUSSIA Transparent Digital Signage Coolers Market by Product Type

        • Inline Transparent Coolers
        • Island Transparent Coolers
        • Back Bar Transparent Coolers
      • RUSSIA Transparent Digital Signage Coolers Market by Capacity Type

        • Below 100 Liters
        • 100-300 Liters
        • 300-500 Liters
        • 500 Liters and Above
      • RUSSIA Transparent Digital Signage Coolers Market by End User Type

        • Food Retail
        • Beverage Retail
        • Grocery Stores
        • Convenience Stores
        • Pharmacies
      • RUSSIA Transparent Digital Signage Coolers Market by Display Type

        • LCD Display
        • LED Display
        • OLED Display
      • RUSSIA Transparent Digital Signage Coolers Market by Connectivity Type

        • Wi-Fi Connectivity
        • Bluetooth Connectivity
        • NFC Connectivity
      • ITALY Outlook (USD Billion, 2019-2032)
      • ITALY Transparent Digital Signage Coolers Market by Product Type

        • Inline Transparent Coolers
        • Island Transparent Coolers
        • Back Bar Transparent Coolers
      • ITALY Transparent Digital Signage Coolers Market by Capacity Type

        • Below 100 Liters
        • 100-300 Liters
        • 300-500 Liters
        • 500 Liters and Above
      • ITALY Transparent Digital Signage Coolers Market by End User Type

        • Food Retail
        • Beverage Retail
        • Grocery Stores
        • Convenience Stores
        • Pharmacies
      • ITALY Transparent Digital Signage Coolers Market by Display Type

        • LCD Display
        • LED Display
        • OLED Display
      • ITALY Transparent Digital Signage Coolers Market by Connectivity Type

        • Wi-Fi Connectivity
        • Bluetooth Connectivity
        • NFC Connectivity
      • SPAIN Outlook (USD Billion, 2019-2032)
      • SPAIN Transparent Digital Signage Coolers Market by Product Type

        • Inline Transparent Coolers
        • Island Transparent Coolers
        • Back Bar Transparent Coolers
      • SPAIN Transparent Digital Signage Coolers Market by Capacity Type

        • Below 100 Liters
        • 100-300 Liters
        • 300-500 Liters
        • 500 Liters and Above
      • SPAIN Transparent Digital Signage Coolers Market by End User Type

        • Food Retail
        • Beverage Retail
        • Grocery Stores
        • Convenience Stores
        • Pharmacies
      • SPAIN Transparent Digital Signage Coolers Market by Display Type

        • LCD Display
        • LED Display
        • OLED Display
      • SPAIN Transparent Digital Signage Coolers Market by Connectivity Type

        • Wi-Fi Connectivity
        • Bluetooth Connectivity
        • NFC Connectivity
      • REST OF EUROPE Outlook (USD Billion, 2019-2032)
      • REST OF EUROPE Transparent Digital Signage Coolers Market by Product Type

        • Inline Transparent Coolers
        • Island Transparent Coolers
        • Back Bar Transparent Coolers
      • REST OF EUROPE Transparent Digital Signage Coolers Market by Capacity Type

        • Below 100 Liters
        • 100-300 Liters
        • 300-500 Liters
        • 500 Liters and Above
      • REST OF EUROPE Transparent Digital Signage Coolers Market by End User Type

        • Food Retail
        • Beverage Retail
        • Grocery Stores
        • Convenience Stores
        • Pharmacies
      • REST OF EUROPE Transparent Digital Signage Coolers Market by Display Type

        • LCD Display
        • LED Display
        • OLED Display
      • REST OF EUROPE Transparent Digital Signage Coolers Market by Connectivity Type

        • Wi-Fi Connectivity
        • Bluetooth Connectivity
        • NFC Connectivity
    • APAC Outlook (USD Billion, 2019-2032)

      • APAC Transparent Digital Signage Coolers Market by Product Type

        • Inline Transparent Coolers
        • Island Transparent Coolers
        • Back Bar Transparent Coolers
      • APAC Transparent Digital Signage Coolers Market by Capacity Type

        • Below 100 Liters
        • 100-300 Liters
        • 300-500 Liters
        • 500 Liters and Above
      • APAC Transparent Digital Signage Coolers Market by End User Type

        • Food Retail
        • Beverage Retail
        • Grocery Stores
        • Convenience Stores
        • Pharmacies
      • APAC Transparent Digital Signage Coolers Market by Display Type

        • LCD Display
        • LED Display
        • OLED Display
      • APAC Transparent Digital Signage Coolers Market by Connectivity Type

        • Wi-Fi Connectivity
        • Bluetooth Connectivity
        • NFC Connectivity
      • APAC Transparent Digital Signage Coolers Market by Regional Type

        • China
        • India
        • Japan
        • South Korea
        • Malaysia
        • Thailand
        • Indonesia
        • Rest of APAC
      • CHINA Outlook (USD Billion, 2019-2032)
      • CHINA Transparent Digital Signage Coolers Market by Product Type

        • Inline Transparent Coolers
        • Island Transparent Coolers
        • Back Bar Transparent Coolers
      • CHINA Transparent Digital Signage Coolers Market by Capacity Type

        • Below 100 Liters
        • 100-300 Liters
        • 300-500 Liters
        • 500 Liters and Above
      • CHINA Transparent Digital Signage Coolers Market by End User Type

        • Food Retail
        • Beverage Retail
        • Grocery Stores
        • Convenience Stores
        • Pharmacies
      • CHINA Transparent Digital Signage Coolers Market by Display Type

        • LCD Display
        • LED Display
        • OLED Display
      • CHINA Transparent Digital Signage Coolers Market by Connectivity Type

        • Wi-Fi Connectivity
        • Bluetooth Connectivity
        • NFC Connectivity
      • INDIA Outlook (USD Billion, 2019-2032)
      • INDIA Transparent Digital Signage Coolers Market by Product Type

        • Inline Transparent Coolers
        • Island Transparent Coolers
        • Back Bar Transparent Coolers
      • INDIA Transparent Digital Signage Coolers Market by Capacity Type

        • Below 100 Liters
        • 100-300 Liters
        • 300-500 Liters
        • 500 Liters and Above
      • INDIA Transparent Digital Signage Coolers Market by End User Type

        • Food Retail
        • Beverage Retail
        • Grocery Stores
        • Convenience Stores
        • Pharmacies
      • INDIA Transparent Digital Signage Coolers Market by Display Type

        • LCD Display
        • LED Display
        • OLED Display
      • INDIA Transparent Digital Signage Coolers Market by Connectivity Type

        • Wi-Fi Connectivity
        • Bluetooth Connectivity
        • NFC Connectivity
      • JAPAN Outlook (USD Billion, 2019-2032)
      • JAPAN Transparent Digital Signage Coolers Market by Product Type

        • Inline Transparent Coolers
        • Island Transparent Coolers
        • Back Bar Transparent Coolers
      • JAPAN Transparent Digital Signage Coolers Market by Capacity Type

        • Below 100 Liters
        • 100-300 Liters
        • 300-500 Liters
        • 500 Liters and Above
      • JAPAN Transparent Digital Signage Coolers Market by End User Type

        • Food Retail
        • Beverage Retail
        • Grocery Stores
        • Convenience Stores
        • Pharmacies
      • JAPAN Transparent Digital Signage Coolers Market by Display Type

        • LCD Display
        • LED Display
        • OLED Display
      • JAPAN Transparent Digital Signage Coolers Market by Connectivity Type

        • Wi-Fi Connectivity
        • Bluetooth Connectivity
        • NFC Connectivity
      • SOUTH KOREA Outlook (USD Billion, 2019-2032)
      • SOUTH KOREA Transparent Digital Signage Coolers Market by Product Type

        • Inline Transparent Coolers
        • Island Transparent Coolers
        • Back Bar Transparent Coolers
      • SOUTH KOREA Transparent Digital Signage Coolers Market by Capacity Type

        • Below 100 Liters
        • 100-300 Liters
        • 300-500 Liters
        • 500 Liters and Above
      • SOUTH KOREA Transparent Digital Signage Coolers Market by End User Type

        • Food Retail
        • Beverage Retail
        • Grocery Stores
        • Convenience Stores
        • Pharmacies
      • SOUTH KOREA Transparent Digital Signage Coolers Market by Display Type

        • LCD Display
        • LED Display
        • OLED Display
      • SOUTH KOREA Transparent Digital Signage Coolers Market by Connectivity Type

        • Wi-Fi Connectivity
        • Bluetooth Connectivity
        • NFC Connectivity
      • MALAYSIA Outlook (USD Billion, 2019-2032)
      • MALAYSIA Transparent Digital Signage Coolers Market by Product Type

        • Inline Transparent Coolers
        • Island Transparent Coolers
        • Back Bar Transparent Coolers
      • MALAYSIA Transparent Digital Signage Coolers Market by Capacity Type

        • Below 100 Liters
        • 100-300 Liters
        • 300-500 Liters
        • 500 Liters and Above
      • MALAYSIA Transparent Digital Signage Coolers Market by End User Type

        • Food Retail
        • Beverage Retail
        • Grocery Stores
        • Convenience Stores
        • Pharmacies
      • MALAYSIA Transparent Digital Signage Coolers Market by Display Type

        • LCD Display
        • LED Display
        • OLED Display
      • MALAYSIA Transparent Digital Signage Coolers Market by Connectivity Type

        • Wi-Fi Connectivity
        • Bluetooth Connectivity
        • NFC Connectivity
      • THAILAND Outlook (USD Billion, 2019-2032)
      • THAILAND Transparent Digital Signage Coolers Market by Product Type

        • Inline Transparent Coolers
        • Island Transparent Coolers
        • Back Bar Transparent Coolers
      • THAILAND Transparent Digital Signage Coolers Market by Capacity Type

        • Below 100 Liters
        • 100-300 Liters
        • 300-500 Liters
        • 500 Liters and Above
      • THAILAND Transparent Digital Signage Coolers Market by End User Type

        • Food Retail
        • Beverage Retail
        • Grocery Stores
        • Convenience Stores
        • Pharmacies
      • THAILAND Transparent Digital Signage Coolers Market by Display Type

        • LCD Display
        • LED Display
        • OLED Display
      • THAILAND Transparent Digital Signage Coolers Market by Connectivity Type

        • Wi-Fi Connectivity
        • Bluetooth Connectivity
        • NFC Connectivity
      • INDONESIA Outlook (USD Billion, 2019-2032)
      • INDONESIA Transparent Digital Signage Coolers Market by Product Type

        • Inline Transparent Coolers
        • Island Transparent Coolers
        • Back Bar Transparent Coolers
      • INDONESIA Transparent Digital Signage Coolers Market by Capacity Type

        • Below 100 Liters
        • 100-300 Liters
        • 300-500 Liters
        • 500 Liters and Above
      • INDONESIA Transparent Digital Signage Coolers Market by End User Type

        • Food Retail
        • Beverage Retail
        • Grocery Stores
        • Convenience Stores
        • Pharmacies
      • INDONESIA Transparent Digital Signage Coolers Market by Display Type

        • LCD Display
        • LED Display
        • OLED Display
      • INDONESIA Transparent Digital Signage Coolers Market by Connectivity Type

        • Wi-Fi Connectivity
        • Bluetooth Connectivity
        • NFC Connectivity
      • REST OF APAC Outlook (USD Billion, 2019-2032)
      • REST OF APAC Transparent Digital Signage Coolers Market by Product Type

        • Inline Transparent Coolers
        • Island Transparent Coolers
        • Back Bar Transparent Coolers
      • REST OF APAC Transparent Digital Signage Coolers Market by Capacity Type

        • Below 100 Liters
        • 100-300 Liters
        • 300-500 Liters
        • 500 Liters and Above
      • REST OF APAC Transparent Digital Signage Coolers Market by End User Type

        • Food Retail
        • Beverage Retail
        • Grocery Stores
        • Convenience Stores
        • Pharmacies
      • REST OF APAC Transparent Digital Signage Coolers Market by Display Type

        • LCD Display
        • LED Display
        • OLED Display
      • REST OF APAC Transparent Digital Signage Coolers Market by Connectivity Type

        • Wi-Fi Connectivity
        • Bluetooth Connectivity
        • NFC Connectivity
    • South America Outlook (USD Billion, 2019-2032)

      • South America Transparent Digital Signage Coolers Market by Product Type

        • Inline Transparent Coolers
        • Island Transparent Coolers
        • Back Bar Transparent Coolers
      • South America Transparent Digital Signage Coolers Market by Capacity Type

        • Below 100 Liters
        • 100-300 Liters
        • 300-500 Liters
        • 500 Liters and Above
      • South America Transparent Digital Signage Coolers Market by End User Type

        • Food Retail
        • Beverage Retail
        • Grocery Stores
        • Convenience Stores
        • Pharmacies
      • South America Transparent Digital Signage Coolers Market by Display Type

        • LCD Display
        • LED Display
        • OLED Display
      • South America Transparent Digital Signage Coolers Market by Connectivity Type

        • Wi-Fi Connectivity
        • Bluetooth Connectivity
        • NFC Connectivity
      • South America Transparent Digital Signage Coolers Market by Regional Type

        • Brazil
        • Mexico
        • Argentina
        • Rest of South America
      • BRAZIL Outlook (USD Billion, 2019-2032)
      • BRAZIL Transparent Digital Signage Coolers Market by Product Type

        • Inline Transparent Coolers
        • Island Transparent Coolers
        • Back Bar Transparent Coolers
      • BRAZIL Transparent Digital Signage Coolers Market by Capacity Type

        • Below 100 Liters
        • 100-300 Liters
        • 300-500 Liters
        • 500 Liters and Above
      • BRAZIL Transparent Digital Signage Coolers Market by End User Type

        • Food Retail
        • Beverage Retail
        • Grocery Stores
        • Convenience Stores
        • Pharmacies
      • BRAZIL Transparent Digital Signage Coolers Market by Display Type

        • LCD Display
        • LED Display
        • OLED Display
      • BRAZIL Transparent Digital Signage Coolers Market by Connectivity Type

        • Wi-Fi Connectivity
        • Bluetooth Connectivity
        • NFC Connectivity
      • MEXICO Outlook (USD Billion, 2019-2032)
      • MEXICO Transparent Digital Signage Coolers Market by Product Type

        • Inline Transparent Coolers
        • Island Transparent Coolers
        • Back Bar Transparent Coolers
      • MEXICO Transparent Digital Signage Coolers Market by Capacity Type

        • Below 100 Liters
        • 100-300 Liters
        • 300-500 Liters
        • 500 Liters and Above
      • MEXICO Transparent Digital Signage Coolers Market by End User Type

        • Food Retail
        • Beverage Retail
        • Grocery Stores
        • Convenience Stores
        • Pharmacies
      • MEXICO Transparent Digital Signage Coolers Market by Display Type

        • LCD Display
        • LED Display
        • OLED Display
      • MEXICO Transparent Digital Signage Coolers Market by Connectivity Type

        • Wi-Fi Connectivity
        • Bluetooth Connectivity
        • NFC Connectivity
      • ARGENTINA Outlook (USD Billion, 2019-2032)
      • ARGENTINA Transparent Digital Signage Coolers Market by Product Type

        • Inline Transparent Coolers
        • Island Transparent Coolers
        • Back Bar Transparent Coolers
      • ARGENTINA Transparent Digital Signage Coolers Market by Capacity Type

        • Below 100 Liters
        • 100-300 Liters
        • 300-500 Liters
        • 500 Liters and Above
      • ARGENTINA Transparent Digital Signage Coolers Market by End User Type

        • Food Retail
        • Beverage Retail
        • Grocery Stores
        • Convenience Stores
        • Pharmacies
      • ARGENTINA Transparent Digital Signage Coolers Market by Display Type

        • LCD Display
        • LED Display
        • OLED Display
      • ARGENTINA Transparent Digital Signage Coolers Market by Connectivity Type

        • Wi-Fi Connectivity
        • Bluetooth Connectivity
        • NFC Connectivity
      • REST OF SOUTH AMERICA Outlook (USD Billion, 2019-2032)
      • REST OF SOUTH AMERICA Transparent Digital Signage Coolers Market by Product Type

        • Inline Transparent Coolers
        • Island Transparent Coolers
        • Back Bar Transparent Coolers
      • REST OF SOUTH AMERICA Transparent Digital Signage Coolers Market by Capacity Type

        • Below 100 Liters
        • 100-300 Liters
        • 300-500 Liters
        • 500 Liters and Above
      • REST OF SOUTH AMERICA Transparent Digital Signage Coolers Market by End User Type

        • Food Retail
        • Beverage Retail
        • Grocery Stores
        • Convenience Stores
        • Pharmacies
      • REST OF SOUTH AMERICA Transparent Digital Signage Coolers Market by Display Type

        • LCD Display
        • LED Display
        • OLED Display
      • REST OF SOUTH AMERICA Transparent Digital Signage Coolers Market by Connectivity Type

        • Wi-Fi Connectivity
        • Bluetooth Connectivity
        • NFC Connectivity
    • MEA Outlook (USD Billion, 2019-2032)

      • MEA Transparent Digital Signage Coolers Market by Product Type

        • Inline Transparent Coolers
        • Island Transparent Coolers
        • Back Bar Transparent Coolers
      • MEA Transparent Digital Signage Coolers Market by Capacity Type

        • Below 100 Liters
        • 100-300 Liters
        • 300-500 Liters
        • 500 Liters and Above
      • MEA Transparent Digital Signage Coolers Market by End User Type

        • Food Retail
        • Beverage Retail
        • Grocery Stores
        • Convenience Stores
        • Pharmacies
      • MEA Transparent Digital Signage Coolers Market by Display Type

        • LCD Display
        • LED Display
        • OLED Display
      • MEA Transparent Digital Signage Coolers Market by Connectivity Type

        • Wi-Fi Connectivity
        • Bluetooth Connectivity
        • NFC Connectivity
      • MEA Transparent Digital Signage Coolers Market by Regional Type

        • GCC Countries
        • South Africa
        • Rest of MEA
      • GCC COUNTRIES Outlook (USD Billion, 2019-2032)
      • GCC COUNTRIES Transparent Digital Signage Coolers Market by Product Type

        • Inline Transparent Coolers
        • Island Transparent Coolers
        • Back Bar Transparent Coolers
      • GCC COUNTRIES Transparent Digital Signage Coolers Market by Capacity Type

        • Below 100 Liters
        • 100-300 Liters
        • 300-500 Liters
        • 500 Liters and Above
      • GCC COUNTRIES Transparent Digital Signage Coolers Market by End User Type

        • Food Retail
        • Beverage Retail
        • Grocery Stores
        • Convenience Stores
        • Pharmacies
      • GCC COUNTRIES Transparent Digital Signage Coolers Market by Display Type

        • LCD Display
        • LED Display
        • OLED Display
      • GCC COUNTRIES Transparent Digital Signage Coolers Market by Connectivity Type

        • Wi-Fi Connectivity
        • Bluetooth Connectivity
        • NFC Connectivity
      • SOUTH AFRICA Outlook (USD Billion, 2019-2032)
      • SOUTH AFRICA Transparent Digital Signage Coolers Market by Product Type

        • Inline Transparent Coolers
        • Island Transparent Coolers
        • Back Bar Transparent Coolers
      • SOUTH AFRICA Transparent Digital Signage Coolers Market by Capacity Type

        • Below 100 Liters
        • 100-300 Liters
        • 300-500 Liters
        • 500 Liters and Above
      • SOUTH AFRICA Transparent Digital Signage Coolers Market by End User Type

        • Food Retail
        • Beverage Retail
        • Grocery Stores
        • Convenience Stores
        • Pharmacies
      • SOUTH AFRICA Transparent Digital Signage Coolers Market by Display Type

        • LCD Display
        • LED Display
        • OLED Display
      • SOUTH AFRICA Transparent Digital Signage Coolers Market by Connectivity Type

        • Wi-Fi Connectivity
        • Bluetooth Connectivity
        • NFC Connectivity
      • REST OF MEA Outlook (USD Billion, 2019-2032)
      • REST OF MEA Transparent Digital Signage Coolers Market by Product Type

        • Inline Transparent Coolers
        • Island Transparent Coolers
        • Back Bar Transparent Coolers
      • REST OF MEA Transparent Digital Signage Coolers Market by Capacity Type

        • Below 100 Liters
        • 100-300 Liters
        • 300-500 Liters
        • 500 Liters and Above
      • REST OF MEA Transparent Digital Signage Coolers Market by End User Type

        • Food Retail
        • Beverage Retail
        • Grocery Stores
        • Convenience Stores
        • Pharmacies
      • REST OF MEA Transparent Digital Signage Coolers Market by Display Type

        • LCD Display
        • LED Display
        • OLED Display
      • REST OF MEA Transparent Digital Signage Coolers Market by Connectivity Type

        • Wi-Fi Connectivity
        • Bluetooth Connectivity
        • NFC Connectivity
    Report Infographic
    Free Sample Request

    Kindly complete the form below to receive a free sample of this Report

    Customer Strories

    “I am very pleased with how market segments have been defined in a relevant way for my purposes (such as "Portable Freezers & refrigerators" and "last-mile"). In general the report is well structured. Thanks very much for your efforts.”

    Victoria Milne Founder
    Case Study

    Chemicals and Materials