• Cat-intel
  • MedIntelliX
  • Resources
  • About Us
  • Request Free Sample ×

    Kindly complete the form below to receive a free sample of this Report

    Leading companies partner with us for data-driven Insights

    clients tt-cursor

    Track Trace Solution Market

    ID: MRFR/ICT/8040-HCR
    100 Pages
    Aarti Dhapte
    September 2025

    Track and Trace Solution Market Research Report By Technology (Radio Frequency Identification (RFID), Barcode, Global Positioning System (GPS), Cellular Communication, Sensors), By Application (Supply Chain Management, Pharmaceuticals, Food and Beverage, Anti-Counterfeiting, Healthcare), By Industry (Automotive, Electronics, Pharmaceuticals, Food and Beverage, Retail, Logistics), By Deployment (On-Premise, Cloud-Based), By Component (Hardware, Software, Services) and By Regional (North America, Europe, South America, Asia Pacific, Middle Eas...

    Share:
    Download PDF ×

    We do not share your information with anyone. However, we may send you emails based on your report interest from time to time. You may contact us at any time to opt-out.

    Track and Trace Solution Market Research Report — Global Forecast till 2034 Infographic
    Purchase Options
    $ 4,950.0
    $ 5,950.0
    $ 7,250.0
    Table of Contents

    Track Trace Solution Market Summary

    The Global Track and Trace Solution Market is projected to grow from 3733.5 USD Billion in 2024 to 16588.9 USD Billion by 2035, indicating robust expansion.

    Key Market Trends & Highlights

    Track and Trace Solution Key Trends and Highlights

    • The market is expected to witness a compound annual growth rate (CAGR) of 14.52% from 2025 to 2035.
    • By 2035, the market valuation is anticipated to reach 16588.9 USD Billion, reflecting significant growth potential.
    • In 2024, the market is valued at 3733.5 USD Billion, highlighting its current scale and importance.
    • Growing adoption of advanced tracking technologies due to increasing regulatory requirements is a major market driver.

    Market Size & Forecast

    2024 Market Size 3733.5 (USD Billion)
    2035 Market Size 16588.9 (USD Billion)
    CAGR (2025-2035) 14.52%

    Major Players

    SAP, Sealogic, Zetes, Zebra Technologies, Datalogic, Locus Robotics, Honeywell, Alien Technologies, Trimble, Oracle

    Track Trace Solution Market Trends

    Key market drivers for track and trace solutions include rising concerns over product counterfeiting, increasing adoption of serialization and aggregation regulations, and growing demand for supply chain transparency. Manufacturers and consumers alike are seeking solutions to ensure product authenticity and protect against counterfeits.

    Opportunities to be explored include the integration of advanced technologies such as blockchain, IoT, and AI to enhance traceability and data security. The expansion of track and trace solutions into new industries, such as pharmaceuticals and food and beverage, presents opportunities for market growth.

    Recent trends in the track and trace solution market include the adoption of cloud-based platforms for improved data accessibility and scalability. The use of mobile devices and handheld scanners is also increasing, enabling real-time tracking and data capture. The market is witnessing a shift towards end-to-end solutions that offer comprehensive traceability from raw materials to end consumers, meeting the evolving needs of businesses and regulatory bodies.

             Figure 1 : Track and Trace Solution Market size 2025-2034

    Source: Primary Research, Secondary Research, Market Research Future Database and Analyst Review

    The increasing demand for transparency and accountability in supply chains is driving the adoption of advanced track and trace solutions across various industries.

    U.S. Department of Commerce

    Track Trace Solution Market Drivers

    Growing E-commerce Sector

    The rapid expansion of the e-commerce sector is significantly influencing the Global Track and Trace Solution Market Industry. As online shopping continues to gain traction, the need for efficient logistics and supply chain management becomes paramount. Track and trace solutions play a crucial role in ensuring timely deliveries and enhancing customer satisfaction by providing real-time tracking information. This trend is particularly evident in the logistics and transportation sectors, where companies are investing in advanced tracking technologies to streamline operations. The growth of e-commerce is expected to drive the market to new heights, with projections suggesting a market value of 16588.9 USD Billion by 2035.

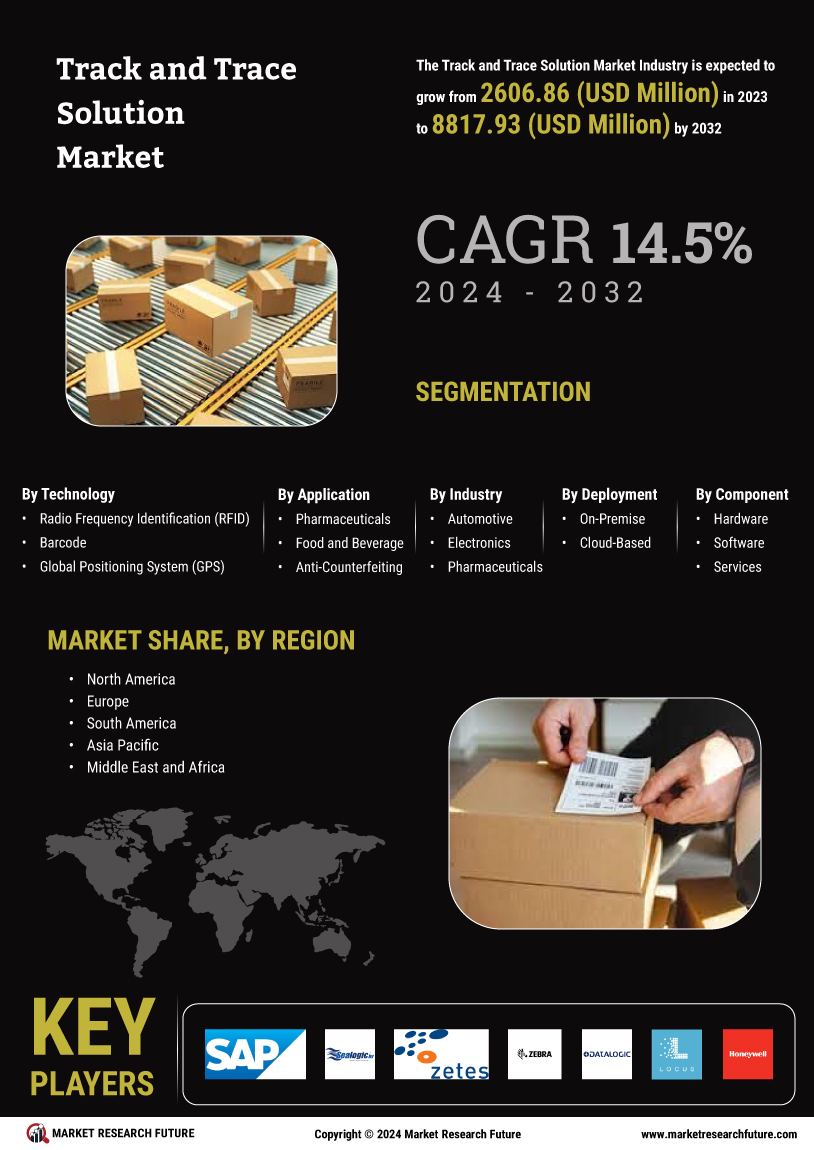
    Market Growth Projections

    The Global Track and Trace Solution Market Industry is poised for remarkable growth, with projections indicating a market value of 3733.5 USD Billion in 2024 and an anticipated rise to 16588.9 USD Billion by 2035. This growth trajectory suggests a robust compound annual growth rate (CAGR) of 14.52% from 2025 to 2035. Such figures underscore the increasing adoption of track and trace solutions across various sectors, driven by regulatory compliance, technological advancements, and consumer demand for transparency. The market's expansion reflects a broader trend towards enhanced supply chain management and product safety, positioning it as a critical area for investment and innovation.

    Increasing Regulatory Compliance

    The Global Track and Trace Solution Market Industry is experiencing growth driven by stringent regulatory requirements across various sectors, particularly in pharmaceuticals and food safety. Governments worldwide are implementing regulations that mandate the tracking of products throughout their supply chains to ensure safety and authenticity. For instance, the Drug Supply Chain Security Act in the United States requires enhanced traceability of prescription drugs. This regulatory landscape compels companies to adopt track and trace solutions, thereby contributing to the market's expansion. As a result, the market is projected to reach 3733.5 USD Billion in 2024, reflecting the urgency for compliance-driven technologies.

    Rising Demand for Supply Chain Transparency

    In the Global Track and Trace Solution Market Industry, the demand for enhanced supply chain transparency is a pivotal driver. Consumers and businesses alike are increasingly concerned about product origins and authenticity, particularly in industries such as food and pharmaceuticals. This trend is prompting organizations to implement track and trace solutions to provide real-time visibility into their supply chains. By leveraging technologies such as blockchain and IoT, companies can ensure product integrity and build consumer trust. As transparency becomes a competitive advantage, the market is expected to grow significantly, with projections indicating a CAGR of 14.52% from 2025 to 2035.

    Consumer Awareness and Demand for Product Safety

    Consumer awareness regarding product safety and authenticity is a significant driver in the Global Track and Trace Solution Market Industry. As consumers become more informed about the risks associated with counterfeit products, there is a growing demand for solutions that ensure product integrity. Industries such as pharmaceuticals and food are particularly affected, as counterfeit goods can pose serious health risks. Companies are responding by implementing track and trace solutions that provide transparency and assurance to consumers. This heightened awareness is likely to propel market growth, as businesses seek to align with consumer expectations and regulatory standards.

    Technological Advancements in Tracking Solutions

    Technological innovations are reshaping the Global Track and Trace Solution Market Industry, as advancements in RFID, barcoding, and IoT are enhancing tracking capabilities. These technologies enable real-time data collection and analysis, allowing businesses to monitor products throughout their lifecycle. For example, RFID tags can provide precise location data, improving inventory management and reducing losses. As companies increasingly adopt these advanced tracking solutions, the market is poised for substantial growth. The integration of artificial intelligence and machine learning further augments these solutions, enabling predictive analytics and improved decision-making processes, which are critical for maintaining competitive advantage.

    Market Segment Insights

    Track and Trace Solution Market Technology Insights

    Technologies A market that is segmented as deeply as the Track and Trace Solution Market is certain to have several segments, with each either growing in a rapid fashion or being consolidated. One of the undisputed leaders that yielded over 40% of the market revenue in 2023 was RFID technology. One of the reasons for the given technology’s prevalence is the possession of capabilities that allow users to manage assets and facilitate their tracking through real-time visibility. RFID technology has become increasingly popular in multiple sectors of the modern economy, such as manufacturing, retail, and healthcare.

    The second technology that has rapidly expanded in the Track and Trace Solution Market and is expected to continue its expansion is Barcode. The reasons behind its rapid growth are both simplicity and affordability. Due to the given fact, in the near future, Barcode will compete with RFID to become the leading technology in the market. The third technology that is gaining speed in this field is GPS.

    The expansion of this technology is based on the value that it provides to the sectors that require the use of costly and important movable assets that can be tracked only with precise GPS technology. The given technology belongs to the broad category of the so-called “soft-OT technologies.” In the modern world, areas such as transportation and logistics require real-time visibility for their products and assets; GPS-based solutions will thrive in conditions of such demand. The fourth noteworthy technology is Cellular Communication. The technology expanded into the track trace solutions industry due to the wide coverage of cellular networks.

    In addition, the newly developed types of technology allow for real-time asset and product tracking, even if the data is collected in remote areas. Technology, in turn, is rapidly developing and expanding its reach towards sectors such as agriculture and construction. The final technology that will be considered in this essay is the use of sensors, whose participation in the selected market instead of the industries it provides other technologies and aggregates, technologies, and during the development of which, other technologies are employed.

    These sensors provide additional data that can be processed, which is why they can be categorized as soft-OT. They are especially valuable for industries that must take additional tests of their products to ensure their quality. Such fields would include pharmaceuticals, food and beverages, and many more. Key drivers There are several conditions in today’s world that pave the path for the rapid expansion and development of tracking trace solutions. One of the notable drivers is the increased level of urgency in which companies need to start improving their performance.

    The expansion of online business led to the development of infrastructures and platforms that now, as the competence grows, require improvements that will translate into better Six Sigma performance.

             Figure 2 : Track and Trace Solution Market By Condition, 2023 & 2032

    Track Trace Solution Market Technology Insights

    Source: Primary Research, Secondary Research, Market Research Future Database and Analyst Review

    Track and Trace Solution Market Application Insights

    The application segment of the Track and Trace Solution Market is diverse, with each sector presenting unique growth opportunities. Supply Chain Management is projected to account for a significant share of the market in 2023, with a projected revenue of USD 6.19 Billion. This growth is driven by the increasing need for transparency and efficiency in supply chains, particularly in industries such as manufacturing and retail. The Pharmaceutical sector is another key application, with a projected market value of USD 4.23 billion in 2023.

    Stringent regulations and the need to combat counterfeiting are major factors contributing to the adoption of track-and-trace solutions in this industry. The Food and Beverage sector is also witnessing significant growth, with a projected market value of USD 2.91 Billion in 2023. Concerns over food safety and the need to ensure product authenticity are driving the demand for track-and-trace solutions in this sector. Anti-Counterfeiting is another important application, with a projected market value of USD 2.45 Billion in 2023.

    The growing incidence of counterfeiting across various industries is fueling the demand for solutions that can help identify and prevent the distribution of counterfeit products. The Healthcare sector is also expected to contribute significantly to the market growth, with a projected market value of USD 2.01 Billion in 2023. The need to improve patient safety, streamline drug distribution, and combat counterfeit drugs is driving the adoption of track and trace solutions in this sector.

    Track and Trace Solution Market Industry Insights

    The Track and Trace Solution Market growth is segmented into various industries, such as automotive, electronics, pharmaceuticals, food and beverage, retail, and logistics. The automotive industry held the largest market share in 2023 due to increasing demand for vehicle tracking and anti-counterfeiting solutions. The electronics industry is expected to witness significant growth in the coming years, driven by the rising adoption of IoT devices and the need for supply chain visibility. The pharmaceutical industry is also expected to grow steadily, fueled by government regulations and the need for drug traceability.

    The food and beverage industry is expected to see moderate growth, driven by the need for food safety and traceability. The retail industry is expected to grow at a steady pace, driven by the increasing adoption of omnichannel retailing and the need for inventory management. The logistics industry is expected to witness significant growth, driven by the increasing demand for supply chain efficiency and visibility.

    Track and Trace Solution Market Deployment Insights

    The Track and Trace Solution Market offers deployment options, including on-premise and cloud-based solutions. In 2023, the on-premise segment held a larger market share, accounting for 55%. This is due to the preference for greater control over data and security, as well as existing infrastructure investments. However, the cloud-based segment is projected to grow at a faster rate, reaching a market share of 45% by 2032. The cloud-based deployment model offers advantages such as scalability, lower upfront costs, and easier maintenance, driving its adoption in the coming years.

    The Track and Trace Solution Market revenue from the on-premise segment is expected to reach $11.23 billion by 2032, while the cloud-based segment is projected to generate $22.92 billion, showcasing the significant growth potential of this segment.

    Track and Trace Solution Market Component Insights

    The Track and Trace Solution Market is segmented into hardware, software, and services. The hardware segment is expected to grow at the highest CAGR during the forecast period. The growth of this segment can be attributed to the increasing demand for track and trace solutions in various industries, such as pharmaceuticals, food and beverage, and retail. The software segment is also expected to grow at a significant CAGR during the forecast period. The growth of this segment can be attributed to the increasing adoption of track-and-trace solutions to improve supply chain visibility and efficiency.

    The services segment is expected to grow at a moderate CAGR during the forecast period. The growth of the market is attributed to the increasing demand for track-and-trace solutions to improve supply chain visibility and efficiency. The market is also expected to benefit from the growing adoption of track-and-trace solutions in various industries, such as pharmaceuticals, food and beverage, and retail.

    Regional Insights

    The Track and Trace Solution Market is segmented into North America, Europe, APAC, South America, and MEA. Among these regions, North America is expected to hold the largest market share in 2023, owing to the presence of a large number of pharmaceutical and biotechnology companies in the region. Europe is expected to be the second-largest market, followed by APAC. The APAC region is expected to witness the fastest growth rate during the forecast period due to the increasing adoption of track-and-trace solutions by governments and pharmaceutical companies in the region.

    South America and MEA are expected to account for a smaller share of the global market. The increasing demand for track and trace solutions from emerging economies in these regions is expected to drive growth in the coming years.

            Figure 3 : Track and Trace Solution Market size By Regional, 2023 & 2032

    Track Trace Solution Market Regional Insights

    Source: Primary Research, Secondary Research, Market Research Future Database and Analyst Review

    Key Companies in the Track Trace Solution Market market include

    Industry Developments

    The Track and Trace Solution Market is projected to reach USD 44.15 billion by 2032, exhibiting a CAGR of 8.95% during the forecast period (2024-2032). The growing demand for supply chain transparency, regulatory compliance, and product authentication is driving market growth. Advancements in technology, such as the adoption of blockchain, IoT, and AI, are enhancing the capabilities of track and trace solutions. The pharmaceutical and healthcare industries are major adopters, leveraging these solutions to ensure product safety and prevent counterfeiting.

    Partnerships and acquisitions among market players are shaping the competitive landscape, leading to the consolidation of the industry. Recent news highlights include the collaboration between SAP and TraceLink to provide end-to-end traceability solutions and the acquisition of TraceLink by Thermo Fisher Scientific, strengthening its position in the track and trace market.

    Future Outlook

    Track Trace Solution Market Future Outlook

    The Global Track and Trace Solution Market is poised for growth at 14.52% CAGR from 2024 to 2035, driven by regulatory compliance, technological advancements, and increasing demand for supply chain transparency.

    New opportunities lie in:

    • Develop AI-driven analytics tools for real-time tracking insights.
    • Expand blockchain integration to enhance data security and traceability.
    • Create customizable solutions for niche industries to capture diverse market segments.

    By 2035, the market is expected to achieve substantial growth, solidifying its role in global supply chain management.

    Market Segmentation

    Track and Trace Solution Market Industry Outlook

    • Automotive
    • Electronics
    • Pharmaceuticals
    • Food and Beverage
    • Retail
    • Logistics

    Track and Trace Solution Market Regional Outlook

    • North America
    • Europe
    • South America
    • Asia Pacific
    • Middle East and Africa

    Track and Trace Solution Market Component Outlook

    • Hardware
    • Software
    • Services

    Track and Trace Solution Market Deployment Outlook

    • On-Premise
    • Cloud-Based

    Track and Trace Solution Market Technology Outlook

    • Radio Frequency Identification (RFID)
    • Barcode
    • Global Positioning System (GPS)
    • Cellular Communication
    • Sensors

    Track and Trace Solution Market Application Outlook

    • Supply Chain Management
    • Pharmaceuticals
    • Food and Beverage
    • Anti-Counterfeiting
    • Healthcare

    Report Scope

    Report Attribute/Metric Details
    Market Size 2024 3733.47 (USD Million)
    Market Size 2025 4275.58  (USD Million)
    Market Size 2034 14485.56 (USD Million)
    Compound Annual Growth Rate (CAGR) 14.52% (2025 - 2034)
    Report Coverage Revenue Forecast, Competitive Landscape, Growth Factors, and Trends
    Base Year 2024
    Market Forecast Period 2025 - 2034
    Historical Data 2019 - 2023
    Market Forecast Units USD Million
    Key Companies Profiled SAP, Sealogic, Zetes, Zebra Technologies, Datalogic, Locus Robotics, Honeywell, Alien Technologies, Trimble, Oracle
    Segments Covered Technology, Application, Industry, Deployment, Component, Regional
    Key Market Opportunities Enhanced supply chain efficiency Improved product safety and quality Increased brand integrity and reputation Fraud and counterfeiting reduction Enhanced customer engagement
    Key Market Dynamics Increased Counterfeiting Activities Growing Demand for Product Authentication Rise of Cloud Computing Stringent Government Regulations Advancements in IoT Technology
    Countries Covered North America, Europe, APAC, South America, MEA

    Market Highlights

    Author
    Aarti Dhapte
    Team Lead - Research

    She holds an experience of about 6+ years in Market Research and Business Consulting, working under the spectrum of Information Communication Technology, Telecommunications and Semiconductor domains. Aarti conceptualizes and implements a scalable business strategy and provides strategic leadership to the clients. Her expertise lies in market estimation, competitive intelligence, pipeline analysis, customer assessment, etc.

    Leave a Comment

    FAQs

    What is the market size of the Track and Trace Solution Market?

    The global market for Track and Trace Solution is expected to be valued at USD 4275.58  billion in 2025 and is projected to reach USD 14485.56 billion by 2034, exhibiting a CAGR of 14.52% during the forecast period.

    Which region is expected to hold the largest market share in the Track and Trace Solution Market?

    North America is expected to hold the largest market share in the Track and Trace Solution Market, owing to the presence of a large number of pharmaceutical and healthcare companies in the region, as well as stringent government regulations regarding the safety and security of pharmaceutical products.

    Which application segment is expected to hold the largest market share in the Track and Trace Solution Market?

    The pharmaceuticals segment is expected to hold the largest market share in the Track and Trace Solution Market due to the increasing need for tracking and tracing pharmaceutical products to ensure their safety and authenticity.

    Who are the key competitors in the Track and Trace Solution Market?

    Key competitors in the Track and Trace Solution Market include SAP SE, Oracle Corporation, Zebra Technologies Corporation, Honeywell International Inc., and Siemens AG.

    What are the key growth factors driving the Track and Trace Solution Market?

    Key growth factors driving the Track and Trace Solution Market include increasing demand for counterfeit protection, growing need for supply chain visibility, and stringent government regulations.

    What are the challenges faced by the Track and Trace Solution Market?

    Challenges faced by the Track and Trace Solution Market include high implementation and maintenance costs, lack of interoperability between different solutions, and concerns about data security and privacy.

    What are the key trends in the Track and Trace Solution Market?

    Key trends in the Track and Trace Solution Market include the adoption of cloud-based solutions, the use of blockchain technology, and the integration of artificial intelligence (AI) and machine learning (ML).

    What is the expected growth rate of the Track and Trace Solution Market?

    The Track and Trace Solution Market is expected to grow at a CAGR of 14.52% from 2025 to 2034

    What are the key opportunities for growth in the Track and Trace Solution Market?

    Key opportunities for growth in the Track and Trace Solution Market include the increasing demand for track and trace solutions in emerging markets, the growing adoption of serialization and aggregation technologies, and the development of new applications for track and trace solutions.

    What are the key challenges faced by the Track and Trace Solution Market?

    Key challenges faced by the Track and Trace Solution Market include the high cost of implementation, the lack of interoperability between different solutions, and the concerns about data security and privacy.

    1. 'TABLE OF CONTENTS
    2. EXECUTIVE SUMMARY
    3. Market Overview
    4. Key Findings
    5. Market Segmentation
    6. Competitive Landscape
    7. Challenges and Opportunities
      1. Future Outlook
    8. MARKET INTRODUCTION
      1. Definition
      2. Scope of the study
        1. Research Objective
        2. Assumption
        3. Limitations
    9. RESEARCH METHODOLOGY
      1. Overview
      2. Data Mining
      3. Secondary Research
      4. Primary Research
        1. Primary Interviews and Information Gathering
    10. Process
    11. Breakdown of Primary Respondents
      1. Forecasting Model
      2. Market Size Estimation
        1. Bottom-Up Approach
        2. Top-Down Approach
      3. Data Triangulation
      4. Validation
    12. MARKET DYNAMICS
      1. Overview
      2. Drivers
      3. Restraints
      4. Opportunities
    13. MARKET FACTOR ANALYSIS
      1. Value
    14. chain Analysis
    15. Porter''s Five Forces Analysis
      1. Bargaining Power of Suppliers
        1. Bargaining Power of Buyers
        2. Threat of New Entrants
        3. Threat
    16. of Substitutes
    17. Intensity of Rivalry
    18. COVID-19 Impact Analysis
      1. Market Impact Analysis
        1. Regional Impact
        2. Opportunity and Threat Analysis
    19. TRACK TRACE SOLUTION MARKET, BY TECHNOLOGY (USD BILLION)
      1. Radio Frequency Identification (RFID)
      2. Barcode
      3. Global Positioning
    20. System (GPS)
    21. Cellular Communication
      1. Sensors
    22. TRACK TRACE SOLUTION MARKET, BY APPLICATION (USD BILLION)
      1. Supply Chain Management
      2. Pharmaceuticals
      3. Food
    23. and Beverage
    24. Anti-Counterfeiting
    25. Healthcare
    26. TRACK TRACE SOLUTION MARKET, BY INDUSTRY (USD BILLION)
      1. Automotive
      2. Electronics
      3. Pharmaceuticals
      4. Food and Beverage
      5. Retail
      6. Logistics
    27. TRACK TRACE SOLUTION MARKET, BY DEPLOYMENT (USD
    28. BILLION)
    29. On-Premise
    30. Cloud-Based
    31. TRACK TRACE SOLUTION MARKET, BY COMPONENT (USD BILLION)
      1. Hardware
      2. Software
      3. Services
    32. TRACK TRACE SOLUTION MARKET, BY REGIONAL (USD
    33. BILLION)
    34. North America
    35. US
    36. Canada
    37. Europe
    38. Germany
    39. UK
    40. France
    41. Russia
    42. Italy
    43. Spain
    44. Rest of Europe
    45. APAC
    46. China
    47. India
    48. Japan
    49. South Korea
    50. Malaysia
    51. Thailand
    52. Indonesia
    53. Rest of APAC
    54. South America
    55. Brazil
    56. Mexico
    57. Argentina
    58. Rest of South America
    59. MEA
    60. GCC Countries
    61. South Africa
    62. Rest of MEA
    63. COMPETITIVE LANDSCAPE
      1. Overview
      2. Competitive Analysis
      3. Market share Analysis
      4. Major Growth Strategy in the Track Trace Solution
    64. Market
    65. Competitive Benchmarking
      1. Leading Players in Terms of Number of Developments in the Track
    66. Trace Solution Market
    67. Key developments and growth strategies
      1. New Product Launch/Service Deployment
        1. Merger &
    68. Acquisitions
    69. Joint Ventures
    70. Major Players Financial Matrix
      1. Sales and Operating Income
        1. Major Players R&D Expenditure. 2023
    71. COMPANY PROFILES
      1. SAP
        1. Financial
    72. Overview
    73. Products Offered
    74. Key Developments
    75. SWOT Analysis
    76. Key Strategies
    77. Sealogic
    78. Financial Overview
    79. Products Offered
    80. Key Developments
    81. SWOT Analysis
    82. Key Strategies
    83. Zetes
    84. Financial Overview
    85. Products Offered
    86. Key Developments
    87. SWOT Analysis
    88. Key Strategies
    89. Zebra Technologies
    90. Financial Overview
    91. Products Offered
    92. Key Developments
    93. SWOT Analysis
    94. Key Strategies
    95. Datalogic
    96. Financial Overview
    97. Products Offered
    98. Key Developments
    99. SWOT Analysis
    100. Key Strategies
    101. Locus Robotics
    102. Financial Overview
    103. Products Offered
    104. Key Developments
    105. SWOT Analysis
    106. Key Strategies
    107. Honeywell
    108. Financial Overview
    109. Products Offered
    110. Key Developments
    111. SWOT Analysis
    112. Key Strategies
    113. Alien Technologies
    114. Financial Overview
    115. Products Offered
    116. Key Developments
    117. SWOT Analysis
    118. Key Strategies
    119. Trimble
    120. Financial Overview
    121. Products Offered
    122. Key Developments
    123. SWOT Analysis
    124. Key Strategies
    125. Oracle
    126. Financial Overview
    127. Products Offered
    128. Key Developments
    129. SWOT Analysis
    130. Key Strategies
    131. References
    132. Related Reports
    133. LIST
    134. OF TABLES
    135. LIST OF ASSUMPTIONS
    136. FORECAST, BY TECHNOLOGY, 2019-2032 (USD BILLIONS)
    137. SIZE ESTIMATES & FORECAST, BY APPLICATION, 2019-2032 (USD BILLIONS)
    138. TRACK TRACE SOLUTION MARKET SIZE ESTIMATES & FORECAST, BY INDUSTRY, 2019-2032
    139. (USD BILLIONS)
    140. NORTH AMERICA TRACK TRACE SOLUTION MARKET SIZE ESTIMATES & FORECAST, BY DEPLOYMENT,
    141. 2032 (USD BILLIONS)
    142. FORECAST, BY COMPONENT, 2019-2032 (USD BILLIONS)
    143. SIZE ESTIMATES & FORECAST, BY REGIONAL, 2019-2032 (USD BILLIONS)
    144. SOLUTION MARKET SIZE ESTIMATES & FORECAST, BY TECHNOLOGY, 2019-2032 (USD BILLIONS)
    145. TRACK TRACE SOLUTION MARKET SIZE ESTIMATES & FORECAST, BY APPLICATION, 2019-2032
    146. (USD BILLIONS)
    147. US TRACK TRACE SOLUTION MARKET SIZE ESTIMATES & FORECAST, BY INDUSTRY, 2019-2032
    148. (USD BILLIONS)
    149. US TRACK TRACE SOLUTION MARKET SIZE ESTIMATES & FORECAST, BY DEPLOYMENT,
    150. 2032 (USD BILLIONS)
    151. BY COMPONENT, 2019-2032 (USD BILLIONS)
    152. & FORECAST, BY REGIONAL, 2019-2032 (USD BILLIONS)
    153. ESTIMATES & FORECAST, BY TECHNOLOGY, 2019-2032 (USD BILLIONS)
    154. SOLUTION MARKET SIZE ESTIMATES & FORECAST, BY APPLICATION, 2019-2032 (USD BILLIONS)
    155. CANADA TRACK TRACE SOLUTION MARKET SIZE ESTIMATES & FORECAST, BY INDUSTRY, 2019-2032
    156. (USD BILLIONS)
    157. CANADA TRACK TRACE SOLUTION MARKET SIZE ESTIMATES & FORECAST, BY DEPLOYMENT,
    158. 2032 (USD BILLIONS)
    159. BY COMPONENT, 2019-2032 (USD BILLIONS)
    160. & FORECAST, BY REGIONAL, 2019-2032 (USD BILLIONS)
    161. ESTIMATES & FORECAST, BY TECHNOLOGY, 2019-2032 (USD BILLIONS)
    162. SOLUTION MARKET SIZE ESTIMATES & FORECAST, BY APPLICATION, 2019-2032 (USD BILLIONS)
    163. EUROPE TRACK TRACE SOLUTION MARKET SIZE ESTIMATES & FORECAST, BY INDUSTRY, 2019-2032
    164. (USD BILLIONS)
    165. EUROPE TRACK TRACE SOLUTION MARKET SIZE ESTIMATES & FORECAST, BY DEPLOYMENT,
    166. 2032 (USD BILLIONS)
    167. BY COMPONENT, 2019-2032 (USD BILLIONS)
    168. & FORECAST, BY REGIONAL, 2019-2032 (USD BILLIONS)
    169. ESTIMATES & FORECAST, BY TECHNOLOGY, 2019-2032 (USD BILLIONS)
    170. SOLUTION MARKET SIZE ESTIMATES & FORECAST, BY APPLICATION, 2019-2032 (USD BILLIONS)
    171. GERMANY TRACK TRACE SOLUTION MARKET SIZE ESTIMATES & FORECAST, BY INDUSTRY,
    172. 2032 (USD BILLIONS)
    173. FORECAST, BY DEPLOYMENT, 2019-2032 (USD BILLIONS)
    174. ESTIMATES & FORECAST, BY COMPONENT, 2019-2032 (USD BILLIONS)
    175. SOLUTION MARKET SIZE ESTIMATES & FORECAST, BY REGIONAL, 2019-2032 (USD BILLIONS)
    176. UK TRACK TRACE SOLUTION MARKET SIZE ESTIMATES & FORECAST, BY TECHNOLOGY, 2019-2032
    177. (USD BILLIONS)
    178. UK TRACK TRACE SOLUTION MARKET SIZE ESTIMATES & FORECAST, BY APPLICATION,
    179. 2032 (USD BILLIONS)
    180. BY INDUSTRY, 2019-2032 (USD BILLIONS)
    181. & FORECAST, BY DEPLOYMENT, 2019-2032 (USD BILLIONS)
    182. & FORECAST, BY COMPONENT, 2019-2032 (USD BILLIONS)
    183. & FORECAST, BY REGIONAL, 2019-2032 (USD BILLIONS)
    184. ESTIMATES & FORECAST, BY TECHNOLOGY, 2019-2032 (USD BILLIONS)
    185. SOLUTION MARKET SIZE ESTIMATES & FORECAST, BY APPLICATION, 2019-2032 (USD BILLIONS)
    186. FRANCE TRACK TRACE SOLUTION MARKET SIZE ESTIMATES & FORECAST, BY INDUSTRY, 2019-2032
    187. (USD BILLIONS)
    188. FRANCE TRACK TRACE SOLUTION MARKET SIZE ESTIMATES & FORECAST, BY DEPLOYMENT,
    189. 2032 (USD BILLIONS)
    190. BY COMPONENT, 2019-2032 (USD BILLIONS)
    191. & FORECAST, BY REGIONAL, 2019-2032 (USD BILLIONS)
    192. ESTIMATES & FORECAST, BY TECHNOLOGY, 2019-2032 (USD BILLIONS)
    193. SOLUTION MARKET SIZE ESTIMATES & FORECAST, BY APPLICATION, 2019-2032 (USD BILLIONS)
    194. RUSSIA TRACK TRACE SOLUTION MARKET SIZE ESTIMATES & FORECAST, BY INDUSTRY, 2019-2032
    195. (USD BILLIONS)
    196. RUSSIA TRACK TRACE SOLUTION MARKET SIZE ESTIMATES & FORECAST, BY DEPLOYMENT,
    197. 2032 (USD BILLIONS)
    198. BY COMPONENT, 2019-2032 (USD BILLIONS)
    199. & FORECAST, BY REGIONAL, 2019-2032 (USD BILLIONS)
    200. ESTIMATES & FORECAST, BY TECHNOLOGY, 2019-2032 (USD BILLIONS)
    201. MARKET SIZE ESTIMATES & FORECAST, BY APPLICATION, 2019-2032 (USD BILLIONS)
    202. TRACE SOLUTION MARKET SIZE ESTIMATES & FORECAST, BY INDUSTRY, 2019-2032 (USD
    203. BILLIONS)
    204. ITALY TRACK TRACE SOLUTION MARKET SIZE ESTIMATES & FORECAST, BY DEPLOYMENT,
    205. 2032 (USD BILLIONS)
    206. BY COMPONENT, 2019-2032 (USD BILLIONS)
    207. & FORECAST, BY REGIONAL, 2019-2032 (USD BILLIONS)
    208. ESTIMATES & FORECAST, BY TECHNOLOGY, 2019-2032 (USD BILLIONS)
    209. MARKET SIZE ESTIMATES & FORECAST, BY APPLICATION, 2019-2032 (USD BILLIONS)
    210. TRACE SOLUTION MARKET SIZE ESTIMATES & FORECAST, BY INDUSTRY, 2019-2032 (USD
    211. BILLIONS)
    212. SPAIN TRACK TRACE SOLUTION MARKET SIZE ESTIMATES & FORECAST, BY DEPLOYMENT,
    213. 2032 (USD BILLIONS)
    214. BY COMPONENT, 2019-2032 (USD BILLIONS)
    215. & FORECAST, BY REGIONAL, 2019-2032 (USD BILLIONS)
    216. SIZE ESTIMATES & FORECAST, BY TECHNOLOGY, 2019-2032 (USD BILLIONS)
    217. TRACK TRACE SOLUTION MARKET SIZE ESTIMATES & FORECAST, BY APPLICATION, 2019-2032
    218. (USD BILLIONS)
    219. REST OF EUROPE TRACK TRACE SOLUTION MARKET SIZE ESTIMATES & FORECAST, BY
    220. INDUSTRY, 2019-2032 (USD BILLIONS)
    221. ESTIMATES & FORECAST, BY DEPLOYMENT, 2019-2032 (USD BILLIONS)
    222. TRACE SOLUTION MARKET SIZE ESTIMATES & FORECAST, BY COMPONENT, 2019-2032 (USD
    223. BILLIONS)
    224. REST OF EUROPE TRACK TRACE SOLUTION MARKET SIZE ESTIMATES & FORECAST, BY
    225. REGIONAL, 2019-2032 (USD BILLIONS)
    226. & FORECAST, BY TECHNOLOGY, 2019-2032 (USD BILLIONS)
    227. & FORECAST, BY APPLICATION, 2019-2032 (USD BILLIONS)
    228. & FORECAST, BY INDUSTRY, 2019-2032 (USD BILLIONS)
    229. & FORECAST, BY DEPLOYMENT, 2019-2032 (USD BILLIONS)
    230. & FORECAST, BY COMPONENT, 2019-2032 (USD BILLIONS)
    231. & FORECAST, BY REGIONAL, 2019-2032 (USD BILLIONS)
    232. ESTIMATES & FORECAST, BY TECHNOLOGY, 2019-2032 (USD BILLIONS)
    233. MARKET SIZE ESTIMATES & FORECAST, BY APPLICATION, 2019-2032 (USD BILLIONS)
    234. TRACE SOLUTION MARKET SIZE ESTIMATES & FORECAST, BY INDUSTRY, 2019-2032 (USD
    235. BILLIONS)
    236. CHINA TRACK TRACE SOLUTION MARKET SIZE ESTIMATES & FORECAST, BY DEPLOYMENT,
    237. 2032 (USD BILLIONS)
    238. BY COMPONENT, 2019-2032 (USD BILLIONS)
    239. & FORECAST, BY REGIONAL, 2019-2032 (USD BILLIONS)
    240. ESTIMATES & FORECAST, BY TECHNOLOGY, 2019-2032 (USD BILLIONS)
    241. MARKET SIZE ESTIMATES & FORECAST, BY APPLICATION, 2019-2032 (USD BILLIONS)
    242. TRACE SOLUTION MARKET SIZE ESTIMATES & FORECAST, BY INDUSTRY, 2019-2032 (USD
    243. BILLIONS)
    244. INDIA TRACK TRACE SOLUTION MARKET SIZE ESTIMATES & FORECAST, BY DEPLOYMENT,
    245. 2032 (USD BILLIONS)
    246. BY COMPONENT, 2019-2032 (USD BILLIONS)
    247. & FORECAST, BY REGIONAL, 2019-2032 (USD BILLIONS)
    248. ESTIMATES & FORECAST, BY TECHNOLOGY, 2019-2032 (USD BILLIONS)
    249. MARKET SIZE ESTIMATES & FORECAST, BY APPLICATION, 2019-2032 (USD BILLIONS)
    250. TRACE SOLUTION MARKET SIZE ESTIMATES & FORECAST, BY INDUSTRY, 2019-2032 (USD
    251. BILLIONS)
    252. JAPAN TRACK TRACE SOLUTION MARKET SIZE ESTIMATES & FORECAST, BY DEPLOYMENT,
    253. 2032 (USD BILLIONS)
    254. BY COMPONENT, 2019-2032 (USD BILLIONS)
    255. & FORECAST, BY REGIONAL, 2019-2032 (USD BILLIONS)
    256. SIZE ESTIMATES & FORECAST, BY TECHNOLOGY, 2019-2032 (USD BILLIONS)
    257. TRACK TRACE SOLUTION MARKET SIZE ESTIMATES & FORECAST, BY APPLICATION, 2019-2032
    258. (USD BILLIONS)
    259. SOUTH KOREA TRACK TRACE SOLUTION MARKET SIZE ESTIMATES & FORECAST, BY INDUSTRY,
    260. 2032 (USD BILLIONS)
    261. FORECAST, BY DEPLOYMENT, 2019-2032 (USD BILLIONS)
    262. SIZE ESTIMATES & FORECAST, BY COMPONENT, 2019-2032 (USD BILLIONS)
    263. TRACK TRACE SOLUTION MARKET SIZE ESTIMATES & FORECAST, BY REGIONAL, 2019-2032
    264. (USD BILLIONS)
    265. MALAYSIA TRACK TRACE SOLUTION MARKET SIZE ESTIMATES & FORECAST, BY TECHNOLOGY,
    266. 2032 (USD BILLIONS)
    267. FORECAST, BY APPLICATION, 2019-2032 (USD BILLIONS)
    268. ESTIMATES & FORECAST, BY INDUSTRY, 2019-2032 (USD BILLIONS)
    269. SOLUTION MARKET SIZE ESTIMATES & FORECAST, BY DEPLOYMENT, 2019-2032 (USD BILLIONS)
    270. MALAYSIA TRACK TRACE SOLUTION MARKET SIZE ESTIMATES & FORECAST, BY COMPONENT,
    271. 2032 (USD BILLIONS)
    272. FORECAST, BY REGIONAL, 2019-2032 (USD BILLIONS)
    273. ESTIMATES & FORECAST, BY TECHNOLOGY, 2019-2032 (USD BILLIONS)
    274. SOLUTION MARKET SIZE ESTIMATES & FORECAST, BY APPLICATION, 2019-2032 (USD BILLIONS)
    275. THAILAND TRACK TRACE SOLUTION MARKET SIZE ESTIMATES & FORECAST, BY INDUSTRY,
    276. 2032 (USD BILLIONS)
    277. FORECAST, BY DEPLOYMENT, 2019-2032 (USD BILLIONS)
    278. ESTIMATES & FORECAST, BY COMPONENT, 2019-2032 (USD BILLIONS)
    279. SOLUTION MARKET SIZE ESTIMATES & FORECAST, BY REGIONAL, 2019-2032 (USD BILLIONS)
    280. INDONESIA TRACK TRACE SOLUTION MARKET SIZE ESTIMATES & FORECAST, BY TECHNOLOGY,
    281. 2032 (USD BILLIONS)
    282. FORECAST, BY APPLICATION, 2019-2032 (USD BILLIONS)
    283. SIZE ESTIMATES & FORECAST, BY INDUSTRY, 2019-2032 (USD BILLIONS)
    284. TRACK TRACE SOLUTION MARKET SIZE ESTIMATES & FORECAST, BY DEPLOYMENT, 2019-2032
    285. (USD BILLIONS)
    286. INDONESIA TRACK TRACE SOLUTION MARKET SIZE ESTIMATES & FORECAST, BY COMPONENT,
    287. 2032 (USD BILLIONS)
    288. FORECAST, BY REGIONAL, 2019-2032 (USD BILLIONS)
    289. SIZE ESTIMATES & FORECAST, BY TECHNOLOGY, 2019-2032 (USD BILLIONS)
    290. TRACK TRACE SOLUTION MARKET SIZE ESTIMATES & FORECAST, BY APPLICATION, 2019-2032
    291. (USD BILLIONS)
    292. REST OF APAC TRACK TRACE SOLUTION MARKET SIZE ESTIMATES & FORECAST, BY
    293. INDUSTRY, 2019-2032 (USD BILLIONS)
    294. ESTIMATES & FORECAST, BY DEPLOYMENT, 2019-2032 (USD BILLIONS)
    295. TRACE SOLUTION MARKET SIZE ESTIMATES & FORECAST, BY COMPONENT, 2019-2032 (USD
    296. BILLIONS)
    297. REST OF APAC TRACK TRACE SOLUTION MARKET SIZE ESTIMATES & FORECAST, BY
    298. REGIONAL, 2019-2032 (USD BILLIONS)
    299. ESTIMATES & FORECAST, BY TECHNOLOGY, 2019-2032 (USD BILLIONS)
    300. TRACE SOLUTION MARKET SIZE ESTIMATES & FORECAST, BY APPLICATION, 2019-2032 (USD
    301. BILLIONS)
    302. SOUTH AMERICA TRACK TRACE SOLUTION MARKET SIZE ESTIMATES & FORECAST, BY
    303. INDUSTRY, 2019-2032 (USD BILLIONS)
    304. ESTIMATES & FORECAST, BY DEPLOYMENT, 2019-2032 (USD BILLIONS)
    305. TRACE SOLUTION MARKET SIZE ESTIMATES & FORECAST, BY COMPONENT, 2019-2032 (USD
    306. BILLIONS)
    307. SOUTH AMERICA TRACK TRACE SOLUTION MARKET SIZE ESTIMATES & FORECAST, BY
    308. REGIONAL, 2019-2032 (USD BILLIONS)
    309. & FORECAST, BY TECHNOLOGY, 2019-2032 (USD BILLIONS)
    310. ESTIMATES & FORECAST, BY APPLICATION, 2019-2032 (USD BILLIONS)
    311. SOLUTION MARKET SIZE ESTIMATES & FORECAST, BY INDUSTRY, 2019-2032 (USD BILLIONS)
    312. BRAZIL TRACK TRACE SOLUTION MARKET SIZE ESTIMATES & FORECAST, BY DEPLOYMENT,
    313. 2032 (USD BILLIONS)
    314. FORECAST, BY COMPONENT, 2019-2032 (USD BILLIONS)
    315. ESTIMATES & FORECAST, BY REGIONAL, 2019-2032 (USD BILLIONS)
    316. SOLUTION MARKET SIZE ESTIMATES & FORECAST, BY TECHNOLOGY, 2019-2032 (USD BILLIONS)
    317. MEXICO TRACK TRACE SOLUTION MARKET SIZE ESTIMATES & FORECAST, BY APPLICATION,
    318. 2032 (USD BILLIONS)
    319. FORECAST, BY INDUSTRY, 2019-2032 (USD BILLIONS)
    320. ESTIMATES & FORECAST, BY DEPLOYMENT, 2019-2032 (USD BILLIONS)
    321. SOLUTION MARKET SIZE ESTIMATES & FORECAST, BY COMPONENT, 2019-2032 (USD BILLIONS)
    322. MEXICO TRACK TRACE SOLUTION MARKET SIZE ESTIMATES & FORECAST, BY REGIONAL, 2019-2032
    323. (USD BILLIONS)
    324. ARGENTINA TRACK TRACE SOLUTION MARKET SIZE ESTIMATES & FORECAST, BY TECHNOLOGY,
    325. 2032 (USD BILLIONS)
    326. FORECAST, BY APPLICATION, 2019-2032 (USD BILLIONS)
    327. SIZE ESTIMATES & FORECAST, BY INDUSTRY, 2019-2032 (USD BILLIONS)
    328. TRACK TRACE SOLUTION MARKET SIZE ESTIMATES & FORECAST, BY DEPLOYMENT, 2019-2032
    329. (USD BILLIONS)
    330. ARGENTINA TRACK TRACE SOLUTION MARKET SIZE ESTIMATES & FORECAST, BY COMPONENT,
    331. 2032 (USD BILLIONS)
    332. FORECAST, BY REGIONAL, 2019-2032 (USD BILLIONS)
    333. MARKET SIZE ESTIMATES & FORECAST, BY TECHNOLOGY, 2019-2032 (USD BILLIONS)
    334. AMERICA TRACK TRACE SOLUTION MARKET SIZE ESTIMATES & FORECAST, BY APPLICATION,
    335. 2032 (USD BILLIONS)
    336. & FORECAST, BY INDUSTRY, 2019-2032 (USD BILLIONS)
    337. MARKET SIZE ESTIMATES & FORECAST, BY DEPLOYMENT, 2019-2032 (USD BILLIONS)
    338. AMERICA TRACK TRACE SOLUTION MARKET SIZE ESTIMATES & FORECAST, BY COMPONENT,
    339. 2032 (USD BILLIONS)
    340. & FORECAST, BY REGIONAL, 2019-2032 (USD BILLIONS)
    341. & FORECAST, BY TECHNOLOGY, 2019-2032 (USD BILLIONS)
    342. & FORECAST, BY APPLICATION, 2019-2032 (USD BILLIONS)
    343. & FORECAST, BY INDUSTRY, 2019-2032 (USD BILLIONS)
    344. & FORECAST, BY DEPLOYMENT, 2019-2032 (USD BILLIONS)
    345. & FORECAST, BY COMPONENT, 2019-2032 (USD BILLIONS)
    346. & FORECAST, BY REGIONAL, 2019-2032 (USD BILLIONS)
    347. SIZE ESTIMATES & FORECAST, BY TECHNOLOGY, 2019-2032 (USD BILLIONS)
    348. TRACK TRACE SOLUTION MARKET SIZE ESTIMATES & FORECAST, BY APPLICATION, 2019-2032
    349. (USD BILLIONS)
    350. GCC COUNTRIES TRACK TRACE SOLUTION MARKET SIZE ESTIMATES & FORECAST, BY
    351. INDUSTRY, 2019-2032 (USD BILLIONS)
    352. ESTIMATES & FORECAST, BY DEPLOYMENT, 2019-2032 (USD BILLIONS)
    353. TRACE SOLUTION MARKET SIZE ESTIMATES & FORECAST, BY COMPONENT, 2019-2032 (USD
    354. BILLIONS)
    355. GCC COUNTRIES TRACK TRACE SOLUTION MARKET SIZE ESTIMATES & FORECAST, BY
    356. REGIONAL, 2019-2032 (USD BILLIONS)
    357. ESTIMATES & FORECAST, BY TECHNOLOGY, 2019-2032 (USD BILLIONS)
    358. TRACE SOLUTION MARKET SIZE ESTIMATES & FORECAST, BY APPLICATION, 2019-2032 (USD
    359. BILLIONS)
    360. SOUTH AFRICA TRACK TRACE SOLUTION MARKET SIZE ESTIMATES & FORECAST, BY
    361. INDUSTRY, 2019-2032 (USD BILLIONS)
    362. ESTIMATES & FORECAST, BY DEPLOYMENT, 2019-2032 (USD BILLIONS)
    363. TRACE SOLUTION MARKET SIZE ESTIMATES & FORECAST, BY COMPONENT, 2019-2032 (USD
    364. BILLIONS)
    365. SOUTH AFRICA TRACK TRACE SOLUTION MARKET SIZE ESTIMATES & FORECAST, BY
    366. REGIONAL, 2019-2032 (USD BILLIONS)
    367. ESTIMATES & FORECAST, BY TECHNOLOGY, 2019-2032 (USD BILLIONS)
    368. TRACE SOLUTION MARKET SIZE ESTIMATES & FORECAST, BY APPLICATION, 2019-2032 (USD
    369. BILLIONS)
    370. REST OF MEA TRACK TRACE SOLUTION MARKET SIZE ESTIMATES & FORECAST, BY INDUSTRY,
    371. 2032 (USD BILLIONS)
    372. FORECAST, BY DEPLOYMENT, 2019-2032 (USD BILLIONS)
    373. SIZE ESTIMATES & FORECAST, BY COMPONENT, 2019-2032 (USD BILLIONS)
    374. TRACK TRACE SOLUTION MARKET SIZE ESTIMATES & FORECAST, BY REGIONAL, 2019-2032
    375. (USD BILLIONS)
    376. PRODUCT LAUNCH/PRODUCT DEVELOPMENT/APPROVAL
    377. SYNOPSIS
    378. NORTH AMERICA TRACK TRACE SOLUTION MARKET ANALYSIS
    379. BY TECHNOLOGY
    380. US TRACK TRACE SOLUTION MARKET ANALYSIS BY APPLICATION
    381. BY INDUSTRY
    382. US TRACK TRACE SOLUTION MARKET ANALYSIS BY DEPLOYMENT
    383. BY COMPONENT
    384. US TRACK TRACE SOLUTION MARKET ANALYSIS BY REGIONAL
    385. BY TECHNOLOGY
    386. CANADA TRACK TRACE SOLUTION MARKET ANALYSIS BY APPLICATION
    387. SOLUTION MARKET ANALYSIS BY INDUSTRY
    388. DEPLOYMENT
    389. CANADA TRACK TRACE SOLUTION MARKET ANALYSIS BY COMPONENT
    390. SOLUTION MARKET ANALYSIS BY REGIONAL
    391. TRACE SOLUTION MARKET ANALYSIS BY TECHNOLOGY
    392. BY APPLICATION
    393. GERMANY TRACK TRACE SOLUTION MARKET ANALYSIS BY INDUSTRY
    394. SOLUTION MARKET ANALYSIS BY DEPLOYMENT
    395. BY COMPONENT
    396. GERMANY TRACK TRACE SOLUTION MARKET ANALYSIS BY REGIONAL
    397. MARKET ANALYSIS BY TECHNOLOGY
    398. SOLUTION MARKET ANALYSIS BY INDUSTRY
    399. UK TRACK TRACE SOLUTION MARKET ANALYSIS BY COMPONENT
    400. BY REGIONAL
    401. FRANCE TRACK TRACE SOLUTION MARKET ANALYSIS BY TECHNOLOGY
    402. SOLUTION MARKET ANALYSIS BY APPLICATION
    403. INDUSTRY
    404. FRANCE TRACK TRACE SOLUTION MARKET ANALYSIS BY DEPLOYMENT
    405. SOLUTION MARKET ANALYSIS BY COMPONENT
    406. REGIONAL
    407. RUSSIA TRACK TRACE SOLUTION MARKET ANALYSIS BY TECHNOLOGY
    408. SOLUTION MARKET ANALYSIS BY APPLICATION
    409. INDUSTRY
    410. RUSSIA TRACK TRACE SOLUTION MARKET ANALYSIS BY DEPLOYMENT
    411. SOLUTION MARKET ANALYSIS BY COMPONENT
    412. REGIONAL
    413. ITALY TRACK TRACE SOLUTION MARKET ANALYSIS BY TECHNOLOGY
    414. SOLUTION MARKET ANALYSIS BY APPLICATION
    415. INDUSTRY
    416. ITALY TRACK TRACE SOLUTION MARKET ANALYSIS BY DEPLOYMENT
    417. SOLUTION MARKET ANALYSIS BY COMPONENT
    418. REGIONAL
    419. SPAIN TRACK TRACE SOLUTION MARKET ANALYSIS BY TECHNOLOGY
    420. SOLUTION MARKET ANALYSIS BY APPLICATION
    421. INDUSTRY
    422. SPAIN TRACK TRACE SOLUTION MARKET ANALYSIS BY DEPLOYMENT
    423. SOLUTION MARKET ANALYSIS BY COMPONENT
    424. REGIONAL
    425. REST OF EUROPE TRACK TRACE SOLUTION MARKET ANALYSIS BY TECHNOLOGY
    426. TRACK TRACE SOLUTION MARKET ANALYSIS BY APPLICATION
    427. ANALYSIS BY INDUSTRY
    428. REST OF EUROPE TRACK TRACE SOLUTION MARKET ANALYSIS BY DEPLOYMENT
    429. TRACK TRACE SOLUTION MARKET ANALYSIS BY COMPONENT
    430. ANALYSIS BY REGIONAL
    431. APAC TRACK TRACE SOLUTION MARKET ANALYSIS
    432. BY TECHNOLOGY
    433. CHINA TRACK TRACE SOLUTION MARKET ANALYSIS BY APPLICATION
    434. SOLUTION MARKET ANALYSIS BY INDUSTRY
    435. DEPLOYMENT
    436. CHINA TRACK TRACE SOLUTION MARKET ANALYSIS BY COMPONENT
    437. BY REGIONAL
    438. INDIA TRACK TRACE SOLUTION MARKET ANALYSIS BY TECHNOLOGY
    439. SOLUTION MARKET ANALYSIS BY APPLICATION
    440. INDUSTRY
    441. INDIA TRACK TRACE SOLUTION MARKET ANALYSIS BY DEPLOYMENT
    442. SOLUTION MARKET ANALYSIS BY COMPONENT
    443. REGIONAL
    444. JAPAN TRACK TRACE SOLUTION MARKET ANALYSIS BY TECHNOLOGY
    445. SOLUTION MARKET ANALYSIS BY APPLICATION
    446. INDUSTRY
    447. JAPAN TRACK TRACE SOLUTION MARKET ANALYSIS BY DEPLOYMENT
    448. SOLUTION MARKET ANALYSIS BY COMPONENT
    449. REGIONAL
    450. SOUTH KOREA TRACK TRACE SOLUTION MARKET ANALYSIS BY TECHNOLOGY
    451. TRACE SOLUTION MARKET ANALYSIS BY APPLICATION
    452. ANALYSIS BY INDUSTRY
    453. SOUTH KOREA TRACK TRACE SOLUTION MARKET ANALYSIS BY DEPLOYMENT
    454. TRACE SOLUTION MARKET ANALYSIS BY COMPONENT
    455. ANALYSIS BY REGIONAL
    456. MALAYSIA TRACK TRACE SOLUTION MARKET ANALYSIS BY TECHNOLOGY
    457. SOLUTION MARKET ANALYSIS BY APPLICATION
    458. BY INDUSTRY
    459. MALAYSIA TRACK TRACE SOLUTION MARKET ANALYSIS BY DEPLOYMENT
    460. SOLUTION MARKET ANALYSIS BY COMPONENT
    461. BY REGIONAL
    462. THAILAND TRACK TRACE SOLUTION MARKET ANALYSIS BY TECHNOLOGY
    463. SOLUTION MARKET ANALYSIS BY APPLICATION
    464. BY INDUSTRY
    465. THAILAND TRACK TRACE SOLUTION MARKET ANALYSIS BY DEPLOYMENT
    466. SOLUTION MARKET ANALYSIS BY COMPONENT
    467. BY REGIONAL
    468. INDONESIA TRACK TRACE SOLUTION MARKET ANALYSIS BY TECHNOLOGY
    469. SOLUTION MARKET ANALYSIS BY APPLICATION
    470. BY INDUSTRY
    471. INDONESIA TRACK TRACE SOLUTION MARKET ANALYSIS BY DEPLOYMENT
    472. SOLUTION MARKET ANALYSIS BY COMPONENT
    473. BY REGIONAL
    474. REST OF APAC TRACK TRACE SOLUTION MARKET ANALYSIS BY TECHNOLOGY
    475. TRACK TRACE SOLUTION MARKET ANALYSIS BY APPLICATION
    476. ANALYSIS BY INDUSTRY
    477. REST OF APAC TRACK TRACE SOLUTION MARKET ANALYSIS BY DEPLOYMENT
    478. TRACK TRACE SOLUTION MARKET ANALYSIS BY COMPONENT
    479. ANALYSIS BY REGIONAL
    480. SOUTH AMERICA TRACK TRACE SOLUTION MARKET ANALYSIS
    481. BY TECHNOLOGY
    482. BRAZIL TRACK TRACE SOLUTION MARKET ANALYSIS BY APPLICATION
    483. SOLUTION MARKET ANALYSIS BY INDUSTRY
    484. BY DEPLOYMENT
    485. BRAZIL TRACK TRACE SOLUTION MARKET ANALYSIS BY COMPONENT
    486. SOLUTION MARKET ANALYSIS BY REGIONAL
    487. BY TECHNOLOGY
    488. MEXICO TRACK TRACE SOLUTION MARKET ANALYSIS BY APPLICATION
    489. SOLUTION MARKET ANALYSIS BY INDUSTRY
    490. BY DEPLOYMENT
    491. MEXICO TRACK TRACE SOLUTION MARKET ANALYSIS BY COMPONENT
    492. SOLUTION MARKET ANALYSIS BY REGIONAL
    493. BY TECHNOLOGY
    494. ARGENTINA TRACK TRACE SOLUTION MARKET ANALYSIS BY APPLICATION
    495. SOLUTION MARKET ANALYSIS BY INDUSTRY
    496. BY DEPLOYMENT
    497. ARGENTINA TRACK TRACE SOLUTION MARKET ANALYSIS BY COMPONENT
    498. SOLUTION MARKET ANALYSIS BY REGIONAL
    499. ANALYSIS BY TECHNOLOGY
    500. BY APPLICATION
    501. REST OF SOUTH AMERICA TRACK TRACE SOLUTION MARKET ANALYSIS BY INDUSTRY
    502. AMERICA TRACK TRACE SOLUTION MARKET ANALYSIS BY DEPLOYMENT
    503. MARKET ANALYSIS BY COMPONENT
    504. BY REGIONAL
    505. MEA TRACK TRACE SOLUTION MARKET ANALYSIS
    506. ANALYSIS BY TECHNOLOGY
    507. GCC COUNTRIES TRACK TRACE SOLUTION MARKET ANALYSIS BY INDUSTRY
    508. TRACE SOLUTION MARKET ANALYSIS BY DEPLOYMENT
    509. ANALYSIS BY COMPONENT
    510. GCC COUNTRIES TRACK TRACE SOLUTION MARKET ANALYSIS BY REGIONAL
    511. TRACE SOLUTION MARKET ANALYSIS BY TECHNOLOGY
    512. ANALYSIS BY APPLICATION
    513. SOUTH AFRICA TRACK TRACE SOLUTION MARKET ANALYSIS BY DEPLOYMENT
    514. TRACE SOLUTION MARKET ANALYSIS BY COMPONENT
    515. ANALYSIS BY REGIONAL
    516. REST OF MEA TRACK TRACE SOLUTION MARKET ANALYSIS BY TECHNOLOGY
    517. TRACE SOLUTION MARKET ANALYSIS BY APPLICATION
    518. ANALYSIS BY INDUSTRY
    519. REST OF MEA TRACK TRACE SOLUTION MARKET ANALYSIS BY DEPLOYMENT
    520. TRACE SOLUTION MARKET ANALYSIS BY COMPONENT
    521. ANALYSIS BY REGIONAL
    522. KEY BUYING CRITERIA OF TRACK TRACE SOLUTION MARKET
    523. TRACE SOLUTION MARKET
    524. DRIVERS IMPACT ANALYSIS: TRACK TRACE SOLUTION MARKET
    525. SOLUTION MARKET
    526. SUPPLY / VALUE CHAIN: TRACK TRACE SOLUTION MARKET
    527. (% SHARE)
    528. TRACK TRACE SOLUTION MARKET, BY TECHNOLOGY, 2019 TO 2032 (USD Billions)
    529. SOLUTION MARKET, BY APPLICATION, 2024 (% SHARE)
    530. TO 2032 (USD Billions)
    531. TRACK TRACE SOLUTION MARKET, BY INDUSTRY, 2019 TO 2032 (USD Billions)
    532. SOLUTION MARKET, BY DEPLOYMENT, 2024 (% SHARE)
    533. TO 2032 (USD Billions)
    534. TRACK TRACE SOLUTION MARKET, BY COMPONENT, 2019 TO 2032 (USD Billions)
    535. SOLUTION MARKET, BY REGIONAL, 2024 (% SHARE)
    536. TO 2032 (USD Billions)

    Track and Trace Solution Market Segmentation

    Market Segmentation Overview

    • Detailed segmentation data will be available in the full report
    • Comprehensive analysis by multiple parameters
    • Regional and country-level breakdowns
    • Market size forecasts by segment
    Track and Trace Solution Market Research Report — Global Forecast till 2034 Infographic
    Free Sample Request

    Kindly complete the form below to receive a free sample of this Report

    Customer Strories

    “I am very pleased with how market segments have been defined in a relevant way for my purposes (such as "Portable Freezers & refrigerators" and "last-mile"). In general the report is well structured. Thanks very much for your efforts.”

    Victoria Milne Founder
    Case Study

    Chemicals and Materials