• Cat-intel
  • MedIntelliX
  • Resources
  • About Us
  • Request Free Sample ×

    Kindly complete the form below to receive a free sample of this Report

    Leading companies partner with us for data-driven Insights

    clients tt-cursor

    Time-Sensitive Networking Market

    ID: MRFR/ICT/9043-HCR
    200 Pages
    Aarti Dhapte
    September 2025

    Time Sensitive Networking Market Research Report By Application (Industrial Automation, Automotive, Aerospace, Smart Grids), By Network Protocol (IEEE 802.1Qbv, IEEE 802.1Qci, IEEE 1588), By End Use (Manufacturing, Transportation, Telecommunications), By Component (Switches, Routers, Software) and By Regional (North America, Europe, South America, Asia Pacific, Middle East and Africa) - Forecast to 2035.

    Share:
    Download PDF ×

    We do not share your information with anyone. However, we may send you emails based on your report interest from time to time. You may contact us at any time to opt-out.

    Time Sensitive Networking Market Research Report — Global Forecast till 2035 Infographic
    Purchase Options
    $ 4,950.0
    $ 5,950.0
    $ 7,250.0

    Time-Sensitive Networking Market Summary

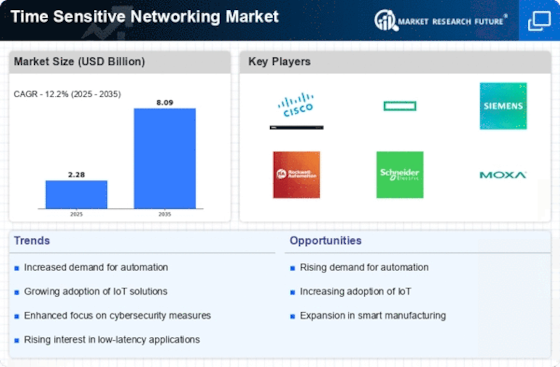
    As per Market Research Future Analysis, the Time Sensitive Networking Market is projected to grow significantly, driven by the increasing demand for real-time data transfer across various sectors. The market size was estimated at 2.28 USD Billion in 2024 and is expected to reach 8 USD Billion by 2035, with a CAGR of 11.03% from 2025 to 2035. Key applications include Industrial Automation, Automotive, Aerospace, and Smart Grids, highlighting the critical need for low-latency communication protocols in these industries.

    Key Market Trends & Highlights

    The Time Sensitive Networking Market is witnessing transformative trends fueled by technological advancements and industry demands.

    • Market size in 2024: 2.28 USD Billion; projected to reach 8 USD Billion by 2035.
    • Industrial Automation segment valued at 0.95 USD Billion in 2024; expected to grow to 3.3 USD Billion by 2035.
    • Automotive sector projected to grow from 0.6 USD Billion in 2024 to 2.1 USD Billion by 2035.
    • IoT devices expected to exceed 30 billion by 2025, driving the need for TSN solutions.

    Market Size & Forecast

    2024 Market Size USD 2.28 Billion
    2035 Market Size USD 8 Billion
    CAGR (2025-2035) 11.03%

    Major Players

    Key Companies include ABB, Rockwell Automation, NXP Semiconductors, Marvell Technology, Phoenix Contact, IEEE, Belden, Moxa, Cisco Systems, Hirschmann, TTTech Computertechnik, Broadcom, Honeywell, National Instruments, Siemens.

    Time-Sensitive Networking Market Trends

    The Time Sensitive Networking Market is experiencing significant growth driven by several key market drivers. The increasing demand for low-latency communication in industries such as automotive, industrial automation, and healthcare is pushing organizations to adopt Time Sensitive Networking (TSN) solutions. These solutions help ensure reliable communication for real-time applications, which is crucial for the performance of smart manufacturing and IoT systems. Additionally, the rise in the deployment of smart devices and the Industrial Internet of Things (IIoT) is enhancing the need for integrated networking solutions that can handle large amounts of data with minimal delay.

    Opportunities in the market are abundant, particularly in developing regions where industrialization is ramping up. There is a potential to capture market share by providing tailored TSN solutions that cater to varied regional requirements, especially in sectors such as telecommunications and energy. As governments worldwide invest in upgrading infrastructure to support smart technologies, the potential for innovative TSN applications expands. Recent trends indicate a growing focus on standardization among industry players. With organizations striving to comply with global networking standards, the collaboration of leading technology providers and standard-setting bodies is becoming more common.

    This shift towards standardization helps ensure interoperability of devices, enabling broader adoption of TSN across diverse industries. Furthermore, advancements in hardware and software technologies are continuously shaping the landscape of Time Sensitive Networking, enhancing its capability and performance. Overall, the Time Sensitive Networking Market is on an upward trajectory, influenced by technological advancements and increasing demands for efficient and reliable connectivity.

    Source: Primary Research, Secondary Research, Market Research Future Database and Analyst Review

    The ongoing evolution of Time Sensitive Networking technology appears to enhance the reliability and efficiency of data transmission across various sectors, potentially transforming industrial automation and smart transportation systems.

    U.S. Department of Commerce

    Time-Sensitive Networking Market Drivers

    Emergence of Smart Cities

    The emergence of smart cities is significantly influencing the Global Time Sensitive Networking Market Industry. Urban areas are increasingly integrating advanced technologies to enhance infrastructure, transportation, and public services. Time Sensitive Networking is essential for the seamless operation of smart city applications, such as traffic management systems and public safety networks. As cities strive to improve the quality of life for residents, the demand for reliable and efficient communication networks is expected to grow. This trend is likely to contribute to a compound annual growth rate of 12.09% from 2025 to 2035, as municipalities invest in modern networking solutions to support their smart initiatives.

    Market Growth Visualization

    Increased Focus on Cybersecurity

    Increased focus on cybersecurity is shaping the Global Time Sensitive Networking Market Industry as organizations recognize the importance of securing their networks against potential threats. With the rise of interconnected devices, the risk of cyberattacks has escalated, prompting businesses to adopt more secure networking solutions. Time Sensitive Networking offers enhanced security features that protect sensitive data during transmission, making it an attractive option for industries such as finance and healthcare. As organizations prioritize cybersecurity, the market is likely to benefit from heightened investments in secure networking technologies, further driving growth in the coming years.

    Advancements in Industrial Automation

    Advancements in industrial automation are propelling the Global Time Sensitive Networking Market Industry forward. With the rise of Industry 4.0, manufacturers are increasingly adopting smart technologies that require reliable and timely data exchange. Time Sensitive Networking plays a crucial role in ensuring that automated systems function optimally by providing deterministic communication. As a result, the market is expected to witness substantial growth, with projections indicating a value of 8 USD Billion by 2035. This trend is further supported by the increasing implementation of IoT devices and smart sensors, which necessitate robust networking solutions to maintain operational efficiency and safety.

    Regulatory Support and Standardization

    Regulatory support and standardization are pivotal in fostering the growth of the Global Time Sensitive Networking Market Industry. Governments and industry bodies are increasingly recognizing the need for standardized networking protocols to ensure interoperability and reliability across various applications. Initiatives aimed at developing and promoting Time Sensitive Networking standards are likely to enhance market adoption, as organizations seek to comply with regulatory requirements. This supportive environment is expected to facilitate the integration of Time Sensitive Networking solutions across diverse sectors, thereby contributing to the overall market expansion.

    Growing Demand for Real-Time Data Processing

    The Global Time Sensitive Networking Market Industry is experiencing a surge in demand for real-time data processing across various sectors, including manufacturing, automotive, and telecommunications. As industries increasingly rely on instantaneous data transmission for operational efficiency, the market is projected to reach 2.28 USD Billion in 2024. This growth is driven by the need for low-latency communication, enabling applications such as autonomous vehicles and smart factories. The integration of Time Sensitive Networking technology facilitates seamless communication between devices, thereby enhancing productivity and reducing operational costs. Consequently, the market is anticipated to expand significantly as organizations seek to leverage real-time data capabilities.

    Market Segment Insights

    Time Sensitive Networking Market Application Insights

    The Time Sensitive Networking Market revenue is poised for substantial growth, expected to be valued at 2.28 USD Billion in 2024, with major applications including Industrial Automation, Automotive, Aerospace, and Smart Grids playing pivotal roles. Within this landscape, Industrial Automation commands a significant share, valued at 0.9 USD Billion in 2024 and projected to expand to 3.2 USD Billion by 2035, showcasing its importance in enhancing operational efficiency and reducing latency in manufacturing processes. The Automotive sector follows closely, valued at 0.7 USD Billion in 2024 and expected to reach 2.5 USD Billion by 2035.

    This application is crucial for the proliferation of connected vehicles, which demand real-time data transmission for safety and navigation purposes. In the Aerospace field, the valuation is 0.4 USD Billion in 2024, moving to 1.5 USD Billion by 2035, where Time Sensitive Networking facilitates critical communications between aircraft systems, thus ensuring safety and reliability in aviation operations. Lastly, Smart Grids stand as an emerging application with a valuation of 0.28 USD Billion in 2024 and a projected 1.8 USD Billion in 2035, directly impacting energy distribution efficiency by enabling better management of renewable energy sources and real-time grid monitoring.

    The overall growth trends highlight a consistent demand for low-latency, reliable network applications, driven by advancements in technology, increased automation, and the growing Internet of Things integration across various industries, pushing the Time Sensitive Networking Market statistics upward. With substantial investments in these sectors, challenges such as technological integration and standardization will play critical roles in shaping the future of the market, but the opportunities presented by the increasing need for real-time communication and data integrity are undeniable, making these applications significant contributors to the overall market growth trajectory.

    Source: Primary Research, Secondary Research, Market Research Future Database and Analyst Review

    Time Sensitive Networking Market Network Protocol Insights

    The Time Sensitive Networking Market, particularly focusing on the Network Protocol segment, is structured around critical standards such as IEEE 802.1Qbv, IEEE 802.1Qci, and IEEE 1588. As the market is projected to reach a valuation of 2.28 billion USD by 2024, the importance of these standards is rapidly increasing. IEEE 802.1Qbv provides mechanisms to manage scheduled traffic, allowing for predictable performance, which is essential in applications like industrial automation and automotive systems. Meanwhile, IEEE 802.1Qci plays a vital role in enhancing protection against traffic anomalies, thus improving the overall data integrity and quality in networked communications.

    IEEE 1588, known for its precision time protocol, is crucial for applications requiring high synchronization accuracy, such as smart grids and telecommunications. These protocols are significant as they form the foundation for achieving low latency and high reliability in various industrial and consumer applications. The adoption of Time Sensitive Networking, enabled by these protocols, reflects global trends toward automation and real-time data processing, providing opportunities for improved efficiency and performance in networking solutions across industries worldwide.

    Time Sensitive Networking Market End Use Insights

    The Time Sensitive Networking Market is experiencing significant growth, particularly in its End Use segments such as Manufacturing, Transportation, and Telecommunications. By 2024, the market is expected to reach a value of 2.28 USD Billion, showcasing the increasing demand for efficient and reliable networking solutions. Manufacturing is a critical area where Time Sensitive Networking plays a pivotal role, enabling real-time data transfer and streamlined operational processes. In the Transportation sector, the technology facilitates improved communication systems, enhancing the safety and efficiency of logistics and traffic management.

    Telecommunications also harnesses Time Sensitive Networking to support advancements in mobile and internet services, meeting the rising need for high data transmission rates. The Time Sensitive Networking Market segmentation reflects these dynamics, with each segment contributing uniquely to the market growth. As industries increasingly rely on interconnected systems, the integration of Time Sensitive Networking becomes imperative to optimize performance and ensure timely decision-making, ultimately driving innovation in the Global landscape.

    Market growth is propelled by the rising need for low-latency communications and automation across these vital sectors, amid challenges related to adaptation and infrastructure costs.

    Time Sensitive Networking Market Component Insights

    The Time Sensitive Networking Market, particularly within the Component segment, is witnessing substantial growth, with a market value projected to reach 2.28 USD billion by 2024 and further elevating to 8.0 USD billion by 2035. This segment comprises essential elements such as Switches, Routers, and Software, which play a crucial role in enhancing network performance and reliability. Switches are pivotal as they enable deterministic real-time data transmission, crucial for industries relying on precise timing like automation and transportation.

    Routers facilitate the communication between different networks, ensuring efficient data flow, which supports the increasing demand for interconnected systems globally. Additionally, Software solutions are vital for managing these components effectively, offering users flexibility and scalability in network management. The acceleration of Industry 4.0 and the Internet of Things (IoT) is driving the necessity for robust and real-time networks, fostering innovation and growth within the Time Sensitive Networking Market. This sector faces challenges such as interoperability among diverse systems, but also presents ample opportunities for advancements in network efficiency and capability.

    The market is favorably positioned for growth driven by increased connectivity requirements across various sectors, underscoring the significance of these components in realizing efficient and responsive networking solutions.

    Get more detailed insights about Time Sensitive Networking Market Research Report — Global Forecast till 2035

    Regional Insights

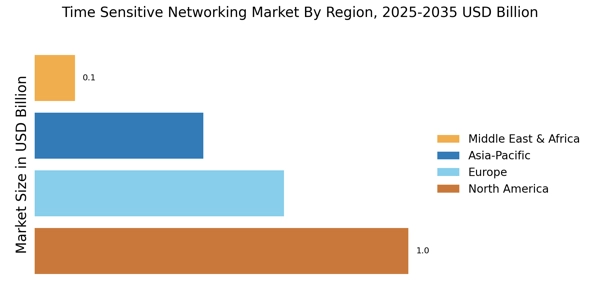
    The Time Sensitive Networking Market is poised for robust growth, with regional insights highlighting varying degrees of market activity. North America dominated the market with a valuation of 0.84 USD Billion in 2024, projected to escalate to 2.98 USD Billion by 2035, showcasing significant advancement in sectors like industrial automation and smart manufacturing. Europe follows, valued at 0.64 USD Billion in 2024 and expected to reach 2.32 USD Billion in 2035, reflecting strong demand in the telecommunications and automotive industries.

    Asia Pacific, holding an initial value of 0.54 USD Billion in 2024, is anticipated to grow to 1.94 USD Billion, driven by rapid industrialization and increasing investment in smart city initiatives.

    The South American segment, though smaller at 0.18 USD Billion in 2024, is emerging with a growth expectation to 0.64 USD Billion by 2035, suggesting potential adoption of advanced network solutions. Meanwhile, the Middle East and Africa, valued at 0.08 USD Billion in 2024, is slowly developing, with a corresponding increase to 0.32 USD Billion by 2035, signifying growing interest in digital transformation initiatives. Overall, the diverse regional dynamics underscore key drivers and opportunities for the Time Sensitive Networking Market, as each area capitalizes on unique technological advancements and industry requirements.

    Time Sensitive Networking Market Regional Insights

    Source: Primary Research, Secondary Research, Market Research Future Database and Analyst Review

    Key Players and Competitive Insights

    The Time Sensitive Networking Market is experiencing significant growth, driven by the increasing demand for real-time data communication across various industries, including automotive, automation, telecommunications, and smart manufacturing. Competitive insights in this market reveal a dynamic landscape where companies are continuously innovating their technologies and solutions to provide low-latency communication. The emphasis on enhancing the quality of service and improving network efficiency has escalated the competition, prompting players to adopt strategic partnerships, product launches, and technological advancements.

    The market's competitive dynamics are characterized by companies focusing on providing scalable and robust networking architectures capable of handling critical applications that require timely data transmission. The rising need for IoT applications and the shift towards Industry 4.0 are further contributing to the competitive strategies employed in this segment as firms aim to capture shares in both emerging and established markets.

    Juniper Networks holds a substantial position in the Time Sensitive Networking Market by leveraging its strengths in providing advanced networking solutions and expertise in automated network management. The company has established its presence through innovative technologies that facilitate seamless connectivity and data integrity across various platforms. Juniper Networks emphasizes its commitment to enhancing network performance while reducing latency, making it a preferred choice for industries that rely on real-time communications. The company’s strong focus on research and development allows it to continually refine its offerings and introduce solutions tailored to meet the evolving needs of enterprises and service providers globally.

    Additionally, Juniper's strategic collaborations with other technology leaders and participation in industry standards organizations bolster its competitive advantage, positioning it as a leader in the Time Sensitive Networking landscape.

    Broadcom is also a key player in the Time Sensitive Networking Market, recognized for its robust portfolio of networking solutions and semiconductors. The company delivers an extensive range of products that enhance network efficiency and facilitate real-time data processing, catering to the demands of various sectors such as industrial automation and telecommunications. Broadcom's strengths lie in its high-performance TCUs and NICs specifically designed for Time Sensitive Networking, which support applications requiring precise timing and synchronization. The company's global reach is complemented by strategic mergers and acquisitions that enhance its technology offerings and market presence.

    Broadcom continues to invest in innovation and expand its product lines, ensuring that its solutions align with the industry's advancing needs and standards. Through its commitment to delivering reliable and advanced networking capabilities, Broadcom solidifies its position in this competitive market landscape, addressing the complexities of modern communication infrastructure globally.

    Key Companies in the Time-Sensitive Networking Market market include

    Industry Developments

    Future Outlook

    Time-Sensitive Networking Market Future Outlook

    The Time Sensitive Networking Market is projected to grow at a 12.09% CAGR from 2024 to 2035, driven by increasing demand for real-time data transmission and automation in various industries.

    New opportunities lie in:

    • Develop advanced TSN solutions for industrial automation to enhance operational efficiency.
    • Invest in cybersecurity measures tailored for TSN to protect sensitive data transmissions.
    • Create partnerships with IoT providers to integrate TSN in smart city projects.

    By 2035, the Time Sensitive Networking Market is expected to be a pivotal component of global communication infrastructure.

    Market Segmentation

    Time Sensitive Networking Market End Use Outlook

    • Switches
    • Routers
    • Software

    Time Sensitive Networking Market Regional Outlook

    • North America
    • Europe
    • South America
    • Asia Pacific
    • Middle East and Africa

    Time Sensitive Networking Market Component Outlook

    • North America
    • Europe
    • South America
    • Asia Pacific
    • Middle East and Africa

    Time Sensitive Networking Market Application Outlook

    • IEEE 802.1Qbv
    • IEEE 802.1Qci
    • IEEE 1588

    Time Sensitive Networking Market Network Protocol Outlook

    • Manufacturing
    • Transportation
    • Telecommunications

    Report Scope

    Report Attribute/Metric

    Details

    Market Size 2023

    2.05(USD Billion)

    Market Size 2024

    2.28(USD Billion)

    Market Size 2035

    8.0(USD Billion)

    Compound Annual Growth Rate (CAGR)

    12.2% (2025 - 2035)

    Report Coverage

    Revenue Forecast, Competitive Landscape, Growth Factors, and Trends

    Base Year

    2024

    Market Forecast Period

    2025 - 2035

    Historical Data

    2019 - 2024

    Market Forecast Units

    USD Billion

    Key Companies Profiled

    Juniper Networks, Broadcom, Hirschmann Automation and Control, Rockwell Automation, Moxa, Hewlett Packard Enterprise, Belden, Texas Instruments, Cisco Systems, Siemens, Analog Devices, Viavi Solutions, Korenix Technology, NTT Communications

    Segments Covered

    Application, Network Protocol, End Use, Component, Regional

    Key Market Opportunities

    Increased demand for automation, Growth in IoT applications, Rising need for low-latency solutions, Expansion in industrial networking, Development of smart cities infrastructure

    Key Market Dynamics

    growing IoT adoption, increasing industrial automation, demand for low-latency communication, rising need for network reliability, advancements in networking technologies

    Countries Covered

    North America, Europe, APAC, South America, MEA

    Market Highlights

    Author
    Aarti Dhapte
    Team Lead - Research

    She holds an experience of about 6+ years in Market Research and Business Consulting, working under the spectrum of Information Communication Technology, Telecommunications and Semiconductor domains. Aarti conceptualizes and implements a scalable business strategy and provides strategic leadership to the clients. Her expertise lies in market estimation, competitive intelligence, pipeline analysis, customer assessment, etc.

    Leave a Comment

    FAQs

    What was the market size of the Time Sensitive Networking Market in 2024?

    The Time Sensitive Networking Market was valued at 2.28 billion USD in 2024.

    What will the market size be for the Time Sensitive Networking Market by 2035?

    By 2035, the Time Sensitive Networking Market is projected to reach a valuation of 8.0 billion USD.

    What is the anticipated CAGR for the Time Sensitive Networking Market from 2025 to 2035?

    The expected CAGR for the Time Sensitive Networking Market from 2025 to 2035 is 12.2 percent.

    Which region is anticipated to hold the largest market share in the Time Sensitive Networking Market by 2035?

    North America is anticipated to hold the largest market share, reaching a value of 2.98 billion USD by 2035.

    How does the market size for the Industrial Automation application segment change from 2024 to 2035?

    The Industrial Automation application segment is expected to grow from 0.9 billion USD in 2024 to 3.2 billion USD by 2035.

    What is the market size projection for the Automotive application segment by 2035?

    The Automotive application segment is projected to reach 2.5 billion USD by 2035.

    Which major players are leading the Time Sensitive Networking Market?

    Key players in the market include Juniper Networks, Cisco Systems, and Rockwell Automation, among others.

    What was the market size for the Aerospace application segment in 2024?

    The Aerospace application segment was valued at 0.4 billion USD in 2024.

    How does the Smart Grids application segment's market size develop from 2024 to 2035?

    The Smart Grids application segment is anticipated to grow from 0.28 billion USD in 2024 to 1.8 billion USD by 2035.

    What is the projected market size for the Europe region by 2035?

    The market size for the Europe region is projected to reach 2.32 billion USD by 2035.

    1. EXECUTIVE SUMMARY
    2. Market Overview
    3. Key Findings
    4. Market Segmentation
    5. Competitive Landscape
    6. Challenges and Opportunities
    7. Future Outlook
    8. MARKET INTRODUCTION
    9. Definition
    10. Scope of the study
    11. Research Objective
    12. Assumption
    13. Limitations
    14. RESEARCH
    15. METHODOLOGY
    16. Overview
    17. Data Mining
    18. Secondary Research
    19. Primary Research
    20. Primary Interviews and Information Gathering Process
    21. Breakdown of Primary Respondents
    22. Forecasting Model
    23. Market Size Estimation
    24. Bottom-Up Approach
    25. Top-Down Approach
    26. Data Triangulation
    27. Validation
    28. MARKET DYNAMICS
    29. Overview
    30. Drivers
    31. Restraints
    32. Opportunities
    33. MARKET FACTOR ANALYSIS
    34. Value chain Analysis
    35. Porter's Five Forces
    36. Analysis
    37. Bargaining Power of Suppliers
    38. Bargaining Power of Buyers
    39. Threat of New Entrants
    40. Threat of Substitutes
    41. Intensity of Rivalry
    42. COVID-19 Impact
    43. Analysis
    44. Market Impact Analysis
    45. Regional Impact
    46. Opportunity and
    47. Threat Analysis
    48. Time Sensitive Networking Market, BY Application (USD
    49. Billion)
    50. Industrial Automation
    51. Automotive
    52. Aerospace
    53. Smart Grids
    54. Time
    55. Sensitive Networking Market, BY Network Protocol (USD Billion)
    56. IEEE 802.1Qbv
    57. IEEE 802.1Qci
    58. IEEE 1588
    59. Time
    60. Sensitive Networking Market, BY End Use (USD Billion)
    61. Manufacturing
    62. Transportation
    63. Telecommunications
    64. Time Sensitive Networking Market,
    65. BY Component (USD Billion)
    66. Switches
    67. Routers
    68. Software
    69. Time
    70. Sensitive Networking Market, BY Regional (USD Billion)
    71. North America
    72. US
    73. Canada
    74. Europe
    75. Germany
    76. UK
    77. France
    78. Russia
    79. Italy
    80. Spain
    81. Rest of Europe
    82. APAC
    83. China
    84. India
    85. Japan
    86. South Korea
    87. Malaysia
    88. Thailand
    89. Indonesia
    90. Rest of APAC
    91. South America
    92. Brazil
    93. Mexico
    94. Argentina
    95. Rest of South America
    96. MEA
    97. GCC Countries
    98. South Africa
    99. Rest of MEA
    100. Competitive Landscape
    101. Overview
    102. Competitive Analysis
    103. Market share Analysis
    104. Major Growth Strategy in the Time
    105. Sensitive Networking Market
    106. Competitive Benchmarking
    107. Leading Players
    108. in Terms of Number of Developments in the Time Sensitive Networking Market
    109. Key developments
    110. and growth strategies
    111. New Product Launch/Service Deployment
    112. Merger & Acquisitions
    113. Joint Ventures
    114. Major Players Financial Matrix
    115. Sales and Operating Income
    116. Major Players R&D Expenditure.
    117. Company Profiles
    118. Juniper Networks
    119. Financial Overview
    120. Products Offered
    121. Key Developments
    122. SWOT Analysis
    123. Key Strategies
    124. Broadcom
    125. Financial Overview
    126. Products Offered
    127. Key Developments
    128. SWOT Analysis
    129. Key Strategies
    130. Hirschmann Automation
    131. and Control
    132. Financial Overview
    133. Products Offered
    134. Key Developments
    135. SWOT Analysis
    136. Key Strategies
    137. Rockwell Automation
    138. Financial Overview
    139. Products Offered
    140. Key Developments
    141. SWOT Analysis
    142. Key Strategies
    143. Moxa
    144. Financial Overview
    145. Products Offered
    146. Key Developments
    147. SWOT Analysis
    148. Key Strategies
    149. Hewlett Packard
    150. Enterprise
    151. Financial Overview
    152. Products Offered
    153. Key Developments
    154. SWOT Analysis
    155. Key Strategies
    156. Belden
    157. Financial Overview
    158. Products Offered
    159. Key Developments
    160. SWOT Analysis
    161. Key Strategies
    162. Texas Instruments
    163. Financial Overview
    164. Products Offered
    165. Key Developments
    166. SWOT Analysis
    167. Key Strategies
    168. Cisco Systems
    169. Financial Overview
    170. Products Offered
    171. Key Developments
    172. SWOT Analysis
    173. Key Strategies
    174. Siemens
    175. Financial Overview
    176. Products Offered
    177. Key Developments
    178. SWOT Analysis
    179. Key Strategies
    180. Analog Devices
    181. Financial Overview
    182. Products Offered
    183. Key Developments
    184. SWOT Analysis
    185. Key Strategies
    186. Viavi Solutions
    187. Financial Overview
    188. Products Offered
    189. Key Developments
    190. SWOT Analysis
    191. Key Strategies
    192. Korenix Technology
    193. Financial Overview
    194. Products Offered
    195. Key Developments
    196. SWOT Analysis
    197. Key Strategies
    198. NTT Communications
    199. Financial Overview
    200. Products Offered
    201. Key Developments
    202. SWOT Analysis
    203. Key Strategies
    204. References
    205. Related Reports
    206. North America Market SIZE ESTIMATES & FORECAST, BY APPLICATION,
    207. 2035 (USD Billions)
    208. North America
    209. Market SIZE ESTIMATES & FORECAST, BY NETWORK PROTOCOL, 2019-2035 (USD Billions)
    210. North America Market SIZE ESTIMATES & FORECAST, BY END USE,
    211. 2035 (USD Billions)
    212. North America
    213. Market SIZE ESTIMATES & FORECAST, BY COMPONENT, 2019-2035 (USD Billions)
    214. North America Market SIZE ESTIMATES & FORECAST, BY REGIONAL,
    215. 2035 (USD Billions)
    216. US Market
    217. SIZE ESTIMATES & FORECAST, BY APPLICATION, 2019-2035 (USD Billions)
    218. US
    219. Market SIZE ESTIMATES & FORECAST, BY NETWORK PROTOCOL, 2019-2035 (USD Billions)
    220. US Market SIZE ESTIMATES & FORECAST, BY END USE, 2019-2035 (USD
    221. Billions)
    222. US Market SIZE ESTIMATES & FORECAST, BY
    223. COMPONENT, 2019-2035 (USD Billions)
    224. US
    225. Market SIZE ESTIMATES & FORECAST, BY REGIONAL, 2019-2035 (USD Billions)
    226. Canada Market SIZE ESTIMATES & FORECAST, BY APPLICATION, 2019-2035
    227. (USD Billions)
    228. Canada Market SIZE ESTIMATES & FORECAST,
    229. BY NETWORK PROTOCOL, 2019-2035 (USD Billions)
    230. Canada
    231. Market SIZE ESTIMATES & FORECAST, BY END USE, 2019-2035 (USD Billions)
    232. Canada Market SIZE ESTIMATES & FORECAST, BY COMPONENT, 2019-2035
    233. (USD Billions)
    234. Canada Market SIZE ESTIMATES & FORECAST,
    235. BY REGIONAL, 2019-2035 (USD Billions)
    236. Europe
    237. Market SIZE ESTIMATES & FORECAST, BY APPLICATION, 2019-2035 (USD Billions)
    238. Europe Market SIZE ESTIMATES & FORECAST, BY NETWORK PROTOCOL,
    239. 2035 (USD Billions)
    240. Europe Market
    241. SIZE ESTIMATES & FORECAST, BY END USE, 2019-2035 (USD Billions)
    242. Europe
    243. Market SIZE ESTIMATES & FORECAST, BY COMPONENT, 2019-2035 (USD Billions)
    244. Europe Market SIZE ESTIMATES & FORECAST, BY REGIONAL, 2019-2035
    245. (USD Billions)
    246. Germany Market SIZE ESTIMATES & FORECAST,
    247. BY APPLICATION, 2019-2035 (USD Billions)
    248. Germany
    249. Market SIZE ESTIMATES & FORECAST, BY NETWORK PROTOCOL, 2019-2035 (USD Billions)
    250. Germany Market SIZE ESTIMATES & FORECAST, BY END USE, 2019-2035
    251. (USD Billions)
    252. Germany Market SIZE ESTIMATES & FORECAST,
    253. BY COMPONENT, 2019-2035 (USD Billions)
    254. Germany
    255. Market SIZE ESTIMATES & FORECAST, BY REGIONAL, 2019-2035 (USD Billions)
    256. UK Market SIZE ESTIMATES & FORECAST, BY APPLICATION, 2019-2035
    257. (USD Billions)
    258. UK Market SIZE ESTIMATES & FORECAST, BY
    259. NETWORK PROTOCOL, 2019-2035 (USD Billions)
    260. UK
    261. Market SIZE ESTIMATES & FORECAST, BY END USE, 2019-2035 (USD Billions)
    262. UK Market SIZE ESTIMATES & FORECAST, BY COMPONENT, 2019-2035
    263. (USD Billions)
    264. UK Market SIZE ESTIMATES & FORECAST, BY
    265. REGIONAL, 2019-2035 (USD Billions)
    266. France
    267. Market SIZE ESTIMATES & FORECAST, BY APPLICATION, 2019-2035 (USD Billions)
    268. France Market SIZE ESTIMATES & FORECAST, BY NETWORK PROTOCOL,
    269. 2035 (USD Billions)
    270. France Market
    271. SIZE ESTIMATES & FORECAST, BY END USE, 2019-2035 (USD Billions)
    272. France
    273. Market SIZE ESTIMATES & FORECAST, BY COMPONENT, 2019-2035 (USD Billions)
    274. France Market SIZE ESTIMATES & FORECAST, BY REGIONAL, 2019-2035
    275. (USD Billions)
    276. Russia Market SIZE ESTIMATES & FORECAST,
    277. BY APPLICATION, 2019-2035 (USD Billions)
    278. Russia
    279. Market SIZE ESTIMATES & FORECAST, BY NETWORK PROTOCOL, 2019-2035 (USD Billions)
    280. Russia Market SIZE ESTIMATES & FORECAST, BY END USE, 2019-2035
    281. (USD Billions)
    282. Russia Market SIZE ESTIMATES & FORECAST,
    283. BY COMPONENT, 2019-2035 (USD Billions)
    284. Russia
    285. Market SIZE ESTIMATES & FORECAST, BY REGIONAL, 2019-2035 (USD Billions)
    286. Italy Market SIZE ESTIMATES & FORECAST, BY APPLICATION, 2019-2035
    287. (USD Billions)
    288. Italy Market SIZE ESTIMATES & FORECAST,
    289. BY NETWORK PROTOCOL, 2019-2035 (USD Billions)
    290. Italy
    291. Market SIZE ESTIMATES & FORECAST, BY END USE, 2019-2035 (USD Billions)
    292. Italy Market SIZE ESTIMATES & FORECAST, BY COMPONENT, 2019-2035
    293. (USD Billions)
    294. Italy Market SIZE ESTIMATES & FORECAST,
    295. BY REGIONAL, 2019-2035 (USD Billions)
    296. Spain
    297. Market SIZE ESTIMATES & FORECAST, BY APPLICATION, 2019-2035 (USD Billions)
    298. Spain Market SIZE ESTIMATES & FORECAST, BY NETWORK PROTOCOL,
    299. 2035 (USD Billions)
    300. Spain Market
    301. SIZE ESTIMATES & FORECAST, BY END USE, 2019-2035 (USD Billions)
    302. Spain
    303. Market SIZE ESTIMATES & FORECAST, BY COMPONENT, 2019-2035 (USD Billions)
    304. Spain Market SIZE ESTIMATES & FORECAST, BY REGIONAL, 2019-2035
    305. (USD Billions)
    306. Rest of Europe Market SIZE ESTIMATES &
    307. FORECAST, BY APPLICATION, 2019-2035 (USD Billions)
    308. Rest
    309. of Europe Market SIZE ESTIMATES & FORECAST, BY NETWORK PROTOCOL, 2019-2035 (USD
    310. Billions)
    311. Rest of Europe Market SIZE ESTIMATES &
    312. FORECAST, BY END USE, 2019-2035 (USD Billions)
    313. Rest
    314. of Europe Market SIZE ESTIMATES & FORECAST, BY COMPONENT, 2019-2035 (USD Billions)
    315. Rest of Europe Market SIZE ESTIMATES & FORECAST, BY REGIONAL,
    316. 2035 (USD Billions)
    317. APAC Market
    318. SIZE ESTIMATES & FORECAST, BY APPLICATION, 2019-2035 (USD Billions)
    319. APAC
    320. Market SIZE ESTIMATES & FORECAST, BY NETWORK PROTOCOL, 2019-2035 (USD Billions)
    321. APAC Market SIZE ESTIMATES & FORECAST, BY END USE, 2019-2035
    322. (USD Billions)
    323. APAC Market SIZE ESTIMATES & FORECAST,
    324. BY COMPONENT, 2019-2035 (USD Billions)
    325. APAC
    326. Market SIZE ESTIMATES & FORECAST, BY REGIONAL, 2019-2035 (USD Billions)
    327. China Market SIZE ESTIMATES & FORECAST, BY APPLICATION, 2019-2035
    328. (USD Billions)
    329. China Market SIZE ESTIMATES & FORECAST,
    330. BY NETWORK PROTOCOL, 2019-2035 (USD Billions)
    331. China
    332. Market SIZE ESTIMATES & FORECAST, BY END USE, 2019-2035 (USD Billions)
    333. China Market SIZE ESTIMATES & FORECAST, BY COMPONENT, 2019-2035
    334. (USD Billions)
    335. China Market SIZE ESTIMATES & FORECAST,
    336. BY REGIONAL, 2019-2035 (USD Billions)
    337. India
    338. Market SIZE ESTIMATES & FORECAST, BY APPLICATION, 2019-2035 (USD Billions)
    339. India Market SIZE ESTIMATES & FORECAST, BY NETWORK PROTOCOL,
    340. 2035 (USD Billions)
    341. India Market
    342. SIZE ESTIMATES & FORECAST, BY END USE, 2019-2035 (USD Billions)
    343. India
    344. Market SIZE ESTIMATES & FORECAST, BY COMPONENT, 2019-2035 (USD Billions)
    345. India Market SIZE ESTIMATES & FORECAST, BY REGIONAL, 2019-2035
    346. (USD Billions)
    347. Japan Market SIZE ESTIMATES & FORECAST,
    348. BY APPLICATION, 2019-2035 (USD Billions)
    349. Japan
    350. Market SIZE ESTIMATES & FORECAST, BY NETWORK PROTOCOL, 2019-2035 (USD Billions)
    351. Japan Market SIZE ESTIMATES & FORECAST, BY END USE, 2019-2035
    352. (USD Billions)
    353. Japan Market SIZE ESTIMATES & FORECAST,
    354. BY COMPONENT, 2019-2035 (USD Billions)
    355. Japan
    356. Market SIZE ESTIMATES & FORECAST, BY REGIONAL, 2019-2035 (USD Billions)
    357. South Korea Market SIZE ESTIMATES & FORECAST, BY APPLICATION,
    358. 2035 (USD Billions)
    359. South Korea
    360. Market SIZE ESTIMATES & FORECAST, BY NETWORK PROTOCOL, 2019-2035 (USD Billions)
    361. South Korea Market SIZE ESTIMATES & FORECAST, BY END USE, 2019-2035
    362. (USD Billions)
    363. South Korea Market SIZE ESTIMATES & FORECAST,
    364. BY COMPONENT, 2019-2035 (USD Billions)
    365. South
    366. Korea Market SIZE ESTIMATES & FORECAST, BY REGIONAL, 2019-2035 (USD Billions)
    367. Malaysia Market SIZE ESTIMATES & FORECAST, BY APPLICATION, 2019-2035
    368. (USD Billions)
    369. Malaysia Market SIZE ESTIMATES & FORECAST,
    370. BY NETWORK PROTOCOL, 2019-2035 (USD Billions)
    371. Malaysia
    372. Market SIZE ESTIMATES & FORECAST, BY END USE, 2019-2035 (USD Billions)
    373. Malaysia Market SIZE ESTIMATES & FORECAST, BY COMPONENT, 2019-2035
    374. (USD Billions)
    375. Malaysia Market SIZE ESTIMATES & FORECAST,
    376. BY REGIONAL, 2019-2035 (USD Billions)
    377. Thailand
    378. Market SIZE ESTIMATES & FORECAST, BY APPLICATION, 2019-2035 (USD Billions)
    379. Thailand Market SIZE ESTIMATES & FORECAST, BY NETWORK PROTOCOL,
    380. 2035 (USD Billions)
    381. Thailand
    382. Market SIZE ESTIMATES & FORECAST, BY END USE, 2019-2035 (USD Billions)
    383. Thailand Market SIZE ESTIMATES & FORECAST, BY COMPONENT, 2019-2035
    384. (USD Billions)
    385. Thailand Market SIZE ESTIMATES & FORECAST,
    386. BY REGIONAL, 2019-2035 (USD Billions)
    387. Indonesia
    388. Market SIZE ESTIMATES & FORECAST, BY APPLICATION, 2019-2035 (USD Billions)
    389. Indonesia Market SIZE ESTIMATES & FORECAST, BY NETWORK PROTOCOL,
    390. 2035 (USD Billions)
    391. Indonesia
    392. Market SIZE ESTIMATES & FORECAST, BY END USE, 2019-2035 (USD Billions)
    393. Indonesia Market SIZE ESTIMATES & FORECAST, BY COMPONENT, 2019-2035
    394. (USD Billions)
    395. Indonesia Market SIZE ESTIMATES & FORECAST,
    396. BY REGIONAL, 2019-2035 (USD Billions)
    397. Rest
    398. of APAC Market SIZE ESTIMATES & FORECAST, BY APPLICATION, 2019-2035 (USD Billions)
    399. Rest of APAC Market SIZE ESTIMATES & FORECAST, BY NETWORK PROTOCOL,
    400. 2035 (USD Billions)
    401. Rest of APAC
    402. Market SIZE ESTIMATES & FORECAST, BY END USE, 2019-2035 (USD Billions)
    403. Rest of APAC Market SIZE ESTIMATES & FORECAST, BY COMPONENT,
    404. 2035 (USD Billions)
    405. Rest of APAC
    406. Market SIZE ESTIMATES & FORECAST, BY REGIONAL, 2019-2035 (USD Billions)
    407. South America Market SIZE ESTIMATES & FORECAST, BY APPLICATION,
    408. 2035 (USD Billions)
    409. South America
    410. Market SIZE ESTIMATES & FORECAST, BY NETWORK PROTOCOL, 2019-2035 (USD Billions)
    411. South America Market SIZE ESTIMATES & FORECAST, BY END USE,
    412. 2035 (USD Billions)
    413. South America
    414. Market SIZE ESTIMATES & FORECAST, BY COMPONENT, 2019-2035 (USD Billions)
    415. South America Market SIZE ESTIMATES & FORECAST, BY REGIONAL,
    416. 2035 (USD Billions)
    417. Brazil Market
    418. SIZE ESTIMATES & FORECAST, BY APPLICATION, 2019-2035 (USD Billions)
    419. Brazil
    420. Market SIZE ESTIMATES & FORECAST, BY NETWORK PROTOCOL, 2019-2035 (USD Billions)
    421. Brazil Market SIZE ESTIMATES & FORECAST, BY END USE, 2019-2035
    422. (USD Billions)
    423. Brazil Market SIZE ESTIMATES & FORECAST,
    424. BY COMPONENT, 2019-2035 (USD Billions)
    425. Brazil
    426. Market SIZE ESTIMATES & FORECAST, BY REGIONAL, 2019-2035 (USD Billions)
    427. Mexico Market SIZE ESTIMATES & FORECAST, BY APPLICATION, 2019-2035
    428. (USD Billions)
    429. Mexico Market SIZE ESTIMATES & FORECAST,
    430. BY NETWORK PROTOCOL, 2019-2035 (USD Billions)
    431. Mexico
    432. Market SIZE ESTIMATES & FORECAST, BY END USE, 2019-2035 (USD Billions)
    433. Mexico Market SIZE ESTIMATES & FORECAST, BY COMPONENT, 2019-2035
    434. (USD Billions)
    435. Mexico Market SIZE ESTIMATES & FORECAST,
    436. BY REGIONAL, 2019-2035 (USD Billions)
    437. Argentina
    438. Market SIZE ESTIMATES & FORECAST, BY APPLICATION, 2019-2035 (USD Billions)
    439. Argentina Market SIZE ESTIMATES & FORECAST, BY NETWORK PROTOCOL,
    440. 2035 (USD Billions)
    441. Argentina
    442. Market SIZE ESTIMATES & FORECAST, BY END USE, 2019-2035 (USD Billions)
    443. Argentina Market SIZE ESTIMATES & FORECAST, BY COMPONENT, 2019-2035
    444. (USD Billions)
    445. Argentina Market SIZE ESTIMATES & FORECAST,
    446. BY REGIONAL, 2019-2035 (USD Billions)
    447. Rest
    448. of South America Market SIZE ESTIMATES & FORECAST, BY APPLICATION, 2019-2035
    449. (USD Billions)
    450. Rest of South America Market SIZE ESTIMATES
    451. & FORECAST, BY NETWORK PROTOCOL, 2019-2035 (USD Billions)
    452. Rest
    453. of South America Market SIZE ESTIMATES & FORECAST, BY END USE, 2019-2035 (USD
    454. Billions)
    455. Rest of South America Market SIZE ESTIMATES
    456. & FORECAST, BY COMPONENT, 2019-2035 (USD Billions)
    457. Rest
    458. of South America Market SIZE ESTIMATES & FORECAST, BY REGIONAL, 2019-2035 (USD
    459. Billions)
    460. MEA Market SIZE ESTIMATES & FORECAST, BY
    461. APPLICATION, 2019-2035 (USD Billions)
    462. MEA
    463. Market SIZE ESTIMATES & FORECAST, BY NETWORK PROTOCOL, 2019-2035 (USD Billions)
    464. MEA Market SIZE ESTIMATES & FORECAST, BY END USE, 2019-2035
    465. (USD Billions)
    466. MEA Market SIZE ESTIMATES & FORECAST, BY
    467. COMPONENT, 2019-2035 (USD Billions)
    468. MEA
    469. Market SIZE ESTIMATES & FORECAST, BY REGIONAL, 2019-2035 (USD Billions)
    470. GCC Countries Market SIZE ESTIMATES & FORECAST, BY APPLICATION,
    471. 2035 (USD Billions)
    472. GCC Countries
    473. Market SIZE ESTIMATES & FORECAST, BY NETWORK PROTOCOL, 2019-2035 (USD Billions)
    474. GCC Countries Market SIZE ESTIMATES & FORECAST, BY END USE,
    475. 2035 (USD Billions)
    476. GCC Countries
    477. Market SIZE ESTIMATES & FORECAST, BY COMPONENT, 2019-2035 (USD Billions)
    478. GCC Countries Market SIZE ESTIMATES & FORECAST, BY REGIONAL,
    479. 2035 (USD Billions)
    480. South Africa
    481. Market SIZE ESTIMATES & FORECAST, BY APPLICATION, 2019-2035 (USD Billions)
    482. South Africa Market SIZE ESTIMATES & FORECAST, BY NETWORK PROTOCOL,
    483. 2035 (USD Billions)
    484. South Africa
    485. Market SIZE ESTIMATES & FORECAST, BY END USE, 2019-2035 (USD Billions)
    486. South Africa Market SIZE ESTIMATES & FORECAST, BY COMPONENT,
    487. 2035 (USD Billions)
    488. South Africa
    489. Market SIZE ESTIMATES & FORECAST, BY REGIONAL, 2019-2035 (USD Billions)
    490. Rest of MEA Market SIZE ESTIMATES & FORECAST, BY APPLICATION,
    491. 2035 (USD Billions)
    492. Rest of MEA
    493. Market SIZE ESTIMATES & FORECAST, BY NETWORK PROTOCOL, 2019-2035 (USD Billions)
    494. Rest of MEA Market SIZE ESTIMATES & FORECAST, BY END USE, 2019-2035
    495. (USD Billions)
    496. Rest of MEA Market SIZE ESTIMATES & FORECAST,
    497. BY COMPONENT, 2019-2035 (USD Billions)
    498. Rest
    499. of MEA Market SIZE ESTIMATES & FORECAST, BY REGIONAL, 2019-2035 (USD Billions)
    500. PRODUCT LAUNCH/PRODUCT DEVELOPMENT/APPROVAL
    501. ACQUISITION/PARTNERSHIP
    502. MARKET
    503. SYNOPSIS
    504. NORTH
    505. AMERICA MARKET ANALYSIS
    506. US MARKET ANALYSIS BY APPLICATION
    507. US MARKET ANALYSIS BY NETWORK PROTOCOL
    508. US MARKET ANALYSIS
    509. BY END USE
    510. US
    511. MARKET ANALYSIS BY COMPONENT
    512. US MARKET ANALYSIS BY REGIONAL
    513. CANADA MARKET ANALYSIS BY APPLICATION
    514. CANADA MARKET
    515. ANALYSIS BY NETWORK PROTOCOL
    516. CANADA MARKET ANALYSIS BY END USE
    517. CANADA MARKET ANALYSIS BY COMPONENT
    518. CANADA MARKET ANALYSIS BY REGIONAL
    519. EUROPE MARKET ANALYSIS
    520. GERMANY MARKET ANALYSIS BY APPLICATION
    521. GERMANY MARKET
    522. ANALYSIS BY NETWORK PROTOCOL
    523. GERMANY MARKET ANALYSIS BY END USE
    524. GERMANY MARKET ANALYSIS BY COMPONENT
    525. GERMANY MARKET
    526. ANALYSIS BY REGIONAL
    527. UK
    528. MARKET ANALYSIS BY APPLICATION
    529. UK MARKET ANALYSIS BY NETWORK PROTOCOL
    530. UK MARKET ANALYSIS BY END USE
    531. UK MARKET ANALYSIS BY COMPONENT
    532. UK MARKET ANALYSIS BY REGIONAL
    533. FRANCE MARKET ANALYSIS BY APPLICATION
    534. FRANCE MARKET
    535. ANALYSIS BY NETWORK PROTOCOL
    536. FRANCE MARKET ANALYSIS BY END USE
    537. FRANCE MARKET ANALYSIS BY COMPONENT
    538. FRANCE MARKET ANALYSIS BY REGIONAL
    539. RUSSIA MARKET ANALYSIS BY APPLICATION
    540. RUSSIA MARKET
    541. ANALYSIS BY NETWORK PROTOCOL
    542. RUSSIA MARKET ANALYSIS BY END USE
    543. RUSSIA MARKET ANALYSIS BY COMPONENT
    544. RUSSIA MARKET ANALYSIS BY REGIONAL
    545. ITALY MARKET ANALYSIS BY APPLICATION
    546. ITALY MARKET
    547. ANALYSIS BY NETWORK PROTOCOL
    548. ITALY MARKET ANALYSIS BY END USE
    549. ITALY MARKET ANALYSIS BY COMPONENT
    550. ITALY MARKET ANALYSIS BY REGIONAL
    551. SPAIN MARKET ANALYSIS BY APPLICATION
    552. SPAIN MARKET
    553. ANALYSIS BY NETWORK PROTOCOL
    554. SPAIN MARKET ANALYSIS BY END USE
    555. SPAIN MARKET ANALYSIS BY COMPONENT
    556. SPAIN MARKET ANALYSIS BY REGIONAL
    557. REST OF EUROPE MARKET ANALYSIS BY APPLICATION
    558. REST OF EUROPE
    559. MARKET ANALYSIS BY NETWORK PROTOCOL
    560. REST OF EUROPE MARKET ANALYSIS BY END USE
    561. REST OF EUROPE MARKET ANALYSIS BY COMPONENT
    562. REST OF EUROPE
    563. MARKET ANALYSIS BY REGIONAL
    564. APAC MARKET ANALYSIS
    565. CHINA MARKET ANALYSIS BY APPLICATION
    566. CHINA MARKET
    567. ANALYSIS BY NETWORK PROTOCOL
    568. CHINA MARKET ANALYSIS BY END USE
    569. CHINA MARKET ANALYSIS BY COMPONENT
    570. CHINA MARKET ANALYSIS BY REGIONAL
    571. INDIA MARKET ANALYSIS BY APPLICATION
    572. INDIA MARKET
    573. ANALYSIS BY NETWORK PROTOCOL
    574. INDIA MARKET ANALYSIS BY END USE
    575. INDIA MARKET ANALYSIS BY COMPONENT
    576. INDIA MARKET ANALYSIS BY REGIONAL
    577. JAPAN MARKET ANALYSIS BY APPLICATION
    578. JAPAN MARKET
    579. ANALYSIS BY NETWORK PROTOCOL
    580. JAPAN MARKET ANALYSIS BY END USE
    581. JAPAN MARKET ANALYSIS BY COMPONENT
    582. JAPAN MARKET ANALYSIS BY REGIONAL
    583. SOUTH KOREA MARKET ANALYSIS BY APPLICATION
    584. SOUTH KOREA MARKET
    585. ANALYSIS BY NETWORK PROTOCOL
    586. SOUTH KOREA MARKET ANALYSIS BY END USE
    587. SOUTH KOREA MARKET ANALYSIS BY COMPONENT
    588. SOUTH KOREA MARKET
    589. ANALYSIS BY REGIONAL
    590. MALAYSIA
    591. MARKET ANALYSIS BY APPLICATION
    592. MALAYSIA MARKET ANALYSIS BY NETWORK PROTOCOL
    593. MALAYSIA MARKET ANALYSIS BY END USE
    594. MALAYSIA MARKET ANALYSIS BY COMPONENT
    595. MALAYSIA MARKET
    596. ANALYSIS BY REGIONAL
    597. THAILAND
    598. MARKET ANALYSIS BY APPLICATION
    599. THAILAND MARKET ANALYSIS BY NETWORK PROTOCOL
    600. THAILAND MARKET ANALYSIS BY END USE
    601. THAILAND MARKET ANALYSIS BY COMPONENT
    602. THAILAND MARKET
    603. ANALYSIS BY REGIONAL
    604. INDONESIA
    605. MARKET ANALYSIS BY APPLICATION
    606. INDONESIA MARKET ANALYSIS BY NETWORK PROTOCOL
    607. INDONESIA MARKET ANALYSIS BY END USE
    608. INDONESIA MARKET
    609. ANALYSIS BY COMPONENT
    610. INDONESIA
    611. MARKET ANALYSIS BY REGIONAL
    612. REST OF APAC MARKET ANALYSIS BY APPLICATION
    613. REST OF APAC MARKET ANALYSIS BY NETWORK
    614. PROTOCOL
    615. REST
    616. OF APAC MARKET ANALYSIS BY END USE
    617. REST OF APAC MARKET ANALYSIS BY COMPONENT
    618. REST OF APAC MARKET ANALYSIS BY REGIONAL
    619. SOUTH AMERICA
    620. MARKET ANALYSIS
    621. BRAZIL
    622. MARKET ANALYSIS BY APPLICATION
    623. BRAZIL MARKET ANALYSIS BY NETWORK PROTOCOL
    624. BRAZIL MARKET ANALYSIS BY END USE
    625. BRAZIL MARKET ANALYSIS BY COMPONENT
    626. BRAZIL MARKET ANALYSIS BY REGIONAL
    627. MEXICO MARKET ANALYSIS BY APPLICATION
    628. MEXICO MARKET
    629. ANALYSIS BY NETWORK PROTOCOL
    630. MEXICO MARKET ANALYSIS BY END USE
    631. MEXICO MARKET ANALYSIS BY COMPONENT
    632. MEXICO MARKET ANALYSIS BY REGIONAL
    633. ARGENTINA MARKET ANALYSIS BY APPLICATION
    634. ARGENTINA MARKET
    635. ANALYSIS BY NETWORK PROTOCOL
    636. ARGENTINA MARKET ANALYSIS BY END USE
    637. ARGENTINA MARKET ANALYSIS BY COMPONENT
    638. ARGENTINA MARKET
    639. ANALYSIS BY REGIONAL
    640. REST
    641. OF SOUTH AMERICA MARKET ANALYSIS BY APPLICATION
    642. REST OF SOUTH AMERICA MARKET ANALYSIS
    643. BY NETWORK PROTOCOL
    644. REST
    645. OF SOUTH AMERICA MARKET ANALYSIS BY END USE
    646. REST OF SOUTH AMERICA MARKET ANALYSIS
    647. BY COMPONENT
    648. REST
    649. OF SOUTH AMERICA MARKET ANALYSIS BY REGIONAL
    650. MEA MARKET ANALYSIS
    651. GCC COUNTRIES MARKET ANALYSIS BY APPLICATION
    652. GCC COUNTRIES
    653. MARKET ANALYSIS BY NETWORK PROTOCOL
    654. GCC COUNTRIES MARKET ANALYSIS BY END USE
    655. GCC COUNTRIES MARKET ANALYSIS BY COMPONENT
    656. GCC COUNTRIES
    657. MARKET ANALYSIS BY REGIONAL
    658. SOUTH AFRICA MARKET ANALYSIS BY APPLICATION
    659. SOUTH AFRICA MARKET ANALYSIS BY NETWORK
    660. PROTOCOL
    661. SOUTH
    662. AFRICA MARKET ANALYSIS BY END USE
    663. SOUTH AFRICA MARKET ANALYSIS BY COMPONENT
    664. SOUTH AFRICA MARKET ANALYSIS BY REGIONAL
    665. REST OF MEA MARKET
    666. ANALYSIS BY APPLICATION
    667. REST OF MEA MARKET ANALYSIS BY NETWORK PROTOCOL
    668. REST OF MEA MARKET ANALYSIS BY END USE
    669. REST OF MEA MARKET
    670. ANALYSIS BY COMPONENT
    671. REST
    672. OF MEA MARKET ANALYSIS BY REGIONAL
    673. KEY BUYING CRITERIA OF Time Sensitive Networking Market
    674. RESEARCH PROCESS
    675. OF MRFR
    676. DRO
    677. ANALYSIS OF Time Sensitive Networking Market
    678. DRIVERS IMPACT ANALYSIS: Time Sensitive
    679. Networking Market
    680. RESTRAINTS
    681. IMPACT ANALYSIS: Time Sensitive Networking Market
    682. SUPPLY / VALUE CHAIN: Time Sensitive
    683. Networking Market
    684. Time
    685. Sensitive Networking Market, BY APPLICATION, 2025 (% SHARE)
    686. Time Sensitive Networking Market, BY
    687. APPLICATION, 2019 TO 2035 (USD Billions)
    688. Time Sensitive Networking Market, BY
    689. NETWORK PROTOCOL, 2025 (% SHARE)
    690. Time Sensitive Networking Market, BY NETWORK PROTOCOL,
    691. TO 2035 (USD Billions)
    692. Time Sensitive Networking Market, BY END USE, 2025 (%
    693. SHARE)
    694. Time
    695. Sensitive Networking Market, BY END USE, 2019 TO 2035 (USD Billions)
    696. Time Sensitive Networking Market, BY
    697. COMPONENT, 2025 (% SHARE)
    698. Time Sensitive Networking Market, BY COMPONENT, 2019
    699. TO 2035 (USD Billions)
    700. Time Sensitive Networking Market, BY REGIONAL, 2025
    701. (% SHARE)
    702. Time
    703. Sensitive Networking Market, BY REGIONAL, 2019 TO 2035 (USD Billions)
    704. BENCHMARKING OF MAJOR COMPETITORS

    Time Sensitive Networking Market Segmentation

    • Time Sensitive Networking Market By Application (USD Billion, 2019-2035)
      • Industrial Automation
      • Automotive
      • Aerospace
      • Smart Grids


    • Time Sensitive Networking Market By Network Protocol (USD Billion, 2019-2035)
      • IEEE 802.1Qbv
      • IEEE 802.1Qci
      • IEEE 1588


    • Time Sensitive Networking Market By End Use (USD Billion, 2019-2035)
      • Manufacturing
      • Transportation
      • Telecommunications


    • Time Sensitive Networking Market By Component (USD Billion, 2019-2035)
      • Switches
      • Routers
      • Software


    • Time Sensitive Networking Market By Regional (USD Billion, 2019-2035)
      • North America
      • Europe
      • South America
      • Asia Pacific
      • Middle East and Africa


    Time Sensitive Networking Market Regional Outlook (USD Billion, 2019-2035)


    • North America Outlook (USD Billion, 2019-2035)
      • North America Market by Application Type
        • Industrial Automation
        • Automotive
        • Aerospace
        • Smart Grids
      • North America Market by Network Protocol Type
        • IEEE 802.1Qbv
        • IEEE 802.1Qci
        • IEEE 1588
      • North America Market by End Use Type
        • Manufacturing
        • Transportation
        • Telecommunications
      • North America Market by Component Type
        • Switches
        • Routers
        • Software
      • North America Market by Regional Type
        • US
        • Canada
      • US Outlook (USD Billion, 2019-2035)
      • US Market by Application Type
        • Industrial Automation
        • Automotive
        • Aerospace
        • Smart Grids
      • US Market by Network Protocol Type
        • IEEE 802.1Qbv
        • IEEE 802.1Qci
        • IEEE 1588
      • US Market by End Use Type
        • Manufacturing
        • Transportation
        • Telecommunications
      • US Market by Component Type
        • Switches
        • Routers
        • Software
      • CANADA Outlook (USD Billion, 2019-2035)
      • CANADA Market by Application Type
        • Industrial Automation
        • Automotive
        • Aerospace
        • Smart Grids
      • CANADA Market by Network Protocol Type
        • IEEE 802.1Qbv
        • IEEE 802.1Qci
        • IEEE 1588
      • CANADA Market by End Use Type
        • Manufacturing
        • Transportation
        • Telecommunications
      • CANADA Market by Component Type
        • Switches
        • Routers
        • Software
      • Europe Outlook (USD Billion, 2019-2035)
        • Europe Market by Application Type
          • Industrial Automation
          • Automotive
          • Aerospace
          • Smart Grids
        • Europe Market by Network Protocol Type
          • IEEE 802.1Qbv
          • IEEE 802.1Qci
          • IEEE 1588
        • Europe Market by End Use Type
          • Manufacturing
          • Transportation
          • Telecommunications
        • Europe Market by Component Type
          • Switches
          • Routers
          • Software
        • Europe Market by Regional Type
          • Germany
          • UK
          • France
          • Russia
          • Italy
          • Spain
          • Rest of Europe
        • GERMANY Outlook (USD Billion, 2019-2035)
        • GERMANY Market by Application Type
          • Industrial Automation
          • Automotive
          • Aerospace
          • Smart Grids
        • GERMANY Market by Network Protocol Type
          • IEEE 802.1Qbv
          • IEEE 802.1Qci
          • IEEE 1588
        • GERMANY Market by End Use Type
          • Manufacturing
          • Transportation
          • Telecommunications
        • GERMANY Market by Component Type
          • Switches
          • Routers
          • Software
        • UK Outlook (USD Billion, 2019-2035)
        • UK Market by Application Type
          • Industrial Automation
          • Automotive
          • Aerospace
          • Smart Grids
        • UK Market by Network Protocol Type
          • IEEE 802.1Qbv
          • IEEE 802.1Qci
          • IEEE 1588
        • UK Market by End Use Type
          • Manufacturing
          • Transportation
          • Telecommunications
        • UK Market by Component Type
          • Switches
          • Routers
          • Software
        • FRANCE Outlook (USD Billion, 2019-2035)
        • FRANCE Market by Application Type
          • Industrial Automation
          • Automotive
          • Aerospace
          • Smart Grids
        • FRANCE Market by Network Protocol Type
          • IEEE 802.1Qbv
          • IEEE 802.1Qci
          • IEEE 1588
        • FRANCE Market by End Use Type
          • Manufacturing
          • Transportation
          • Telecommunications
        • FRANCE Market by Component Type
          • Switches
          • Routers
          • Software
        • RUSSIA Outlook (USD Billion, 2019-2035)
        • RUSSIA Market by Application Type
          • Industrial Automation
          • Automotive
          • Aerospace
          • Smart Grids
        • RUSSIA Market by Network Protocol Type
          • IEEE 802.1Qbv
          • IEEE 802.1Qci
          • IEEE 1588
        • RUSSIA Market by End Use Type
          • Manufacturing
          • Transportation
          • Telecommunications
        • RUSSIA Market by Component Type
          • Switches
          • Routers
          • Software
        • ITALY Outlook (USD Billion, 2019-2035)
        • ITALY Market by Application Type
          • Industrial Automation
          • Automotive
          • Aerospace
          • Smart Grids
        • ITALY Market by Network Protocol Type
          • IEEE 802.1Qbv
          • IEEE 802.1Qci
          • IEEE 1588
        • ITALY Market by End Use Type
          • Manufacturing
          • Transportation
          • Telecommunications
        • ITALY Market by Component Type
          • Switches
          • Routers
          • Software
        • SPAIN Outlook (USD Billion, 2019-2035)
        • SPAIN Market by Application Type
          • Industrial Automation
          • Automotive
          • Aerospace
          • Smart Grids
        • SPAIN Market by Network Protocol Type
          • IEEE 802.1Qbv
          • IEEE 802.1Qci
          • IEEE 1588
        • SPAIN Market by End Use Type
          • Manufacturing
          • Transportation
          • Telecommunications
        • SPAIN Market by Component Type
          • Switches
          • Routers
          • Software
        • REST OF EUROPE Outlook (USD Billion, 2019-2035)
        • REST OF EUROPE Market by Application Type
          • Industrial Automation
          • Automotive
          • Aerospace
          • Smart Grids
        • REST OF EUROPE Market by Network Protocol Type
          • IEEE 802.1Qbv
          • IEEE 802.1Qci
          • IEEE 1588
        • REST OF EUROPE Market by End Use Type
          • Manufacturing
          • Transportation
          • Telecommunications
        • REST OF EUROPE Market by Component Type
          • Switches
          • Routers
          • Software
        • APAC Outlook (USD Billion, 2019-2035)
          • APAC Market by Application Type
            • Industrial Automation
            • Automotive
            • Aerospace
            • Smart Grids
          • APAC Market by Network Protocol Type
            • IEEE 802.1Qbv
            • IEEE 802.1Qci
            • IEEE 1588
          • APAC Market by End Use Type
            • Manufacturing
            • Transportation
            • Telecommunications
          • APAC Market by Component Type
            • Switches
            • Routers
            • Software
          • APAC Market by Regional Type
            • China
            • India
            • Japan
            • South Korea
            • Malaysia
            • Thailand
            • Indonesia
            • Rest of APAC
          • CHINA Outlook (USD Billion, 2019-2035)
          • CHINA Market by Application Type
            • Industrial Automation
            • Automotive
            • Aerospace
            • Smart Grids
          • CHINA Market by Network Protocol Type
            • IEEE 802.1Qbv
            • IEEE 802.1Qci
            • IEEE 1588
          • CHINA Market by End Use Type
            • Manufacturing
            • Transportation
            • Telecommunications
          • CHINA Market by Component Type
            • Switches
            • Routers
            • Software
          • INDIA Outlook (USD Billion, 2019-2035)
          • INDIA Market by Application Type
            • Industrial Automation
            • Automotive
            • Aerospace
            • Smart Grids
          • INDIA Market by Network Protocol Type
            • IEEE 802.1Qbv
            • IEEE 802.1Qci
            • IEEE 1588
          • INDIA Market by End Use Type
            • Manufacturing
            • Transportation
            • Telecommunications
          • INDIA Market by Component Type
            • Switches
            • Routers
            • Software
          • JAPAN Outlook (USD Billion, 2019-2035)
          • JAPAN Market by Application Type
            • Industrial Automation
            • Automotive
            • Aerospace
            • Smart Grids
          • JAPAN Market by Network Protocol Type
            • IEEE 802.1Qbv
            • IEEE 802.1Qci
            • IEEE 1588
          • JAPAN Market by End Use Type
            • Manufacturing
            • Transportation
            • Telecommunications
          • JAPAN Market by Component Type
            • Switches
            • Routers
            • Software
          • SOUTH KOREA Outlook (USD Billion, 2019-2035)
          • SOUTH KOREA Market by Application Type
            • Industrial Automation
            • Automotive
            • Aerospace
            • Smart Grids
          • SOUTH KOREA Market by Network Protocol Type
            • IEEE 802.1Qbv
            • IEEE 802.1Qci
            • IEEE 1588
          • SOUTH KOREA Market by End Use Type
            • Manufacturing
            • Transportation
            • Telecommunications
          • SOUTH KOREA Market by Component Type
            • Switches
            • Routers
            • Software
          • MALAYSIA Outlook (USD Billion, 2019-2035)
          • MALAYSIA Market by Application Type
            • Industrial Automation
            • Automotive
            • Aerospace
            • Smart Grids
          • MALAYSIA Market by Network Protocol Type
            • IEEE 802.1Qbv
            • IEEE 802.1Qci
            • IEEE 1588
          • MALAYSIA Market by End Use Type
            • Manufacturing
            • Transportation
            • Telecommunications
          • MALAYSIA Market by Component Type
            • Switches
            • Routers
            • Software
          • THAILAND Outlook (USD Billion, 2019-2035)
          • THAILAND Market by Application Type
            • Industrial Automation
            • Automotive
            • Aerospace
            • Smart Grids
          • THAILAND Market by Network Protocol Type
            • IEEE 802.1Qbv
            • IEEE 802.1Qci
            • IEEE 1588
          • THAILAND Market by End Use Type
            • Manufacturing
            • Transportation
            • Telecommunications
          • THAILAND Market by Component Type
            • Switches
            • Routers
            • Software
          • INDONESIA Outlook (USD Billion, 2019-2035)
          • INDONESIA Market by Application Type
            • Industrial Automation
            • Automotive
            • Aerospace
            • Smart Grids
          • INDONESIA Market by Network Protocol Type
            • IEEE 802.1Qbv
            • IEEE 802.1Qci
            • IEEE 1588
          • INDONESIA Market by End Use Type
            • Manufacturing
            • Transportation
            • Telecommunications
          • INDONESIA Market by Component Type
            • Switches
            • Routers
            • Software
          • REST OF APAC Outlook (USD Billion, 2019-2035)
          • REST OF APAC Market by Application Type
            • Industrial Automation
            • Automotive
            • Aerospace
            • Smart Grids
          • REST OF APAC Market by Network Protocol Type
            • IEEE 802.1Qbv
            • IEEE 802.1Qci
            • IEEE 1588
          • REST OF APAC Market by End Use Type
            • Manufacturing
            • Transportation
            • Telecommunications
          • REST OF APAC Market by Component Type
            • Switches
            • Routers
            • Software
          • South America Outlook (USD Billion, 2019-2035)
            • South America Market by Application Type
              • Industrial Automation
              • Automotive
              • Aerospace
              • Smart Grids
            • South America Market by Network Protocol Type
              • IEEE 802.1Qbv
              • IEEE 802.1Qci
              • IEEE 1588
            • South America Market by End Use Type
              • Manufacturing
              • Transportation
              • Telecommunications
            • South America Market by Component Type
              • Switches
              • Routers
              • Software
            • South America Market by Regional Type
              • Brazil
              • Mexico
              • Argentina
              • Rest of South America
            • BRAZIL Outlook (USD Billion, 2019-2035)
            • BRAZIL Market by Application Type
              • Industrial Automation
              • Automotive
              • Aerospace
              • Smart Grids
            • BRAZIL Market by Network Protocol Type
              • IEEE 802.1Qbv
              • IEEE 802.1Qci
              • IEEE 1588
            • BRAZIL Market by End Use Type
              • Manufacturing
              • Transportation
              • Telecommunications
            • BRAZIL Market by Component Type
              • Switches
              • Routers
              • Software
            • MEXICO Outlook (USD Billion, 2019-2035)
            • MEXICO Market by Application Type
              • Industrial Automation
              • Automotive
              • Aerospace
              • Smart Grids
            • MEXICO Market by Network Protocol Type
              • IEEE 802.1Qbv
              • IEEE 802.1Qci
              • IEEE 1588
            • MEXICO Market by End Use Type
              • Manufacturing
              • Transportation
              • Telecommunications
            • MEXICO Market by Component Type
              • Switches
              • Routers
              • Software
            • ARGENTINA Outlook (USD Billion, 2019-2035)
            • ARGENTINA Market by Application Type
              • Industrial Automation
              • Automotive
              • Aerospace
              • Smart Grids
            • ARGENTINA Market by Network Protocol Type
              • IEEE 802.1Qbv
              • IEEE 802.1Qci
              • IEEE 1588
            • ARGENTINA Market by End Use Type
              • Manufacturing
              • Transportation
              • Telecommunications
            • ARGENTINA Market by Component Type
              • Switches
              • Routers
              • Software
            • REST OF SOUTH AMERICA Outlook (USD Billion, 2019-2035)
            • REST OF SOUTH AMERICA Market by Application Type
              • Industrial Automation
              • Automotive
              • Aerospace
              • Smart Grids
            • REST OF SOUTH AMERICA Market by Network Protocol Type
              • IEEE 802.1Qbv
              • IEEE 802.1Qci
              • IEEE 1588
            • REST OF SOUTH AMERICA Market by End Use Type
              • Manufacturing
              • Transportation
              • Telecommunications
            • REST OF SOUTH AMERICA Market by Component Type
              • Switches
              • Routers
              • Software
            • MEA Outlook (USD Billion, 2019-2035)
              • MEA Market by Application Type
                • Industrial Automation
                • Automotive
                • Aerospace
                • Smart Grids
              • MEA Market by Network Protocol Type
                • IEEE 802.1Qbv
                • IEEE 802.1Qci
                • IEEE 1588
              • MEA Market by End Use Type
                • Manufacturing
                • Transportation
                • Telecommunications
              • MEA Market by Component Type
                • Switches
                • Routers
                • Software
              • MEA Market by Regional Type
                • GCC Countries
                • South Africa
                • Rest of MEA
              • GCC COUNTRIES Outlook (USD Billion, 2019-2035)
              • GCC COUNTRIES Market by Application Type
                • Industrial Automation
                • Automotive
                • Aerospace
                • Smart Grids
              • GCC COUNTRIES Market by Network Protocol Type
                • IEEE 802.1Qbv
                • IEEE 802.1Qci
                • IEEE 1588
              • GCC COUNTRIES Market by End Use Type
                • Manufacturing
                • Transportation
                • Telecommunications
              • GCC COUNTRIES Market by Component Type
                • Switches
                • Routers
                • Software
              • SOUTH AFRICA Outlook (USD Billion, 2019-2035)
              • SOUTH AFRICA Market by Application Type
                • Industrial Automation
                • Automotive
                • Aerospace
                • Smart Grids
              • SOUTH AFRICA Market by Network Protocol Type
                • IEEE 802.1Qbv
                • IEEE 802.1Qci
                • IEEE 1588
              • SOUTH AFRICA Market by End Use Type
                • Manufacturing
                • Transportation
                • Telecommunications
              • SOUTH AFRICA Market by Component Type
                • Switches
                • Routers
                • Software
              • REST OF MEA Outlook (USD Billion, 2019-2035)
              • REST OF MEA Market by Application Type
                • Industrial Automation
                • Automotive
                • Aerospace
                • Smart Grids
              • REST OF MEA Market by Network Protocol Type
                • IEEE 802.1Qbv
                • IEEE 802.1Qci
                • IEEE 1588
              • REST OF MEA Market by End Use Type
                • Manufacturing
                • Transportation
                • Telecommunications
              • REST OF MEA Market by Component Type
                • Switches
                • Routers
                • Software
    Time Sensitive Networking Market Research Report — Global Forecast till 2035 Infographic
    Free Sample Request

    Kindly complete the form below to receive a free sample of this Report

    Customer Strories

    “I am very pleased with how market segments have been defined in a relevant way for my purposes (such as "Portable Freezers & refrigerators" and "last-mile"). In general the report is well structured. Thanks very much for your efforts.”

    Victoria Milne Founder
    Case Study

    Chemicals and Materials