Rising Industrial Production
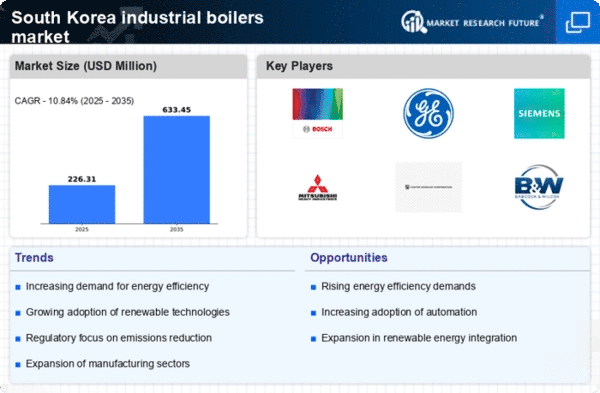
The industrial boilers market in South Korea is significantly influenced by the rising industrial production across various sectors, including manufacturing, food processing, and chemicals. As of 2025, the manufacturing sector alone contributes approximately 30% to the national GDP, indicating robust industrial activity. This growth necessitates efficient steam and heating solutions, which industrial boilers provide. The increasing demand for high-capacity boilers to support production processes is likely to propel market expansion. Furthermore, the trend towards automation and modernization in industries further amplifies the need for advanced boiler systems, making this a pivotal driver in the industrial boilers market.
Increased Focus on Energy Costs
The industrial boilers market in South Korea is increasingly driven by the rising focus on energy costs among industries. With energy prices fluctuating, companies are seeking ways to optimize their energy consumption and reduce operational expenses. As of 2025, energy costs account for a significant portion of manufacturing expenses, prompting industries to invest in more efficient boiler systems. The adoption of high-efficiency boilers can lead to substantial savings, potentially reducing energy costs by up to 20%. This financial incentive is likely to drive demand for advanced boiler technologies, making energy cost management a vital driver in the industrial boilers market.
Regulatory Compliance and Standards
The industrial boilers market in South Korea is experiencing a surge in demand due to stringent regulatory compliance and standards imposed by the government. These regulations aim to reduce emissions and enhance energy efficiency, compelling industries to upgrade their existing boiler systems. As of 2025, the South Korean government has set ambitious targets to cut greenhouse gas emissions by 37% by 2030, which directly influences the industrial boilers market. Companies are increasingly investing in advanced boiler technologies that meet these regulations, thereby driving market growth. The need for compliance not only ensures environmental sustainability but also enhances operational efficiency, making it a critical driver in the industrial boilers market.
Growth in Renewable Energy Initiatives
The industrial boilers market in South Korea is witnessing growth due to the increasing emphasis on renewable energy initiatives. The government has set ambitious goals to increase the share of renewable energy in the national energy mix to 20% by 2030. This shift encourages industries to adopt boilers that can utilize renewable energy sources, such as biomass and solar thermal energy. As of 2025, the integration of renewable energy into industrial processes is becoming more prevalent, driving the demand for innovative boiler solutions. This trend not only supports sustainability efforts but also positions the industrial boilers market for significant growth in the coming years.
Technological Advancements in Boiler Design
Technological advancements in boiler design are playing a crucial role in shaping the industrial boilers market in South Korea. Innovations such as modular boiler systems and enhanced combustion technologies are being adopted to improve efficiency and reduce emissions. As of 2025, the market is witnessing a shift towards boilers that utilize alternative fuels, including biomass and waste heat recovery systems. These advancements not only optimize performance but also align with the country's sustainability goals. The integration of smart monitoring systems further enhances operational efficiency, indicating a strong potential for growth in the industrial boilers market driven by technological progress.


