• Cat-intel
  • MedIntelliX
  • Resources
  • About Us
  • Request Free Sample ×

    Kindly complete the form below to receive a free sample of this Report

    Leading companies partner with us for data-driven Insights

    clients tt-cursor

    Shared Mobility Market

    ID: MRFR/AM/10879-HCR
    128 Pages
    Aarti Dhapte
    September 2025

    Shared Mobility Market Research Report Information By Service Type (Bike Sharing, Car Sharing, Ride-Hailing, Public Transit and Micro transit), By Vehicle Type (Two-Wheelers, Passenger Cars, Buses and Rails, and Others), By Distribution Channel (Offline and Online) And By Region (North America, Europe, Asia-Pacific, And Rest Of The World) –Market Forecast Till 2034

    Share:
    Download PDF ×

    We do not share your information with anyone. However, we may send you emails based on your report interest from time to time. You may contact us at any time to opt-out.

    Shared Mobility Market Research Report – Forecast till 2034 Infographic
    Purchase Options
    $ 4,950.0
    $ 5,950.0
    $ 7,250.0
    Table of Contents

    Shared Mobility Market Summary

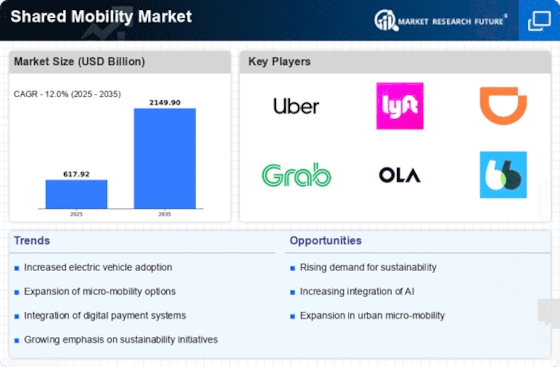
    As per Market Research Future Analysis, the Global Shared Mobility Market is projected to grow significantly, driven by urbanization, environmental sustainability, and demand for eco-friendly transport solutions. The market size was estimated at 617.92 USD Billion in 2024 and is expected to reach 1,919.52 USD Billion by 2034, with a CAGR of approximately 12.20% from 2025 to 2034. Ride-hailing services dominate the market, while bike-sharing is anticipated to grow the fastest. North America leads the market, followed by Europe and Asia-Pacific, with significant growth expected in urban areas.

    Key Market Trends & Highlights

    Key trends driving the Shared Mobility Market include urbanization, technological advancements, and changing consumer preferences.

    • Shared Mobility Market Size in 2024: 617.92 USD Billion.
    • Projected Market Size by 2034: 1,919.52 USD Billion.
    • CAGR from 2025 to 2034: 12.20%.
    • North America holds the largest market share due to urbanization and sustainability efforts.

    Market Size & Forecast

    2024 Market Size USD 617.92 Billion
    2034 Market Size USD 1,919.52 Billion
    CAGR (2025-2034) 12.20%

    Major Players

    Key players include Uber Technologies Inc, Lyft, Didi Chuxing Technology Co., BlaBlaCar, Free2move, and others, focusing on R&D and strategic partnerships.

    Shared Mobility Market Trends

    Growing urbanization and congestion in cities worldwide population is driving market growth

    Market CAGR for shared mobility is being driven by the rising urbanization and congestion in cities worldwide. As more people move to urban areas, there is a growing need for efficient and sustainable transportation solutions. Shared mobility services, including ridesharing, carpooling, bike-sharing, and scooter-sharing, address this need by providing convenient and cost-effective alternatives to traditional car ownership. The global trend toward urbanization is undeniable, with more people residing in cities and metropolitan areas.

    As urban populations swell, so does the demand for transportation options that can alleviate traffic congestion, reduce pollution, and make efficient use of limited urban space. Shared mobility services, which maximize vehicle utilization by enabling multiple users to share rides, help address these urban challenges. Many cities around the world grapple with severe traffic congestion, leading to longer commutes, increased air pollution, and productivity losses. Shared mobility services, particularly ridesharing and carpooling, offer a means to reduce the number of single-occupancy vehicles on the road.

    By encouraging carpooling and shared rides, these services can help ease congestion and decrease the overall number of vehicles in urban areas. With growing awareness of environmental issues and climate change, there is a heightened focus on reducing greenhouse gas emissions and air pollution. Shared mobility services often provide access to cleaner and more fuel-efficient vehicles, such as electric cars and bicycles, promoting eco-friendly transportation choices and contributing to sustainability goals.

    Urban dwellers increasingly recognize the financial burden of car ownership, including expenses related to purchasing, maintaining, and parking a vehicle. Shared mobility services offer a cost-effective alternative, allowing individuals to pay only for the transportation they use without the long-term commitments and expenses associated with owning a car. Advances in technology, particularly the widespread availability of smartphones and mobile applications, have made it easier than ever for people to access and use shared mobility services. Users can quickly locate, book, and pay for rides through user-friendly apps, making Shared rides a convenient option for urban residents.

    Many governments and municipalities are actively promoting as part of their urban transportation strategies. They may offer incentives, establish dedicated lanes, or enact regulations that encourage or require ridesharing, bike-sharing, or other Shared rides solutions to address urban challenges.

    Consumer preferences are evolving, with many people showing a willingness to embrace alternatives to car ownership. Car-sharing aligns with these changing preferences, offering flexible and on-demand transportation solutions that cater to the needs of modern urban lifestyles. Thus driving the Shared Mobility market revenue.

    The ongoing evolution of urban transportation systems appears to be increasingly influenced by shared mobility solutions, which may enhance accessibility and reduce congestion in metropolitan areas.

    U.S. Department of Transportation

    Shared Mobility Market Drivers

    Rising Urbanization

    The Global Shared Mobility Market Industry is experiencing a surge in demand due to increasing urbanization. As more people migrate to urban areas, the need for efficient transportation solutions becomes paramount. In 2024, the market is valued at 617.9 USD Billion, reflecting the growing reliance on shared mobility services to alleviate congestion and reduce travel costs. Urban centers are adopting shared mobility solutions, such as car-sharing and ride-hailing, to enhance accessibility and sustainability. This trend is likely to continue, as urban populations are projected to rise, further driving the expansion of shared mobility options.

    Market Segment Insights

    Shared Mobility Service Type Insights

    The Shared Mobility Market segmentation, based on service type, includes Bike Sharing, Car Sharing, Ride-Hailing, Public Transit and Micro transit. The ride-hailing segment dominates the market, accounting for the largest market revenue due to its convenience, affordability, and widespread accessibility. By leveraging smartphone apps, passengers can easily request rides, making it a hassle-free alternative to owning a car. Additionally, ride-hailing companies often offer a variety of vehicle options, including eco-friendly choices, and have expanded their services to include carpooling and shared rides, further promoting cost-effective and environmentally friendly transportation solutions.

    This combination of convenience, affordability, and sustainability has propelled ride-hailing services to the forefront of the shared mobility market. Further, the bike-sharing segment is anticipated to attain the fastest growth throughout the forecast period.

    Shared Mobility Vehicle Type Insights

    The Shared Mobility Market segmentation, based on vehicle type, includes Two-Wheelers, Passenger Cars, Buses and Rails, and Others. The passenger cars category dominates the market due to their versatility and widespread availability, offering convenient and comfortable transportation options for a wide range of users. They cater to diverse needs, from daily commutes and urban ridesharing to longer-distance travel. Moreover, advancements in app-based ridesharing platforms have made it easier for passengers to access and book shared car services, further solidifying the dominance of passenger cars in the shared mobility market. Further, the two-wheelers segment is the fastest-growing segment.

    Shared Mobility Distribution Channel Insights

    The Shared Mobility Market segmentation, based on distribution channels, includes Offline and Online. The online category dominates the market. The rise of mobile applications and digital platforms has revolutionized the way people access Car-sharing services such as ridesharing, bike sharing, and scooter sharing. Users can easily locate, book, and pay for Car-sharing options through smartphone apps, making online distribution channels the primary method for accessing these services, while traditional offline methods like walk-up rentals or telephone bookings have become less common.

    Source: The Secondary Research, Primary Research, Market Research Future Database and Analyst Review

    Get more detailed insights about Shared Mobility Market Research Report – Forecast till 2034

    Regional Insights

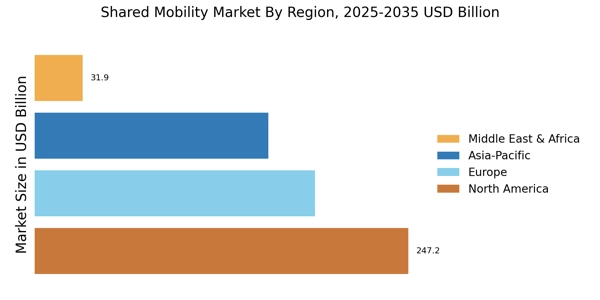
    By region, the study gives market insights into the North America, Europe, Asia-Pacific and the Rest of the World. The North American Shared Mobility market area dominates this market, owing to the increasing focus on urbanization and sustainability, with many cities aiming to reduce traffic congestion and environmental impact. Additionally, the presence of well-established ride-sharing and car-sharing platforms, coupled with changing consumer preferences towards more flexible and cost-effective transportation options, fuels the growth of Car-sharing services in the region.

    Further, the main countries studied in the market report are The US, Canada, Germany, France, the UK, Italy, Spain, Japan, China, India, Australia, South Korea, and Brazil.

    Figure 2: Shared Mobility Market Share By Region 2023 (USD Billion)

    Shared Mobility Market Share By Region 2023

    Source: The Secondary Research, Primary Research, Market Research Future Database and Analyst Review

    Europe's Shared Mobility market accounts for the second-largest market share due to a strong emphasis on environmental sustainability, strict emissions regulations, and the increasing adoption of urban mobility policies that encourage the use of eco-friendly and shared transportation options. Further, the German Shared Mobility market held the largest market share, and the UK Shared Mobility market was the fastest-growing market in European region.

    The Asia-Pacific Shared Mobility Market is expected to grow at the rapid CAGR from 2025 to 2034. This is due to the rapid urbanization, densely populated cities, and increasing demand for convenient and cost-effective transportation solutions in the region. Moreover, China’s Shared Mobility market held the largest market share, and the Indian Shared Mobility market was the fastest-growing market in Asia-Pacific region.

    Key Players and Competitive Insights

    Leading market players are investing heavily in the research and development in order to expand their product lines, which will help the Shared Mobility market grow even more. Market players are also undertaking a variety of strategic activities to spread their global footprint, with important market developments including contractual agreements, new product launches, mergers and acquisitions, higher investments, and collaboration with other organizations. To spread and survive in a more competitive and rising market climate, the Car-sharing industry must offer cost-effective items.

    Manufacturing locally to minimize the operational costs is one of the key business tactics used by the manufacturers in the global Car-sharing industry to benefit the clients and increase the market sector. In recent years, the Car-sharing industry has offered some of the most significant advantages to the automotive industry. Major players in the Shared Mobility market, including Blu-Smart Mobility Pvt. Ltd., Bolt Technology OÜ, Autocrypt Co., Ltd., Cabify Espaa S.L.U., EasyMile SAS, Meru Mobility Tech Pvt.

    Ltd., ANI Technologies Private Limited (Ola), Zoomcar India Private Limited, Getaround, Inc., Free2move, BlaBlaCar, Lyft, Inc., Didi Chuxing Technology Co., Yandex LLC, Uber Technologies Inc, and others, are trying to increase market demand by investing in research and development operations.

    Free2Move is a mobility services company operated by Stellantis (formerly known as Groupe PSA), one of the world's largest automotive manufacturers. Free2Move is a subsidiary of Stellantis and focuses on providing a range of mobility solutions, including car-sharing, car rental, and other urban mobility services. It operates as an independent brand, offering a diverse set of transportation options to customers. Free2Move provides a mobile app that acts as a central platform for accessing its various services. Users can use the applications to locate nearby vehicles, book rides, pay for services, and manage their accounts.

    In April 2023, Free2move and BMW partner to offer electric vehicle charging and car-sharing services at BMW dealerships in Europe. This partnership is designed to make it easier for drivers to switch to the electric vehicles and to find convenient charging options.

    Lyft is a prominent transportation network company (TNC) based in the United States. Lyft was founded in 2012 by the Logan Green and John Zimmer. It is headquartered in San Francisco, California. The company was established with the goal of providing an alternative to traditional taxi services by connecting riders with drivers via a mobile app. Lyft operates a ride-hailing platform that allows users to request rides from nearby drivers using their smartphones. It provides a range of ride options, including standard Lyft rides, Lyft Plus for larger groups, and Lyft Lux for premium rides.

    In July 2023, Ford and Lyft partner to develop and deploy a fleet of self-driving electric vehicles in the U.S. This partnership is designed to accelerate the development and deployment of autonomous vehicles and to make Car-sharing more accessible and affordable.

    Key Companies in the Shared Mobility Market market include

    Industry Developments

    • Q2 2024: Bolt raises $220M to expand shared mobility and food delivery in Africa Bolt, the European ride-hailing and shared mobility company, secured $220 million in new funding to accelerate its expansion in Africa, focusing on ride-hailing, micromobility, and food delivery services.
    • Q2 2024: Uber launches electric bike-sharing service in Paris Uber announced the launch of its new electric bike-sharing service in Paris, marking a significant expansion of its shared mobility offerings in Europe.
    • Q2 2024: Didi Chuxing partners with BYD to launch new EV fleet for ride-hailing Didi Chuxing entered a partnership with BYD to deploy a new fleet of electric vehicles for its ride-hailing platform in China, aiming to accelerate the transition to sustainable shared mobility.
    • Q3 2024: Lyft appoints new CEO as company pivots to profitability in shared mobility Lyft announced the appointment of a new CEO, signaling a strategic shift as the company intensifies its focus on profitability and operational efficiency in the shared mobility sector.
    • Q3 2024: Ola Electric secures $300 million in Series E funding to expand shared mobility services Ola Electric raised $300 million in a Series E funding round to support the expansion of its electric shared mobility services across India and international markets.
    • Q3 2024: Bird launches new e-scooter model with swappable batteries Bird unveiled a new electric scooter model featuring swappable batteries, aiming to improve operational efficiency and sustainability in its shared micromobility fleet.
    • Q3 2024: Getaround acquires Drivy to expand car-sharing footprint in Europe Getaround, the US-based car-sharing platform, completed the acquisition of Drivy, a leading European car-sharing service, to strengthen its presence in the European shared mobility market.
    • Q4 2024: Zipcar launches subscription-based car-sharing service in London Zipcar introduced a new subscription-based car-sharing service in London, offering users flexible access to vehicles as part of its evolving shared mobility strategy.
    • Q4 2024: Grab partners with Hyundai to pilot autonomous ride-hailing in Singapore Grab announced a partnership with Hyundai to pilot autonomous ride-hailing services in Singapore, marking a significant step toward the integration of autonomous vehicles in shared mobility.
    • Q1 2025: TIER Mobility raises $100M to expand e-scooter operations in Europe TIER Mobility secured $100 million in new funding to accelerate the rollout of its e-scooter sharing services across additional European cities.
    • Q1 2025: BlaBlaCar acquires Busfor to expand intercity shared mobility services BlaBlaCar completed the acquisition of Busfor, a bus ticketing platform, to broaden its intercity shared mobility offerings in Europe and Russia.
    • Q2 2025: Spin launches shared e-bike service in Tokyo Spin, a Ford-owned micromobility company, launched its shared e-bike service in Tokyo, marking its entry into the Japanese shared mobility market.

    Future Outlook

    Shared Mobility Market Future Outlook

    The Global Shared Mobility Market is projected to grow at a 12.02% CAGR from 2024 to 2035, driven by urbanization, technological advancements, and sustainability initiatives.

    New opportunities lie in:

    • Develop integrated mobility platforms combining various transport modes.
    • Invest in electric vehicle fleets to meet sustainability goals.
    • Leverage data analytics for personalized user experiences and operational efficiency.

    By 2035, the Shared Mobility Market is expected to be a cornerstone of urban transportation solutions.

    Market Segmentation

    Shared transportation Regional Outlook

    • US
    • Canada
    • Germany
    • France
    • UK
    • Italy
    • Spain
    • Rest of Europe
    • China
    • Japan
    • India
    • Australia
    • South Korea
    • Rest of Asia-Pacific
    • Middle East
    • Africa
    • Latin America

    Shared transportation Service Type Outlook

    • Bike Sharing
    • Car Sharing
    • Ride-Hailing
    • Public Transit
    • Micro transit

    Shared transportation Vehicle Type Outlook

    • Two-Wheelers
    • Passenger Cars
    • Buses and Rails
    • Others

    Shared transportation Distribution Channel Outlook

    • Offline
    • Online

    Report Scope

    Report Attribute/Metric Details
    Market Size 2024  617.92 (USD Billion)
    Market Size 2025  692.08 (USD Billion)
    Market Size 2034  1,919.52 (USD Billion)
    Compound Annual Growth Rate (CAGR)     12.20% (2025 - 2034)
    Report Coverage Revenue Forecast, Competitive Landscape, Growth Factors, and Trends
    Base Year 2024
    Market Forecast Period 2025 - 2034
    Historical Data 2019 - 2023
    Report Coverage Revenue Forecast, The Market Competitive Landscape, Growth Factors, and Trends
    Segments Covered Service Model, Vehicle Type, Distribution Channel and Region
    Geographies Covered North America, Europe, Asia Pacific, and the Rest of the World
    Countries Covered The US, Canada, Germany, France, UK, Italy, Spain, Japan, China, India, Australia, South Korea, and Brazil
    Key Companies Profiled  Blu-Smart Mobility Pvt. Ltd., Bolt Technology OÜ, Autocrypt Co., Ltd., Cabify Espaa S.L.U., EasyMile SAS, Meru Mobility Tech Pvt. Ltd., ANI Technologies Private Limited (Ola), Zoomcar India Private Limited, Getaround, Inc., Free2move, BlaBlaCar, Lyft, Inc., Didi Chuxing Technology Co., Yandex LLC, Uber Technologies Inc
    Key Market Opportunities The growing demand for eco-friendly transportation solutions.
    Key Market Dynamics Increased urbanization and congestion in cities worldwide and the rising awareness of environmental sustainability.

    Market Highlights

    Author
    Aarti Dhapte
    Team Lead - Research

    She holds an experience of about 6+ years in Market Research and Business Consulting, working under the spectrum of Information Communication Technology, Telecommunications and Semiconductor domains. Aarti conceptualizes and implements a scalable business strategy and provides strategic leadership to the clients. Her expertise lies in market estimation, competitive intelligence, pipeline analysis, customer assessment, etc.

    Leave a Comment

    FAQs

    How much is the Shared Mobility market?

    The Shared Mobility Market size was valued at USD 617.92 Billion in 2024.

    What is the growth rate of the Shared Mobility market?

    The global market is foreseen to rise at a CAGR of 12.20% during the forecast period, 2025-2034.

    Which region had largest market share in the Shared Mobility market?

    North America held the largest share in the global market

    Who are the key market players in the Shared Mobility market?

    The key players in the market are Blu-Smart Mobility Pvt. Ltd., Bolt Technology OÜ, Autocrypt Co., Ltd., Cabify Espaa S.L.U., EasyMile SAS, Meru Mobility Tech Pvt. Ltd., ANI Technologies Private Limited (Ola), Zoomcar India Private Limited, Getaround, Inc., Free2move, BlaBlaCar, Lyft, Inc., Didi Chuxing Technology Co., Yandex LLC, Uber Technologies Inc.

    Which service type led the Shared Mobility market?

    The ride-hailing category dominated the market in 2022.

    Which distribution channel attained the largest market share in the Shared Mobility market?

    The online had the largest share in the global market.

    1. EXECUTIVE SUMMARY
    2. MARKET INTRODUCTION
      1. Definition
      2. Scope of the Study
        1. Research Objective
        2. Assumptions
        3. Limitations
    3. RESEARCH METHODOLOGY
    4. Overview
      1. Data Mining
      2. Secondary Research
      3. Primary Research
        1. Primary Interviews and Information Gathering Process
        2. Breakdown
    5. of Primary Respondents
      1. Forecasting Model
      2. Market Size Estimation
        1. Bottom-Up Approach
        2. Top-Down Approach
      3. Data Triangulation
      4. Validation
    6. MARKET DYNAMICS
      1. Overview
      2. Drivers
      3. Restraints
      4. Opportunities
    7. MARKET FACTOR ANALYSIS
    8. Value Chain Analysis
      1. Porter’s Five Forces Analysis
        1. Bargaining
    9. Power of Suppliers
      1. Bargaining Power of Buyers
        1. Threat of
    10. New Entrants
      1. Threat of Substitutes
        1. Intensity of Rivalry
      2. COVID-19 Impact Analysis
        1. Market Impact Analysis
        2. Regional
    11. Impact
      1. Opportunity and Threat Analysis
    12. GLOBAL SHARED MOBILITY,
    13. BY SERVICE TYPE
      1. Overview
      2. Bike Sharing
      3. Car Sharing
      4. Ride-Hailing
      5. Public Transit
      6. Micro transit
    14. GLOBAL
    15. SHARED MOBILITY, BY VEHICLE TYPE
      1. Overview
      2. Two-Wheelers
    16. Passenger Cars
      1. Buses and Rails
      2. Others
    17. GLOBAL SHARED
    18. MOBILITY, BY DISTRIBUTION CHANNEL
      1. Overview
      2. Offline
    19. Online
    20. GLOBAL SHARED MOBILITY, BY REGION
      1. Overview
      2. North
    21. America
      1. US
        1. Canada
      2. Europe
        1. Germany
        2. France
        3. UK
        4. Italy
        5. Spain
        6. Rest
    22. of Europe
      1. Asia-Pacific
        1. China
        2. India
    23. Japan
      1. South Korea
        1. Australia
        2. Rest of Asia-Pacific
      2. Rest of the World
        1. Middle East
        2. Africa
    24. Latin America
    25. COMPETITIVE LANDSCAPE
      1. Overview
      2. Competitive
    26. Analysis
      1. Market Share Analysis
      2. Major Growth Strategy in the
    27. Global Shared Mobility,
      1. Competitive Benchmarking
      2. Leading Players
    28. in Terms of Number of Developments in the Global Shared Mobility,
      1. Key
    29. developments and Growth Strategies
      1. New Type Launch/Service Deployment
        1. Merger & Acquisitions
        2. Joint Ventures
      2. Major
    30. Players Financial Matrix
      1. Sales & Operating Income, 2022
    31. Major Players R&D Expenditure. 2022
    32. COMPANY PROFILES
      1. Blu-Smart
    33. Mobility Pvt Ltd.
      1. Company Overview
        1. Financial Overview
        2. Types Offered
        3. Key Developments
        4. SWOT Analysis
        5. Key Strategies
      2. Bolt Technology
        1. Company Overview
        2. Financial Overview
        3. Types Offered
        4. Key Developments
        5. SWOT Analysis
        6. Key Strategies
      3. Autocrypt Co., Ltd.
        1. Company Overview
        2. Financial Overview
        3. Types Offered
        4. Key Developments
        5. SWOT Analysis
        6. Key Strategies
      4. Cabify Espaa S.L.U.
        1. Company Overview
        2. Financial
    34. Overview
      1. Types Offered
        1. Key Developments
        2. SWOT
    35. Analysis
      1. Key Strategies
      2. EasyMiles SAS
        1. Company
    36. Overview
      1. Financial Overview
        1. Types Offered
    37. Key Developments
      1. SWOT Analysis
        1. Key Strategies
    38. Meru Mobility Tech Pvt. Ltd.
      1. Company Overview
        1. Financial
    39. Overview
      1. Types Offered
        1. Key Developments
        2. SWOT
    40. Analysis
      1. Key Strategies
      2. ANI Technologies Private Ltd.
        1. Company Overview
        2. Financial Overview
        3. Types Offered
        4. Key Developments
        5. SWOT Analysis
        6. Key Strategies
      3. Zoomcar India private Ltd.
        1. Company Overview
        2. Financial
    41. Overview
      1. Types Offered
        1. Key Developments
        2. SWOT
    42. Analysis
      1. Key Strategies
      2. Getaround, Inc
        1. Company
    43. Overview
      1. Financial Overview
        1. Types Offered
    44. Key Developments
      1. SWOT Analysis
        1. Key Strategies
    45. Free2move
      1. Company Overview
        1. Financial Overview
    46. Types Offered
      1. Key Developments
        1. SWOT Analysis
    47. Key Strategies
      1. BlaBlaCar
        1. Company Overview
    48. Financial Overview
      1. Types Offered
        1. Key Developments
        2. SWOT Analysis
        3. Key Strategies
      2. Lyft Inc
    49. Company Overview
      1. Financial Overview
        1. Types Offered
        2. Key Developments
        3. SWOT Analysis
        4. Key Strategies
      2. Didi Chuxing Technology Co.
        1. Company Overview
    50. Financial Overview
      1. Types Offered
        1. Key Developments
        2. SWOT Analysis
        3. Key Strategies
      2. Yandex LLC
        1. Company Overview
        2. Financial Overview
        3. Types
    51. Offered
      1. Key Developments
        1. SWOT Analysis
    52. Key Strategies
      1. Uber Technologies Inc
        1. Company Overview
        2. Financial Overview
        3. Types Offered
        4. Key Developments
        5. SWOT Analysis
        6. Key Strategies
    53. APPENDIX
    54. References
      1. Related Reports
    55. GLOBAL SHARED MOBILITY, SYNOPSIS, 2024-2032
    56. ESTIMATES & FORECAST, 2024-2032 (USD BILLION)
    57. BY SERVICE TYPE, 2024-2032 (USD BILLION)
    58. VEHICLE TYPE, 2024-2032 (USD BILLION)
    59. CHANNEL, 2024-2032 (USD BILLION)
    60. SERVICE TYPE, 2024-2032 (USD BILLION)
    61. BY VEHICLE TYPE, 2024-2032 (USD BILLION)
    62. BY DISTRIBUTION CHANNEL, 2024-2032 (USD BILLION)
    63. BY SERVICE TYPE, 2024-2032 (USD BILLION)
    64. TYPE, 2024-2032 (USD BILLION)
    65. CHANNEL, 2024-2032 (USD BILLION)
    66. TYPE, 2024-2032 (USD BILLION)
    67. TYPE, 2024-2032 (USD BILLION)
    68. CHANNEL, 2024-2032 (USD BILLION)
    69. TYPE, 2024-2032 (USD BILLION)
    70. 2032 (USD BILLION)
    71. 2032 (USD BILLION)
    72. 2032 (USD BILLION)
    73. 2032 (USD BILLION)
    74. 2032 (USD BILLION)
    75. (USD BILLION)
    76. BILLION)
    77. (USD BILLION)
    78. BILLION)
    79. SPAIN: SHARED MOBILITY, BY VEHICLE TYPE, 2024-2032 (USD BILLION)
    80. SPAIN: SHARED MOBILITY, BY DISTRIBUTION CHANNEL, 2024-2032 (USD BILLION)
    81. UK: SHARED MOBILITY, BY SERVICE TYPE, 2024-2032 (USD BILLION)
    82. SHARED MOBILITY, BY VEHICLE TYPE, 2024-2032 (USD BILLION)
    83. MOBILITY, BY DISTRIBUTION CHANNEL, 2024-2032 (USD BILLION)
    84. EUROPE: SHARED MOBILITY, BY SERVICE TYPE, 2024-2032 (USD BILLION)
    85. REST OF EUROPE: SHARED MOBILITY, BY VEHICLE TYPE, 2024-2032 (USD BILLION)
    86. REST OF EUROPE: SHARED MOBILITY, BY DISTRIBUTION CHANNEL, 2024-2032 (USD BILLION)
    87. BILLION)
    88. JAPAN: SHARED MOBILITY, BY DISTRIBUTION CHANNEL, 2024-2032 (USD BILLION)
    89. CHINA: SHARED MOBILITY, BY SERVICE TYPE, 2024-2032 (USD BILLION)
    90. CHINA: SHARED MOBILITY, BY VEHICLE TYPE, 2024-2032 (USD BILLION)
    91. SHARED MOBILITY, BY DISTRIBUTION CHANNEL, 2024-2032 (USD BILLION)
    92. INDIA: SHARED MOBILITY, BY SERVICE TYPE, 2024-2032 (USD BILLION)
    93. SHARED MOBILITY, BY VEHICLE TYPE, 2024-2032 (USD BILLION)
    94. MOBILITY, BY DISTRIBUTION CHANNEL, 2024-2032 (USD BILLION)
    95. SHARED MOBILITY, BY SERVICE TYPE, 2024-2032 (USD BILLION)
    96. SHARED MOBILITY, BY VEHICLE TYPE, 2024-2032 (USD BILLION)
    97. SHARED MOBILITY, BY DISTRIBUTION CHANNEL, 2024-2032 (USD BILLION)
    98. SOUTH KOREA: SHARED MOBILITY, BY SERVICE TYPE, 2024-2032 (USD BILLION)
    99. SOUTH KOREA: SHARED MOBILITY, BY VEHICLE TYPE, 2024-2032 (USD BILLION)
    100. SOUTH KOREA: SHARED MOBILITY, BY DISTRIBUTION CHANNEL, 2024-2032 (USD BILLION)
    101. BILLION)
    102. (USD BILLION)
    103. CHANNEL, 2024-2032 (USD BILLION)
    104. BY SERVICE TYPE, 2024-2032 (USD BILLION)
    105. MOBILITY, BY VEHICLE TYPE, 2024-2032 (USD BILLION)
    106. SHARED MOBILITY, BY DISTRIBUTION CHANNEL, 2024-2032 (USD BILLION)
    107. MIDDLE EAST: SHARED MOBILITY, BY SERVICE TYPE, 2024-2032 (USD BILLION)
    108. MIDDLE EAST: SHARED MOBILITY, BY VEHICLE TYPE, 2024-2032 (USD BILLION)
    109. MIDDLE EAST: SHARED MOBILITY, BY DISTRIBUTION CHANNEL, 2024-2032 (USD BILLION)
    110. BILLION)
    111. STRUCTURE FOR THE GLOBAL SHARED MOBILITY
    112. SHARED MOBILITY
    113. GLOBAL SHARED MOBILITY, SHARE (%), BY DISTRIBUTION CHANNEL, 2022
    114. GLOBAL SHARED MOBILITY, SHARE (%), BY REGION, 2022
    115. SHARED MOBILITY, SHARE (%), BY REGION, 2022
    116. SHARE (%), BY REGION, 2022
    117. BY REGION, 2022
    118. REGION, 2022
    119. BLU-SMART MOBILITY PVT LTD: SWOT ANALYSIS
    120. OVERVIEW SNAPSHOT
    121. CO., LTD: FINANCIAL OVERVIEW SNAPSHOT
    122. ESPAA S.L.U: SWOT ANALYSIS
    123. FINANCIAL OVERVIEW SNAPSHOT
    124. ANI TECHNOLOGIES PRIVATE LIMITED: SWOT ANALYSIS
    125. PRIVATE LIMITED: FINANCIAL OVERVIEW SNAPSHOT
    126. LIMITED: SWOT ANALYSIS
    127. SNAPSHOT
    128. OVERVIEW SNAPSHOT
    129. FINANCIAL OVERVIEW SNAPSHOT
    130. DIDI CHUXING TECHNOLOGY CO: FINANCIAL OVERVIEW SNAPSHOT
    131. TECHNOLOGY CO: SWOT ANALYSIS
    132. OVERVIEW SNAPSHOT

    Shared Mobility Market Segmentation

    Shared Mobility Service Type Outlook (USD Billion, 2018-2032)

    • Bike Sharing
    • Car Sharing
    • Ride-Hailing
    • Public Transit
    • Micro transit

    Shared Mobility Vehicle Type Outlook (USD Billion, 2018-2032)

    • Two-Wheelers
    • Passenger Cars
    • Buses and Rails
    • Others

    Shared Mobility Distribution Channel Outlook (USD Billion, 2018-2032)

    • Offline
    • Online

    Shared Mobility Regional Outlook (USD Billion, 2018-2032)

    • North America Outlook (USD Billion, 2018-2032)

      • North America Shared Mobility By Type

        • Bike Sharing
        • Car Sharing
        • Ride-Hailing
        • Public Transit
        • Micro transit
      • North America Shared Mobility By Vehicle Type

        • Two-Wheelers
        • Passenger Cars
        • Buses and Rails
        • Others
      • North America Shared Mobility By Distribution Channel

        • Offline
        • Online
      • US Outlook (USD Billion, 2018-2032)

      • US Shared Mobility By Type

        • Bike Sharing
        • Car Sharing
        • Ride-Hailing
        • Public Transit
        • Micro transit
      • US Shared Mobility By Vehicle Type

        • Two-Wheelers
        • Passenger Cars
        • Buses and Rails
        • Others
      • US Shared Mobility By Distribution Channel

        • Offline
        • Online
      • CANADA Outlook (USD Billion, 2018-2032)

      • CANADA Shared Mobility By Type

        • Bike Sharing
        • Car Sharing
        • Ride-Hailing
        • Public Transit
        • Micro transit
      • CANADA Shared Mobility By Vehicle Type

        • Two-Wheelers
        • Passenger Cars
        • Buses and Rails
        • Others
      • CANADA Shared Mobility By Distribution Channel

        • Offline
        • Online
    • Europe Outlook (USD Billion, 2018-2032)

      • Europe Shared Mobility By Type

        • Bike Sharing
        • Car Sharing
        • Ride-Hailing
        • Public Transit
        • Micro transit
      • Europe Shared Mobility By Vehicle Type

        • Two-Wheelers
        • Passenger Cars
        • Buses and Rails
        • Others
      • Europe Shared Mobility By Distribution Channel

        • Offline
        • Online
      • Germany Outlook (USD Billion, 2018-2032)

      • Germany Shared Mobility By Type

        • Bike Sharing
        • Car Sharing
        • Ride-Hailing
        • Public Transit
        • Micro transit
      • Germany Shared Mobility By Vehicle Type

        • Two-Wheelers
        • Passenger Cars
        • Buses and Rails
        • Others
      • Germany Shared Mobility By Distribution Channel

        • Offline
        • Online
      • France Outlook (USD Billion, 2018-2032)

      • France Shared Mobility By Type

        • Bike Sharing
        • Car Sharing
        • Ride-Hailing
        • Public Transit
        • Micro transit
      • France Shared Mobility By Vehicle Type

        • Two-Wheelers
        • Passenger Cars
        • Buses and Rails
        • Others
      • France Shared Mobility By Distribution Channel

        • Offline
        • Online
      • UK Outlook (USD Billion, 2018-2032)

      • UK Shared Mobility By Type

        • Bike Sharing
        • Car Sharing
        • Ride-Hailing
        • Public Transit
        • Micro transit
      • UK Shared Mobility By Vehicle Type

        • Two-Wheelers
        • Passenger Cars
        • Buses and Rails
        • Others
      • UK Shared Mobility By Distribution Channel

        • Offline
        • Online
      • ITALY Outlook (USD Billion, 2018-2032)

      • ITALY Shared Mobility By Type

        • Bike Sharing
        • Car Sharing
        • Ride-Hailing
        • Public Transit
        • Micro transit
      • ITALY Shared Mobility By Vehicle Type

        • Two-Wheelers
        • Passenger Cars
        • Buses and Rails
        • Others
      • ITALY Shared Mobility By Distribution Channel

        • Offline
        • Online
      • SPAIN Outlook (USD Billion, 2018-2032)

      • Spain Shared Mobility By Type

        • Bike Sharing
        • Car Sharing
        • Ride-Hailing
        • Public Transit
        • Micro transit
      • Spain Shared Mobility By Vehicle Type

        • Two-Wheelers
        • Passenger Cars
        • Buses and Rails
        • Others
      • Spain Shared Mobility By Distribution Channel

        • Offline
        • Online
      • Rest Of Europe Outlook (USD Billion, 2018-2032)

      • Rest Of Europe Shared Mobility By Type

        • Bike Sharing
        • Car Sharing
        • Ride-Hailing
        • Public Transit
        • Micro transit
      • REST OF EUROPE Shared Mobility By Vehicle Type

        • Two-Wheelers
        • Passenger Cars
        • Buses and Rails
        • Others
      • REST OF EUROPE Shared Mobility By Distribution Channel

        • Offline
        • Online
    • Asia-Pacific Outlook (USD Billion, 2018-2032)

      • Asia-Pacific Shared Mobility By Type

        • Bike Sharing
        • Car Sharing
        • Ride-Hailing
        • Public Transit
        • Micro transit
      • Asia-Pacific Shared Mobility By Vehicle Type

        • Two-Wheelers
        • Passenger Cars
        • Buses and Rails
        • Others
      • Asia-Pacific Shared Mobility By Distribution Channel

        • Offline
        • Online
      • China Outlook (USD Billion, 2018-2032)­

      • China Shared Mobility By Type

        • Bike Sharing
        • Car Sharing
        • Ride-Hailing
        • Public Transit
        • Micro transit
      • China Shared Mobility By Vehicle Type

        • Two-Wheelers
        • Passenger Cars
        • Buses and Rails
        • Others
      • China Shared Mobility By Distribution Channel

        • Offline
        • Online
      • Japan Outlook (USD Billion, 2018-2032)

      • Japan Shared Mobility By Type

        • Bike Sharing
        • Car Sharing
        • Ride-Hailing
        • Public Transit
        • Micro transit
      • Japan Shared Mobility By Vehicle Type

        • Two-Wheelers
        • Passenger Cars
        • Buses and Rails
        • Others
      • Japan Shared Mobility By Distribution Channel

        • Offline
        • Online
      • India Outlook (USD Billion, 2018-2032)

      • India Shared Mobility By Type

        • Bike Sharing
        • Car Sharing
        • Ride-Hailing
        • Public Transit
        • Micro transit
      • India Shared Mobility By Vehicle Type

        • Two-Wheelers
        • Passenger Cars
        • Buses and Rails
        • Others
      • India Shared Mobility By Distribution Channel

        • Offline
        • Online
      • Australia Outlook (USD Billion, 2018-2032)

      • Australia Shared Mobility By Type

        • Bike Sharing
        • Car Sharing
        • Ride-Hailing
        • Public Transit
        • Micro transit
      • Australia Shared Mobility By Vehicle Type

        • Two-Wheelers
        • Passenger Cars
        • Buses and Rails
        • Others
      • Australia Shared Mobility By Distribution Channel

        • Offline
        • Online
      • Rest of Asia-Pacific Outlook (USD Billion, 2018-2032)

      • Rest of Asia-Pacific Shared Mobility By Type

        • Bike Sharing
        • Car Sharing
        • Ride-Hailing
        • Public Transit
        • Micro transit
      • Rest of Asia-Pacific Shared Mobility By Vehicle Type

        • Two-Wheelers
        • Passenger Cars
        • Buses and Rails
        • Others
      • Rest of Asia-Pacific Shared Mobility By Distribution Channel

        • Offline
        • Online
    • Rest of the World Outlook (USD Billion, 2018-2032)

      • Rest of the World Shared Mobility By Type

        • Bike Sharing
        • Car Sharing
        • Ride-Hailing
        • Public Transit
        • Micro transit
      • Rest of the World Shared Mobility By Vehicle Type

        • Two-Wheelers
        • Passenger Cars
        • Buses and Rails
        • Others
      • Rest of the World Shared Mobility By Distribution Channel

        • Offline
        • Online
      • Middle East Outlook (USD Billion, 2018-2032)

      • Middle East Shared Mobility By Type

        • Bike Sharing
        • Car Sharing
        • Ride-Hailing
        • Public Transit
        • Micro transit
      • Middle East Shared Mobility By Vehicle Type

        • Two-Wheelers
        • Passenger Cars
        • Buses and Rails
        • Others
      • Middle East Shared Mobility By Distribution Channel

        • Offline
        • Online
      • Africa Outlook (USD Billion, 2018-2032)

      • Africa Shared Mobility By Type

        • Bike Sharing
        • Car Sharing
        • Ride-Hailing
        • Public Transit
        • Micro transit
      • Africa Shared Mobility By Vehicle Type

        • Two-Wheelers
        • Passenger Cars
        • Buses and Rails
        • Others
      • Africa Shared Mobility By Distribution Channel

        • Offline
        • Online
      • Latin America Outlook (USD Billion, 2018-2032)

      • Latin America Shared Mobility By Type

        • Bike Sharing
        • Car Sharing
        • Ride-Hailing
        • Public Transit
        • Micro transit
      • Latin America Shared Mobility By Vehicle Type

        • Two-Wheelers
        • Passenger Cars
        • Buses and Rails
        • Others
      • Latin America Shared Mobility By Distribution Channel

        • Offline
        • Online
    Report Infographic
    Free Sample Request

    Kindly complete the form below to receive a free sample of this Report

    Customer Strories

    “I am very pleased with how market segments have been defined in a relevant way for my purposes (such as "Portable Freezers & refrigerators" and "last-mile"). In general the report is well structured. Thanks very much for your efforts.”

    Victoria Milne Founder
    Case Study

    Chemicals and Materials