info@marketresearchfuture.com   📞  +1 (855) 661-4441(US)   📞  +44 1720 412 167(UK)
Certified Global Research Member
Isomar fd.webp Wcrc 57.webp
Key Questions Answered
  • Global Market Outlook
  • In-depth analysis of global and regional trends
  • Analyze and identify the major players in the market, their market share, key developments, etc.
  • To understand the capability of the major players based on products offered, financials, and strategies.
  • Identify disrupting products, companies, and trends.
  • To identify opportunities in the market.
  • Analyze the key challenges in the market.
  • Analyze the regional penetration of players, products, and services in the market.
  • Comparison of major players’ financial performance.
  • Evaluate strategies adopted by major players.
  • Recommendations
Why Choose Market Research Future?
  • Vigorous research methodologies for specific market.
  • Knowledge partners across the globe
  • Large network of partner consultants.
  • Ever-increasing/ Escalating data base with quarterly monitoring of various markets
  • Trusted by fortune 500 companies/startups/ universities/organizations
  • Large database of 5000+ markets reports.
  • Effective and prompt pre- and post-sales support.

Shale Gas Market Share

ID: MRFR//10258-HCR | 128 Pages | Author: Priya Nagrale| November 2024

Dynamic market share positioning tactics have been seen in the shale gas market as a way to gain control in the energy sector. Big companies often be aggressive in their production and research, which helps them get a big share of the market. Shale gas can be extracted successfully with this approach, which uses cutting-edge methods and tools. This puts the company ahead of the competition.
One more important way to place your market share is through strategic partnerships and working together. Companies have tried to find ways to work with service providers, tech leaders, and other companies in the same field because they know the shale gas industry is hard to understand and costs a lot of money. People can share knowledge, save money, and use their combined resources more easily when they work together in this way, which is good for everyone. Joint ventures and strategic partnerships are ways for businesses to get better by joining their skills. These relationships make things run more easily and lower risks.
Some of the vendors in the worldwide market are working on getting ahead of the competition by being more eco-friendly. This is because more and more people around the world care about the environment's long-term health. To get a bigger part of the market, you should put money into projects that collect and store carbon, use green technologies, and do less damage to the environment. This way of doing things helps a company's brand and market value because it follows the law and what people expect.
The way people around the world get energy has changed a lot because of "fracking," which is also known as "hydraulic fracturing." It has gone up faster because of things like new laws, changes in the country's energy needs, and better technology.

Covered Aspects:

Report Attribute/Metric Details
Base Year For Estimation 2022
Historical Data 2018- 2022
Forecast Period 2023-2032
Growth Rate 5.90% (2023-2032)

Global Shale Gas Market Overview


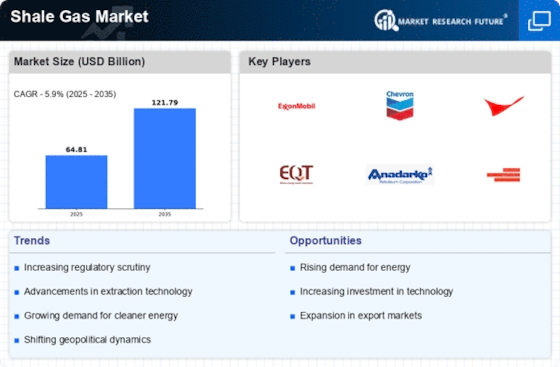
Shale Gas Market Size was valued at USD 57.8 Billion in 2022. The Shale Gas market is projected to grow from USD 61.2 Billion in 2023 to USD 96.8 Billion by 2032, exhibiting a compound annual growth rate (CAGR) of 5.90% during the forecast period (2023 - 2032). Expanding energy demand, decreasing conventional gas supplies, expanding oil use, and the expansion of sectors dependent on oil, are the key market drivers enhancing the market growth.


GLobal Shale Gas Market Overview


Source: Secondary Research, Primary Research, MRFR Database and Analyst Review


Shale Gas Market Trends


  • Rising energy demand along with depleting conventional gas reserves is driving the market growth


Shift to unconventional natural gas supplies including shale gas, tight gas, and coal bed methane as a result of rising energy demand and dwindling conventional gas reserves. More technological developments in shale drilling are anticipated to boost market expansion. Commercial quantities of shale gas that are trapped deep within the shale source rock can be extracted using hydraulic fracturing in combination with additional drilling methods like directional drilling and horizontal drilling. Because there are considerable shale gas deposits all over the United States, the market is expected to increase significantly. New reserves were found, which led to an increase in shale output. The United States generated 25.3 trillion cubic feet of dry shale gas in 2019, up from 22.1 trillion cubic feet in 2018, according to the International Energy Association.


The process of extracting shale gas produces hazardous pollutants and uses a lot of water. Environmental concerns have increased as a result, and activists have become more vocal in their opposition, which is projected to impede industry expansion. Technology developments for deep-water and ultra-deepwater unconventional gas drilling are anticipated to give the market demand the necessary boost. Production, processing, gas transportation, storage, and distribution to industrial, commercial, and residential users are all parts of the market supply chain. The COVID-19 epidemic, however, has had a significant negative impact on the upstream, midstream, and downstream portions of the shale gas supply chain, leading to a significant imbalance between supply and demand.


Drilling-related methane gas emissions could endanger the environment by causing air pollution. Additionally, improper surface water contamination due to the improper disposal of huge amounts of chemically treated water used in hydraulic fracturing operations is a possibility. NGOs and organizations that defend the environment from all over the world have criticized this. Local farmers and people have frequently protested hydraulic fracturing due to its effects on health and agricultural.  A typical fracking well uses between 2 and 10 million gallons of water during fracking operations, which adds to the strain on the water supply, especially in areas that are prone to drought. Thus, driving the Shale Gas market revenue.


Shale Gas Market Segment Insights:


Shale Gas Technology Insights


The Shale Gas Market segmentation, based on technology, includes horizontal fracking, vertical fracking, and rotary fracking. In 2022, the vertical fracking segment held the greatest market share. This is due to its advantages over other fuel types, which include low cost and low carbon breakdown.


Shale Gas End User Insights


The Shale Gas Market segmentation, based on end user, includes residential, commercial, industrial, power generation, and transportation. In 2022, the power generation segment held the greatest market share. It is anticipated that the rising trend of power plants converting from coal to gas will favorably impact market growth. Governments aim for a rising proportion of shale gas in the nation's energy mix. Due to its cleaner burning than other fossil fuels, power generation drives the majority of demand in international markets.


Figure 1: Shale Gas Market, by End User, 2022 & 2032 (USD Billion)


Shale Gas Market, by End User, 2022 & 2032 (USD Billion)


Source: Secondary Research, Primary Research, MRFR Database and Analyst Review


Shale Gas Regional Insights


By region, the study provides the market insights into North America, Europe, Asia-Pacific and Rest of the World. The North America Shale Gas Market dominated this market in 2022 (45.80%). Due to the use of horizontal drilling and hydraulic fracturing to extract ultra-hard shale from deep underground reserves spread across the nation, the U.S. is the main contributor to regional growth. The International Trade Center reports that due to increased exploration and production, the United States held the top spot in the global rankings of gas producers in 2018. Prior to the emergence of shale gas, the United States was a net importer of natural gas; now, it is an exporter. Major U.S. players are spending extensively in unconventional development since it is a dependable way to reduce carbon footprint. Further, the U.S. Shale Gas market held the largest market share, and the Canada Shale Gas market was the fastest growing market in the North America region.


Further, the major countries studied in the market report are The US, Canada, German, France, the UK, Italy, Spain, China, Japan, India, Australia, South Korea, and Brazil.


Figure 2: Shale Gas Market Share By Region 2022 (USD Billion)


Shale Gas Market Share By Region 2022 (USD Billion)


Source: Secondary Research, Primary Research, MRFR Database and Analyst Review


Europe Shale Gas market accounts for the significant market share. Large reserves, new end-users of hydraulic fracturing technology, horizontal drilling, and the discovery of new shale gas sources are only a few of the reasons for this. Further, the German Shale Gas market held the largest market share, and the U.K Shale Gas market was the fastest growing market in the European region


The Asia Pacific Shale Gas market is expected to register fastest growth from 2023 to 2032. China is thought to have the most technically recoverable resources in the entire planet. China's government has established large output goals. Large market participants have a lucrative chance to explore and produce unconventional gas in the nation thanks to these established targets, which draw significant investments from around the globe. Moreover, China’s Shale Gas market held the largest market share, and the Indian Shale Gas market was the fastest growing market in the Asia-Pacific region.


Shale Gas Key Market Players & Competitive Insights


Leading market players are investing heavily in research and development in order to expand their product lines, which will help the Shale Gas market, grow even more. Market participants are also undertaking a variety of strategic activities to expand their global footprint, with important market developments including new product launches, contractual agreements, mergers and acquisitions, higher investments, and collaboration with other organizations. To expand and survive in a more competitive and rising market climate, Shale Gas industry must offer cost-effective items.


Manufacturing locally to minimize operational costs is one of the key business tactics used by manufacturers in the global Shale Gas industry to benefit clients and increase the market sector. In recent years, the Shale Gas industry has offered some of the most significant advantages to medicine. Major players in the Shale Gas market, including Southwestern Energy Company, EQT Corporation, Equinor ASA, Repsol SA, SINOPEC/Shs, Chesapeake Energy Corporation, Royal Dutch Shell PLC, Exxon Mobil Corporation, Chevron Corporation and PETROCHINA/Shs, are attempting to increase market demand by investing in research and development operations.


Energy firm Equinor ASA (Equinor), originally Statoil ASA. Hydrocarbons are sought after, developed, and produced. It also has holdings in different oil and gas pipelines and runs refineries, processing plants, storage facilities, and ports. The business sells, trades, and moves refined goods, natural gas liquids, condensate, and crude oil. With an emphasis on renewable energy and low-carbon solutions, it is also present in projects involving solar farms, offshore wind, carbon capture and storage, and hydrogen. Major operations are carried out by Equinor on the Norwegian continental shelf. It conducts business on the continents of Europe, North and South America, Africa, and the Asia-Pacific. The headquarters of Equinor are in Stavanger, Norway. The construction of a USD 30 billion LNG facility in Tanzania involving Tanzania, Norway's Equinor, and Britain's Shell is scheduled to begin in March 2023. Contract discussions are now taking place.


An integrated oil and gas business, Shell plc (often known as Shell), was formerly known as Royal Dutch Shell Plc. The company uses conventional fields and sources, including tight rock, shale, and coal formations, to explore for and produce oil and gas. It runs petrochemical and refining complexes all around the world. Lubricants, bitumen, liquefied petroleum gas, and petrochemical goods such raw materials for plastics, paints, and detergents are among Shell's product offerings. In Brazil, the firm is a significant biofuel producer. It also has stakes in a number of gas to liquids (GTL) and liquefied natural gas (LNG) projects. With the help of distributors across Europe, Asia, Oceania, Africa, North America, and South America, the corporation markets its goods both directly and indirectly. The U.K.'s capital of England, London, is home to Shell. A memorandum of understanding (MoU) was signed in March 2023 between the state-owned natural gas processing and distribution firm GAIL (India) Ltd. and Royal Dutch Shell Plc to investigate the feasibility of importing ethane from the United States for the Indian market.


Key Companies in the Shale Gas market include


  • Southwestern Energy Company

  • EQT Corporation

  • Equinor ASA

  • Repsol SA

  • SINOPEC/Shs

  • Chesapeake Energy Corporation

  • Royal Dutch Shell PLC

  • Exxon Mobil Corporation

  • Chevron Corporation

  • PETROCHINA/Shs


Shale Gas Industry Developments


December 2022: Since it was discovered in 2012, China's Fuling shale gas deposit has generated more than 53 billion cubic meters of shale gas. A whopping 34% of the nation's proved reserves are contained in the shale gas field's 897.5 billion cubic meters (bcm) of proven reserves. Additionally, the yearly output from the shale gas resource increased from 142 million cubic meters in 2013 to more than 8.5 billion cubic meters in 2021.


Shale Gas Market Segmentation


Shale Gas Technology Outlook


  • Horizontal Fracking

  • Vertical Fracking

  • Rotary Fracking


Shale Gas End User Outlook


  • Residential

  • Commercial

  • Industrial

  • Power generation

  • Transportation


Shale Gas Regional Outlook


  • North America

    • US

    • Canada


  • Europe

    • Germany

    • France

    • UK

    • Italy

    • Spain

    • Rest of Europe


  • Asia-Pacific

    • China

    • Japan

    • India

    • Australia

    • South Korea

    • Australia

    • Rest of Asia-Pacific


  • Rest of the World

    • Middle East

    • Africa

    • Latin America


Leading companies partner with us for data-driven Insights
client_1 client_2 client_3 client_4 client_5 client_6 client_7 client_8 client_9 client_10
Kindly complete the form below to receive a free sample of this Report
Please fill in Business Email for Quick Response

We do not share your information with anyone. However, we may send you emails based on your report interest from time to time. You may contact us at any time to opt-out.

Purchase Option
Single User $ 4,950
Multiuser License $ 5,950
Enterprise User $ 7,250
Compare Licenses
Tailored for You
  • Dedicated Research on any specifics segment or region.
  • Focused Research on specific players in the market.
  • Custom Report based only on your requirements.
  • Flexibility to add or subtract any chapter in the study.
  • Historic data from 2014 and forecasts outlook till 2040.
  • Flexibility of providing data/insights in formats (PDF, PPT, Excel).
  • Provide cross segmentation in applicable scenario/markets.