• Cat-intel
  • MedIntelliX
  • Resources
  • About Us
  • Request Free Sample ×

    Kindly complete the form below to receive a free sample of this Report

    Leading companies partner with us for data-driven Insights

    clients tt-cursor

    RF GaN Market

    ID: MRFR/SEM/5017-CR
    110 Pages
    Ankit Gupta
    October 2022

    RF GaN Market Research Report Information By Type (GaN-On-SiC, GaN-On-Silicon, GaN-On-Diamond), By Application (IT & Telecomm, Aerospace, Military & Defense), And By Region (North America, Europe, Asia-Pacific, And Rest Of The World) –Market Forecast Till 2034

    Share:
    Download PDF ×

    We do not share your information with anyone. However, we may send you emails based on your report interest from time to time. You may contact us at any time to opt-out.

    RF GaN Market Research Report—Global Forecast till 2034 Infographic
    Purchase Options
    $ 4,950.0
    $ 5,950.0
    $ 7,250.0
    Table of Contents

    RF GaN Market Summary

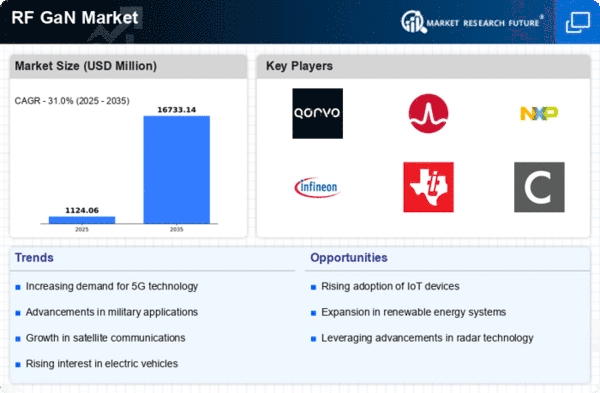
    As per Market Research Future Analysis, the Global RF GaN Market was valued at USD 0.86 billion in 2024 and is projected to grow significantly, reaching USD 12.77 billion by 2034. This growth represents a compound annual growth rate (CAGR) of 31.00% from 2025 to 2034, driven by increased demand in IT & telecommunication equipment and energy & power applications. The telecommunications sector is a major contributor to this growth, as GaN RF technology enhances data bandwidth and connectivity. Additionally, the military & defense segment is expanding due to modernization efforts and the need for high-power semiconductor devices.

    Key Market Trends & Highlights

    Key trends driving the RF GaN market include strong demand from telecommunications and military sectors.

    • RF GaN Market Size in 2024: USD 0.86 billion.
    • Projected Market Size by 2034: USD 12.77 billion.
    • CAGR from 2025 to 2034: 31.00%.
    • Military spending reached USD 1,922 billion in 2019, fueling demand for RF GaN devices.

    Market Size & Forecast

    2024 Market Size USD 0.86 billion
    2025 Market Size USD 1.12 billion
    2034 Market Size USD 12.77 billion
    CAGR (2025-2034) 31.00%

    Major Players

    Key players include NXP Semiconductors (Netherlands), Analog Devices, Inc. (US), ST Microelectronics N.V. (Switzerland), and others.

    RF GaN Market Trends

      • Strong Demand from Telecom Infrastructure is driving the market growth

    The telecommunications industry is regarded as a significant adopter of digital transformation technologies, both a key driver of worldwide digitization and an industry witnessing a large-scale change in its market environment. Investment by the telecommunications industry in interoperability and technology reinforced a paradigm shift in capital flows and information through the global economy while providing the building blocks for the emergence of completely new business models across industries.

    GaN RF technology is quickly becoming the preferred option for network service providers because of its capacity to offer connections with higher-frequency data bandwidth. These devices ensure that the device generates the maximum frequency at the necessary band by preventing interference from other frequency bands. GaN RF power devices would enable users to upload and download high-quality media content, such as music and photographs, as well as play online games and watch online TV shows on maximum frequency bands, which is anticipated to increase the use of current mobile devices. Hence, strong demand from the telecommunications industry drives market CAGR.

    Additionally, Favorable attributes such as high performance and small form factors drive adoption in the military Segment. The constant increase in defense budgets in developing and developed nations and the demand for technologically advanced products in the arsenal of national and international armed forces are expected to fuel the global market's growth further. According to the Stockholm International Peace Research Institute, global military spending reached USD 1,922 billion in 2019 compared to USD 1,855 billion in 2018, USD 1,807 billion in 2017, and USD 1,785 billion in 2016.

    Furthermore, military radio frequency and microwave products are expected to grow as technological advancements in phased-array systems and other complex applications depend heavily on these components, thereby driving demand for the RF GaN market revenue.

    The ongoing advancements in RF GaN technology are poised to enhance the efficiency and performance of communication systems, thereby driving growth in various sectors including defense and telecommunications.

    U.S. Department of Defense

    RF GaN Market Drivers

    Market Growth Projections

    The Global RF GaN Market Industry is projected to experience substantial growth, with estimates indicating a market value of 16.7 USD Billion by 2035. This growth trajectory is underpinned by a compound annual growth rate (CAGR) of 30.97% from 2025 to 2035, reflecting the increasing adoption of GaN technology across various sectors. The market's expansion is driven by factors such as advancements in semiconductor technology, rising demand for high-efficiency power amplifiers, and the integration of GaN devices in emerging applications. These projections highlight the transformative potential of GaN technology in shaping the future of RF applications.

    Advancements in Semiconductor Technology

    The Global RF GaN Market Industry benefits from continuous advancements in semiconductor technology, which enhance the performance and reliability of GaN devices. Innovations in manufacturing processes, such as improved epitaxial growth techniques and substrate materials, lead to higher quality GaN wafers. These advancements not only reduce production costs but also improve device performance metrics, such as thermal management and power handling capabilities. As a result, the market is poised for substantial growth, with a projected CAGR of 30.97% from 2025 to 2035, indicating a robust trajectory fueled by technological progress.

    Emerging Applications in Automotive Sector

    The Global RF GaN Market Industry is witnessing emerging applications in the automotive sector, particularly with the rise of electric vehicles (EVs) and advanced driver-assistance systems (ADAS). GaN technology offers advantages such as reduced size and weight, which are crucial for automotive applications that prioritize efficiency and performance. As automotive manufacturers increasingly integrate RF components for communication and navigation systems, the demand for GaN devices is expected to rise. This trend indicates a potential for market expansion, aligning with the broader shift towards electrification and automation in the automotive industry.

    Growth in Defense and Aerospace Applications

    The Global RF GaN Market Industry is significantly influenced by the increasing adoption of GaN technology in defense and aerospace applications. The military's demand for advanced radar and communication systems necessitates high-performance components that can operate in extreme conditions. GaN's ability to provide high power density and efficiency makes it an ideal choice for these applications. As nations invest in modernizing their defense capabilities, the market is expected to expand, contributing to a projected market size of 16.7 USD Billion by 2035. This growth reflects the strategic importance of GaN technology in enhancing national security.

    Rising Demand for High-Efficiency Power Amplifiers

    The Global RF GaN Market Industry experiences a surge in demand for high-efficiency power amplifiers, particularly in telecommunications and aerospace sectors. As mobile networks evolve towards 5G, the need for robust power amplifiers that can handle higher frequencies and deliver superior performance becomes critical. This transition is projected to drive the market value to approximately 0.86 USD Billion in 2024. The efficiency of GaN technology, which allows for smaller and lighter components, aligns with the industry's push for compact and efficient designs, thereby enhancing overall system performance.

    Increasing Investment in Telecommunications Infrastructure

    The Global RF GaN Market Industry is bolstered by rising investments in telecommunications infrastructure, particularly as countries expand their 5G networks. The deployment of 5G technology necessitates the use of advanced RF components that can support higher data rates and lower latency. GaN technology, with its superior efficiency and performance characteristics, is increasingly being adopted in base stations and other critical infrastructure. This trend is expected to significantly contribute to the market's growth, with projections indicating a market value of 0.86 USD Billion in 2024, reflecting the urgency of upgrading existing networks to meet future demands.

    Market Segment Insights

    Get more detailed insights about RF GaN Market Research Report—Global Forecast till 2034

    Regional Insights

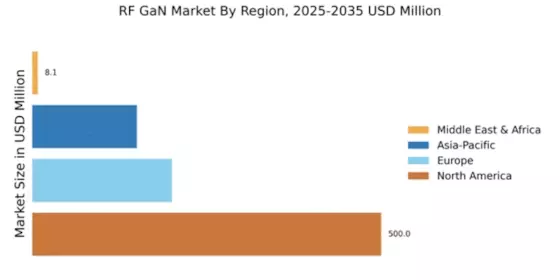
    By Region, the study provides market insights into North America, Europe, Asia-Pacific, and the Rest of the World. The North American RF GaN market area will dominate this market; this is due to the government’s strategy is going to boost market expansion will boost the market growth in this Region.

    Further, the major countries studied in the market report are The U.S., Canada, German, France, the UK, Italy, Spain, China, Japan, India, Australia, South Korea, and Brazil.

    Figure2: RF GaN Market SHARE BY REGION 2022 (%)

    RF GaN Market SHARE BY REGION 2022

    Source: Secondary Research, Primary Research, MRFR Database, and Analyst Review

    Europe RF GaN market accounts for the second-largest market share because the market is expanding because of the increased usage of modern technologies and semiconductors across various regional sectors. Further, the German RF GaN market held the largest market share, and the UK RF GaN market was the fastest-growing market in the European Region.

    The Asia-Pacific RF GaN Market is expected to grow at the fastest CAGR from 2023 to 2032. This is due tothe increase of T/R systems in airborne radar; GaN devices are replacing bulky traveling wave-tube (TWT)-based systems, ensuring that defense will remain among the primary drivers of the GaN market. Moreover, China’s RF GaN market held the largest market share, and the Indian RF GaN market was the fastest-growing market in the Asia-Pacific region.

    Key Players and Competitive Insights

    Leading market players are investing heavily in research and development in order to expand their product lines, which will help the RF GaN market, grow even more. Market participants are also undertaking various strategic activities to expand their global footprint, with important market developments including new product launches, contractual agreements, mergers and acquisitions, higher investments, and collaboration with other organizations. To expand and survive in a more competitive and rising market climate, the RF GaN industry must offer cost-effective items.

    Manufacturing locally to minimize operational costs is one of the key business tactics manufacturers use in the global RF GaN industry to benefit clients and increase the market sector. The RF GaN industry has offered some of the most significant advantages in recent years. Major players in the RF GaN market, including NXP Semiconductors (Netherlands), Analog Devices, Inc. (US), ST Microelectronics N.V. (Switzerland)., and others, are attempting to increase market demand by investing in research and development operations.

    Max Linear is an American hardware company. Founded in 2003, it provides highly integrated radio-frequency analog and mixed-signal semiconductor products for broadband communications applications. It is a New York Stock Exchange-traded company. Max Linear Inc. and RFHIC announced a collaboration to deliver a production-ready 400MHz Power Amplifier solution for 5G Macrocell radios, utilizing Max Linear Max LIN Digital Predistortion and Crest Factor Reduction technologies to optimize the performance of RFHIC’s latest ID-400W series GaN RF Transistors.

    Combining RFHIC’s dual-reverse GaN RF transistor ID41411DR with MaxLIN DPD and making it available as a pre-verified solution would allow Radio Access Network (RAN) product developers to quickly deliver ultra-wideband 400MHz Macro PAs for all global 5G mid-band deployments with high power efficiency and low emissions.

    Integra is a highly regarded partner for Business Process and Technology Services, working with leading organizations around the globe. Integra helps its clients maximize their business value by utilizing cutting-edge technology in applications, Digital Experience, Cloud, Intelligent Automation, and Sustainability. Specialize in delivering comprehensive solutions for digital content, learning services, and content workflows to achieve substantial business growth. For their line of 100 V RF GaN products, Integra announced the inclusion of seven more devices with power levels up to 5 kW in a single transistor for the avionics, directed energy, electronic warfare, radar, and scientific application areas.

    These items use Integra's 100 V RF GaN technology to give the maximum power and efficiency possible in a single transistor while maintaining stable operating junction temperatures.

    Key Companies in the RF GaN Market market include

    Industry Developments

    • Q2 2024: Skyworks leads the market, followed by Qorvo and Murata, securing design wins in consumer end systems Skyworks, Qorvo, and Murata have secured significant design wins for RF GaN in consumer end systems, reflecting ongoing business development and customer acquisition in the sector.

    Future Outlook

    RF GaN Market Future Outlook

    The RF GaN Market is poised for growth at a remarkable 30.97% CAGR from 2024 to 2035, driven by advancements in telecommunications, defense applications, and consumer electronics.

    New opportunities lie in:

    • Develop innovative RF GaN solutions for 5G and beyond telecommunications infrastructure.
    • Expand applications in satellite communications and aerospace for enhanced performance.
    • Invest in research for energy-efficient RF GaN devices to meet sustainability goals.

    By 2035, the RF GaN Market is expected to achieve substantial growth, solidifying its position as a key technology in various sectors.

    Market Segmentation

    RF GaN Type Outlook

    • GaN-On-SiC
    • GaN-On-Silicon
    • GaN-On-Diamond

    RF GaN Regional Outlook

    • US
    • Canada

    RF GaN Application Outlook

    • IT & Telecomm
    • Aerospace
    • Military & Defense

    Report Scope

    Report Attribute/Metric Details
    Market Size 2024 USD 0.86 billion
    Market Size 2025 USD 1.12 billion
    Market Size 2034 USD 12.77 billion
    Compound Annual Growth Rate (CAGR) 31.0% (2025-2034)
    Base Year 2023
    Market Forecast Period 2025-2034
    Historical Data 2020- 2023
    Market Forecast Units Value (USD Billion)
    Report Coverage Revenue Forecast, Market Competitive Landscape, Growth Factors, and Trends
    Segments Covered Type, Application, and Region
    Geographies Covered North America, Europe, AsiaPacific, and the Rest of the World
    Countries Covered The U.S., Canada, German, France, the UK, Italy, Spain, China, Japan, India, Australia, South Korea, and Brazil
    Key Companies Profiled NXP Semiconductors (Netherlands), Analog Devices, Inc. (US), ST Microelectronics N.V. (Switzerland).
    Key Market Opportunities Innovation In linear ization and power efficiency of RF power amplifiers
    Key Market Dynamics Increasing adoption of energy & power applications. Increased demand for IT & Telecommunication industry

    Market Highlights

    Author
    Ankit Gupta
    Senior Research Analyst

    Ankit Gupta is an analyst in market research industry in ICT and SEMI industry. With post-graduation in "Telecom and Marketing Management" and graduation in "Electronics and Telecommunication" vertical he is well versed with recent development in ICT industry as a whole. Having worked on more than 150+ reports including consultation for fortune 500 companies such as Microsoft and Rio Tinto in identifying solutions with respect to business problems his opinions are inclined towards mixture of technical and managerial aspects.

    Leave a Comment

    FAQs

    How much is the RF GaN market?

    The RF GaN Market size was valued at USD 0.86 Billion in 2024.

    What is the growth rate of the RF GaN market?

    The global market is projected to grow at a CAGR of 31.0% during the forecast period, 2025-2034.

    Which Region held the largest market share in the RF GaN market?

    North America had the largest share of the global market

    Who are the key players in the RF GaN market?

    The key players in the market are NXP Semiconductors (Netherlands), Analog Devices, Inc. (US), and ST Microelectronics N.V. (Switzerland).

    Which type led the RF GaN market?

    The GaN-On-SiC RF GaN category dominated the market in 2022.

    Which Application had the largest market share in the RF GaN market?

    The Military & Defense had the largest share of the global market.

    1. 'TABLE OF CONTENTS
    2. EXECUTIVE SUMMARY 14
      1. MARKET ATTRACTIVENESS
    3. ANALYSIS 15
    4. MARKET INTRODUCTION 16
      1. DEFINITION 16
      2. SCOPE OF THE STUDY 16
      3. RESEARCH OBJECTIVE 16
      4. MARKET STRUCTURE 16
    5. RESEARCH METHODOLOGY 17
    6. MARKET DYNAMICS 24
      1. INTRODUCTION 24
    7. DRIVERS 25
      1. INCREASING ADOPTION OF ENERGY & POWER APPLICATIONS: 25
        1. INCREASED DEMAND FOR IT & TELECOMMUNICATION EQUIPMENT 25
      2. RESTRAINT
        1. COMPETITION FROM SILICON CARBIDE (SIC) DEVICES 25
      3. OPPORTUNITY
        1. INNOVATION IN LINEARIZATION AND POWER EFFICIENCY OF RF POWER AMPLIFIERS
      4. TECHNOLOGICAL TREND 29
        1. GAN OUTPERFORMING OTHER SEMICONDUCTORS
    8. IN RF APPLICATIONS 29
      1. HIGH-PERFORMANCE WIDEBAND POWER AMPLIFIERS USE
    9. GAN DEVICES 30
    10. MARKET FACTOR ANALYSIS 31
      1. SUPPLY/VALUE CHAIN ANALYSIS
        1. MATERIAL SUPPLIERS 31
        2. ORIGINAL EQUIPMENT MANUFACTURER (OEMS)
        3. DISTRIBUTOR AND RETAILER 32
        4. END USER 32
      2. PORTER’S
    11. FIVE FORCES MODEL 32
      1. THREAT OF NEW ENTRANTS 33
        1. BARGAINING
    12. POWER OF SUPPLIERS 33
      1. BARGAINING POWER OF BUYERS 33
        1. THREAT
    13. OF SUBSTITUTES 33
      1. INTENSITY OF RIVALRY 33
    14. GLOBAL RF GAN MARKET,
    15. BY TYPE 34
      1. INTRODUCTION 34
      2. GAN ON SIC 35
      3. GAN ON SILICON
      4. GAN ON DEMAND 35
    16. GLOBAL RF GAN MARKET, BY APPLICATION 36
    17. INTRODUCTION 36
      1. 5G WIRELESS INFRASTRUCTURE 37
      2. AEROSPACE 37
      3. MILITARY & DEFENSE 38
      4. OTHERS 38
    18. GLOBAL RF GAN MARKET,
    19. BY REGION 39
      1. INTRODUCTION 39
      2. NORTH AMERICA 41
        1. NORTH
    20. AMERICA: RF GAN MARKET SHARE, BY COUNTRY, 2023(% SHARE) 41
      1. NORTH AMERICA:
    21. RF GAN MARKET SHARE, BY TYPE, 2023(% SHARE) 42
      1. NORTH AMERICA: RF GAN
    22. MARKET SHARE, BY APPLICATION, 2023(% SHARE) 43
      1. US 43
        1. US:
    23. RF GAN MARKET SHARE, BY TYPE, 2025-2034 (USD MILLION) 44
      1. US: RF GAN
    24. MARKET SHARE, BY APPLICATION, 2023(% SHARE) 44
      1. CANADA 44
    25. CANADA: RF GAN MARKET SHARE, BY TYPE, 2025-2034 (USD MILLION) 44
      1. CANADA:
    26. RF GAN MARKET SHARE, BY APPLICATION, 2023(% SHARE) 45
      1. MEXICO 45
    27. MEXICO: RF GAN MARKET SHARE, BY TYPE, 2025-2034 (USD MILLION) 45
      1. MEXICO:
    28. RF GAN MARKET SHARE, BY APPLICATION, 2023(% SHARE) 45
      1. EUROPE 46
    29. EUROPE: RF GAN MARKET SHARE, BY COUNTRY, 2023(% SHARE) 46
      1. EUROPE: RF
    30. GAN MARKET SHARE, BY TYPE, 2023(% SHARE) 48
      1. EUROPE: RF GAN MARKET SHARE,
    31. BY APPLICATION, 2023(% SHARE) 49
      1. UK 49
        1. UK: RF GAN MARKET
    32. SHARE, BY TYPE, 2025-2034 (USD MILLION) 50
      1. UK: RF GAN MARKET SHARE,
    33. BY APPLICATION, 2023(% SHARE) 50
      1. FRANCE 50
        1. FRANCE: RF GAN
    34. MARKET SHARE, BY TYPE, 2025-2034 (USD MILLION) 50
      1. FRANCE: RF GAN MARKET
    35. SHARE, BY APPLICATION, 2023(% SHARE) 51
      1. GERMANY 51
        1. GERMANY:
    36. RF GAN MARKET SHARE, BY TYPE, 2025-2034 (USD MILLION) 51
      1. GERMANY: RF
    37. GAN MARKET SHARE, BY APPLICATION, 2023(% SHARE) 51
      1. ITALY 52
    38. ITALY: RF GAN MARKET SHARE, BY TYPE, 2025-2034 (USD MILLION) 52
      1. ITALY:
    39. RF GAN MARKET SHARE, BY APPLICATION, 2023(% SHARE) 52
      1. REST OF EUROPE
        1. REST OF EUROPE: RF GAN MARKET SHARE, BY TYPE, 2025-2034 (USD MILLION)
      2. ASIA-PACIFIC 54
        1. ASIA-PACIFIC: RF GAN MARKET SHARE, BY COUNTRY,
    40. (% SHARE) 54
      1. ASIA-PACIFIC: RF GAN MARKET SHARE, BY TYPE, 2023(% SHARE)
        1. ASIA-PACIFIC: RF GAN MARKET SHARE, BY APPLICATION, 2023(% SHARE) 56
        2. JAPAN 57
    41. MILLION) 57
      1. JAPAN: RF GAN MARKET SHARE, BY APPLICATION, 2023(% SHARE)
        1. CHINA 58
    42. (USD MILLION) 58
      1. CHINA: RF GAN MARKET SHARE, BY APPLICATION, 2023(%
    43. SHARE) 58
      1. INDIA 59
        1. INDIA: RF GAN MARKET SHARE, BY TYPE,
    44. 2034 (USD MILLION) 59
      1. INDIA: RF GAN MARKET SHARE, BY APPLICATION,
    45. (% SHARE) 59
      1. SOUTH KOREA 60
        1. SOUTH KOREA: RF GAN MARKET
    46. SHARE, BY TYPE, 2025-2034 (USD MILLION) 60
      1. SOUTH KOREA: RF GAN MARKET
    47. SHARE, BY APPLICATION, 2023(% SHARE) 60
      1. REST OF ASIA-PACIFIC 61
    48. REST OF ASIA-PACIFIC: RF GAN MARKET SHARE, BY TYPE, 2025-2034 (USD MILLION) 61
      1. REST OF ASIA-PACIFIC: RF GAN MARKET SHARE, BY APPLICATION, 2023(% SHARE)
      2. MIDDLE EAST & AFRICA 62
        1. MIDDLE EAST & AFRICA: RF
    49. GAN MARKET SHARE, BY TYPE, 2023(% SHARE) 62
      1. MIDDLE EAST & AFRICA:
    50. RF GAN MARKET SHARE, BY APPLICATION, 2023(% SHARE) 63
      1. SOUTH AMERICA 64
        1. SOUTH AMERICA: RF GAN MARKET SHARE, BY TYPE, 2023(% SHARE) 64
    51. SOUTH AMERICA: RF GAN MARKET SHARE, BY APPLICATION, 2023(% SHARE) 65
    52. COMPETITIVE LANDSCAPE 66
      1. COMPETITIVE BENCHMARKING 67
      2. VENDOR SHARE ANALYSIS
      3. RECENT DEVELOPMENTS 68
        1. PARTNERSHIPS/AGREEMENTS/CONTRACTS/COLLABORATIONS
        2. BUSINESS EXPANSIONS/ACQUISITIONS 69
        3. PRODUCT LAUNCHES/DEVELOPMENTS
    53. COMPANY PROFILES 72
      1. NXP SEMICONDUCTORS 72
        1. COMPANY
    54. OVERVIEW 72
      1. FINANCIAL OVERVIEW 73
        1. PRODUCTS/SOLUTIONS/SERVICES
    55. OFFERED 74
      1. KEY DEVELOPMENTS 74
        1. SWOT ANALYSIS 75
    56. KEY STRATEGIES 75
      1. ANALOG DEVICES INC. 76
        1. COMPANY OVERVIEW
        2. FINANCIAL OVERVIEW 77
        3. PRODUCTS/SOLUTIONS/SERVICES OFFERED
        4. KEY DEVELOPMENTS 78
        5. SWOT ANALYSIS 79
        6. KEY
    57. STRATEGIES 79
      1. STMICROELECTRONCIS N.V 80
        1. COMPANY OVERVIEW 80
        2. FINANCIAL OVERVIEW 81
        3. PRODUCTS/SOLUTIONS/SERVICES OFFERED 82
        4. KEY DEVELOPMENTS 82
        5. SWOT ANALYSIS 83
        6. KEY STRATEGIES
      2. TOSHIBA CORPORATION 84
        1. COMPANY OVERVIEW 84
    58. FINANCIAL OVERVIEW 85
      1. PRODUCTS/SOLUTIONS/SERVICES OFFERED 85
    59. KEY DEVELOPMENTS 86
      1. SWOT ANALYSIS 87
        1. KEY STRATEGIES 87
      2. ROHM SEMICONDUCTORS 88
        1. COMPANY OVERVIEW 88
        2. FINANCIAL
    60. OVERVIEW 89
      1. PRODUCTS/SOLUTIONS/SERVICES OFFERED 89
        1. KEY DEVELOPMENTS
        2. SWOT ANALYSIS 91
        3. KEY STRATEGIES 91
      2. WOLFSPEED,
    61. INC. (CREE INC.) 92
      1. COMPANY OVERVIEW 92
        1. PRODUCTS/SOLUTIONS/SERVICES
    62. OFFERED 93
      1. KEY DEVELOPMENTS 93
        1. SWOT ANALYSIS 94
    63. KEY STRATEGIES 94
      1. ATHERCOMM INC. 95
        1. COMPANY OVERVIEW 95
        2. FINANCIAL OVERVIEW 95
        3. PRODUCTS/SOLUTIONS/SERVICES OFFERED 96
        4. KEY DEVELOPMENTS 96
      2. MICROCHIP TECHNOLOGY INCORPORATED 97
    64. COMPANY OVERVIEW 97
      1. FINANCIAL OVERVIEW 98
        1. PRODUCTS/SOLUTIONS/SERVICES
    65. OFFERED 99
      1. KEY DEVELOPMENTS 99
        1. SWOT ANALYSIS 100
    66. KEY STRATEGIES 100
      1. RAYTHEON COMPANY 101
        1. COMPANY OVERVIEW 101
        2. FINANCIAL OVERVIEW 102
        3. PRODUCTS/SOLUTIONS/SERVICES OFFERED
        4. KEY DEVELOPMENTS 103
        5. SWOT ANALYSIS 103
        6. KEY
    67. STRATEGIES 103
      1. QORVO INC. 104
        1. COMPANY OVERVIEW 104
    68. FINANCIAL OVERVIEW 105
      1. PRODUCTS/SOLUTIONS/SERVICES OFFERED 106
    69. KEY DEVELOPMENTS 107
      1. SWOT ANALYSIS 108
        1. KEY STRATEGIES
      2. MITSUBISHI ELECTRIC CORPORATION 109
        1. COMPANY OVERVIEW
        2. FINANCIAL OVERVIEW 110
        3. PRODUCTS/SOLUTIONS/SERVICES
    70. OFFERED 110
      1. KEY DEVELOPMENTS 111
        1. SWOT ANALYSIS 111
        2. KEY STRATEGIES 111
      2. RFHIC CORPORATION 112
        1. COMPANY
    71. OVERVIEW 112
      1. FINANCIAL OVERVIEW 112
        1. PRODUCTS/SOLUTIONS/SERVICES
    72. OFFERED 113
      1. KEY DEVELOPMENTS 113
        1. SWOT ANALYSIS 113
        2. KEY STRATEGIES 113
      2. MERCURY SYSTEMS INC 114
        1. COMPANY
    73. OVERVIEW 114
      1. FINANCIAL OVERVIEW 115
        1. PRODUCTS/SOLUTIONS/SERVICES
    74. OFFERED 115
      1. KEY DEVELOPMENTS 115
        1. SWOT ANALYSIS 116
        2. KEY STRATEGIES 116
      2. SUMITOMO ELECTRIC INDUSTRIES, LTD. 117
        1. COMPANY OVERVIEW 117
        2. FINANCIAL OVERVIEW 118
    75. PRODUCTS OFFERED 119
      1. KEY DEVELOPMENTS 119
        1. SWOT ANALYSIS
        2. KEY STRATEGIES 120
      2. MACOM 121
        1. COMPANY OVERVIEW
        2. FINANCIAL OVERVIEW 122
        3. PRODUCTS OFFERED 123
    76. KEY DEVELOPMENTS 123
      1. SWOT ANALYSIS 124
        1. KEY STRATEGIES
      2. INTEGRA TECHNOLOGIES, INC. 125
        1. COMPANY OVERVIEW 125
        2. FINANCIAL OVERVIEW 125
        3. PRODUCTS OFFERED 125
    77. KEY DEVELOPMENTS 126
    78. GAN MARKET, BY TYPE, 2023 & 2032 (USD MILLION) 34
    79. MARKET, BY APPLICATION, 2023 & 2032 (USD MILLION) 36
    80. GAN MARKET, BY REGION, 2023 & 2032(USD MILLION) 40
    81. RF GAN MARKET, BY COUNTRY, 2025-2034 (USD MILLION) 42
    82. RF GAN MARKET, BY TYPE, 2025-2034 (USD MILLION) 42
    83. GAN MARKET, BY APPLICATION, 2025-2034 (USD MILLION) 43
    84. BY TYPE, 2025-2034 (USD MILLION) 44
    85. 2034 (USD MILLION) 44
    86. (USD MILLION) 44
    87. (USD MILLION) 45
    88. EUROPE: RF GAN MARKET, BY APPLICATION, 2025-2034 (USD MILLION) 49
    89. UK: RF GAN MARKET, BY TYPE, 2025-2034 (USD MILLION) 50
    90. MARKET, BY APPLICATION, 2025-2034 (USD MILLION) 50
    91. MARKET, BY TYPE, 2025-2034 (USD MILLION) 50
    92. BY APPLICATION, 2025-2034 (USD MILLION) 51
    93. BY TYPE, 2025-2034 (USD MILLION) 51
    94. 2034 (USD MILLION) 51
    95. (USD MILLION) 52
    96. MILLION) 52
    97. MILLION) 53
    98. (USD MILLION) 53
    99. (USD MILLION) 55
    100. MILLION) 55
    101. (USD MILLION) 56
    102. CHINA: RF GAN MARKET, BY APPLICATION, 2025-2034 (USD MILLION) 58
    103. INDIA: RF GAN MARKET, BY TYPE, 2025-2034 (USD MILLION) 59
    104. GAN MARKET, BY APPLICATION, 2025-2034 (USD MILLION) 59
    105. RF GAN MARKET, BY TYPE, 2025-2034 (USD MILLION) 60
    106. GAN MARKET, BY APPLICATION, 2025-2034 (USD MILLION) 60
    107. RF GAN MARKET, BY TYPE, 2025-2034 (USD MILLION) 61
    108. RF GAN MARKET, BY APPLICATION, 2025-2034 (USD MILLION) 61
    109. & AFRICA: RF GAN MARKET, BY TYPE, 2025-2034 (USD MILLION) 62
    110. EAST & AFRICA: RF GAN MARKET, BY APPLICATION, 2025-2034 (USD MILLION) 63
    111. BUSINESS EXPANSIONS/ACQUISITIONS 69
    112. NXP SEMICONDUCTORS: KEY DEVELOPMENTS 74
    113. OFFERED 78
    114. STMICROELECTRONICS N.V: PRODUCTS/SOLUTIONS/SERVICES OFFERED 82
    115. N.V: KEY DEVELOPMENTS 82
    116. OFFERED 85
    117. ROHM SEMICONDUCTORS: PRODUCTS/SOLUTIONS/SERVICES OFFERED 89
    118. KEY DEVELOPMENTS 90
    119. PRODUCTS/SOLUTIONS/SERVICES OFFERED 96
    120. PRODUCTS/SOLUTIONS/SERVICES OFFERED 99
    121. KEY DEVELOPMENTS 99
    122. OFFERED 102
    123. INC.: PRODUCTS/SOLUTIONS/SERVICES OFFERED 106
    124. RFHIC CORPORATION: PRODUCTS/SOLUTIONS/SERVICES OFFERED 113
    125. CORPORATION: KEY DEVELOPMENTS 113
    126. OFFERED 115
    127. OFFERED 119
    128. DEVELOPMENTS 123
    129. TECHNOLOGIES, INC.: PRODUCTS/SOLUTIONS/SERVICES OFFERED 125
    130. LIST
    131. OF FIGURES
    132. APPROACHES 21
    133. TECHNOLOGICAL TREND 29
    134. GLOBAL RF GAN MARKET, BY TYPE, 2023(%) 34
    135. BY TYPE, 2023 & 2032 (USD MILLION) 35
    136. TYPE, 2023(%) 36
    137. (USD MILLION) 37
    138. (USD MILLION) 41
    139. (USD MILLION) 42
    140. 2034 (USD MILLION) 43
    141. (% SHARE) 46
    142. (USD MILLION) 46
    143. (USD MILLION) 48
    144. (USD MILLION) 49
    145. SHARE) 54
    146. (USD MILLION) 54
    147. 2034 (USD MILLION) 55
    148. APPLICATION, 2025-2034 (USD MILLION) 56
    149. RF GAN MARKET SHARE, BY TYPE, 2025-2034 (USD MILLION) 62
    150. & AFRICA: RF GAN MARKET SHARE, BY APPLICATION, 2025-2034 (USD MILLION) 63
    151. (USD MILLION) 65
    152. FINANCIAL OVERVIEW SNAPSHOT 73
    153. ANALOG DEVICES INC.: SWOT ANALYSIS 79
    154. FINANCIAL OVERVIEW SNAPSHOT 81
    155. TOSHIBA CORPORATION: SWOT ANALYSIS 87
    156. OVERVIEW SNAPSHOT 89
    157. WOLFSPEED, INC.: FINANCIAL OVERVIEW SNAPSHOT 92
    158. SWOT ANALYSIS 94
    159. SNAPSHOT 98
    160. COMPANY: SWOT ANALYSIS 103
    161. CORPORATION: FINANCIAL OVERVIEW SNAPSHOT 110
    162. CORPORATION: SWOT ANALYSIS 111
    163. SNAPSHOT 112
    164. MERCURY SYSTEM INC: FINANCIAL OVERVIEW SNAPSHOT 115
    165. INC: SWOT ANALYSIS 116
    166. OVERVIEW SNAPSHOT 118
    167. SWOT ANALYSIS 124'

    RF GaN Market Segmentation

    RF GaN Market Type Outlook (USD Billion, 2020-2034)

    • GaN-On-SiC
    • GaN-On-Silicon
    • GaN-On-Diamond

    RF GaN Application Outlook (USD Billion, 2020-2034)

    • IT & Telecomm
    • Aerospace
    • Military & Defense

    RF GaN Market Regional Outlook (USD Billion, 2020-2034)

    • North America Outlook (USD Billion, 2020-2034)
      • North America RF GaN Market by Type
        • GaN-On-SiC
        • GaN-On-Silicon
        • GaN-On-Diamond
      • North America RF GaN Market by Application
        • IT & Telecomm
        • Aerospace
        • Military & Defense
      • US Outlook (USD Billion, 2020-2034)
      • US RF GaN Market by Type
        • GaN-On-SiC
        • GaN-On-Silicon
        • GaN-On-Diamond
      • USRF GaN Market by Application
        • IT & Telecomm
        • Aerospace
        • Military & Defense
      • CANADA Outlook (USD Billion, 2020-2034)
      • CANADA RF GaN Market by Type
        • GaN-On-SiC
        • GaN-On-Silicon
        • GaN-On-Diamond
      • CANADARF GaN Market by Application
        • IT & Telecomm
        • Aerospace
        • Military & Defense
    • Europe Outlook (USD Billion, 2020-2034)
      • Europe RF GaN Market by Type
        • GaN-On-SiC
        • GaN-On-Silicon
        • GaN-On-Diamond
      • Europe RF GaN Market by Application
        • IT & Telecomm
        • Aerospace
        • Military & Defense
      • Germany Outlook (USD Billion, 2020-2034)
      • Germany RF GaN Market by Type
        • GaN-On-SiC
        • GaN-On-Silicon
        • GaN-On-Diamond
      • Germany RF GaN Market by Application
        • IT & Telecomm
        • Aerospace
        • Military & Defense
      • France Outlook (USD Billion, 2020-2034)
      • France RF GaN Market by Type
        • GaN-On-SiC
        • GaN-On-Silicon
        • GaN-On-Diamond
      • France RF GaN Market by Application
        • IT & Telecomm
        • Aerospace
        • Military & Defense
      • UK Outlook (USD Billion, 2020-2034)
      • UK RF GaN Market by Type
        • GaN-On-SiC
        • GaN-On-Silicon
        • GaN-On-Diamond
      • UKRF GaN Market by Application
        • IT & Telecomm
        • Aerospace
        • Military & Defense
      • ITALY Outlook (USD Billion, 2020-2034)
      • ITALY RF GaN Market by Type
        • GaN-On-SiC
        • GaN-On-Silicon
        • GaN-On-Diamond
      • ITALYRF GaN Market by Application
        • IT & Telecomm
        • Aerospace
        • Military & Defense
      • SPAIN Outlook (USD Billion, 2020-2034)
      • Spain RF GaN Market by Type
        • GaN-On-SiC
        • GaN-On-Silicon
        • GaN-On-Diamond
      • Spain RF GaN Market by Application
        • IT & Telecomm
        • Aerospace
        • Military & Defense
      • Rest Of Europe Outlook (USD Billion, 2020-2034)
      • Rest Of Europe RF GaN Market by Type
        • GaN-On-SiC
        • GaN-On-Silicon
        • GaN-On-Diamond
      • REST OF EUROPERF GaN Market by Application
        • IT & Telecomm
        • Aerospace
        • Military & Defense
    • Asia-Pacific Outlook (USD Billion, 2020-2034)
      • Asia-Pacific RF GaN Market by Type
        • GaN-On-SiC
        • GaN-On-Silicon
        • GaN-On-Diamond
      • Asia-Pacific RF GaN Market by Application
        • IT & Telecomm
        • Aerospace
        • Military & Defense
      • China Outlook (USD Billion, 2020-2034)
      • China RF GaN Market by Type
        • GaN-On-SiC
        • GaN-On-Silicon
        • GaN-On-Diamond
      • China RF GaN Market by Application
        • IT & Telecomm
        • Aerospace
        • Military & Defense
      • Japan Outlook (USD Billion, 2020-2034)
      • Japan RF GaN Market by Type
        • GaN-On-SiC
        • GaN-On-Silicon
        • GaN-On-Diamond
      • Japan RF GaN Market by Application
        • IT & Telecomm
        • Aerospace
        • Military & Defense
      • India Outlook (USD Billion, 2020-2034)
      • India RF GaN Market by Type
        • GaN-On-SiC
        • GaN-On-Silicon
        • GaN-On-Diamond
      • India RF GaN Market by Application
        • IT & Telecomm
        • Aerospace
        • Military & Defense
      • Australia Outlook (USD Billion, 2020-2034)
      • Australia RF GaN Market by Type
        • GaN-On-SiC
        • GaN-On-Silicon
        • GaN-On-Diamond
      • Australia RF GaN Market by Application
        • IT & Telecomm
        • Aerospace
        • Military & Defense
      • Rest of Asia-Pacific Outlook (USD Billion, 2020-2034)
      • Rest of Asia-Pacific RF GaN Market by Type
        • GaN-On-SiC
        • GaN-On-Silicon
        • GaN-On-Diamond
      • Rest of Asia-Pacific RF GaN Market by Application
        • IT & Telecomm
        • Aerospace
        • Military & Defense
    • Rest of the World Outlook (USD Billion, 2020-2034)
      • Rest of the World RF GaN Market by Type
        • GaN-On-SiC
        • GaN-On-Silicon
        • GaN-On-Diamond
      • Rest of the World RF GaN Market by Application
        • IT & Telecomm
        • Aerospace
        • Military & Defense
      • Middle East Outlook (USD Billion, 2020-2034)
      • Middle East RF GaN Market by Type
        • GaN-On-SiC
        • GaN-On-Silicon
        • GaN-On-Diamond
      • Middle East RF GaN Market by Application
        • IT & Telecomm
        • Aerospace
        • Military & Defense
      • Africa Outlook (USD Billion, 2020-2034)
      • Africa RF GaN Market by Type
        • GaN-On-SiC
        • GaN-On-Silicon
        • GaN-On-Diamond
      • Africa RF GaN Market by Application
        • IT & Telecomm
        • Aerospace
        • Military & Defense
      • Latin America Outlook (USD Billion, 2020-2034)
      • Latin America RF GaN Market by Type
        • GaN-On-SiC
        • GaN-On-Silicon
        • GaN-On-Diamond
      • Latin America RF GaN Market by Application
        • IT & Telecomm
        • Aerospace
        • Military & Defense
    RF GaN Market Research Report—Global Forecast till 2034 Infographic
    Free Sample Request

    Kindly complete the form below to receive a free sample of this Report

    Customer Strories

    “I am very pleased with how market segments have been defined in a relevant way for my purposes (such as "Portable Freezers & refrigerators" and "last-mile"). In general the report is well structured. Thanks very much for your efforts.”

    Victoria Milne Founder
    Case Study

    Chemicals and Materials