• Cat-intel
  • MedIntelliX
  • Resources
  • About Us
  • Request Free Sample ×

    Kindly complete the form below to receive a free sample of this Report

    Leading companies partner with us for data-driven Insights

    clients tt-cursor

    Restaurant Delivery Robot Market

    ID: MRFR/SEM/9512-CR
    188 Pages
    Ankit Gupta
    May 2023

    Restaurant Delivery Robots Market Research Report Information By Robot Type (Semi-Autonomous And Fully Autonomous), Service Type (Limited And Full-Service), Restaurant Type (Independent And Chained), By Load Capacity (10 KG, 10-50 KG and more than 50 KG), By Region (North America, Europe, Asia-Pacific, Middle East & Africa, and South America) -Industry Forecast till 2032

    Share:
    Download PDF ×

    We do not share your information with anyone. However, we may send you emails based on your report interest from time to time. You may contact us at any time to opt-out.

    Restaurant Delivery Robot Market Research Report - Global Forecast till 2032 Infographic
    Purchase Options
    $ 4,950.0
    $ 5,950.0
    $ 7,250.0
    Table of Contents

    Restaurant Delivery Robot Market Summary

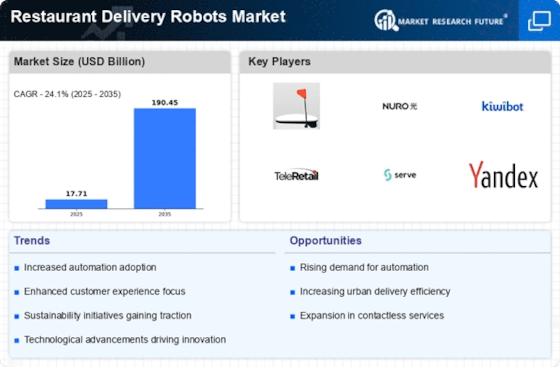
    As per Market Research Future Analysis, the Global Restaurant Delivery Robots Market was valued at USD 14.27 billion in 2023 and is projected to reach USD 99.64 billion by 2032, growing at a CAGR of 24.10% from 2024 to 2032. The market is driven by rising labor costs and the increasing need for automation in restaurants. The deployment of robots enhances productivity, reduces food waste, and addresses labor shortages, making them an attractive solution for restaurant owners.

    Key Market Trends & Highlights

    The restaurant delivery robots market is witnessing significant trends driven by automation and technological advancements.

    • Market Size in 2023: USD 14.27 billion; projected to grow to USD 99.64 billion by 2032.
    • CAGR from 2024 to 2032: 24.10%; indicating strong growth potential.
    • Semi-autonomous robots held the largest market share in 2022; fully autonomous segment expected to grow at 25.22% CAGR.
    • North America is the largest regional market, with high adoption rates in major metropolitan areas.

    Market Size & Forecast

    2023 Market Size USD 14.27 billion
    2024 Market Size USD 17.71 billion
    2032 Market Size USD 99.64 billion
    CAGR (2024-2032) 24.10%

    Major Players

    Key companies include Amazon Robotics, Robby Technologies, Boston Dynamics, Eliport, Starship Technologies, Cleveron, Miso Robotics, Kitchen Robotics, Bear Robotics, Inc., and Cyan Robotics.

    Restaurant Delivery Robot Market Trends

      • GROWING AUTOMATION ACROSS RESTAURANTS

    The importance of AI and robotics in the service sector is growing, and they are revolutionizing old procedures. As technology advances, there will be a significant shift in the types of jobs performed by humans and by AI-enabled devices. Robotics deployment has taken the restaurants automation to a new level. Robots boost the restaurant's productivity. Robots increase the effectiveness of food safety procedures by reducing order inaccuracies, both in collecting orders and preparing the meal. They also reduce food waste and consistently make food according to recipe specifications. For example, the automatic fry cook, Flippy, is used by CaliBurger.

    More than twice as many burgers can be cooked in an hour by Flippy as by its human equivalents. Not only does production rise, but Flippy also earns merely $3 per hour, works nonstop, and attracts more visitors who want to watch him in action.

    In Addition, the manpower problem that many restaurants are experiencing can be resolved by using robots like PuduBot for food delivery. Only 3% of restaurant owners reported that they were not having trouble hiring in November 2021 as a result of 1 million restaurant and hotel employees quitting their jobs. These open positions are filled by robots, ending the restaurant's employment difficulties.

    The restaurant sector is gradually being replaced by robots and automation as a result of their ability to reduce costs while increasing productivity. Automation seems to be the way of the future for the restaurant sector, even if there will still be a need for human workers and flaws that need to be fixed.

    The integration of autonomous delivery systems in the restaurant sector appears to enhance operational efficiency and customer satisfaction, suggesting a transformative shift in food service logistics.

    U.S. Department of Transportation

    Restaurant Delivery Robot Market Drivers

    Market Growth Projections

    Sustainability Initiatives

    Sustainability initiatives are becoming increasingly relevant in the Global Restaurant Delivery Robots Market Industry. Many restaurants are seeking to reduce their carbon footprints and enhance their environmental sustainability. Delivery robots, often powered by electric batteries, present a greener alternative to traditional delivery methods that rely on vehicles emitting greenhouse gases. As restaurants adopt eco-friendly practices, the integration of delivery robots aligns with their sustainability goals. This trend not only appeals to environmentally conscious consumers but also positions restaurants as leaders in sustainable operations, potentially driving further growth in the market.

    Technological Advancements

    The Global Restaurant Delivery Robots Market Industry is experiencing rapid technological advancements that enhance the efficiency and reliability of delivery robots. Innovations in artificial intelligence, machine learning, and robotics are enabling these machines to navigate complex environments autonomously. For instance, companies are integrating advanced sensors and cameras that allow robots to detect obstacles and adjust their paths in real time. This evolution not only improves delivery times but also reduces operational costs for restaurants. As a result, the market is projected to reach 17.7 USD Billion in 2024, indicating a strong demand for these technologies in the food service sector.

    Urbanization and Changing Demographics

    Urbanization and shifting demographics are key drivers of the Global Restaurant Delivery Robots Market Industry. As more people move to urban areas, the demand for quick and efficient food delivery services rises. Younger generations, who are more tech-savvy and accustomed to on-demand services, are particularly inclined to embrace delivery robots. This demographic shift is likely to create a favorable environment for the adoption of robotic delivery solutions. The market's growth trajectory, with a projected CAGR of 24.1% from 2025 to 2035, reflects the increasing integration of technology in urban food delivery systems.

    Growing Demand for Contactless Delivery

    In the Global Restaurant Delivery Robots Market Industry, there is a notable increase in consumer preference for contactless delivery options. This trend is driven by a desire for convenience and safety, as customers seek to minimize physical interactions during the ordering process. Delivery robots provide a solution by autonomously transporting food from restaurants to customers' doorsteps without human intervention. This shift in consumer behavior is likely to propel the market forward, with projections suggesting it could grow to 190.4 USD Billion by 2035. As restaurants adapt to these changing preferences, the integration of delivery robots becomes increasingly vital.

    Labor Shortages in the Food Service Sector

    The Global Restaurant Delivery Robots Market Industry is significantly influenced by ongoing labor shortages within the food service sector. Many restaurants face challenges in hiring and retaining staff, which can hinder their ability to meet customer demands. Delivery robots offer a viable solution by alleviating some of the pressure on human resources. By automating the delivery process, restaurants can maintain service levels even with reduced staff. This trend is expected to contribute to the market's growth, as businesses increasingly turn to technology to fill gaps in labor availability and improve operational efficiency.

    Market Segment Insights

    Restaurant Delivery Robots, Robot Type Insights

    Based on the robot type, the market has been segmented into semi-autonomous and fully autonomous. Of them, semi-autonomous segment is the largest segment of the restaurant delivery robots market in 2022. However, the fully autonomous segment is expected to register a high CAGR of 25.22% during the forecast period.

    Semi-autonomous robots typically require some level of human intervention or control, while fully autonomous robots are designed to operate independently without any human involvement. This suggests that there may be some hesitation among restaurant owners to fully rely on autonomous robots for delivery, which could be driving the higher adoption of semi-autonomous robots at present. However, the expected high growth rate of the fully autonomous segment suggests that this technology is becoming increasingly reliable and trusted in the industry and could potentially overtake the semi-autonomous segment in the future.

    It will be interesting to see how the market evolves as these technologies continue to develop and improve.

    FIGURE 2: RESTAURANT DELIVERY ROBOTS MARKET SHARE BY ROBOT TYPE 2022 VS 2032 (USD BILLION)

    Source: Secondary Research, Primary Research, MRFR Database and Analyst Review

     Restaurant Delivery Robots Service Type Insights

    Based on service type, the restaurant delivery robots market has segmented into limited and full-service. Limited segmented held the largest market share in 2022. Limited service typically refers to fast food or quick service restaurants, where the focus is on providing fast, efficient service and delivery. Full-service restaurants, on the other hand, typically offer a more leisurely dining experience with table service and a wider range of menu options.

    Restaurant Delivery Robots Restaurant Type Insights

    Depending on the restaurant type, the market has been segmented into independent and chained. Of them, the independent segment accounted for the largest share in the market in 2022 and expected to continue its dominance over the forecast duration.

    A restaurant that is independently owned and operated is one that is not a part of any corporate chain. All decisions relating to the operations of the restaurant must be made by the owner.

    Restaurant Delivery Robots Loads Capacity Insights

    Depending on the load capacity, the market has been segmented into up to 10 KG, 10-50 KG and more than 50 KG. Of them, 10-50 kg segment accounted for the largest share of 47.90% in the market in 2022 and expected to continue its dominance over the forecast duration.

    Get more detailed insights about Restaurant Delivery Robot Market Research Report - Global Forecast till 2032

    Regional Insights

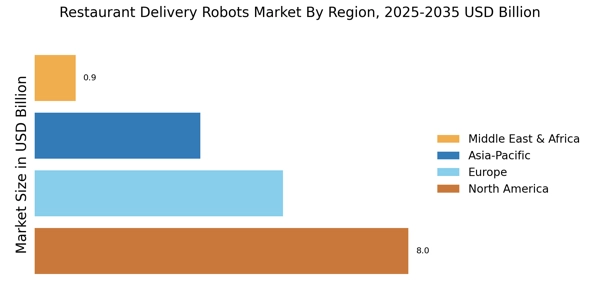
    By Region, the study segments the market into North America, Europe, Asia-Pacific, Middle East & Africa, and South America. North America holds a largest market share in the global market.

    North America is a mature market for restaurant delivery robots, with a high level of adoption in major metropolitan areas such as New York, Los Angeles, and San Francisco. The region also has a large number of fast-food and quick-service restaurants, which may be driving the adoption of restaurant delivery robots as a way to provide faster and more efficient service to customers.

    In contrast, the Asia-Pacific region is experiencing rapid growth in the restaurant delivery robot market due to a number of factors, including a large population with a high demand for quick and convenient food options, a growing number of restaurants and food service providers, and a focus on adopting new technologies to improve business operations.

    FIGURE 3: RESTAURANT DELIVERY ROBOTS MARKET SHARE BY REGION 2022 VS 2032 (USD BILLION)

    RESTAURANT DELIVERY ROBOTS MARKET SHARE BY REGION 2022 VS 2032

    Source: Secondary Research, Primary Research, MRFR Database and Analyst Review

    Key Players and Competitive Insights

    The global restaurant delivery robot market is characterized by the presence of many global, regional, and local vendors. The market is highly competitive, with all the players competing to gain maximum market share. Intense competition, frequent changes in government policies, and regulations are key factors that impact market growth. The vendors compete based on cost, product quality, reliability, and aftermarket services. The vendors must provide cost-efficient and high-quality restaurant delivery robots to sustain their presence in an intensely competitive market environment.

    Key Companies in the Restaurant Delivery Robot Market market include

    Industry Developments

    March 2024: For example, UberEats declared in March 2024 that in Tokyo, Japan, it would have robot deliveries on account of the growing scarcity of labor and the respect of self-driving delivery robots by the government for April 2023.

    December 2023: Cali Group, Miso Robotics and PopID in December 2023 have planned to introduce a fully autonomous restaurant called CaliExpress by Flippy in Southern California.

    November 2023: Zomato also reported a 29% increase in food delivery orders this November 2023. The demand for food delivery services is being driven by an increasing disposable income within the region, which has led to restaurant delivery robots being deployed into the market place.

    June 2023: The Relay2 robot was unveiled by Relay Robotics at the NYU International Hospitality Industry Investment Conference held in June 2023, formerly known as Savioke. It has a gallon capacity of ten gallons (41 liters) per trip, which is twice as much as its previous models.

    April 2023: As part of convenience enhancement programs for its students and staff members, the University of Southern Indiana entered into a robotic delivery partnership with KiwiBot and Grubhub in April 2023.

    February 2023: This indicates that there will be great opportunities for expansion going forward because companies are increasingly choosing various technological options, such as faster, reliable automated deliveries through the use of drones or other robots. In February 2023 Kiwibot announced raising $10 mln from Kineo Finance, which will be used towards building up its fleet of robotic equipment.

    February 2023: Talabat UAE announced the introduction of a food-delivery bot in Dubai through the Integrated Economic Zones Authority in February 2023.

    January 2023: GYRO, on January 1st 2023, introduced their latest distribution robot at Consumer Technology Association conference specifically designed hotels/restaurant industry

    June 2022:  Miso Robotics will put Flippy 2, a robotic arm, through its paces to assess its machine learning and artificial learning abilities. The Wimpy restaurant in Dubai Mall will get the robot arm. This robot arm is quick and can cook a wide variety of foods.

    May 2022: Cyan Robotics, doing business as Coco, is bringing 15-minute restaurant delivery to the home delivery robots market. Customers can place an order at a restaurant, and Coco's robot will be driven to the restaurant by a trained "pilot" to pick up the order. The restaurant then enters the order into the delivery bot, which then travels to the customer's home.

    May 2022: Relay Robotics, Inc. a new corporation formed by the acquisition of leading robotics developer Savioke announced the completion of a USD 10 million Series A Financing.

    May 2022: Chinese start-up Pudu Robotics released PUDU A1, an innovative delivery robot specifically designed for restaurants with a seamless and efficient delivery process.

    Future Outlook

    Restaurant Delivery Robot Market Future Outlook

    The Restaurant Delivery Robots Market is projected to grow at a 24.1% CAGR from 2024 to 2035, driven by technological advancements, increasing demand for contactless delivery, and operational cost reduction.

    New opportunities lie in:

    • Develop AI-driven navigation systems for enhanced delivery efficiency.
    • Create partnerships with restaurants for exclusive delivery robot services.
    • Invest in sustainable materials for eco-friendly robot designs.

    By 2035, the market is expected to be a pivotal component of the global food delivery ecosystem.

    Market Segmentation

    Restaurant Delivery Robots Type Outlook

    • Semi-Autonomous
    • Fully Autonomous

    Restaurant Delivery Robots Regional Outlook

    • US
    • Canada

    Restaurant Delivery Robots Service Type Outlook

    • Limited
    • Full-service

    Restaurant Delivery Robots Load Capacity Outlook

    • Up to 10 KG
    • 10-50 KG
    • More Than 50 KG

    Restaurant Delivery Robots Restaurant Type Outlook

    • Independent
    • Chained

    Report Scope

    Report Attribute/Metric Details
    Market Size 2023 USD 14.27 billion
    Market Size 2024 USD 17.71 billion
    Market Size 2032 USD 99.64 billion
    Compound Annual Growth Rate (CAGR) 24.10% (2024-2032)
    Base Year 2023
    Forecast Period 2024-2032
    Historical Data 2021-2022
    Forecast Units Value (USD Billion)
    Report Coverage Revenue Forecast, Competitive Landscape, Growth Factors, and Trends
    Segments Covered Robot Type, Service Type, Restaurant Type, and Load Capacity
    Geographies Covered North America, Europe, Asia Pacific, Middle East & Africa, and South America
    Countries Covered The U.S, Canada, Mexico, Germany, France, UK, China, Japan, India, Australia, South Korea, UAE, and Brazil
    Key Companies Profiled Amazon Robotics, Robby Technologies, Robomart, Boston Dynamics, Eliport, Starship Technologies, Others
    Key Market Opportunities Technological Advancements in Robotics Industry
    Key Market Dynamics Growing Automation Across Restaurants Rising Focus on Enhanced Customer Experience  

    Market Highlights

    Author
    Ankit Gupta
    Senior Research Analyst

    Ankit Gupta is an analyst in market research industry in ICT and SEMI industry. With post-graduation in "Telecom and Marketing Management" and graduation in "Electronics and Telecommunication" vertical he is well versed with recent development in ICT industry as a whole. Having worked on more than 150+ reports including consultation for fortune 500 companies such as Microsoft and Rio Tinto in identifying solutions with respect to business problems his opinions are inclined towards mixture of technical and managerial aspects.

    Leave a Comment

    FAQs

    How much is the Restaurant Delivery Robots market?

    The global Restaurant Delivery Robot Market size was valued at USD 14.27 Billion in 2023.

    What is the market size for 2032, for the Restaurant Delivery Robots Market?

    USD 99.64 Billion in 2032

    What is the growth rate of the Restaurant Delivery Robots market?

    The global market is projected to grow at a CAGR of 24.10% during the forecast period, 2024-2032.

    Which region held the largest market share in the Restaurant Delivery Robots market?

    North America had the largest share in the global market

    Who are the prominent players in the Restaurant Delivery Robots market?

    The key players in the market are Amazon Robotics, Robby Technologies, Boston Dynamics Eliport, Starship Technologies, Cleveron, Miso Robotics, Kitchen Robotics, Bear Robotics Inc., Cyan Robotics.

    Which Robot Type led the Restaurant Delivery Robot Market?

    The Semi-Autonomous category dominated the market in 2022.

    Which Load Capacity had the largest market share in the Restaurant Delivery Robot Market?

    The 10-50 KG had the largest share in the global market.

    1. EXECUTIVE SUMMARY 16
      1. GLOBAL RESTAURANT DELIVERY
    2. ROBOTS MARKET, BY ROBOT TYPE 18
      1. GLOBAL RESTAURANT DELIVERY ROBOTS MARKET,
    3. BY SERVICE TYPE 19
      1. GLOBAL RESTAURANT DELIVERY ROBOTS MARKET, BY RESTAURANT
    4. TYPE 20
      1. GLOBAL RESTAURANT DELIVERY ROBOTS MARKET, BY LOAD CAPACITY 21
      2. GLOBAL RESTAURANT DELIVERY ROBOTS MARKET, BY REGION 22
    5. MARKET INTRODUCTION
      1. DEFINITION 23
      2. SCOPE OF THE STUDY 23
      3. MARKET STRUCTURE
      4. KEY BUYING CRITERIA 24
    6. RESEARCH METHODOLOGY 25
      1. RESEARCH
    7. PROCESS 25
      1. PRIMARY RESEARCH 26
      2. SECONDARY RESEARCH 27
    8. MARKET SIZE ESTIMATION 27
      1. TOP DOWN & BOTTOM-UP APPROACH 28
    9. FORECAST MODEL 29
      1. LIST OF ASSUMPTIONS 30
    10. MARKET DYNAMICS 31
    11. INTRODUCTION 31
      1. DRIVERS 32
        1. GROWING AUTOMATION ACROSS RESTAURANTS
        2. RISING FOCUS ON ENHANCED CUSTOMER EXPERIENCE 32
        3. DRIVERS
    12. IMPACT ANALYSIS 33
      1. RESTRAINTS 33
        1. HIGH COST, COMPLEXITY IN OPERATION
    13. AND INABILITY TO SOLVE COMPLEX PROBLEMS 33
      1. RESTRAINTS IMPACT ANALYSIS
      2. OPPORTUNITIES 34
        1. TECHNOLOGICAL ADVANCEMENTS IN ROBOTICS INDUSTRY
      3. IMPACT OF COVID-19 ON GLOBAL ECONOMY 35
      4. IMPACT OF COVID-19
    14. ON THE GLOBAL RESTAURANT DELIVERY ROBOTS MARKET 35
      1. SUPPLY CHAIN
    15. IMPACT 35
      1. IMPACT ON MANUFACTURER/DEVELOPER 35
        1. IMPACT ON COMPONENT/SERVICES
    16. SUPPLIER 36
      1. IMPACT ON DISTRIBUTION/LOGISTICS 36
    17. MARKET FACTOR ANALYSIS 37
      1. SUPPLY/VALUE CHAIN ANALYSIS 37
        1. R&D 38
    18. MANUFACTURING & ASSEMBLY 38
      1. DISTRIBUTION & SALES 38
    19. POST-SALES MONITORING 38
      1. PORTER’S FIVE FORCES MODEL 39
    20. THREAT OF NEW ENTRANTS 39
      1. BARGAINING POWER OF SUPPLIERS 40
    21. BARGAINING POWER OF BUYERS 40
      1. THREAT OF SUBSTITUTES 40
        1. INTENSITY
    22. OF RIVALRY 40
    23. NUMBER OF RESTAURANTS 41
      1. NORTH AMERICA 41
    24. EUROPE 41
    25. GLOBAL RESTAURANT DELIVERY ROBOTS MARKET, BY ROBOT TYPE 43
    26. OVERVIEW 43
      1. GLOBAL RESTAURANT DELIVERY ROBOTS MARKET SIZE, MARKET ESTIMATES
    27. & FORECAST BY ROBOT TYPE,
      1. GLOBAL RESTAURANT DELIVERY
    28. ROBOTS MARKET SIZE: MARKET ESTIMATES & FORECAST BY ROBOT
    29. TYPE, 2018-2030
    30. GLOBAL RESTAURANT DELIVERY ROBOTS MARKET, BY SERVICE TYPE 46
    31. OVERVIEW 46
      1. GLOBAL RESTAURANT DELIVERY ROBOTS MARKET SIZE, MARKET ESTIMATES
    32. & FORECAST BY SERVICE
    33. TYPE, 2018-2030 47
      1. GLOBAL RESTAURANT DELIVERY
    34. ROBOTS MARKET SIZE: MARKET ESTIMATES & FORECAST BY SERVICE
    35. TYPE, 2018-2030
    36. GLOBAL RESTAURANT DELIVERY ROBOTS MARKET, BY RESTAURANT TYPE 48
    37. OVERVIEW 48
      1. GLOBAL RESTAURANT DELIVERY ROBOTS MARKET SIZE, MARKET ESTIMATES
    38. & FORECAST BY RESTAURANT
    39. TYPE, 2018-2030 49
      1. GLOBAL RESTAURANT
    40. DELIVERY ROBOTS MARKET SIZE: MARKET ESTIMATES & FORECAST
    41. BY RESTAURANT
    42. TYPE, 2018-2030 49
    43. GLOBAL RESTAURANT DELIVERY ROBOTS MARKET, BY LOAD CAPACITY
      1. OVERVIEW 50
      2. GLOBAL RESTAURANT DELIVERY ROBOTS MARKET SIZE,
    44. MARKET ESTIMATES & FORECAST BY LOAD
    45. CAPACITY, 2018-2030 51
    46. GLOBAL RESTAURANT DELIVERY ROBOTS MARKET SIZE: MARKET ESTIMATES & FORECAST BY
    47. LOAD
    48. CAPACITY, 2018-2030 51
    49. GLOBAL RESTAURANT DELIVERY ROBOTS MARKET,
    50. BY REGION 53
      1. OVERVIEW 53
      2. NORTH AMERICA 55
        1. U.S. 58
        2. CANADA 60
      3. EUROPE 62
        1. U.K 68
        2. GERMANY 70
        3. FRANCE 72
        4. AUSTRIA 74
        5. SWITZERLAND 77
    51. NETHERLANDS 79
      1. BELGIUM 81
        1. SPAIN 83
        2. POLAND 85
        3. ITALY 88
        4. HUNGARY 90
        5. SWEDEN 92
        6. DENMARK
        7. BELARUS 96
        8. REST OF EUROPE 99
    52. COMPETITIVE LANDSCAPE
      1. COMPETITIVE OVERVIEW 101
      2. COMPETITIVE BENCHMARKING 101
      3. MAJOR PLAYERS IN THE GLOBAL RESTAURANT DELIVERY ROBOT MARKET 102
    53. MAJOR GROWTH STRATEGIES IN THE GLOBAL RESTAURANT DELIVERY ROBOT MARKET 103
    54. LEADING PLAYERS IN TERMS OF THE NUMBER OF DEVELOPMENTS IN THE GLOBAL RESTAURANT
    55. DELIVERY ROBOT MARKET 103
      1. KEY DEVELOPMENTS & GROWTH STRATEGIES
        1. CONTRACTS AND PRODUCT INTEGRATIONS 104
        2. PRODUCT LAUNCH/PRODUCT
    56. DEVELOPMENT/APPROVAL 104
      1. EXPANSION/FUNDING 105
    57. COMPANY PROFILES
      1. AMAZON ROBOTICS 106
        1. COMPANY OVERVIEW 106
        2. FINANCIAL
    58. OVERVIEW 107
      1. PRODUCTS OFFERED 107
        1. KEY DEVELOPMENTS 108
        2. SWOT ANALYSIS 108
        3. KEY STRATEGIES 108
      2. ROBBY TECHNOLOGIES
        1. COMPANY OVERVIEW 109
        2. FINANCIAL OVERVIEW 109
    59. PRODUCTS OFFERED 109
      1. KEY DEVELOPMENTS 109
        1. SWOT ANALYSIS
        2. KEY STRATEGIES 110
      2. BOSTON DYNAMICS 111
        1. COMPANY
    60. OVERVIEW 111
      1. FINANCIAL OVERVIEW 111
        1. PRODUCTS/SERVICES OFFERED
        2. KEY DEVELOPMENTS 111
        3. SWOT ANALYSIS 112
        4. KEY
    61. STRATEGIES 112
      1. ELIPORT 113
        1. COMPANY OVERVIEW 113
    62. FINANCIAL OVERVIEW 113
      1. PRODUCTS/SERVICES OFFERED 113
        1. KEY
    63. DEVELOPMENTS 113
      1. SWOT ANALYSIS 114
        1. KEY STRATEGIES 114
      2. STARSHIP TECHNOLOGIES 115
        1. COMPANY OVERVIEW 115
        2. FINANCIAL
    64. OVERVIEW 115
      1. PRODUCTS/SERVICES OFFERED 115
        1. KEY DEVELOPMENTS
        2. SWOT ANALYSIS 116
        3. KEY STRATEGIES 116
      2. CLEVERON
        1. COMPANY OVERVIEW 117
        2. FINANCIAL OVERVIEW 117
    65. PRODUCTS/SERVICES OFFERED 117
      1. KEY DEVELOPMENTS 117
        1. SWOT
    66. ANALYSIS 118
      1. KEY STRATEGIES 118
      2. MISO ROBOTICS 119
    67. COMPANY OVERVIEW 119
      1. FINANCIAL OVERVIEW 119
        1. PRODUCTS/SERVICES
    68. OFFERED 120
      1. KEY DEVELOPMENTS 120
      2. KITCHEN ROBOTICS 121
    69. COMPANY OVERVIEW 121
      1. FINANCIAL OVERVIEW 121
        1. PRODUCTS/SERVICES
    70. OFFERED 121
      1. KEY DEVELOPMENTS 121
      2. BEAR ROBOTICS, INC 122
        1. COMPANY OVERVIEW 122
        2. FINANCIAL OVERVIEW 122
        3. PRODUCTS
    71. OFFERED 122
      1. KEY DEVELOPMENTS 122
      2. CYAN ROBOTICS 123
    72. COMPANY OVERVIEW 123
      1. FINANCIAL OVERVIEW 123
        1. PRODUCTS OFFERED
        2. KEY DEVELOPMENTS 123
      2. RELAY ROBOTICS 124
    73. COMPANY OVERVIEW 124
      1. FINANCIAL OVERVIEW 124
        1. PRODUCTS OFFERED
        2. KEY DEVELOPMENTS 124
      2. XROBOTICS 125
        1. COMPANY
    74. OVERVIEW 125
      1. FINANCIAL OVERVIEW 125
        1. PRODUCTS OFFERED 125
        2. KEY DEVELOPMENTS 125
      2. DEXAI ROBOTICS 126
    75. COMPANY OVERVIEW 126
      1. FINANCIAL OVERVIEW 126
        1. PRODUCTS OFFERED
        2. KEY DEVELOPMENTS 126
      2. CREATOR 127
        1. COMPANY
    76. OVERVIEW 127
      1. FINANCIAL OVERVIEW 127
        1. PRODUCTS OFFERED 127
        2. KEY DEVELOPMENTS 127
      2. ROBOMART 128
        1. COMPANY OVERVIEW
        2. FINANCIAL OVERVIEW 128
        3. PRODUCTS/SERVICES OFFERED 128
        4. KEY DEVELOPMENTS 128
    77. APPENDIX 129
      1. REFERENCES 129
    78. AMERICA: TOTAL NUMBER OF RESTAURANTS 41
    79. BY ROBOT TYPE, 2018-2030 (USD THOUSAND) 44
    80. ROBOTS MARKET ESTIMATES & FORECAST, BY ROBOT TYPE, 2018-2030 (UNITS) 45
    81. GLOBAL RESTAURANT DELIVERY ROBOTS MARKET ESTIMATES & FORECAST, BY SERVICE
    82. TYPE, 2018-2030 (USD THOUSAND) 47
    83. MARKET ESTIMATES & FORECAST, BY SERVICE TYPE, 2018-2030 (UNITS) 47
    84. GLOBAL RESTAURANT DELIVERY ROBOTS MARKET ESTIMATES & FORECAST, BY RESTAURANT
    85. TYPE, 2018-2030
    86. (USD THOUSAND) 49
    87. ROBOTS MARKET ESTIMATES & FORECAST, BY RESTAURANT TYPE, 2018-2030 (UNITS) 49
    88. LOAD CAPACITY, 2018-2030
    89. (USD THOUSAND) 51
    90. DELIVERY ROBOTS MARKET ESTIMATES & FORECAST, BY LOAD CAPACITY, 2018-2030 (UNITS)
    91. (USD THOUSAND) 54
    92. BY REGION, 2018-2030 (UNITS) 54
    93. ROBOTS MARKET SIZE, BY COUNTRY, 2018-2030 (USD THOUSAND) 55
    94. AMERICA: RESTAURANT DELIVERY ROBOTS MARKET VOLUME, BY COUNTRY, 2018-2030 (UNITS)
    95. FORECAST, BY ROBOT TYPE, 2018-2030
    96. (USD THOUSAND) 56
    97. RESTAURANT DELIVERY ROBOTS MARKET ESTIMATES & FORECAST, BY ROBOT TYPE, 2018-2030
    98. (UNITS) 56
    99. & FORECAST, BY SERVICE TYPE, 2018-2030
    100. (USD THOUSAND) 56
    101. NORTH AMERICA RESTAURANT DELIVERY ROBOTS MARKET ESTIMATES & FORECAST, BY SERVICE
    102. TYPE, 2018-2030 (UNITS) 57
    103. MARKET ESTIMATES & FORECAST, BY RESTURANT TYPE, 2018-2030
    104. (USD THOUSAND)
    105. FORECAST, BY RESTURANT TYPE, 2018-2030
    106. (UNITS) 57
    107. RESTAURANT DELIVERY ROBOTS MARKET ESTIMATES & FORECAST, BY LOAD CAPACITY, 2018-2030
    108. (USD THOUSAND) 57
    109. ESTIMATES & FORECAST, BY LOAD CAPACITY, 2018-2030
    110. (UNITS) 58
    111. US RESTAURANT DELIVERY ROBOTS MARKET ESTIMATES & FORECAST, BY ROBOT TYPE,
    112. 2030 (USD THOUSAND) 58
    113. & FORECAST, BY ROBOT TYPE, 2018-2030 (UNITS) 58
    114. DELIVERY ROBOTS MARKET ESTIMATES & FORECAST, BY SERVICE TYPE, 2018-2030 (USD
    115. THOUSAND) 58
    116. FORECAST, BY SERVICE TYPE, 2018-2030 (UNITS) 59
    117. ROBOTS MARKET ESTIMATES & FORECAST, BY RESTURANT TYPE, 2018-2030 (USD THOUSAND)
    118. BY RESTURANT TYPE, 2018-2030 (UNITS) 59
    119. MARKET ESTIMATES & FORECAST, BY LOAD CAPACITY, 2018-2030 (USD THOUSAND) 59
    120. CAPACITY, 2018-2030 (UNITS) 60
    121. ESTIMATES & FORECAST, BY ROBOT TYPE, 2018-2030 (USD THOUSAND) 60
    122. CANADA RESTAURANT DELIVERY ROBOTS MARKET ESTIMATES & FORECAST, BY ROBOT TYPE,
    123. 2030 (UNITS) 60
    124. & FORECAST, BY SERVICE TYPE, 2018-2030 (USD THOUSAND) 61
    125. RESTAURANT DELIVERY ROBOTS MARKET ESTIMATES & FORECAST, BY SERVICE TYPE, 2018-2030
    126. (UNITS) 61
    127. FORECAST, BY RESTURANT TYPE, 2018-2030
    128. (USD THOUSAND) 61
    129. RESTAURANT DELIVERY ROBOTS MARKET ESTIMATES & FORECAST, BY RESTURANT TYPE, 2018-2030
    130. (UNITS) 61
    131. FORECAST, BY LOAD CAPACITY, 2018-2030
    132. (USD THOUSAND) 62
    133. RESTAURANT DELIVERY ROBOTS MARKET ESTIMATES & FORECAST, BY LOAD CAPACITY, 2018-2030
    134. (UNITS) 62
    135. 2030 (USD THOUSAND) 64
    136. VOLUME, BY COUNTRY, 2018-2030 (UNITS) 65
    137. ROBOTS MARKET ESTIMATES & FORECAST, BY ROBOT TYPE, 2018-2030 (USD THOUSAND)
    138. BY ROBOT TYPE, 2018-2030 (UNITS) 66
    139. MARKET ESTIMATES & FORECAST, BY SERVICE TYPE, 2018-2030 (USD THOUSAND) 66
    140. SERVICE TYPE, 2018-2030 (UNITS) 66
    141. MARKET ESTIMATES & FORECAST, BY RESTURANT TYPE, 2018-2030
    142. (USD THOUSAND)
    143. BY RESTURANT TYPE, 2018-2030 (UNITS) 67
    144. ROBOTS MARKET ESTIMATES & FORECAST, BY LOAD CAPACITY, 2018-2030 (USD THOUSAND)
    145. BY LOAD CAPACITY, 2018-2030 (UNITS) 67
    146. MARKET ESTIMATES & FORECAST, BY ROBOT TYPE, 2018-2030 (USD THOUSAND) 68
    147. UK RESTAURANT DELIVERY ROBOTS MARKET ESTIMATES & FORECAST, BY ROBOT TYPE,
    148. 2030 (UNITS) 68
    149. & FORECAST, BY SERVICE TYPE, 2018-2030 (USD THOUSAND) 68
    150. DELIVERY ROBOTS MARKET ESTIMATES & FORECAST, BY SERVICE TYPE, 2018-2030 (UNITS)
    151. BY RESTURANT TYPE, 2018-2030 (USD THOUSAND) 69
    152. ROBOTS MARKET ESTIMATES & FORECAST, BY RESTURANT TYPE, 2018-2030 (UNITS) 69
    153. CAPACITY, 2018-2030 (USD THOUSAND) 69
    154. MARKET ESTIMATES & FORECAST, BY LOAD CAPACITY, 2018-2030 (UNITS) 69
    155. GERMANY RESTAURANT DELIVERY ROBOTS MARKET ESTIMATES & FORECAST, BY ROBOT
    156. TYPE, 2018-2030 (USD THOUSAND) 70
    157. MARKET ESTIMATES & FORECAST, BY ROBOT TYPE, 2018-2030 (UNITS) 70
    158. GERMANY RESTAURANT DELIVERY ROBOTS MARKET ESTIMATES & FORECAST, BY SERVICE
    159. TYPE, 2018-2030 (USD THOUSAND) 70
    160. MARKET ESTIMATES & FORECAST, BY SERVICE TYPE, 2018-2030 (UNITS) 71
    161. GERMANY RESTAURANT DELIVERY ROBOTS MARKET ESTIMATES & FORECAST, BY RESTURANT
    162. TYPE, 2018-2030
    163. (USD THOUSAND) 71
    164. ROBOTS MARKET ESTIMATES & FORECAST, BY RESTURANT TYPE, 2018-2030 (UNITS) 71
    165. LOAD CAPACITY, 2018-2030
    166. (USD THOUSAND) 71
    167. DELIVERY ROBOTS MARKET ESTIMATES & FORECAST, BY LOAD CAPACITY, 2018-2030 (UNITS)
    168. BY ROBOT TYPE, 2018-2030 (USD THOUSAND) 72
    169. ROBOTS MARKET ESTIMATES & FORECAST, BY ROBOT TYPE, 2018-2030 (UNITS) 72
    170. FRANCE RESTAURANT DELIVERY ROBOTS MARKET ESTIMATES & FORECAST, BY SERVICE
    171. TYPE, 2018-2030 (USD THOUSAND) 73
    172. MARKET ESTIMATES & FORECAST, BY SERVICE TYPE, 2018-2030 (UNITS) 73
    173. FRANCE RESTAURANT DELIVERY ROBOTS MARKET ESTIMATES & FORECAST, BY RESTURANT
    174. TYPE, 2018-2030
    175. (USD THOUSAND) 73
    176. ROBOTS MARKET ESTIMATES & FORECAST, BY RESTURANT TYPE, 2018-2030 (UNITS) 73
    177. LOAD CAPACITY, 2018-2030 (USD THOUSAND) 74
    178. ROBOTS MARKET ESTIMATES & FORECAST, BY LOAD CAPACITY, 2018-2030 (UNITS) 74
    179. ROBOT TYPE, 2018-2030 (USD THOUSAND) 74
    180. ROBOTS MARKET ESTIMATES & FORECAST, BY ROBOT TYPE, 2018-2030 (UNITS) 75
    181. AUSTRIA RESTAURANT DELIVERY ROBOTS MARKET ESTIMATES & FORECAST, BY SERVICE
    182. TYPE, 2018-2030 (USD THOUSAND) 75
    183. MARKET ESTIMATES & FORECAST, BY SERVICE TYPE, 2018-2030 (UNITS) 75
    184. AUSTRIA RESTAURANT DELIVERY ROBOTS MARKET ESTIMATES & FORECAST, BY RESTURANT
    185. TYPE, 2018-2030
    186. (USD THOUSAND) 75
    187. ROBOTS MARKET ESTIMATES & FORECAST, BY RESTURANT TYPE, 2018-2030 (UNITS) 76
    188. LOAD CAPACITY, 2018-2030
    189. (USD THOUSAND) 76
    190. DELIVERY ROBOTS MARKET ESTIMATES & FORECAST, BY LOAD CAPACITY, 2018-2030 (UNITS)
    191. BY ROBOT TYPE, 2018-2030
    192. (USD THOUSAND) 77
    193. DELIVERY ROBOTS MARKET ESTIMATES & FORECAST, BY ROBOT TYPE, 2018-2030 (UNITS)
    194. BY SERVICE TYPE, 2018-2030
    195. (USD THOUSAND) 77
    196. DELIVERY ROBOTS MARKET ESTIMATES & FORECAST, BY SERVICE TYPE, 2018-2030 (UNITS)
    197. BY RESTURANT TYPE, 2018-2030
    198. (USD THOUSAND) 78
    199. DELIVERY ROBOTS MARKET ESTIMATES & FORECAST, BY RESTURANT TYPE, 2018-2030 (UNITS)
    200. BY LOAD CAPACITY, 2018-2030
    201. (USD THOUSAND) 78
    202. DELIVERY ROBOTS MARKET ESTIMATES & FORECAST, BY LOAD CAPACITY, 2018-2030 (UNITS)
    203. BY ROBOT TYPE, 2018-2030
    204. (USD THOUSAND) 79
    205. DELIVERY ROBOTS MARKET ESTIMATES & FORECAST, BY ROBOT TYPE, 2018-2030 (UNITS)
    206. BY SERVICE TYPE, 2018-2030
    207. (USD THOUSAND) 79
    208. DELIVERY ROBOTS MARKET ESTIMATES & FORECAST, BY SERVICE TYPE, 2018-2030 (UNITS)
    209. BY RESTURANT TYPE, 2018-2030 (USD THOUSAND) 80
    210. DELIVERY ROBOTS MARKET ESTIMATES & FORECAST, BY RESTURANT TYPE, 2018-2030 (UNITS)
    211. BY LOAD CAPACITY, 2018-2030
    212. (USD THOUSAND) 80
    213. DELIVERY ROBOTS MARKET ESTIMATES & FORECAST, BY LOAD CAPACITY, 2018-2030 (UNITS)
    214. BY ROBOT TYPE, 2018-2030 (USD THOUSAND) 81
    215. ROBOTS MARKET ESTIMATES & FORECAST, BY ROBOT TYPE, 2018-2030 (UNITS) 81
    216. BELGIUM RESTAURANT DELIVERY ROBOTS MARKET ESTIMATES & FORECAST, BY SERVICE
    217. TYPE, 2018-2030 (USD THOUSAND) 81
    218. MARKET ESTIMATES & FORECAST, BY SERVICE TYPE, 2018-2030 (UNITS) 81
    219. BELGIUM RESTAURANT DELIVERY ROBOTS MARKET ESTIMATES & FORECAST, BY RESTURANT
    220. TYPE, 2018-2030
    221. (USD THOUSAND) 82
    222. ROBOTS MARKET ESTIMATES & FORECAST, BY RESTURANT TYPE, 2018-2030 (UNITS) 82
    223. BY LOAD CAPACITY, 2018-2030
    224. (USD THOUSAND) 82
    225. DELIVERY ROBOTS MARKET ESTIMATES & FORECAST, BY LOAD CAPACITY, 2018-2030 (UNITS)
    226. BY ROBOT TYPE, 2018-2030 (USD THOUSAND) 83
    227. ROBOTS MARKET ESTIMATES & FORECAST, BY ROBOT TYPE, 2018-2030 (UNITS) 83
    228. SPAIN RESTAURANT DELIVERY ROBOTS MARKET ESTIMATES & FORECAST, BY SERVICE
    229. TYPE, 2018-2030 (USD THOUSAND) 84
    230. MARKET ESTIMATES & FORECAST, BY SERVICE TYPE, 2018-2030 (UNITS) 84
    231. SPAIN RESTAURANT DELIVERY ROBOTS MARKET ESTIMATES & FORECAST, BY RESTURANT
    232. TYPE, 2018-2030 (USD THOUSAND) 84
    233. MARKET ESTIMATES & FORECAST, BY RESTURANT TYPE, 2018-2030 (UNITS) 84
    234. SPAIN RESTAURANT DELIVERY ROBOTS MARKET ESTIMATES & FORECAST, BY LOAD CAPACITY,
    235. 2030 (USD THOUSAND) 85
    236. ESTIMATES & FORECAST, BY LOAD CAPACITY, 2018-2030 (UNITS) 85
    237. POLAND RESTAURANT DELIVERY ROBOTS MARKET ESTIMATES & FORECAST, BY ROBOT TYPE,
    238. 2030 (USD THOUSAND) 85
    239. ESTIMATES & FORECAST, BY ROBOT TYPE, 2018-2030 (UNITS) 86
    240. RESTAURANT DELIVERY ROBOTS MARKET ESTIMATES & FORECAST, BY SERVICE TYPE, 2018-2030
    241. (USD THOUSAND) 86
    242. & FORECAST, BY SERVICE TYPE, 2018-2030 (UNITS) 86
    243. DELIVERY ROBOTS MARKET ESTIMATES & FORECAST, BY RESTURANT TYPE, 2018-2030
    244. (USD THOUSAND) 86
    245. & FORECAST, BY RESTURANT TYPE, 2018-2030 (UNITS) 87
    246. DELIVERY ROBOTS MARKET ESTIMATES & FORECAST, BY LOAD CAPACITY, 2018-2030
    247. (USD THOUSAND) 87
    248. & FORECAST, BY LOAD CAPACITY, 2018-2030 (UNITS) 87
    249. DELIVERY ROBOTS MARKET ESTIMATES & FORECAST, BY ROBOT TYPE, 2018-2030 (USD THOUSAND)
    250. BY ROBOT TYPE, 2018-2030 (UNITS) 88
    251. MARKET ESTIMATES & FORECAST, BY SERVICE TYPE, 2018-2030 (USD THOUSAND) 88
    252. SERVICE TYPE, 2018-2030 (UNITS) 88
    253. MARKET ESTIMATES & FORECAST, BY RESTURANT TYPE, 2018-2030 (USD THOUSAND) 89
    254. RESTURANT TYPE, 2018-2030 (UNITS) 89
    255. MARKET ESTIMATES & FORECAST, BY LOAD CAPACITY, 2018-2030 (USD THOUSAND) 89
    256. LOAD CAPACITY, 2018-2030 (UNITS) 89
    257. MARKET ESTIMATES & FORECAST, BY ROBOT TYPE, 2018-2030 (USD THOUSAND) 90
    258. HUNGARY RESTAURANT DELIVERY ROBOTS MARKET ESTIMATES & FORECAST, BY ROBOT
    259. TYPE, 2018-2030 (UNITS) 90
    260. ESTIMATES & FORECAST, BY SERVICE TYPE, 2018-2030
    261. (USD THOUSAND) 90
    262. HUNGARY RESTAURANT DELIVERY ROBOTS MARKET ESTIMATES & FORECAST, BY SERVICE
    263. TYPE, 2018-2030 (UNITS) 90
    264. ESTIMATES & FORECAST, BY RESTURANT TYPE, 2018-2030
    265. (USD THOUSAND) 91
    266. BY RESTURANT TYPE, 2018-2030 (UNITS) 91
    267. ROBOTS MARKET ESTIMATES & FORECAST, BY LOAD CAPACITY, 2018-2030
    268. (USD THOUSAND)
    269. BY LOAD CAPACITY, 2018-2030 (UNITS) 91
    270. ROBOTS MARKET ESTIMATES & FORECAST, BY ROBOT TYPE, 2018-2030 (USD THOUSAND)
    271. BY ROBOT TYPE, 2018-2030 (UNITS) 92
    272. MARKET ESTIMATES & FORECAST, BY SERVICE TYPE, 2018-2030 (USD THOUSAND) 92
    273. SERVICE TYPE, 2018-2030 (UNITS) 93
    274. MARKET ESTIMATES & FORECAST, BY RESTURANT TYPE, 2018-2030
    275. (USD THOUSAND)
    276. BY RESTURANT TYPE, 2018-2030 (UNITS) 93
    277. ROBOTS MARKET ESTIMATES & FORECAST, BY LOAD CAPACITY, 2018-2030
    278. (USD THOUSAND)
    279. BY LOAD CAPACITY, 2018-2030 (UNITS) 94
    280. ROBOTS MARKET ESTIMATES & FORECAST, BY ROBOT TYPE, 2018-2030 (USD THOUSAND)
    281. BY ROBOT TYPE, 2018-2030 (UNITS) 94
    282. MARKET ESTIMATES & FORECAST, BY SERVICE TYPE, 2018-2030
    283. (USD THOUSAND)
    284. BY SERVICE TYPE, 2018-2030 (UNITS) 95
    285. ROBOTS MARKET ESTIMATES & FORECAST, BY RESTURANT TYPE, 2018-2030
    286. (USD
    287. THOUSAND) 95
    288. & FORECAST, BY RESTURANT TYPE, 2018-2030 (UNITS) 95
    289. DELIVERY ROBOTS MARKET ESTIMATES & FORECAST, BY LOAD CAPACITY, 2018-2030
    290. (USD THOUSAND) 96
    291. & FORECAST, BY LOAD CAPACITY, 2018-2030 (UNITS) 96
    292. DELIVERY ROBOTS MARKET ESTIMATES & FORECAST, BY ROBOT TYPE, 2018-2030 (USD THOUSAND)
    293. BY ROBOT TYPE, 2018-2030 (UNITS) 97
    294. MARKET ESTIMATES & FORECAST, BY SERVICE TYPE, 2018-2030 (USD THOUSAND) 97
    295. BY SERVICE TYPE, 2018-2030 (UNITS) 97
    296. ROBOTS MARKET ESTIMATES & FORECAST, BY RESTURANT TYPE, 2018-2030
    297. (USD THOUSAND)
    298. BY RESTURANT TYPE, 2018-2030 (UNITS) 98
    299. ROBOTS MARKET ESTIMATES & FORECAST, BY LOAD CAPACITY, 2018-2030
    300. (USD THOUSAND)
    301. BY LOAD CAPACITY, 2018-2030 (UNITS) 98
    302. DELIVERY ROBOTS MARKET ESTIMATES & FORECAST, BY ROBOT TYPE, 2018-2030
    303. (USD
    304. THOUSAND) 99
    305. & FORECAST, BY ROBOT TYPE, 2018-2030 (UNITS) 99
    306. RESTAURANT DELIVERY ROBOTS MARKET ESTIMATES & FORECAST, BY SERVICE TYPE, 2018-2030
    307. (USD THOUSAND) 99
    308. ESTIMATES & FORECAST, BY SERVICE TYPE, 2018-2030 (UNITS) 99
    309. OF EUROPE RESTAURANT DELIVERY ROBOTS MARKET ESTIMATES & FORECAST, BY RESTURANT
    310. TYPE, 2018-2030
    311. (USD THOUSAND) 100
    312. DELIVERY ROBOTS MARKET ESTIMATES & FORECAST, BY RESTURANT TYPE, 2018-2030
    313. (UNITS) 100
    314. & FORECAST, BY LOAD CAPACITY, 2018-2030
    315. (USD THOUSAND) 100
    316. REST OF EUROPE RESTAURANT DELIVERY ROBOTS MARKET ESTIMATES & FORECAST, BY
    317. LOAD CAPACITY, 2018-2030
    318. (UNITS) 100
    319. RESTAURANT DELIVERY ROBOT MARKET 102
    320. GLOBAL RESTAURANT DELIVERY ROBOT MARKET 103
    321. INTEGRATIONS 104
    322. PRODUCTS OFFERED 109
    323. PRODUCTS/SERVICES OFFERED 115
    324. KEY DEVELOPMENTS 117
    325. MISO ROBOTICS: KEY DEVELOPMENTS 120
    326. OFFERED 121
    327. BEAR ROBOTICS, INC: KEY DEVELOPMENTS 122
    328. OFFERED 123
    329. ROBOTICS: PRODUCTS OFFERED 124
    330. OFFERED 126
    331. PRODUCTS OFFERED 127
    332. RESTAURANT DELIVERY ROBOTS MARKET ANALYSIS BY ROBOT TYPE 18
    333. RESTAURANT DELIVERY ROBOTS MARKET ANALYSIS BY SERVICE TYPE 19
    334. RESTAURANT DELIVERY ROBOTS MARKET ANALYSIS BY RESTAURANT TYPE 20
    335. RESTAURANT DELIVERY ROBOTS MARKET ANALYSIS BY LOAD CAPACITY 21
    336. RESTAURANT DELIVERY ROBOTS MARKET ANALYSIS BY REGION 22
    337. DELIVERY ROBOTS MARKET: MARKET STRUCTURE 24
    338. RESTAURANT DELIVERY ROBOTS 24
    339. DRO ANALYSIS OF GLOBAL RESTAURANT DELIVERY ROBOTS MARKET 31
    340. IMPACT ANALYSIS: RESTAURANT DELIVERY ROBOTS MARKET 33
    341. IMPACT ANALYSIS: RESTAURANT DELIVERY ROBOTS MARKET 34
    342. CHAIN: GLOBAL RESTAURANT DELIVERY ROBOTS MARKET 37
    343. DELIVERY ROBOTS MARKET, BY ROBOT TYPE, 2021 (% SHARE) 43
    344. DELIVERY ROBOTS MARKET, BY ROBOT TYPE, 2018 TO 2030 (USD THOUSAND) 44
    345. GLOBAL RESTAURANT DELIVERY ROBOTS MARKET, BY SERVICE TYPE, 2021 (% SHARE) 46
    346. (USD THOUSAND) 47
    347. TYPE, 2021 (% SHARE) 48
    348. BY RESTAURANT TYPE, 2018 TO 2030 (USD THOUSAND) 49
    349. DELIVERY ROBOTS MARKET, BY LOAD CAPACITY, 2021 (% SHARE) 50
    350. RESTAURANT DELIVERY ROBOTS MARKET, BY LOAD CAPACITY, 2018 TO 2030 (USD THOUSAND)
    351. (USD THOUSAND) 53
    352. (% SHARE) 54
    353. SHARE, BY COUNTRY, 2021 (% SHARE) 55
    354. ROBOTS MARKET SHARE, BY COUNTRY, 2021 (% SHARE) 63
    355. MAJOR COMPETITORS 101
    356. ADOPTED BY KEY PLAYERS IN THE GLOBAL RESTAURANT
    357. DELIVERY ROBOT MARKET 103
    358. SWOT ANALYSIS 108
    359. BOSTON DYNAMICS: SWOT ANALYSIS 112

    Restaurant Delivery Robots Market Segmentation

    Global Restaurant Delivery Robots, By Robots Type Outlook (USD Billion, 2018-2032)

    Semi-Autonomous

    Fully Autonomous

    Global Restaurant Delivery Robots, By Service Type (USD Billion, 2018-2032)

    Limited

    Full-service

    Global Restaurant Delivery Robots, By Restaurant Type Outlook (USD Billion, 2018-2032)

    Independent

    Chained

    Global Restaurant Delivery Robots, By Load Capacity Outlook (USD Billion, 2018-2032)

      • Up to 10 KG
      • 10-50 KG
      • More Than 50 KG

    Global Restaurant Delivery Robots Regional Outlook (USD Billion, 2018-2032)

    • North America Outlook (USD Billion, 2018-2032)

      • North America Restaurant Delivery Robots, By Robots Type Outlook (USD Billion, 2018-2032)

        • Semi-Autonomous
        • Fully Autonomous
      • North America Restaurant Delivery Robots, By Service Type (USD Billion, 2018-2032)

        • Limited
        • Full-service
      • North America Restaurant Delivery Robots, By Restaurant Type Outlook (USD Billion, 2018-2032)

        • Independent
        • Chained
      • North America Restaurant Delivery Robots, By Load Capacity Outlook (USD Billion, 2018-2032)

        • Up to 10 KG
        • 10-50 KG
        • More Than 50 KG


      • US Outlook (USD Billion, 2018-2032)

        • US Restaurant Delivery Robots, By Robots Type Outlook (USD Billion, 2018-2032)

          • Semi-Autonomous
          • Fully Autonomous
        • US Restaurant Delivery Robots, By Service Type (USD Billion, 2018-2032)

          • Limited
          • Full-service
        • US Restaurant Delivery Robots, By Restaurant Type Outlook (USD Billion, 2018-2032)

          • Independent
          • Chained
        • US Restaurant Delivery Robots, By Load Capacity Outlook (USD Billion, 2018-2032)

          • Up to 10 KG
          • 10-50 KG
          • More Than 50 KG


      • Canada Outlook (USD Billion, 2018-2032)

        • Canada Restaurant Delivery Robots, By Robots Type Outlook (USD Billion, 2018-2032)

          • Semi-Autonomous
          • Fully Autonomous
        • Canada Restaurant Delivery Robots, By Service Type (USD Billion, 2018-2032)

          • Limited
          • Full-service
        • Canada Restaurant Delivery Robots, By Restaurant Type Outlook (USD Billion, 2018-2032)

          • Independent
          • Chained
        • Canada Restaurant Delivery Robots, By Load Capacity Outlook (USD Billion, 2018-2032)

          • Up to 10 KG
          • 10-50 KG
          • More Than 50 KG


      • Mexico Outlook (USD Billion, 2018-2032)

        • Mexico Restaurant Delivery Robots, By Robots Type Outlook (USD Billion, 2018-2032)

          • Semi-Autonomous
          • Fully Autonomous
        • Mexico Restaurant Delivery Robots, By Service Type (USD Billion, 2018-2032)

          • Limited
          • Full-service
        • Mexico Restaurant Delivery Robots, By Restaurant Type Outlook (USD Billion, 2018-2032)

          • Independent
          • Chained
        • Mexico Restaurant Delivery Robots, By Load Capacity Outlook (USD Billion, 2018-2032)

          • Up to 10 KG
          • 10-50 KG
          • More Than 50 KG
    • Europe Outlook (USD Billion, 2018-2032)

      • Europe Restaurant Delivery Robots, By Robots Type Outlook (USD Billion, 2018-2032)

        • Semi-Autonomous
        • Fully Autonomous
      • Europe Restaurant Delivery Robots, By Service Type (USD Billion, 2018-2032)

        • Limited
        • Full-service
      • Europe Restaurant Delivery Robots, By Restaurant Type Outlook (USD Billion, 2018-2032)

        • Independent
        • Chained
      • Europe Restaurant Delivery Robots, By Load Capacity Outlook (USD Billion, 2018-2032)

        • Up to 10 KG
        • 10-50 KG
        • More Than 50 KG


      • Germany Outlook (USD Billion, 2018-2032)

        • Germany Restaurant Delivery Robots, By Robots Type Outlook (USD Billion, 2018-2032)

          • Semi-Autonomous
          • Fully Autonomous
        • Germany Restaurant Delivery Robots, By Service Type (USD Billion, 2018-2032)

          • Limited
          • Full-service
        • Germany Restaurant Delivery Robots, By Restaurant Type Outlook (USD Billion, 2018-2032)

          • Independent
          • Chained
        • Germany Restaurant Delivery Robots, By Load Capacity Outlook (USD Billion, 2018-2032)

          • Up to 10 KG
          • 10-50 KG
          • More Than 50 KG


      • France Outlook (USD Billion, 2018-2032)

        • France Restaurant Delivery Robots, By Robots Type Outlook (USD Billion, 2018-2032)

          • Semi-Autonomous
          • Fully Autonomous
        • France Restaurant Delivery Robots, By Service Type (USD Billion, 2018-2032)

          • Limited
          • Full-service
        • France Restaurant Delivery Robots, By Restaurant Type Outlook (USD Billion, 2018-2032)

          • Independent
          • Chained
        • France Restaurant Delivery Robots, By Load Capacity Outlook (USD Billion, 2018-2032)

          • Up to 10 KG
          • 10-50 KG
          • More Than 50 KG


      • UK Outlook (USD Billion, 2018-2032)

        • UK Restaurant Delivery Robots, By Robots Type Outlook (USD Billion, 2018-2032)

          • Semi-Autonomous
          • Fully Autonomous
        • UK Restaurant Delivery Robots, By Service Type (USD Billion, 2018-2032)

          • Limited
          • Full-service
        • UK Restaurant Delivery Robots, By Restaurant Type Outlook (USD Billion, 2018-2032)

          • Independent
          • Chained
        • UK Restaurant Delivery Robots, By Load Capacity Outlook (USD Billion, 2018-2032)

          • Up to 10 KG
          • 10-50 KG
          • More Than 50 KG


      • Rest of Europe Outlook (USD Billion, 2018-2032)

        • Rest of Europe Restaurant Delivery Robots, By Robots Type Outlook (USD Billion, 2018-2032)

          • Semi-Autonomous
          • Fully Autonomous
        • Rest of Europe Restaurant Delivery Robots, By Service Type (USD Billion, 2018-2032)

          • Limited
          • Full-service
        • Restaurant Delivery Robots, By Restaurant Type Outlook (USD Billion, 2018-2032)

          • Independent
          • Chained
        • Rest of Europe Restaurant Delivery Robots, By Load Capacity Outlook (USD Billion, 2018-2032)

          • Up to 10 KG
          • 10-50 KG
          • More Than 50 KG


    • Asia-Pacific Outlook (USD Billion, 2018-2032)

      • Asia-Pacific Restaurant Delivery Robots, By Robots Type Outlook (USD Billion, 2018-2032)

        • Semi-Autonomous
        • Fully Autonomous
      • Asia-Pacific Restaurant Delivery Robots, By Service Type (USD Billion, 2018-2032)

        • Limited
        • Full-service
      • Asia-Pacific Restaurant Delivery Robots, By Restaurant Type Outlook (USD Billion, 2018-2032)

        • Independent
        • Chained
      • Asia-Pacific Restaurant Delivery Robots, By Load Capacity Outlook (USD Billion, 2018-2032)

        • Up to 10 KG
        • 10-50 KG
        • More Than 50 KG


      • China Outlook (USD Billion, 2018-2032)

        • China Restaurant Delivery Robots, By Robots Type Outlook (USD Billion, 2018-2032)

          • Semi-Autonomous
          • Fully Autonomous
        • China Restaurant Delivery Robots, By Service Type (USD Billion, 2018-2032)

          • Limited
          • Full-service
        • China Restaurant Delivery Robots, By Restaurant Type Outlook (USD Billion, 2018-2032)

          • Independent
          • Chained
        • China Restaurant Delivery Robots, By Load Capacity Outlook (USD Billion, 2018-2032)

          • Up to 10 KG
          • 10-50 KG
          • More Than 50 KG


      • India Outlook (USD Billion, 2018-2032)

        • India Restaurant Delivery Robots, By Robots Type Outlook (USD Billion, 2018-2032)

          • Semi-Autonomous
          • Fully Autonomous
        • India Restaurant Delivery Robots, By Service Type (USD Billion, 2018-2032)

          • Limited
          • Full-service
        • India Restaurant Delivery Robots, By Restaurant Type Outlook (USD Billion, 2018-2032)

          • Independent
          • Chained
        • India Restaurant Delivery Robots, By Load Capacity Outlook (USD Billion, 2018-2032)

          • Up to 10 KG
          • 10-50 KG
          • More Than 50 KG


      • Japan Outlook (USD Billion, 2018-2032)

        • Japan Restaurant Delivery Robots, By Robots Type Outlook (USD Billion, 2018-2032)

          • Semi-Autonomous
          • Fully Autonomous
        • Japan Restaurant Delivery Robots, By Service Type (USD Billion, 2018-2032)

          • Limited
          • Full-service
        • Japan Restaurant Delivery Robots, By Restaurant Type Outlook (USD Billion, 2018-2032)

          • Independent
          • Chained
        • Japan Restaurant Delivery Robots, By Load Capacity Outlook (USD Billion, 2018-2032)

          • Up to 10 KG
          • 10-50 KG
          • More Than 50 KG


      • Rest of Asia-Pacific Outlook (USD Billion, 2018-2032)

        • Rest of Asia-Pacific Restaurant Delivery Robots, By Robots Type Outlook (USD Billion, 2018-2032)

          • Semi-Autonomous
          • Fully Autonomous
        • Rest of Asia-Pacific Restaurant Delivery Robots, By Service Type (USD Billion, 2018-2032)

          • Limited
          • Full-service
        • Rest of Asia-Pacific Restaurant Delivery Robots, By Restaurant Type Outlook (USD Billion, 2018-2032)

          • Independent
          • Chained
        • Rest of Asia-Pacific Restaurant Delivery Robots, By Load Capacity Outlook (USD Billion, 2018-2032)

          • Up to 10 KG
          • 10-50 KG
          • More Than 50 KG


    • Rest of the World Outlook (USD Billion, 2018-2032)

      • Rest of the World Restaurant Delivery Robots, By Robots Type Outlook (USD Billion, 2018-2032)

        • Semi-Autonomous
        • Fully Autonomous
      • Rest of the World Restaurant Delivery Robots, By Service Type (USD Billion, 2018-2032)

        • Limited
        • Full-service
      • Rest of the World Restaurant Delivery Robots, By Restaurant Type Outlook (USD Billion, 2018-2032)

        • Independent
        • Chained
      • Rest of the World Restaurant Delivery Robots, By Load Capacity Outlook (USD Billion, 2018-2032)

        • Up to 10 KG
        • 10-50 KG
        • More Than 50 KG


      • Middle East & Africa Outlook (USD Billion, 2018-2032)

        • Middle East & Africa Restaurant Delivery Robots, By Robots Type Outlook (USD Billion, 2018-2032)

          • Semi-Autonomous
          • Fully Autonomous
        • Middle East & Africa Restaurant Delivery Robots, By Service Type (USD Billion, 2018-2032)

          • Limited
          • Full-service
        • Middle East & Africa Restaurant Delivery Robots, By Restaurant Type Outlook (USD Billion, 2018-2032)

          • Independent
          • Chained
        • Middle East & Africa Restaurant Delivery Robots, By Load Capacity Outlook (USD Billion, 2018-2032)

          • Up to 10 KG
          • 10-50 KG
          • More Than 50 KG


      • South America Outlook (USD Billion, 2018-2032)

        • South America Restaurant Delivery Robots, By Robots Type Outlook (USD Billion, 2018-2032)

          • Semi-Autonomous
          • Fully Autonomous
        • South America Restaurant Delivery Robots, By Service Type (USD Billion, 2018-2032)

          • Limited
          • Full-service
        • South America Restaurant Delivery Robots, By Restaurant Type Outlook (USD Billion, 2018-2032)

          • Independent
          • Chained
        • South America Restaurant Delivery Robots, By Load Capacity Outlook (USD Billion, 2018-2032)

          • Up to 10 KG
          • 10-50 KG
          • More Than 50 KG


    Restaurant Delivery Robot Market Research Report - Global Forecast till 2032 Infographic
    Free Sample Request

    Kindly complete the form below to receive a free sample of this Report

    Customer Strories

    “I am very pleased with how market segments have been defined in a relevant way for my purposes (such as "Portable Freezers & refrigerators" and "last-mile"). In general the report is well structured. Thanks very much for your efforts.”

    Victoria Milne Founder
    Case Study

    Chemicals and Materials