• Cat-intel
  • MedIntelliX
  • Resources
  • About Us
  • Request Free Sample ×

    Kindly complete the form below to receive a free sample of this Report

    Leading companies partner with us for data-driven Insights

    clients tt-cursor

    Real Estate Software Market

    ID: MRFR/ICT/8081-CR
    141 Pages
    Ankit Gupta
    March 2023

    Real Estate Software Market Research Report Information By Component (Software and Service), By Deployment (On-Premise, and Cloud), By Application (Commercial and Residential), And By Region (North America, Europe, Asia-Pacific, And Rest Of The World) – Market Forecast Till 2030

    Share:
    Download PDF ×

    We do not share your information with anyone. However, we may send you emails based on your report interest from time to time. You may contact us at any time to opt-out.

    Real Estate Software Market Research Report - Global Forecast till 2030 Infographic
    Purchase Options
    $ 4,950.0
    $ 5,950.0
    $ 7,250.0
    Table of Contents

    Real Estate Software Market Summary

    As per Market Research Future Analysis, the Real Estate Software Market was valued at USD 6.5 billion in 2022 and is projected to grow from USD 7.1565 billion in 2023 to USD 12.7474 billion by 2030, with a CAGR of 10.10% during the forecast period. The demand for real estate software is driven by the need for better data management and analysis, as professionals seek to streamline operations and gain actionable insights. The market is experiencing growth due to increasing digital solutions, automation of tasks, and improved communication among stakeholders. Cloud-based software is gaining traction, accounting for approximately 65-67% of market revenue in 2022, while the residential application sector held the largest share, with commercial applications expected to grow the fastest.

    Key Market Trends & Highlights

    The Real Estate Software Market is witnessing significant trends driven by technological advancements and changing industry needs.

    • Market Size in 2022: USD 6.5 billion
    • Projected Market Size by 2030: USD 12.7474 billion
    • CAGR from 2023 to 2030: 10.10%
    • Cloud segment revenue share in 2022: 65-67%

    Market Size & Forecast

    2022 Market Size USD 6.5 billion
    2023 Market Size USD 7.1565 billion
    2030 Market Size USD 12.7474 billion
    CAGR (2023-2030) 10.10%

    Major Players

    Key players include IBM Corporation, Accruent, Trimble Inc., Yardi Systems, RealPage, and others.

    Real Estate Software Market Trends

    Increasing demand for digital solutions to boost the market growth

    The Global Real Estate Software Market appears to be evolving rapidly, driven by advancements in technology and increasing demand for efficient property management solutions.

    U.S. Department of Commerce

    Real Estate Software Market Drivers

    Market Growth Projections

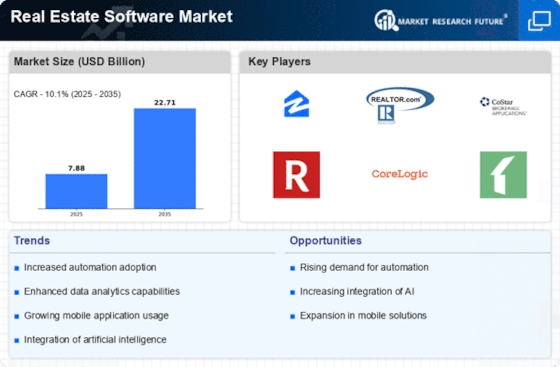
    The Global Real Estate Software Market Industry is projected to experience substantial growth, with estimates indicating a rise from 7.93 USD Billion in 2024 to 20.6 USD Billion by 2035. This growth trajectory suggests a compound annual growth rate of 9.08% from 2025 to 2035, reflecting increasing investments in technology and software solutions. The expansion of urban areas and the growing complexity of real estate transactions are likely to drive demand for innovative software tools. As the industry adapts to changing market dynamics, stakeholders are expected to prioritize technology adoption to enhance operational efficiency and customer satisfaction.

    Technological Advancements

    The Global Real Estate Software Market Industry experiences substantial growth due to rapid technological advancements. Innovations such as artificial intelligence, machine learning, and blockchain are transforming property management, transaction processes, and customer relationship management. For instance, AI-driven analytics tools enable real estate professionals to make data-informed decisions, enhancing operational efficiency. As of 2024, the market is valued at 7.93 USD Billion, reflecting the increasing adoption of these technologies. The integration of smart home technologies further drives demand, as consumers seek seamless experiences. This trend suggests a promising trajectory for the industry, potentially reaching 20.6 USD Billion by 2035.

    Emergence of Cloud-Based Solutions

    The Global Real Estate Software Market Industry is witnessing a shift towards cloud-based solutions, which offer flexibility, scalability, and cost-effectiveness. These platforms enable real estate professionals to access critical data and tools from anywhere, facilitating remote work and collaboration. The transition to cloud technology is particularly appealing to small and medium-sized enterprises that may lack the resources for extensive IT infrastructure. As the market evolves, the adoption of cloud-based software is expected to rise, aligning with the broader trend of digital transformation across industries. This shift could potentially reshape the competitive landscape of the real estate software market.

    Regulatory Compliance and Risk Management

    The Global Real Estate Software Market Industry faces increasing pressure from regulatory compliance and risk management requirements. Real estate firms must navigate a complex landscape of regulations, including zoning laws, environmental regulations, and financial reporting standards. Software solutions that assist in compliance management and risk assessment are gaining traction as they help organizations mitigate potential legal issues and financial penalties. The demand for such tools is likely to grow as regulations evolve, emphasizing the importance of maintaining compliance. This trend is indicative of a broader shift towards accountability and transparency in the real estate sector.

    Growth of Real Estate Investment Trusts (REITs)

    The Global Real Estate Software Market Industry is significantly influenced by the growth of Real Estate Investment Trusts (REITs). As more investors seek to diversify their portfolios through real estate, the demand for software that facilitates investment analysis, portfolio management, and performance tracking is increasing. REITs require sophisticated tools to manage their assets effectively and report to stakeholders. The market's expansion is reflected in the anticipated growth from 7.93 USD Billion in 2024 to 20.6 USD Billion by 2035. This trend highlights the necessity for software solutions that cater specifically to the needs of REITs, ensuring efficient management and compliance.

    Increased Demand for Property Management Solutions

    The Global Real Estate Software Market Industry is propelled by the rising demand for efficient property management solutions. As the real estate sector expands, property managers require sophisticated tools to streamline operations, manage tenant relationships, and optimize rental income. Software solutions that offer features such as automated rent collection, maintenance tracking, and tenant communication are becoming essential. This trend is evidenced by the projected compound annual growth rate of 9.08% from 2025 to 2035, indicating a robust market response to these needs. The growing complexity of property management in urban areas further underscores the necessity for advanced software solutions.

    Market Segment Insights

    Real Estate Software Components Insights

    The Real Estate Software Market segmentation, based on components, includes software and services. The software segment dominates the market and accounts for the largest share of the market revenue share in the Real Estate Software Market revenue. The software segment includes various software solutions such as property management, real estate accounting, and real estate CRM software. These software solutions are designed to help real estate professionals manage their operations more efficiently and effectively. The demand for real estate software is driven by the increasing use of technology in the industry and the need for better data management and analysis.

    For instance, in June 2022, Hyland, a content services provider, announced the availability of its most recent product improvements and upgraded solutions to help its clients through the digital transformation path.

    Real Estate Software Deployment Insights

    Based on the deployment, the Real Estate Software Market segmentation includes On-Premise and Cloud. Throughout the projection period, the cloud segment held the majority share in 2022, contributing to around ~65-67% of the Real Estate Software Market revenue. Cloud-based software allows real estate organizations to access data more quickly and efficiently, enhancing workflow productivity. Moreover, cloud deployment models with improved security requirements enable efficient administration of massive amounts of data. The huge increase in worldwide construction activity is predicted to boost the use of cloud technology to manage enterprises better and enhance efficiency and productivity via data to simplify procedures.

    For instance, in May 2022, Sage, a provider of accounting, financial, human resources (HR), and payroll technology for small and medium-sized businesses (SMBs), announced the release of Sage Intacct Real Estate. This new module adds property management functionality to the Sage Intacct cloud financial management system. This solution combines Sage 300 Construction and Real Estate (CRE) Property Management with Sage Intacct's multi-tenant cloud platform.

    Real Estate Software Application Insights

    Based on application, the Real Estate Software Market data includes commercial and residential. In 2022, the residential application sector had the largest share. Nonetheless, commercial applications are expected to be the fastest-growing area over the projection period. In recent years, there has been a considerable increase in demand for real estate software in both the residential and commercial sectors. Rising homeownership rates and steadily growing residential property values fuel demand for real estate software. Modern infrastructure has been added to buildings, and commercial space has expanded dramatically in recent years.

    Furthermore, in many nations, the number of retail establishments requiring property knowledge and building leases has also increased. Real estate software solutions may help organizations and customers learn about the industry, positively impacting market growth.

    Figure 2: Real Estate Software Market, by Application, 2022 & 2030 (USD billion)

    Real Estate Software Market, by Application

    Source Secondary Research, Primary Research, Market Research Future Database and Analyst Review

    Regional Insights

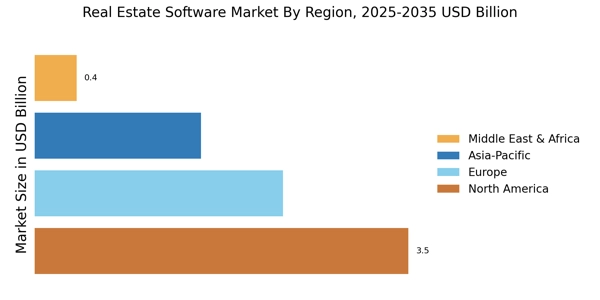
    By Region, the study provides market insights into North America, Europe, Asia-Pacific and Rest of the World. In 2022, North America dominated the real estate software industry, with approximately 45.80% of global revenue. Increased urbanization and infrastructure development activities and the adoption of innovative technologies for various commercial and residential applications are boosting market expansion in this area. The COVID-19 epidemic has substantially influenced consumer and corporate emotions in the region, resulting in the construction industry's poor growth rate.

    However, the sector will likely revive in 2021 as infrastructure expenditures grow and a greater emphasis is placed on smart city initiatives.

    Further, the major countries studied in the market report are The U.S, Canada, Germany, France, UK, Italy, Spain, China, Japan, India, Australia, South Korea, and Brazil.

    Figure 3: REAL ESTATE SOFTWARE MARKET SHARE BY REGION 2022 (%)

    REAL ESTATE SOFTWARE MARKET SHARE BY REGION

    Source Secondary Research, Primary Research, Market Research Future Database and Analyst Review

    Asia Pacific real estate software market is predicted to be the fastest-growing regional market. The positive development of regional economies and the potential expansion of the building sector are attributable to the boom. Because of the rise of the real estate business in India, Singapore, Japan, China, and Southeast Asian countries, the area is regarded as a key market for real estate software. Further, the China real estate software market held the largest market share, and the India real estate software market was the fastest-growing market in the region.

    Europe real estate software market is expected to grow at the fastest CAGR from 2022 to 2030 due to the growing use of mobile devices contributing to the growth of the real estate software market in Europe. Real estate professionals increasingly rely on mobile devices to access data and communicate with clients and colleagues. Further, the Germany real estate software market held the largest market share, and the UK real estate software market was the fastest-growing market in the European region.

    Key Players and Competitive Insights

    Major market players are spending a lot of money on R&D to increase their product lines, which will help the real estate software market grow even more. Market participants are also taking various strategic initiatives to grow their worldwide footprint, with key market developments such as new product launches, contractual agreements, mergers and acquisitions, increased investments, and collaboration with other organizations. Competitors in the real estate software industry must offer cost-effective items to expand and survive in an increasingly competitive and rising market environment.

    One of the primary business strategies manufacturers adopt in the global real estate software industry to benefit clients and expand the market sector is manufacturing locally to reduce operating costs. In recent years, the real estate software industry has provided medicine with some of the most significant benefits. The real estate software market major player such as IBM Corporation (US), Accruent (US), Trimble Inc. (US), Yardi Systems (US), RealPage (US), and others are working on expanding the market demand by investing in research and development activities.

    IBM Corporation offers real estate software solutions that help professionals manage their operations more efficiently and effectively. IBM's real estate software solutions are designed to provide end-to-end support for real estate companies, from property management to lease accounting and financial management. IBM's real estate software solutions are designed to be scalable and configurable, so they can be customized to meet the specific needs of different real estate organizations.

    For Instance, in June 2022, SL Green Realty Corp., Manhattan's biggest office landlord, and IBM announced that SL Green is employing IBM sustainability tools to advance their company's environmental, social, and governance (ESG) agenda. SL Green will employ Envizi, an IBM Company, software to better evaluate and report on its environmental programs, discover possibilities for increased efficiency, and promote sustainability throughout its large real estate operations.

    Also, Accruent is a global software company that provides real estate and facilities management solutions to help businesses manage their real estate portfolios and facilities more efficiently. Accruent's real estate software solutions are designed to improve the performance and profitability of real estate organizations by optimizing their operations and providing data-driven insights.

    For Instance, in May 2022, Accruent, the leading provider of built-environment solutions, announced the release of Lx Transaction Management, a powerful new tool for lease administrators, transaction managers, real estate executives, and other real estate professionals to manage transactions in a single pane of glass as they move through the real estate lifecycle.

    Key Companies in the Real Estate Software Market market include

    Industry Developments

    • Q2 2024: AppFolio Introduces Realm-X, an Embedded AI Platform to Enhance Property Management Productivity AppFolio launched Realm-X, an AI-driven platform designed to automate property management tasks and workflows, including new tools like Realm-X Assistant and Messages for real-time assistance and customizable workflow automation.

    Future Outlook

    Real Estate Software Market Future Outlook

    The Real Estate Software Market is projected to grow at a 9.08% CAGR from 2024 to 2035, driven by technological advancements, increased demand for automation, and enhanced data analytics capabilities.

    New opportunities lie in:

    • Develop AI-driven property management solutions to optimize operational efficiency.
    • Create integrated platforms for virtual property tours and remote transactions.
    • Leverage blockchain technology for secure and transparent real estate transactions.

    By 2035, the Real Estate Software Market is expected to achieve substantial growth, reflecting evolving industry demands.

    Market Segmentation

    Real Estate Software Regional Outlook

    • US
    • Canada

    Real Estate Software Component Outlook

    • Software
    • Service

    Real Estate Software Deployment Outlook

    • On-Premise
    • Cloud

    Real Estate Software Application Outlook

    • Commercial
    • Residential

    Report Scope

    Report Attribute/Metric Details
    Market Size 2022 USD 6.5 billion
    Market Size 2023 USD 7.1565 billion
    Market Size 2030 USD 12.7474 billion
    Compound Annual Growth Rate (CAGR) 10.10% (2023-2030)
    Base Year 2022
    Market Forecast Period 2023-2030
    Historical Data 2019 - 2021
    Market Forecast Units Value (USD Billion)
    Report Coverage Revenue Forecast, Market Competitive Landscape, Growth Factors, and Trends
    Segments Covered Components, Deployment, Application, and Region
    Geographies Covered North America, Europe, Asia Pacific, and Rest of the World
    Countries Covered The U.S, Canada, Germany, France, UK, Italy, Spain, China, Japan, India, Australia, South Korea, and Brazil
    Key Companies Profiled IBM Corporation (US), Accruent (US), Trimble Inc. (US), Yardi Systems (US), RealPage (US), MRI Software (US), Fiserv Inc. (US), Oracle Corporation (US), SAP SE (Germany), Autodesk Inc. (US), CoStar Group Inc. (US)
    Key Market Opportunities Integration of AI and machine learning
    Key Market Dynamics The growing use of mobile devices Need for increased efficiency and productivity

    Market Highlights

    Author
    Ankit Gupta
    Senior Research Analyst

    Ankit Gupta is an analyst in market research industry in ICT and SEMI industry. With post-graduation in "Telecom and Marketing Management" and graduation in "Electronics and Telecommunication" vertical he is well versed with recent development in ICT industry as a whole. Having worked on more than 150+ reports including consultation for fortune 500 companies such as Microsoft and Rio Tinto in identifying solutions with respect to business problems his opinions are inclined towards mixture of technical and managerial aspects.

    Leave a Comment

    FAQs

    How much is the real estate software market?

    The Real Estate Software Market size was valued at USD 6.5 Billion in 2022.

    What is the growth rate of the real estate software market?

    The global market is projected to grow at a CAGR of 10.10% during the forecast period 2023-2030.

    Which region held the largest market share in the real estate software market?

    Asia Pacific had the largest share of the global market

    Who are the key players in the real estate software market?

    The key players in the market are IBM Corporation (US), Accruent (US), Trimble Inc. (US), Yardi Systems (US), and RealPage (US).

    Which component led the real estate software market?

    The Software category dominated the market in 2022.

    Which application segment had the largest real estate software market share?

    The residential segment had the largest share of the global market.

    1. EXECUTIVE SUMMARY
    2. MARKET ATTRACTIVENESS ANALYSIS
      1. GLOBAL REAL ESTATE SOFTWARE
    3. MARKET, BY COMPONENT
      1. GLOBAL REAL ESTATE SOFTWARE MARKET, BY
    4. DEPLOYMENT
      1. GLOBAL REAL ESTATE SOFTWARE MARKET, BY APPLICATION
    5. GLOBAL REAL ESTATE SOFTWARE MARKET, BY REGION
    6. MARKET INTRODUCTION
    7. DEFINITION
      1. SCOPE OF THE STUDY
      2. MARKET STRUCTURE
    8. RESEARCH METHODOLOGY
      1. RESEARCH PROCESS
      2. PRIMARY
    9. RESEARCH
      1. SECONDARY RESEARCH
      2. MARKET SIZE ESTIMATION
    10. FORECAST APPLICATION
      1. LIST OF ASSUMPTIONS
    11. MARKET
    12. DYNAMICS
      1. INTRODUCTION
      2. DRIVERS
    13. INCREASING NEED TO MANAGE AND ANALYZE ASPECTS OF WEALTH, ASSETS AND TRANSACTIONS
    14. IN REAL ESTATE
      1. GROWING ADOPTION OF CLOUD-BASED SOLUTIONS
    15. DRIVERS IMPACT ANALYSIS
      1. RESTRAINT
        1. DATA PRIVACY
    16. AND SECURITY CONCERNS RELATED WITH CLOUD PLATFORM
      1. RESTRAINTS
    17. IMPACT ANALYSIS
      1. OPPORTUNITIES
        1. INTEGRATION
    18. OF ANALYTICS WITH TRANSACTION MANAGEMENT SOFTWARE
    19. MARKET FACTOR ANALYSIS
      1. VALUE CHAIN ANALYSIS/SUPPLY CHAIN ANALYSIS
    20. PORTER’S FIVE FORCES APPLICATION
      1. BARGAINING POWER OF
    21. SUPPLIERS
      1. BARGAINING POWER OF BUYERS
        1. THREAT
    22. OF NEW ENTRANTS
      1. THREAT OF SUBSTITUTES
    23. INTENSITY OF RIVALRY
    24. GLOBAL REAL ESTATE SOFTWARE MARKET, BY COMPONENT
    25. INTRODUCTION
      1. SOFTWARE
        1. ENTERPRISE RESOURCE
    26. PLANNING
      1. CUSTOMER RELATIONSHIP MANAGEMENT
    27. BILLING AND REVENUE MANAGEMENT (BRM)
      1. ENTERPRISE CONTENT MANAGEMENT
    28. OTHERS
      1. SERVICES
        1. INTEGRATION & DEPLOYMENT
    29. CONSULTING
      1. MAINTENANCE & SUPPORT
    30. GLOBAL
    31. REAL ESTATE SOFTWARE MARKET, BY DEPLOYMENT
      1. INTRODUCTION
    32. CLOUD
      1. ON-PREMISE
    33. GLOBAL REAL ESTATE SOFTWARE
    34. MARKET, BY APPLICATION
      1. INTRODUCTION
      2. COMMERCIAL
    35. RESIDENTIAL
    36. GLOBAL REAL ESTATE SOFTWARESOFTWARE MARKET, BY REGION
    37. OVERVIEW
      1. NORTH AMERICA
        1. MARKET ESTIMATES
    38. & FORECAST, BY COUNTRY, 2023-2030
      1. MARKET ESTIMATES &
    39. FORECAST, BY COMPONENT, 2023-2030
      1. MARKET ESTIMATES & FORECAST,
    40. BY DEPLOYMENT, 2023-2030
      1. MARKET ESTIMATES & FORECAST, BY
    41. ORGANIZATION SIZE, 2023-2030
      1. MARKET ESTIMATES & FORECAST,
    42. BY APPLICATION, 2023-2030
      1. US
        1. MARKET
    43. ESTIMATES & FORECAST, BY COMPONENT, 2023-2030
      1. MARKET
    44. ESTIMATES & FORECAST, BY DEPLOYMENT, 2023-2030
      1. MARKET
    45. ESTIMATES & FORECAST, BY ORGANIZATION SIZE, 2023-2030
    46. MARKET ESTIMATES & FORECAST, BY APPLICATION, 2023-2030
    47. CANADA
      1. MARKET ESTIMATES & FORECAST, BY COMPONENT, 2023-2030
    48. MARKET ESTIMATES & FORECAST, BY DEPLOYMENT, 2023-2030
    49. MARKET ESTIMATES & FORECAST, BY ORGANIZATION SIZE, 2023-2030
    50. MARKET ESTIMATES & FORECAST, BY APPLICATION, 2023-2030
    51. MEXICO
      1. MARKET ESTIMATES & FORECAST, BY COMPONENT, 2023-2030
    52. MARKET ESTIMATES & FORECAST, BY DEPLOYMENT, 2023-2030
    53. MARKET ESTIMATES & FORECAST, BY ORGANIZATION SIZE, 2023-2030
    54. MARKET ESTIMATES & FORECAST, BY APPLICATION, 2023-2030
      1. EUROPE
    55. MARKET ESTIMATES & FORECAST, BY COUNTRY, 2023-2030
      1. MARKET
    56. ESTIMATES & FORECAST, BY COMPONENT, 2023-2030
      1. MARKET ESTIMATES
    57. & FORECAST, BY DEPLOYMENT, 2023-2030
      1. MARKET ESTIMATES &
    58. FORECAST, BY ORGANIZATION SIZE, 2023-2030
      1. MARKET ESTIMATES
    59. & FORECAST, BY APPLICATION, 2023-2030
      1. GERMANY
    60. MARKET ESTIMATES & FORECAST, BY COMPONENT, 2023-2030
    61. MARKET ESTIMATES & FORECAST, BY DEPLOYMENT, 2023-2030
    62. MARKET ESTIMATES & FORECAST, BY ORGANIZATION SIZE, 2023-2030
    63. MARKET ESTIMATES & FORECAST, BY APPLICATION, 2023-2030
    64. UK
      1. MARKET ESTIMATES & FORECAST, BY COMPONENT, 2023-2030
    65. MARKET ESTIMATES & FORECAST, BY DEPLOYMENT, 2023-2030
    66. MARKET ESTIMATES & FORECAST, BY ORGANIZATION SIZE, 2023-2030
    67. MARKET ESTIMATES & FORECAST, BY APPLICATION, 2023-2030
    68. FRANCE
      1. MARKET ESTIMATES & FORECAST, BY COMPONENT, 2023-2030
    69. MARKET ESTIMATES & FORECAST, BY DEPLOYMENT, 2023-2030
    70. MARKET ESTIMATES & FORECAST, BY ORGANIZATION SIZE, 2023-2030
    71. MARKET ESTIMATES & FORECAST, BY APPLICATION, 2023-2030
    72. GERMANY
      1. MARKET ESTIMATES & FORECAST, BY COMPONENT, 2023-2030
    73. MARKET ESTIMATES & FORECAST, BY DEPLOYMENT, 2023-2030
    74. MARKET ESTIMATES & FORECAST, BY ORGANIZATION SIZE, 2023-2030
    75. MARKET ESTIMATES & FORECAST, BY APPLICATION, 2023-2030
    76. REST OF EUROPE
      1. MARKET ESTIMATES & FORECAST, BY COMPONENT,
        1. MARKET ESTIMATES & FORECAST, BY DEPLOYMENT,
    77. SIZE, 2023-2030
      1. MARKET ESTIMATES & FORECAST, BY APPLICATION,
      2. ASIA PACIFIC
        1. MARKET ESTIMATES
    78. & FORECAST, BY COUNTRY, 2023-2030
      1. MARKET ESTIMATES &
    79. FORECAST, BY COMPONENT, 2023-2030
      1. MARKET ESTIMATES & FORECAST,
    80. BY DEPLOYMENT, 2023-2030
      1. MARKET ESTIMATES & FORECAST, BY
    81. ORGANIZATION SIZE, 2023-2030
      1. MARKET ESTIMATES & FORECAST,
    82. BY APPLICATION, 2023-2030
      1. CHINA
        1. MARKET
    83. ESTIMATES & FORECAST, BY COMPONENT, 2023-2030
      1. MARKET
    84. ESTIMATES & FORECAST, BY DEPLOYMENT, 2023-2030
      1. MARKET
    85. ESTIMATES & FORECAST, BY ORGANIZATION SIZE, 2023-2030
    86. MARKET ESTIMATES & FORECAST, BY APPLICATION, 2023-2030
    87. JAPAN
      1. MARKET ESTIMATES & FORECAST, BY COMPONENT, 2023-2030
    88. MARKET ESTIMATES & FORECAST, BY DEPLOYMENT, 2023-2030
    89. MARKET ESTIMATES & FORECAST, BY ORGANIZATION SIZE, 2023-2030
    90. MARKET ESTIMATES & FORECAST, BY APPLICATION, 2023-2030
    91. INDIA
      1. MARKET ESTIMATES & FORECAST, BY COMPONENT, 2023-2030
    92. MARKET ESTIMATES & FORECAST, BY DEPLOYMENT, 2023-2030
    93. MARKET ESTIMATES & FORECAST, BY ORGANIZATION SIZE, 2023-2030
    94. MARKET ESTIMATES & FORECAST, BY APPLICATION, 2023-2030
    95. REST OF ASIA-PACIFIC
      1. MARKET ESTIMATES & FORECAST, BY
    96. COMPONENT, 2023-2030
      1. MARKET ESTIMATES & FORECAST, BY
    97. DEPLOYMENT, 2023-2030
      1. MARKET ESTIMATES & FORECAST, BY
    98. ORGANIZATION SIZE, 2023-2030
      1. MARKET ESTIMATES & FORECAST,
    99. BY APPLICATION, 2023-2030
      1. MIDDLE EAST AND AFRICA
    100. MARKET ESTIMATES & FORECAST, BY COUNTRY, 2023-2030
      1. MARKET
    101. ESTIMATES & FORECAST, BY COMPONENT, 2023-2030
      1. MARKET ESTIMATES
    102. & FORECAST, BY DEPLOYMENT, 2023-2030
      1. MARKET ESTIMATES &
    103. FORECAST, BY ORGANIZATION SIZE, 2023-2030
      1. MARKET ESTIMATES
    104. & FORECAST, BY APPLICATION, 2023-2030
      1. SOUTH AMERICA
    105. MARKET ESTIMATES & FORECAST, BY COUNTRY, 2023-2030
      1. MARKET
    106. ESTIMATES & FORECAST, BY COMPONENT, 2023-2030
      1. MARKET ESTIMATES
    107. & FORECAST, BY DEPLOYMENT, 2023-2030
      1. MARKET ESTIMATES &
    108. FORECAST, BY ORGANIZATION SIZE, 2023-2030
      1. MARKET ESTIMATES
    109. & FORECAST, BY APPLICATION, 2023-2030
    110. COMPETITIVE LANDSCAPE
    111. INTRODUCTION
      1. KEY DEVELOPMENTS & GROWTH STRATEGIES
    112. COMPETITOR BENCHMARKING
      1. VENDOR SHARE ANALYSIS
    113. COMPANY PROFILES
      1. IBM CORPORATION
        1. COMPANY
    114. OVERVIEW
      1. FINANCIAL OVERVIEW
        1. PRODUCTS/COMPONENTS/APPLICATIONS
    115. OFFERED
      1. KEY DEVELOPMENTS
        1. SWOT ANALYSIS
    116. KEY STRATEGIES
      1. ACCRUENT
        1. COMPANY OVERVIEW
    117. FINANCIAL OVERVIEW
      1. PRODUCTS/COMPONENTS/APPLICATIONS OFFERED
    118. KEY DEVELOPMENTS
      1. SWOT ANALYSIS
        1. KEY STRATEGIES
    119. TRIMBLE, INC
      1. COMPANY OVERVIEW
        1. FINANCIAL
    120. OVERVIEW
      1. PRODUCTS/COMPONENTS/APPLICATIONS OFFERED
    121. KEY DEVELOPMENTS
      1. SWOT ANALYSIS
        1. KEY STRATEGIES
    122. YARDI SYSTEMS
      1. COMPANY OVERVIEW
        1. FINANCIAL
    123. OVERVIEW
      1. PRODUCTS/COMPONENTS/APPLICATIONS OFFERED
    124. KEY DEVELOPMENTS
      1. SWOT ANALYSIS
        1. KEY STRATEGIES
    125. REALPAGE
      1. COMPANY OVERVIEW
        1. FINANCIAL
    126. OVERVIEW
      1. PRODUCTS/COMPONENTS/APPLICATIONS OFFERED
    127. KEY DEVELOPMENTS
      1. SWOT ANALYSIS
        1. KEY STRATEGIES
    128. MRI SOFTWARE
      1. COMPANY OVERVIEW
        1. FINANCIAL
    129. OVERVIEW
      1. PRODUCTS/COMPONENTS/APPLICATIONS OFFERED
    130. KEY DEVELOPMENTS
      1. SWOT ANALYSIS
        1. KEY STRATEGIES
    131. FISERV INC.
      1. COMPANY OVERVIEW
        1. FINANCIAL
    132. OVERVIEW
      1. PRODUCTS/COMPONENTS/APPLICATIONS OFFERED
    133. KEY DEVELOPMENTS
      1. SWOT ANALYSIS
        1. KEY STRATEGIES
    134. ORACLE CORPORATION
      1. COMPANY OVERVIEW
    135. FINANCIAL OVERVIEW
      1. PRODUCTS/COMPONENTS/APPLICATIONS OFFERED
    136. KEY DEVELOPMENTS
      1. SWOT ANALYSIS
        1. KEY STRATEGIES
    137. SAP SE
      1. COMPANY OVERVIEW
        1. FINANCIAL OVERVIEW
    138. PRODUCTS/COMPONENTS/APPLICATIONS OFFERED
      1. KEY DEVELOPMENTS
    139. SWOT ANALYSIS
      1. KEY STRATEGIES
      2. AUTODESK
    140. INC.
      1. COMPANY OVERVIEW
        1. FINANCIAL OVERVIEW
    141. PRODUCTS/COMPONENTS/APPLICATIONS OFFERED
      1. KEY DEVELOPMENTS
    142. SWOT ANALYSIS
      1. KEY STRATEGIES
      2. S
    143. COMPANY OVERVIEW
      1. FINANCIAL OVERVIEW
    144. PRODUCTS/COMPONENTS/APPLICATIONS OFFERED
      1. KEY DEVELOPMENTS
    145. SWOT ANALYSIS
      1. KEY STRATEGIES
      2. NEMETSCHEK
    146. INC
      1. COMPANY OVERVIEW
        1. FINANCIAL OVERVIEW
    147. PRODUCTS/COMPONENTS/APPLICATIONS OFFERED
      1. KEY DEVELOPMENTS
    148. SWOT ANALYSIS
      1. KEY STRATEGIES
    149. APPENDIX
    150. DISCUSSION BLUEPRINT
    151. NOTE:
    152. THIS
    153. IN SECTION 11, ONLY THE TOP 16 COMPANIES WILL BE PROFILED. EACH COMPANY WILL BE
    154. PROFILED BASED ON THE MARKET OVERVIEW, FINANCIALS, PRODUCT PORTFOLIO, BUSINESS STRATEGIES,
    155. AND RECENT DEVELOPMENTS PARAMETERS.
    156.  PLEASE NOTE: THE FINANCIAL DETAILS
    157. OF THE COMPANY CANNOT BE PROVIDED IF THE INFORMATION IS NOT AVAILABLE IN THE PUBLIC
    158. DOMAIN AND OR FROM RELIABLE SOURCES.
    159. ESTATE SOFTWARESOFTWARE MARKET, BY COMPONENT, 2023–2030 (USD MILLION)
    160. GLOBAL REAL ESTATE SOFTWARESOFTWARE MARKET, BY DEPLOYMENT, 2023–2030 (USD
    161. MILLION)
    162. SIZE, 2023–2030 (USD MILLION)
    163. MARKET, BY APPLICATION, 2023–2030 (USD MILLION)
    164. REAL ESTATE SOFTWARESOFTWARE MARKET, BY REGION, 2023–2030 (USD MILLION)
    165. NORTH AMERICA: REAL ESTATE SOFTWARESOFTWARE MARKET, BY COUNTRY, 2023–2030
    166. (USD MILLION)
    167. MARKET, BY COMPONENT, 2023–2030 (USD MILLION)
    168. AMERICA: REAL ESTATE SOFTWARESOFTWARE MARKET, BY DEPLOYMENT, 2023–2030 (USD
    169. MILLION)
    170. BY ORGANIZATION SIZE, 2023–2030 (USD MILLION)
    171. AMERICA: REAL ESTATE SOFTWARESOFTWARE MARKET, BY APPLICATION, 2023–2030 (USD
    172. MILLION)
    173. –2030 (USD MILLION)
    174. MARKET, BY DEPLOYMENT, 2023–2030 (USD MILLION)
    175. REAL ESTATE SOFTWARESOFTWARE MARKET, BY ORGANIZATION SIZE, 2023–2030 (USD
    176. MILLION)
    177. –2030 (USD MILLION)
    178. MARKET, BY COMPONENT, 2023–2030 (USD MILLION)
    179. REAL ESTATE SOFTWARESOFTWARE MARKET, BY DEPLOYMENT, 2023–2030 (USD MILLION)
    180. CANADA: REAL ESTATE SOFTWARESOFTWARE MARKET, BY ORGANIZATION SIZE, 2023–2030
    181. (USD MILLION)
    182. BY APPLICATION, 2023–2030 (USD MILLION)
    183. ESTATE SOFTWARESOFTWARE MARKET, BY COMPONENT, 2023–2030 (USD MILLION)
    184. MEXICO: REAL ESTATE SOFTWARESOFTWARE MARKET, BY DEPLOYMENT, 2023–2030 (USD
    185. MILLION)
    186. ORGANIZATION SIZE, 2023–2030 (USD MILLION)
    187. REAL ESTATE SOFTWARESOFTWARE MARKET, BY APPLICATION, 2023–2030 (USD MILLION)
    188. EUROPE: REAL ESTATE SOFTWARESOFTWARE MARKET, BY COUNTRY, 2023–2030 (USD
    189. MILLION)
    190. COMPONENT, 2023–2030 (USD MILLION)
    191. SOFTWARESOFTWARE MARKET, BY DEPLOYMENT, 2023–2030 (USD MILLION)
    192. EUROPE: REAL ESTATE SOFTWARESOFTWARE MARKET, BY ORGANIZATION SIZE, 2023–2030
    193. (USD MILLION)
    194. BY APPLICATION, 2023–2030 (USD MILLION)
    195. SOFTWARESOFTWARE MARKET, BY COMPONENT, 2023–2030 (USD MILLION)
    196. UK: REAL ESTATE SOFTWARESOFTWARE MARKET, BY DEPLOYMENT, 2023–2030 (USD
    197. MILLION)
    198. SIZE, 2023–2030 (USD MILLION)
    199. MARKET, BY APPLICATION, 2023–2030 (USD MILLION)
    200. REAL ESTATE SOFTWARESOFTWARE MARKET, BY COMPONENT, 2023–2030 (USD MILLION)
    201. GERMANY: REAL ESTATE SOFTWARESOFTWARE MARKET, BY DEPLOYMENT, 2023–2030
    202. (USD MILLION)
    203. BY ORGANIZATION SIZE, 2023–2030 (USD MILLION)
    204. REAL ESTATE SOFTWARESOFTWARE MARKET, BY APPLICATION, 2023–2030 (USD MILLION)
    205. FRANCE: REAL ESTATE SOFTWARESOFTWARE MARKET, BY COMPONENT, 2023–2030 (USD
    206. MILLION)
    207. DEPLOYMENT, 2023–2030 (USD MILLION)
    208. SOFTWARESOFTWARE MARKET, BY ORGANIZATION SIZE, 2023–2030 (USD MILLION)
    209. FRANCE: REAL ESTATE SOFTWARESOFTWARE MARKET, BY APPLICATION, 2023–2030
    210. (USD MILLION)
    211. MARKET, BY COMPONENT, 2023–2030 (USD MILLION)
    212. OF EUROPE: REAL ESTATE SOFTWARESOFTWARE MARKET, BY DEPLOYMENT, 2023–2030 (USD
    213. MILLION)
    214. BY ORGANIZATION SIZE, 2023–2030 (USD MILLION)
    215. OF EUROPE: REAL ESTATE SOFTWARESOFTWARE MARKET, BY APPLICATION, 2023–2030
    216. (USD MILLION)
    217. MARKET, BY COUNTRY, 2023–2030 (USD MILLION)
    218. REAL ESTATE SOFTWARESOFTWARE MARKET, BY COMPONENT, 2023–2030 (USD MILLION)
    219. ASIA-PACIFIC: REAL ESTATE SOFTWARESOFTWARE MARKET, BY DEPLOYMENT, 2023–2030
    220. (USD MILLION)
    221. MARKET, BY ORGANIZATION SIZE, 2023–2030 (USD MILLION)
    222. ASIA-PACIFIC: REAL ESTATE SOFTWARESOFTWARE MARKET, BY APPLICATION, 2023–2030
    223. (USD MILLION)
    224. BY COMPONENT, 2023–2030 (USD MILLION)
    225. SOFTWARESOFTWARE MARKET, BY DEPLOYMENT, 2023–2030 (USD MILLION)
    226. CHINA: REAL ESTATE SOFTWARESOFTWARE MARKET, BY ORGANIZATION SIZE, 2023–2030
    227. (USD MILLION)
    228. BY APPLICATION, 2023–2030 (USD MILLION)
    229. ESTATE SOFTWARESOFTWARE MARKET, BY COMPONENT, 2023–2030 (USD MILLION)
    230. INDIA: REAL ESTATE SOFTWARESOFTWARE MARKET, BY DEPLOYMENT, 2023–2030 (USD
    231. MILLION)
    232. SIZE, 2023–2030 (USD MILLION)
    233. MARKET, BY APPLICATION, 2023–2030 (USD MILLION)
    234. REAL ESTATE SOFTWARESOFTWARE MARKET, BY COMPONENT, 2023–2030 (USD MILLION)
    235. JAPAN: REAL ESTATE SOFTWARESOFTWARE MARKET, BY DEPLOYMENT, 2023–2030 (USD
    236. MILLION)
    237. SIZE, 2023–2030 (USD MILLION)
    238. MARKET, BY APPLICATION, 2023–2030 (USD MILLION)
    239. OF ASIA-PACIFIC: REAL ESTATE SOFTWARESOFTWARE MARKET, BY COMPONENT, 2023–2030
    240. (USD MILLION)
    241. MARKET, BY DEPLOYMENT, 2023–2030 (USD MILLION)
    242. OF ASIA-PACIFIC: REAL ESTATE SOFTWARESOFTWARE MARKET, BY ORGANIZATION SIZE, 2023–2030
    243. (USD MILLION)
    244. MARKET, BY APPLICATION, 2023–2030 (USD MILLION)
    245. EAST AND AFRICA: REAL ESTATE SOFTWARESOFTWARE MARKET, BY COMPONENT, 2023–2030
    246. (USD MILLION)
    247. MARKET, BY DEPLOYMENT, 2023–2030 (USD MILLION)
    248. EAST AND AFRICA: REAL ESTATE SOFTWARESOFTWARE MARKET, BY ORGANIZATION SIZE, 2023–2030
    249. (USD MILLION)
    250. MARKET, BY APPLICATION, 2023–2030 (USD MILLION)
    251. AMERICA: REAL ESTATE SOFTWARESOFTWARE MARKET, BY COMPONENT, 2023–2030 (USD
    252. MILLION)
    253. BY DEPLOYMENT, 2023–2030 (USD MILLION)
    254. REAL ESTATE SOFTWARESOFTWARE MARKET, BY ORGANIZATION SIZE, 2023–2030 (USD
    255. MILLION)
    256. BY APPLICATION, 2023–2030 (USD MILLION
    257. LIST
    258. OF FIGURES
    259. PROCESS OF MRFR
    260. GLOBAL REAL ESTATE SOFTWARESOFTWARE MARKET, BY COMPONENT, 2023–2030 (USD
    261. MILLION)
    262. –2030 (USD MILLION)
    263. MARKET, BY ORGANIZATION SIZE, 2023–2030 (USD MILLION)
    264. GLOBAL REAL ESTATE SOFTWARESOFTWARE MARKET, BY APPLICATION, 2023–2030 (USD
    265. MILLION)
    266. –2030 (USD MILLION)
    267. SOFTWARESOFTWARE MARKET, BY COUNTRY, 2023–2030 (USD MILLION)
    268. NORTH AMERICA: REAL ESTATE SOFTWARESOFTWARE MARKET, BY COMPONENT, 2023–2030
    269. (USD MILLION)
    270. MARKET, BY DEPLOYMENT, 2023–2030 (USD MILLION)
    271. AMERICA: REAL ESTATE SOFTWARESOFTWARE MARKET, BY ORGANIZATION SIZE, 2023–2030
    272. (USD MILLION)
    273. MARKET, BY APPLICATION, 2023–2030 (USD MILLION)
    274. REAL ESTATE SOFTWARESOFTWARE MARKET, BY COUNTRY, 2023–2030 (USD MILLION)
    275. EUROPE: REAL ESTATE SOFTWARESOFTWARE MARKET, BY COMPONENT, 2023–2030 (USD
    276. MILLION)
    277. DEPLOYMENT, 2023–2030 (USD MILLION)
    278. SOFTWARESOFTWARE MARKET, BY ORGANIZATION SIZE, 2023–2030 (USD MILLION)
    279. EUROPE: REAL ESTATE SOFTWARESOFTWARE MARKET, BY APPLICATION, 2023–2030
    280. (USD MILLION)
    281. MARKET, BY COUNTRY, 2023–2030 (USD MILLION)
    282. REAL ESTATE SOFTWARESOFTWARE MARKET, BY COMPONENT, 2023–2030 (USD MILLION)
    283. ASIA-PACIFIC: REAL ESTATE SOFTWARESOFTWARE MARKET, BY DEPLOYMENT, 2023–2030
    284. (USD MILLION)
    285. MARKET, BY ORGANIZATION SIZE, 2023–2030 (USD MILLION)
    286. ASIA-PACIFIC: REAL ESTATE SOFTWARESOFTWARE MARKET, BY APPLICATION, 2023–2030
    287. (USD MILLION)
    288. MARKET, BY COMPONENT, 2023–2030 (USD MILLION)
    289. EAST & AFRICA: REAL ESTATE SOFTWARESOFTWARE MARKET, BY DEPLOYMENT, 2023–2030
    290. (USD MILLION)
    291. MARKET, BY ORGANIZATION SIZE, 2023–2030 (USD MILLION)
    292. MIDDLE EAST & AFRICA: REAL ESTATE SOFTWARESOFTWARE MARKET, BY APPLICATION,
    293. –2030 (USD MILLION)
    294. SOFTWARESOFTWARE MARKET, BY COMPONENT, 2023–2030 (USD MILLION)
    295. SOUTH AMERICA: REAL ESTATE SOFTWARESOFTWARE MARKET, BY DEPLOYMENT, 2023–2030
    296. (USD MILLION)
    297. MARKET, BY ORGANIZATION SIZE, 2023–2030 (USD MILLION)
    298. SOUTH AMERICA: REAL ESTATE SOFTWARESOFTWARE MARKET, BY APPLICATION, 2023–2030
    299. (USD MILLION)

    Enterprise Artificial Intelligence Market Segmentation

    Enterprise Artificial Intelligence Solution Outlook (USD Billion, 2019-2030)

    • Business Intelligence
    • Customer Management
    • Sales & Marketing

    Enterprise Artificial Intelligence Service Outlook (USD Billion, 2019-2030)

    • Professional
    • Managed

    Enterprise Artificial Intelligence DeploymentOutlook (USD Billion, 2019-2030)

    • Cloud Deployment
    • On-Premise Deployment

    Enterprise Artificial Intelligence Industry Vertical Outlook (USD Billion, 2019-2030)

    • Retail
    • Healthcare
    • Automotive
    • Aerospace
    • Media and Entertainment
    • Banking and Financial Services
    • IT and Telecommunication

    Enterprise Artificial Intelligence Regional Outlook (USD Billion, 2019-2030)

    • North America Outlook(USD Billion, 2019-2030)

      • North America Enterprise Artificial Intelligence by Solution
        • Business Intelligence
        • Customer Management
        • Sales & Marketing
      • North America Enterprise Artificial Intelligence by Service
        • Professional
        • Managed
      • North America Enterprise Artificial Intelligence by Deployment
    • Cloud Deployment
    • On-Premise Deployment
    • North America Enterprise Artificial Intelligence by Industry Vertical
    • Retail
    • Healthcare
    • Automotive
    • Aerospace
    • Media and Entertainment
    • Banking and Financial Services
    • IT and Telecommunication
      • USOutlook (USD Billion, 2019-2030)

      • US Enterprise Artificial Intelligence by Solution
        • Business Intelligence
        • Customer Management
        • Sales & Marketing
      • US Enterprise Artificial Intelligence by Service
        • Professional
        • Managed
      • US Enterprise Artificial Intelligence by Deployment
    • Cloud Deployment
    • On-Premise Deployment
    • US Enterprise Artificial Intelligence by Industry Vertical
    • Retail
    • Healthcare
    • Automotive
    • Aerospace
    • Media and Entertainment
    • Banking and Financial Services
    • IT and Telecommunication
      • CANADA Outlook (USD Billion, 2019-2030)

      • CANADA Enterprise Artificial Intelligence by Solution
        • Business Intelligence
        • Customer Management
        • Sales & Marketing
      • CANADA Enterprise Artificial Intelligence by Service
        • Professional
        • Managed
      • CANADA Enterprise Artificial Intelligence by Deployment
    • Cloud Deployment
    • On-Premise Deployment
    • CANADA Enterprise Artificial Intelligence by Industry Vertical
    • Retail
    • Healthcare
    • Automotive
    • Aerospace
    • Media and Entertainment
    • Banking and Financial Services
    • IT and Telecommunication
    • Europe Outlook (USD Billion, 2019-2030)

      • Europe Enterprise Artificial Intelligence by Solution
        • Business Intelligence
        • Customer Management
        • Sales & Marketing
      • Europe Enterprise Artificial Intelligence by Service
        • Professional
        • Managed
      • Europe Enterprise Artificial Intelligence by Deployment
    • Cloud Deployment
    • On-Premise Deployment
    • Europe Enterprise Artificial Intelligence by Industry Vertical
    • Retail
    • Healthcare
    • Automotive
    • Aerospace
    • Media and Entertainment
    • Banking and Financial Services
    • IT and Telecommunication
      • Germany Outlook (USD Billion, 2019-2030)

      • Germany Enterprise Artificial Intelligence by Solution
        • Business Intelligence
        • Customer Management
        • Sales & Marketing
      • Germany Enterprise Artificial Intelligence by Service
        • Professional
        • Managed
      • Germany Enterprise Artificial Intelligence by Deployment
    • Cloud Deployment
    • On-Premise Deployment
    • Germany Enterprise Artificial Intelligence by Industry Vertical
    • Retail
    • Healthcare
    • Automotive
    • Aerospace
    • Media and Entertainment
    • Banking and Financial Services
    • IT and Telecommunication
      • France Outlook (USD Billion, 2019-2030)

      • France Enterprise Artificial Intelligence by Solution
        • Business Intelligence
        • Customer Management
        • Sales & Marketing
      • France Enterprise Artificial Intelligence by Service
        • Professional
        • Managed
      • France Enterprise Artificial Intelligence by Deployment
    • Cloud Deployment
    • On-Premise Deployment
    • France Enterprise Artificial Intelligence by Industry Vertical
    • Retail
    • Healthcare
    • Automotive
    • Aerospace
    • Media and Entertainment
    • Banking and Financial Services
    • IT and Telecommunication
      • UK Outlook (USD Billion, 2019-2030)

      • UK Enterprise Artificial Intelligence by Solution
        • Business Intelligence
        • Customer Management
        • Sales & Marketing
      • UK Enterprise Artificial Intelligence by Service
        • Professional
        • Managed
      • UK Enterprise Artificial Intelligence by Deployment
    • Cloud Deployment
    • On-Premise Deployment
    • UK Enterprise Artificial Intelligence by Industry Vertical
    • Retail
    • Healthcare
    • Automotive
    • Aerospace
    • Media and Entertainment
    • Banking and Financial Services
    • IT and Telecommunication
      • ITALY Outlook (USD Billion, 2019-2030)

      • ITALY Enterprise Artificial Intelligence by Solution
        • Business Intelligence
        • Customer Management
        • Sales & Marketing
      • ITALY Enterprise Artificial Intelligence by Service
        • Professional
        • Managed
      • ITALY Enterprise Artificial Intelligence by Deployment

    • Cloud Deployment
    • On-Premise Deployment
    • ITALY Enterprise Artificial Intelligence by Industry Vertical

    • Retail
    • Healthcare
    • Automotive
    • Aerospace
    • Media and Entertainment
    • Banking and Financial Services
    • IT and Telecommunication
      • SPAIN Outlook (USD Billion, 2019-2030)

      • Spain Enterprise Artificial Intelligence by Solution
        • Business Intelligence
        • Customer Management
        • Sales & Marketing
      • Spain Enterprise Artificial Intelligence by Service
        • Professional
        • Managed
      • Spain Enterprise Artificial Intelligence by Deployment
    • Cloud Deployment
    • On-Premise Deployment
    • Spain Enterprise Artificial Intelligence by Industry Vertical
    • Retail
    • Healthcare
    • Automotive
    • Aerospace
    • Media and Entertainment
    • Banking and Financial Services
    • IT and Telecommunication
      • Rest Of EuropeOutlook (USD Billion, 2019-2030)

      • Rest Of Europe Enterprise Artificial Intelligence by Solution
        • Business Intelligence
        • Customer Management
        • Sales & Marketing
      • REST OF EUROPEEnterprise Artificial Intelligence by Service
        • Professional
        • Managed
      • Rest Of Europe Enterprise Artificial Intelligence by Deployment

    • Cloud Deployment
    • On-Premise Deployment
    • Rest Of Europe Enterprise Artificial Intelligence by Industry Vertical

    • Retail
    • Healthcare
    • Automotive
    • Aerospace
    • Media and Entertainment
    • Banking and Financial Services
    • IT and Telecommunication
    • Asia-PacificOutlook (USD Billion, 2019-2030)

      • Asia-Pacific Enterprise Artificial Intelligence by Solution
        • Business Intelligence
        • Customer Management
        • Sales & Marketing
      • Asia-PacificEnterprise Artificial Intelligence by Service
        • Professional
        • Managed
      • Asia-PacificEnterprise Artificial Intelligence by Deployment
    • Cloud Deployment
    • On-Premise Deployment
    • Asia-PacificEnterprise Artificial Intelligence by Industry Vertical
    • Retail
    • Healthcare
    • Automotive
    • Aerospace
    • Media and Entertainment
    • Banking and Financial Services
    • IT and Telecommunication
      • China Outlook (USD Billion, 2019-2030)

      • China Enterprise Artificial Intelligence by Solution
        • Business Intelligence
        • Customer Management
        • Sales & Marketing
      • China Enterprise Artificial Intelligence by Service
        • Professional
        • Managed
      • China Enterprise Artificial Intelligence by Deployment
    • Cloud Deployment
    • On-Premise Deployment
    • China Enterprise Artificial Intelligence by Industry Vertical
    • Retail
    • Healthcare
    • Automotive
    • Aerospace
    • Media and Entertainment
    • Banking and Financial Services
    • IT and Telecommunication
      • Japan Outlook (USD Billion, 2019-2030)

      • Japan Enterprise Artificial Intelligence by Solution
        • Business Intelligence
        • Customer Management
        • Sales & Marketing
      • Japan Enterprise Artificial Intelligence by Service
        • Professional
        • Managed
      • Japan Enterprise Artificial Intelligence by Deployment
    • Cloud Deployment
    • On-Premise Deployment
    • Japan Enterprise Artificial Intelligence by Industry Vertical
    • Retail
    • Healthcare
    • Automotive
    • Aerospace
    • Media and Entertainment
    • Banking and Financial Services
    • IT and Telecommunication
      • India Outlook (USD Billion, 2019-2030)

      • India Enterprise Artificial Intelligence by Solution
        • Business Intelligence
        • Customer Management
        • Sales & Marketing
      • India Enterprise Artificial Intelligence by Service
        • Professional
        • Managed
      • India Enterprise Artificial Intelligence by Deployment
    • Cloud Deployment
    • On-Premise Deployment
    • India Enterprise Artificial Intelligence by Industry Vertical
    • Retail
    • Healthcare
    • Automotive
    • Aerospace
    • Media and Entertainment
    • Banking and Financial Services
    • IT and Telecommunication
      • Australia Outlook (USD Billion, 2019-2030)

      • Australia Enterprise Artificial Intelligence by Solution
        • Business Intelligence
        • Customer Management
        • Sales & Marketing
      • Australia Enterprise Artificial Intelligence by Service
        • Professional
        • Managed
      • North America Enterprise Artificial Intelligence by Deployment
    • Cloud Deployment
    • On-Premise Deployment
    • Australia Enterprise Artificial Intelligence by Industry Vertical
    • Retail
    • Healthcare
    • Automotive
    • Aerospace
    • Media and Entertainment
    • Banking and Financial Services
    • IT and Telecommunication
      • Rest of Asia-PacificOutlook (USD Billion, 2019-2030)

      • Rest of Asia-Pacific Enterprise Artificial Intelligence by Solution
        • Business Intelligence
        • Customer Management
        • Sales & Marketing
      • Rest of Asia-PacificEnterprise Artificial Intelligence by Service
        • Professional
        • Managed
      • Rest of Asia-PacificEnterprise Artificial Intelligence by Deployment
    • Cloud Deployment
    • On-Premise Deployment
    • Rest of Asia-PacificEnterprise Artificial Intelligence by Industry Vertical
    • Retail
    • Healthcare
    • Automotive
    • Aerospace
    • Media and Entertainment
    • Banking and Financial Services
    • IT and Telecommunication
    • Rest of the World Outlook (USD Billion, 2019-2030)

      • Rest of the World Enterprise Artificial Intelligence by Solution
        • Business Intelligence
        • Customer Management
        • Sales & Marketing
      • Rest of the World Enterprise Artificial Intelligence by Service
        • Professional
        • Managed
      • Rest of the World Enterprise Artificial Intelligence by Deployment
    • Cloud Deployment
    • On-Premise Deployment
    • Rest of the World Enterprise Artificial Intelligence by Industry Vertical
    • Retail
    • Healthcare
    • Automotive
    • Aerospace
    • Media and Entertainment
    • Banking and Financial Services
    • IT and Telecommunication
      • Middle East Outlook (USD Billion, 2019-2030)

      • Middle East Enterprise Artificial Intelligence by Solution
        • Business Intelligence
        • Customer Management
        • Sales & Marketing
      • Middle East Enterprise Artificial Intelligence by Service
        • Professional
        • Managed
      • Middle East Enterprise Artificial Intelligence by Deployment
    • Cloud Deployment
    • On-Premise Deployment
    • Middle East Enterprise Artificial Intelligence by Industry Vertical
    • Retail
    • Healthcare
    • Automotive
    • Aerospace
    • Media and Entertainment
    • Banking and Financial Services
    • IT and Telecommunication
      • Africa Outlook (USD Billion, 2019-2030)

      • Africa Enterprise Artificial Intelligence by Solution
        • Business Intelligence
        • Customer Management
        • Sales & Marketing
      • Africa Enterprise Artificial Intelligence by Service
        • Professional
        • Managed
      • Africa Enterprise Artificial Intelligence by Deployment
    • Cloud Deployment
    • On-Premise Deployment
    • Africa Enterprise Artificial Intelligence by Industry Vertical
    • Retail
    • Healthcare
    • Automotive
    • Aerospace
    • Media and Entertainment
    • Banking and Financial Services
    • IT and Telecommunication
      • Latin AmericaOutlook (USD Billion, 2019-2030)

      • Latin America Enterprise Artificial Intelligence by Solution
        • Business Intelligence
        • Customer Management
        • Sales & Marketing
      • Latin America Enterprise Artificial Intelligence by Service
        • Professional
        • Managed
      • Latin America Enterprise Artificial Intelligence by Deployment
    • Cloud Deployment
    • On-Premise Deployment
    • Latin America Enterprise Artificial Intelligence by Industry Vertical
    • Retail
    • Healthcare
    • Automotive
    • Aerospace
    • Media and Entertainment
    • Banking and Financial Services
    • IT and Telecommunication

    Real Estate Software Market Research Report - Global Forecast till 2030 Infographic
    Free Sample Request

    Kindly complete the form below to receive a free sample of this Report

    Customer Strories

    “I am very pleased with how market segments have been defined in a relevant way for my purposes (such as "Portable Freezers & refrigerators" and "last-mile"). In general the report is well structured. Thanks very much for your efforts.”

    Victoria Milne Founder
    Case Study

    Chemicals and Materials