• Cat-intel
  • MedIntelliX
  • Resources
  • About Us
  • Request Free Sample ×

    Kindly complete the form below to receive a free sample of this Report

    Leading companies partner with us for data-driven Insights

    clients tt-cursor

    Pressurized Water Reactors Market

    ID: MRFR/E&P/21411-HCR
    128 Pages
    Garvit Vyas
    September 2025

    Pressurized Water Reactors Market Research Report - By Reactor Technology (Advanced Pressurized Water Reactor (APWR), Compact Nuclear Reactor (CNPR)), By Capacity (Below 1000 MWe, 1000-2000 MWe, Above 2000 MWe), By Fuel Type (Uranium, Mixed Oxide (MOX) Fuel, Thorium) and By Regional (North America, Europe, South America, Asia Pacific, Middle East and Africa) - Forecast to 2032

    Share:
    Download PDF ×

    We do not share your information with anyone. However, we may send you emails based on your report interest from time to time. You may contact us at any time to opt-out.

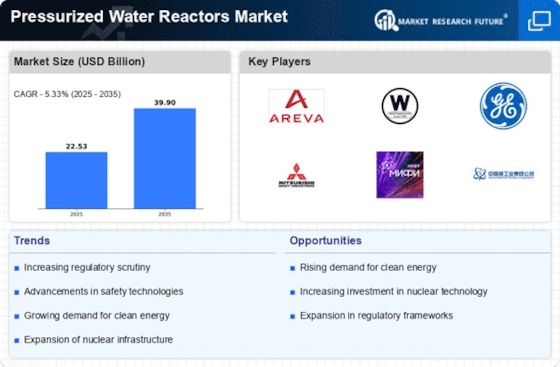
    Pressurized Water Reactors Market Research Report - Global Forecast 2032 Infographic
    Purchase Options
    $ 4,950.0
    $ 5,950.0
    $ 7,250.0
    Table of Contents

    Pressurized Water Reactors Market Summary

    The Global Pressurized Water Reactors Market is projected to grow from 21.3 USD Billion in 2024 to 37.9 USD Billion by 2035.

    Key Market Trends & Highlights

    Pressurized Water Reactors Key Trends and Highlights

    • The market is expected to experience a compound annual growth rate (CAGR) of 5.35 percent from 2025 to 2035.
    • By 2035, the market valuation is anticipated to reach 37.9 USD Billion, indicating robust growth potential.
    • In 2024, the market is valued at 21.3 USD Billion, reflecting a strong foundation for future expansion.
    • Growing adoption of advanced reactor technologies due to increasing energy demands is a major market driver.

    Market Size & Forecast

    2024 Market Size 21.3 (USD Billion)
    2035 Market Size 37.9 (USD Billion)
    CAGR (2025-2035) 5.35%

    Major Players

    Korea Electric Power Corporation, Westinghouse Electric Company, Areva NP, Mitsubishi Heavy Industries, China National Nuclear Corporation, State Nuclear Power Technology Corporation, Samsung Heavy Industries, Hokuriku Electric Power, Doosan Heavy Industries, Toshiba Enerlynuclear, Framatome, Chubu Electric Power, General Electric, Shikoku Electric Power, Kyushu Electric Power

    Pressurized Water Reactors Market Trends

    Opportunities in the PWRs market lie in the development of advanced reactor designs with enhanced safety features and improved efficiency. Research and development efforts are focused on technologies such as small modular reactors (SMRs) and advanced fuel cycles, which offer the potential for cost reductions and increased flexibility. Moreover, the expansion of nuclear power into developing countries and emerging markets presents significant growth opportunities for PWR manufacturers and suppliers.

    Recent trends in the PWRs market include the increasing adoption of digital technologies to enhance plant operations and safety. Digitalization enables real-time monitoring, predictive maintenance, and remote diagnostics, leading to improved efficiency and reduced downtime. Furthermore, collaboration between industry players and research institutions is fostering innovation and the development of next-generation PWR technologies. These trends are shaping the future of the PWRs market and positioning it for continued growth in the years to come.

    The ongoing transition towards cleaner energy sources appears to bolster the demand for Pressurized Water Reactors, as they are recognized for their efficiency and lower emissions compared to fossil fuels.

    U.S. Department of Energy

    Pressurized Water Reactors Market Drivers

    Market Growth Projections

    The Global Pressurized Water Reactors Market Industry is poised for substantial growth, with projections indicating a market size of 21.3 USD Billion in 2024 and an anticipated increase to 37.9 USD Billion by 2035. This growth trajectory reflects a compound annual growth rate (CAGR) of 5.35% from 2025 to 2035. The increasing demand for reliable and sustainable energy sources, coupled with advancements in reactor technology and supportive regulatory frameworks, underpins this positive outlook. As nations prioritize energy security and environmental sustainability, the market for pressurized water reactors is likely to expand significantly in the coming years.

    Growing Demand for Clean Energy

    The increasing global emphasis on clean energy sources drives the Global Pressurized Water Reactors Market Industry. Governments worldwide are implementing policies to reduce carbon emissions, leading to a surge in nuclear energy adoption. In 2024, the market is projected to reach 21.3 USD Billion, reflecting a strong commitment to sustainable energy solutions. Countries such as France and the United States are investing heavily in PWR technology to meet energy demands while minimizing environmental impact. This trend is expected to continue, with the market potentially reaching 37.9 USD Billion by 2035, indicating a robust growth trajectory.

    Increasing Energy Security Concerns

    Energy security concerns are prompting nations to diversify their energy sources, thereby benefiting the Global Pressurized Water Reactors Market Industry. Countries are increasingly recognizing the importance of nuclear power in reducing dependence on fossil fuels and enhancing energy independence. This shift is particularly evident in regions with unstable energy supplies. As nations invest in PWR technology, the market is set to grow, with an expected valuation of 21.3 USD Billion in 2024. The strategic importance of nuclear energy in achieving energy security is likely to drive further investments, potentially leading to a market size of 37.9 USD Billion by 2035.

    Regulatory Support and Policy Frameworks

    Supportive regulatory frameworks and policies are crucial drivers of the Global Pressurized Water Reactors Market Industry. Governments are establishing clear guidelines that facilitate the construction and operation of nuclear power plants, thereby encouraging investment in PWR technology. For instance, the U.S. Nuclear Regulatory Commission has streamlined the licensing process, making it more efficient for new projects. This regulatory clarity is expected to bolster market growth, with projections indicating a market size of 37.9 USD Billion by 2035. Such supportive measures not only enhance investor confidence but also promote the long-term viability of nuclear energy as a key component of the global energy mix.

    Technological Advancements in Reactor Design

    Technological innovations in reactor design enhance the efficiency and safety of pressurized water reactors, significantly impacting the Global Pressurized Water Reactors Market Industry. Advanced designs, such as the evolution of passive safety systems, improve operational reliability and reduce the risk of accidents. These advancements not only attract investments but also foster public acceptance of nuclear energy. As a result, the market is anticipated to grow at a CAGR of 5.35% from 2025 to 2035. Countries like China and Russia are leading in the development of next-generation PWRs, which could further solidify their positions in the global energy landscape.

    Public Acceptance and Awareness of Nuclear Energy

    Public acceptance of nuclear energy is gradually improving, which positively influences the Global Pressurized Water Reactors Market Industry. Increased awareness of the safety measures and environmental benefits associated with nuclear power contributes to a more favorable public perception. Educational campaigns and transparent communication from industry stakeholders play a pivotal role in this shift. As acceptance grows, investments in PWR technology are likely to increase, supporting market expansion. The anticipated growth trajectory, with a CAGR of 5.35% from 2025 to 2035, suggests that as public confidence in nuclear energy strengthens, the market will continue to flourish.

    Market Segment Insights

    Pressurized Water Reactors Market Reactor Technology Insights

    The presence of the Pressurized Water Reactors Market exists in two sub-segments within the Reactor Technology segment Advanced Pressurized Water Reactor and Compact Nuclear Reactor. Advanced Pressurized Water Reactors utilize evolutionary advancements in design and technology to improve safety, efficiency, and operational flexibility. These reactors employ passive safety systems, which utilize natural forces, like gravity and convection, for the mitigation of accidents. The thermal efficiency of APWR is expected to be higher than with traditional PWR, increasing the trade-off of nuclear energy over others.

    APWR is expected to comprise a considerable share of the Pressurized Water Reactor Market, driven by the rising need for a reliable and low-carbon energy source, as well as lower operating costs due to a higher thermal efficiency. Compact Nuclear reactors are considerably smaller and more modular than traditional pressurized water reactors, making them more versatile in their applications. CNPR is a simplified design and, thus, cheaper to construct, as the time and complexity of construction are lower.

    It has varying applications, ranging from simple electricity generation, as it is indispensable in remote areas not connected to larger power grids, as well as providing desalination and district heating services. The CNPR is projected to experience significant growth due to its potential in multiple areas, underpinned by rising governments’ and utilities’ enthusiasm for new energy solutions. The increasing requirements for a new energy source for expanding production will drive the demand for APWR.

    Source: Primary Research, Secondary Research, Market Research Future Database and Analyst Review

    Pressurized Water Reactors Market Capacity Insights

    The Capacity segment of the industry is divided into Below 1000 MWe, 1000-2000 MWe, and Above 2000 MWe sub-segments. As these sub-segments are specified in relation to the Pressurized Water Reactors Market, the 1000-2000 MWe sub-segment has been the largest in 2023 in terms of market share. It accounted for over half of the market revenue implied by the Pressurized Water Reactors Market. The reason behind the large market share of the 1000-2000 MWe sub-segment is the high demand for medium reactors in all rapidly industrializing areas.

    These companies require a size and capacity balance to have a stable supply of energy and fix warming issues that have an adverse effect on energy consumption. The Below 1000 MWe sub-segment is expected to grow vigorously as SMRs would generate up to half of the energy and target areas with lower energy production. The Above 2000 MWe sub-segment would remain stable as these reactors are massive and aimed at large pipelines. These reactors are predominantly used by developed countries and are unlikely to be established in developing countries. The industry is expected to grow across the given sub-segments.

    Pressurized Water Reactors Market Fuel Type Insights

    The Pressurized Water Reactors Market is segmented into various fuel types, including Uranium, Mixed Oxide (MOX) Fuel, and Thorium. Uranium is the most commonly used fuel in pressurized water reactors, accounting for over 90% of the market share. It is a naturally occurring element that is mined from the earth and then processed into fuel rods. MOX fuel is a blend of uranium and plutonium oxides, and it is used in some pressurized water reactors to improve fuel efficiency.

    The growth of the market is attributed to the increasing demand for nuclear power generation and the rising cost of fossil fuels. The Pressurized Water Reactors Market for MOX fuel is expected to grow from $1.5 billion in 2023 to $2.1 billion by 2032 at a CAGR of 5.33%. The growth of the market is driven by the need to improve fuel efficiency and reduce waste generation. The growth of the market is attributed to the potential of thorium as a clean and sustainable alternative to uranium.

    Get more detailed insights about Pressurized Water Reactors Market Research Report - Global Forecast 2032

    Regional Insights

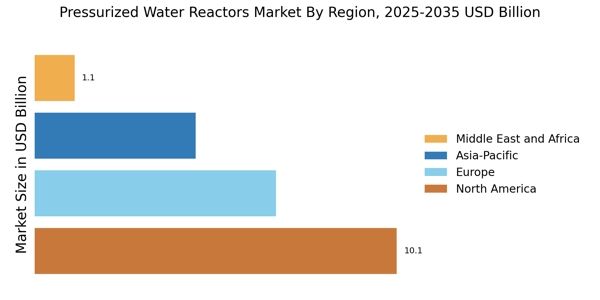
    The Pressurized Water Reactors Market is segmented into North America, Europe, APAC, South America, and MEA. Among these regions, APAC is expected to dominate the market in the coming years due to the increasing demand for electricity and the growing population in the region. China is the largest market for pressurized water reactors in APAC, followed by India and South Korea. The increasing demand for electricity in these countries is driving the growth of the pressurized water reactors market in the region.

    The growth of the market is attributed to the increasing demand for clean and reliable energy sources, as well as the growing need to reduce carbon emissions.

    Pressurized_Water_Reactors_Market_3

    Source: Primary Research, Secondary Research, Market Research Future Database and Analyst Review

    Key Players and Competitive Insights

    The pressurized Water Reactors Market industry’s major players are continuously investing in research and development to improve the efficiency and safety of their products. Leading Pressurized Water Reactors Market players are also concentrating on developing innovative technologies to reduce the cost of nuclear power generation. This is expected to drive the Pressurized Water Reactors Market to grow more in the future. Competitive Landscape is expecting to see more mergers and acquisitions as an outcome of this trend. 

    It is mostly comprised of a few major players who support a significant production ratio. These companies are currently well-poised and have strong financial power. They share an equal focus on investing in research and development to provide a homogeneous level of products and services across consumers.

    SWOT analysis of the company is a business planning method that requires using a four-way balance sheet. It is believed to be a critical decision-making tool for investors that helps identify a company’s internal and external factors by identifying strengths and weaknesses and assessing opportunities and threats to the company. Korea Electric Power Corporation is a major player in the Pressurized Water Reactors Market. 

    KEPCO is a Korean company that generates and distributes electricity in South Korea. KEPCO has been operating nuclear power plants since the 1970s and has a long track record of safety and reliability. KEPCO is presently building numerous more nuclear power plants in South Korea and planning to export its nuclear technology to other countries. Major players in the Pressurized Water Reactors Market include Westinghouse Electric Company, Areva NP, Mitsubishi Heavy Industries, and China National Nuclear Corporation.

    Key Companies in the Pressurized Water Reactors Market market include

    Industry Developments

    The Pressurized Water Reactors (PWR) market is projected to grow from USD 20.31 billion in 2023 to USD 32.4 billion by 2032, at a CAGR of 5.33%. The market growth is primarily driven by the increasing demand for nuclear power to meet the rising energy demands, coupled with the growing concerns over climate change and the need to reduce carbon emissions.

    Additionally, government initiatives promoting nuclear power generation and technological advancements in PWR designs are further contributing to market expansion. Recent developments include the development of small modular reactors (SMRs), which offer several advantages, such as reduced construction time and costs, enhanced safety features, and flexibility in deployment. The market is witnessing strategic partnerships and collaborations among key players to develop and deploy advanced PWR technologies.

    Future Outlook

    Pressurized Water Reactors Market Future Outlook

    The Pressurized Water Reactors Market is projected to grow at a 5.35% CAGR from 2024 to 2035, driven by increasing energy demands, technological advancements, and regulatory support for nuclear energy.

    New opportunities lie in:

    • Invest in advanced reactor designs to enhance safety and efficiency.
    • Develop partnerships with governments for nuclear infrastructure projects.
    • Leverage digital technologies for predictive maintenance and operational optimization.

    By 2035, the Pressurized Water Reactors Market is expected to achieve substantial growth, reflecting robust demand and innovation.

    Market Segmentation

    Pressurized Water Reactors Market Capacity Outlook

    • Uranium
    • Mixed Oxide (MOX) Fuel
    • Thorium

    Pressurized Water Reactors Market Regional Outlook

    • North America
    • Europe
    • South America
    • Asia Pacific
    • Middle East and Africa

    Pressurized Water Reactors Market Fuel Type Outlook

    • North America
    • Europe
    • South America
    • Asia Pacific
    • Middle East and Africa

     Pressurized Water Reactors Market Capacity Outlook

    • Uranium
    • Mixed Oxide (MOX) Fuel
    • Thorium

     Pressurized Water Reactors Market Regional Outlook

    • North America
    • Europe
    • South America
    • Asia Pacific
    • Middle East and Africa

     Pressurized Water Reactors Market Fuel Type Outlook

    • North America
    • Europe
    • South America
    • Asia Pacific
    • Middle East and Africa

    Pressurized Water Reactors Market Reactor Technology Outlook

    • Below 1000 MWe
    • 1000-2000 MWe
    • Above 2000 MWe

     Pressurized Water Reactors Market Reactor Technology Outlook

    • Below 1000 MWe
    • 1000-2000 MWe
    • Above 2000 MWe

    Report Scope

    Report Attribute/Metric Details
    Market Size 2022 19.28 (USD Billion)
    Market Size 2023 20.31 (USD Billion)
    Market Size 2032 32.4 (USD Billion)
    Compound Annual Growth Rate (CAGR) 5.33% (2024 - 2032)
    Report Coverage Revenue Forecast, Competitive Landscape, Growth Factors, and Trends
    Base Year 2023
    Market Forecast Period 2024 - 2032
    Historical Data 2019 - 2023
    Market Forecast Units USD Billion
    Key Companies Profiled State Nuclear Power Technology Corporation (SNPTC), Samsung Heavy Industries, Hokuriku Electric Power, Doosan Heavy Industries, Toshiba Enerlynuclear, Mitsubishi Heavy Industries, Framatome, China National Nuclear Corporation (CNNC), Chubu Electric Power, General Electric (GE), Shikoku Electric Power, Kyushu Electric Power, Westinghouse Electric Company
    Segments Covered Reactor Technology, Capacity, Fuel Type, Regional
    Key Market Opportunities Growing demand for nuclear powerGovernment support for nuclear energyTechnological advancementsExpansion in developing countriesIncreasing focus on carbon emissions reduction
    Key Market Dynamics Growing demand for low-carbon energyGovernment incentives for renewable energyAdvances in nuclear technologyIncreased safety concerns about nuclear powerFluctuating uranium prices
    Countries Covered North America, Europe, APAC, South America, MEA

    Market Highlights

    Author
    Garvit Vyas
    Analyst

    Explore the profile of Garvit Vyas, one of our esteemed authors at Market Research Future, and access their expert research contributions in the field of market research and industry analysis

    Leave a Comment

    FAQs

    What is the current and projected market size of the Pressurized Water Reactors Market?

    The Pressurized Water Reactors Market is valued at approximately USD 20.31 billion in 2023 and is projected to reach USD 32.4 billion by 2032, exhibiting a CAGR of 5.33% during the forecast period.

    Which region is expected to dominate the Pressurized Water Reactors Market?

    Asia-Pacific is anticipated to dominate the Pressurized Water Reactors Market throughout the forecast period due to increasing energy demand, supportive government policies, and the presence of major nuclear power plants in countries such as China, India, and South Korea.

    What are the key applications of Pressurized Water Reactors?

    Pressurized Water Reactors are primarily used for electricity generation. They utilize nuclear fuel to produce heat, which is then converted into steam to drive turbines that generate electricity.

    Who are the major competitors in the Pressurized Water Reactors Market?

    The major competitors in the Pressurized Water Reactors Market include Westinghouse Electric Company, Framatome, China National Nuclear Corporation, Korea Hydro & Nuclear Power, and Rosatom.

    What are the factors driving the growth of the Pressurized Water Reactors Market?

    The growth of the Pressurized Water Reactors Market is primarily driven by increasing electricity demand, government initiatives to reduce carbon emissions, and the need for reliable and affordable energy sources.

    What are the challenges faced by the Pressurized Water Reactors Market?

    The Pressurized Water Reactors Market faces challenges related to safety concerns, waste management, and the high capital costs associated with the construction and operation of nuclear power plants.

    What are the latest technological advancements in Pressurized Water Reactors?

    Recent technological advancements in Pressurized Water Reactors include the development of advanced fuel designs, passive safety systems, and digital instrumentation and control systems to improve efficiency, safety, and reliability.

    What is the regulatory landscape for Pressurized Water Reactors?

    The regulatory landscape for Pressurized Water Reactors varies across different countries and regions. Stringent regulations are in place to ensure the safe and responsible operation of nuclear power plants, including guidelines for design, construction, operation, and waste management.

    What is the future outlook for the Pressurized Water Reactors Market?

    The future outlook for the Pressurized Water Reactors Market is expected to be positive, driven by the increasing demand for reliable and low-carbon energy sources. Governments worldwide are expected to continue supporting the development and deployment of nuclear power plants as part of their clean energy strategies.

    What are the potential environmental impacts of Pressurized Water Reactors?

    The operation of Pressurized Water Reactors generates radioactive waste that requires careful management and disposal. Proper waste management practices are essential to minimize the environmental impact and ensure the safe and sustainable operation of nuclear power plants.

    1. 'TABLE
    2. OF CONTENTS
    3. EXECUTIVE SUMMARY
      1. Market Overview
    4. Key Findings
      1. Market Segmentation
      2. Competitive Landscape
    5. Challenges and Opportunities
      1. Future Outlook
    6. MARKET INTRODUCTION
      1. Definition
      2. Scope of the study
        1. Research
    7. Objective
      1. Assumption
        1. Limitations
    8. RESEARCH METHODOLOGY
    9. Overview
      1. Data Mining
      2. Secondary Research
      3. Primary Research
    10. Primary Interviews and Information Gathering Process
      1. Breakdown of Primary Respondents
      2. Forecasting Model
      3. Market Size Estimation
        1. Bottom-Up Approach
    11. Top-Down Approach
      1. Data Triangulation
      2. Validation
    12. MARKET DYNAMICS
      1. Overview
      2. Drivers
      3. Restraints
      4. Opportunities
    13. MARKET FACTOR ANALYSIS
      1. Value chain Analysis
    14. Porter''s Five Forces Analysis
      1. Bargaining Power of Suppliers
    15. Bargaining Power of Buyers
      1. Threat of New Entrants
        1. Threat
    16. of Substitutes
      1. Intensity of Rivalry
      2. COVID-19 Impact Analysis
        1. Market Impact Analysis
        2. Regional Impact
        3. Opportunity
    17. and Threat Analysis
    18. PRESSURIZED WATER REACTORS MARKET,
    19. BY REACTOR TECHNOLOGY (USD BILLION)
      1. Advanced Pressurized Water Reactor
    20. (APWR)
      1. Compact Nuclear Reactor (CNPR)
    21. PRESSURIZED WATER REACTORS
    22. MARKET, BY CAPACITY (USD BILLION)
      1. Below 1000 MWe
    23. MWe
      1. Above 2000 MWe
    24. PRESSURIZED WATER REACTORS MARKET, BY FUEL TYPE
    25. (USD BILLION)
      1. Uranium
      2. Mixed Oxide (MOX) Fuel
      3. Thorium
    26. PRESSURIZED
    27. WATER REACTORS MARKET, BY REGIONAL (USD BILLION)
      1. North America
    28. US
      1. Canada
      2. Europe
        1. Germany
        2. UK
        3. France
        4. Russia
        5. Italy
        6. Spain
        7. Rest of Europe
      3. APAC
        1. China
        2. India
        3. Japan
        4. South Korea
        5. Malaysia
        6. Thailand
        7. Indonesia
        8. Rest of APAC
      4. South America
        1. Brazil
        2. Mexico
        3. Argentina
        4. Rest of South America
      5. MEA
    29. GCC Countries
      1. South Africa
        1. Rest of MEA
    30. COMPETITIVE LANDSCAPE
      1. Overview
      2. Competitive Analysis
    31. Market share Analysis
      1. Major Growth Strategy in the Pressurized Water Reactors
    32. Market
      1. Competitive Benchmarking
      2. Leading Players in Terms of Number
    33. of Developments in the Pressurized Water Reactors Market
      1. Key developments and growth
    34. strategies
      1. New Product Launch/Service Deployment
        1. Merger
    35. & Acquisitions
      1. Joint Ventures
      2. Major Players Financial
    36. Matrix
      1. Sales and Operating Income
        1. Major Players R&D
    37. Expenditure. 2023
    38. COMPANY PROFILES
      1. State Nuclear Power Technology
    39. Corporation (SNPTC)
      1. Financial Overview
        1. Products Offered
    40. Key Developments
      1. SWOT Analysis
        1. Key Strategies
    41. Samsung Heavy Industries
      1. Financial Overview
        1. Products Offered
    42. Key Developments
      1. SWOT Analysis
        1. Key Strategies
    43. Hokuriku Electric Power
      1. Financial Overview
        1. Products Offered
    44. Key Developments
      1. SWOT Analysis
        1. Key Strategies
    45. Doosan Heavy Industries
      1. Financial Overview
        1. Products Offered
    46. Key Developments
      1. SWOT Analysis
        1. Key Strategies
    47. Toshiba Enerlynuclear
      1. Financial Overview
        1. Products Offered
    48. Key Developments
      1. SWOT Analysis
        1. Key Strategies
    49. Mitsubishi Heavy Industries
      1. Financial Overview
        1. Products Offered
    50. Key Developments
      1. SWOT Analysis
        1. Key Strategies
    51. Framatome
      1. Financial Overview
        1. Products Offered
        2. Key
    52. Developments
      1. SWOT Analysis
        1. Key Strategies
    53. China National Nuclear Corporation (CNNC)
      1. Financial Overview
    54. Products Offered
      1. Key Developments
        1. SWOT Analysis
    55. Key Strategies
      1. Chubu Electric Power
        1. Financial Overview
    56. Products Offered
      1. Key Developments
        1. SWOT Analysis
    57. Key Strategies
      1. General Electric (GE)
        1. Financial Overview
    58. Products Offered
      1. Key Developments
        1. SWOT Analysis
    59. Key Strategies
      1. Shikoku Electric Power
        1. Financial Overview
    60. Products Offered
      1. Key Developments
        1. SWOT Analysis
    61. Key Strategies
      1. Kyushu Electric Power
        1. Financial Overview
    62. Products Offered
      1. Key Developments
        1. SWOT Analysis
    63. Key Strategies
      1. Westinghouse Electric Company
        1. Financial Overview
    64. Products Offered
      1. Key Developments
        1. SWOT Analysis
    65. Key Strategies
    66. APPENDIX
      1. References
      2. Related Reports
    67. LIST
    68. OF TABLES
    69. WATER REACTORS MARKET SIZE ESTIMATES & FORECAST, BY REACTOR TECHNOLOGY, 2019-2032
    70. (USD BILLIONS)
    71. ESTIMATES & FORECAST, BY CAPACITY, 2019-2032 (USD BILLIONS)
    72. AMERICA PRESSURIZED WATER REACTORS MARKET SIZE ESTIMATES & FORECAST, BY FUEL
    73. TYPE, 2019-2032 (USD BILLIONS)
    74. MARKET SIZE ESTIMATES & FORECAST, BY REGIONAL, 2019-2032 (USD BILLIONS)
    75. US PRESSURIZED WATER REACTORS MARKET SIZE ESTIMATES & FORECAST, BY REACTOR
    76. TECHNOLOGY, 2019-2032 (USD BILLIONS)
    77. MARKET SIZE ESTIMATES & FORECAST, BY CAPACITY, 2019-2032 (USD BILLIONS)
    78. US PRESSURIZED WATER REACTORS MARKET SIZE ESTIMATES & FORECAST, BY FUEL TYPE,
    79. 2032 (USD BILLIONS)
    80. ESTIMATES & FORECAST, BY REGIONAL, 2019-2032 (USD BILLIONS)
    81. CANADA PRESSURIZED WATER REACTORS MARKET SIZE ESTIMATES & FORECAST, BY REACTOR
    82. TECHNOLOGY, 2019-2032 (USD BILLIONS)
    83. MARKET SIZE ESTIMATES & FORECAST, BY CAPACITY, 2019-2032 (USD BILLIONS)
    84. CANADA PRESSURIZED WATER REACTORS MARKET SIZE ESTIMATES & FORECAST, BY FUEL
    85. TYPE, 2019-2032 (USD BILLIONS)
    86. SIZE ESTIMATES & FORECAST, BY REGIONAL, 2019-2032 (USD BILLIONS)
    87. EUROPE PRESSURIZED WATER REACTORS MARKET SIZE ESTIMATES & FORECAST, BY REACTOR
    88. TECHNOLOGY, 2019-2032 (USD BILLIONS)
    89. MARKET SIZE ESTIMATES & FORECAST, BY CAPACITY, 2019-2032 (USD BILLIONS)
    90. EUROPE PRESSURIZED WATER REACTORS MARKET SIZE ESTIMATES & FORECAST, BY FUEL
    91. TYPE, 2019-2032 (USD BILLIONS)
    92. SIZE ESTIMATES & FORECAST, BY REGIONAL, 2019-2032 (USD BILLIONS)
    93. GERMANY PRESSURIZED WATER REACTORS MARKET SIZE ESTIMATES & FORECAST, BY
    94. REACTOR TECHNOLOGY, 2019-2032 (USD BILLIONS)
    95. WATER REACTORS MARKET SIZE ESTIMATES & FORECAST, BY CAPACITY, 2019-2032 (USD
    96. BILLIONS)
    97. FORECAST, BY FUEL TYPE, 2019-2032 (USD BILLIONS)
    98. WATER REACTORS MARKET SIZE ESTIMATES & FORECAST, BY REGIONAL, 2019-2032 (USD
    99. BILLIONS)
    100. BY REACTOR TECHNOLOGY, 2019-2032 (USD BILLIONS)
    101. REACTORS MARKET SIZE ESTIMATES & FORECAST, BY CAPACITY, 2019-2032 (USD BILLIONS)
    102. BY FUEL TYPE, 2019-2032 (USD BILLIONS)
    103. MARKET SIZE ESTIMATES & FORECAST, BY REGIONAL, 2019-2032 (USD BILLIONS)
    104. FRANCE PRESSURIZED WATER REACTORS MARKET SIZE ESTIMATES & FORECAST, BY REACTOR
    105. TECHNOLOGY, 2019-2032 (USD BILLIONS)
    106. MARKET SIZE ESTIMATES & FORECAST, BY CAPACITY, 2019-2032 (USD BILLIONS)
    107. FRANCE PRESSURIZED WATER REACTORS MARKET SIZE ESTIMATES & FORECAST, BY FUEL
    108. TYPE, 2019-2032 (USD BILLIONS)
    109. SIZE ESTIMATES & FORECAST, BY REGIONAL, 2019-2032 (USD BILLIONS)
    110. RUSSIA PRESSURIZED WATER REACTORS MARKET SIZE ESTIMATES & FORECAST, BY REACTOR
    111. TECHNOLOGY, 2019-2032 (USD BILLIONS)
    112. MARKET SIZE ESTIMATES & FORECAST, BY CAPACITY, 2019-2032 (USD BILLIONS)
    113. RUSSIA PRESSURIZED WATER REACTORS MARKET SIZE ESTIMATES & FORECAST, BY FUEL
    114. TYPE, 2019-2032 (USD BILLIONS)
    115. SIZE ESTIMATES & FORECAST, BY REGIONAL, 2019-2032 (USD BILLIONS)
    116. ITALY PRESSURIZED WATER REACTORS MARKET SIZE ESTIMATES & FORECAST, BY REACTOR
    117. TECHNOLOGY, 2019-2032 (USD BILLIONS)
    118. MARKET SIZE ESTIMATES & FORECAST, BY CAPACITY, 2019-2032 (USD BILLIONS)
    119. ITALY PRESSURIZED WATER REACTORS MARKET SIZE ESTIMATES & FORECAST, BY FUEL
    120. TYPE, 2019-2032 (USD BILLIONS)
    121. SIZE ESTIMATES & FORECAST, BY REGIONAL, 2019-2032 (USD BILLIONS)
    122. SPAIN PRESSURIZED WATER REACTORS MARKET SIZE ESTIMATES & FORECAST, BY REACTOR
    123. TECHNOLOGY, 2019-2032 (USD BILLIONS)
    124. MARKET SIZE ESTIMATES & FORECAST, BY CAPACITY, 2019-2032 (USD BILLIONS)
    125. SPAIN PRESSURIZED WATER REACTORS MARKET SIZE ESTIMATES & FORECAST, BY FUEL
    126. TYPE, 2019-2032 (USD BILLIONS)
    127. SIZE ESTIMATES & FORECAST, BY REGIONAL, 2019-2032 (USD BILLIONS)
    128. REST OF EUROPE PRESSURIZED WATER REACTORS MARKET SIZE ESTIMATES & FORECAST,
    129. BY REACTOR TECHNOLOGY, 2019-2032 (USD BILLIONS)
    130. WATER REACTORS MARKET SIZE ESTIMATES & FORECAST, BY CAPACITY, 2019-2032 (USD
    131. BILLIONS)
    132. & FORECAST, BY FUEL TYPE, 2019-2032 (USD BILLIONS)
    133. WATER REACTORS MARKET SIZE ESTIMATES & FORECAST, BY REGIONAL, 2019-2032 (USD
    134. BILLIONS)
    135. BY REACTOR TECHNOLOGY, 2019-2032 (USD BILLIONS)
    136. REACTORS MARKET SIZE ESTIMATES & FORECAST, BY CAPACITY, 2019-2032 (USD BILLIONS)
    137. BY FUEL TYPE, 2019-2032 (USD BILLIONS)
    138. MARKET SIZE ESTIMATES & FORECAST, BY REGIONAL, 2019-2032 (USD BILLIONS)
    139. CHINA PRESSURIZED WATER REACTORS MARKET SIZE ESTIMATES & FORECAST, BY REACTOR
    140. TECHNOLOGY, 2019-2032 (USD BILLIONS)
    141. MARKET SIZE ESTIMATES & FORECAST, BY CAPACITY, 2019-2032 (USD BILLIONS)
    142. CHINA PRESSURIZED WATER REACTORS MARKET SIZE ESTIMATES & FORECAST, BY FUEL
    143. TYPE, 2019-2032 (USD BILLIONS)
    144. SIZE ESTIMATES & FORECAST, BY REGIONAL, 2019-2032 (USD BILLIONS)
    145. INDIA PRESSURIZED WATER REACTORS MARKET SIZE ESTIMATES & FORECAST, BY REACTOR
    146. TECHNOLOGY, 2019-2032 (USD BILLIONS)
    147. MARKET SIZE ESTIMATES & FORECAST, BY CAPACITY, 2019-2032 (USD BILLIONS)
    148. INDIA PRESSURIZED WATER REACTORS MARKET SIZE ESTIMATES & FORECAST, BY FUEL
    149. TYPE, 2019-2032 (USD BILLIONS)
    150. SIZE ESTIMATES & FORECAST, BY REGIONAL, 2019-2032 (USD BILLIONS)
    151. JAPAN PRESSURIZED WATER REACTORS MARKET SIZE ESTIMATES & FORECAST, BY REACTOR
    152. TECHNOLOGY, 2019-2032 (USD BILLIONS)
    153. MARKET SIZE ESTIMATES & FORECAST, BY CAPACITY, 2019-2032 (USD BILLIONS)
    154. JAPAN PRESSURIZED WATER REACTORS MARKET SIZE ESTIMATES & FORECAST, BY FUEL
    155. TYPE, 2019-2032 (USD BILLIONS)
    156. SIZE ESTIMATES & FORECAST, BY REGIONAL, 2019-2032 (USD BILLIONS)
    157. SOUTH KOREA PRESSURIZED WATER REACTORS MARKET SIZE ESTIMATES & FORECAST,
    158. BY REACTOR TECHNOLOGY, 2019-2032 (USD BILLIONS)
    159. WATER REACTORS MARKET SIZE ESTIMATES & FORECAST, BY CAPACITY, 2019-2032 (USD
    160. BILLIONS)
    161. & FORECAST, BY FUEL TYPE, 2019-2032 (USD BILLIONS)
    162. WATER REACTORS MARKET SIZE ESTIMATES & FORECAST, BY REGIONAL, 2019-2032 (USD
    163. BILLIONS)
    164. FORECAST, BY REACTOR TECHNOLOGY, 2019-2032 (USD BILLIONS)
    165. WATER REACTORS MARKET SIZE ESTIMATES & FORECAST, BY CAPACITY, 2019-2032 (USD
    166. BILLIONS)
    167. FORECAST, BY FUEL TYPE, 2019-2032 (USD BILLIONS)
    168. WATER REACTORS MARKET SIZE ESTIMATES & FORECAST, BY REGIONAL, 2019-2032 (USD
    169. BILLIONS)
    170. FORECAST, BY REACTOR TECHNOLOGY, 2019-2032 (USD BILLIONS)
    171. WATER REACTORS MARKET SIZE ESTIMATES & FORECAST, BY CAPACITY, 2019-2032 (USD
    172. BILLIONS)
    173. FORECAST, BY FUEL TYPE, 2019-2032 (USD BILLIONS)
    174. WATER REACTORS MARKET SIZE ESTIMATES & FORECAST, BY REGIONAL, 2019-2032 (USD
    175. BILLIONS)
    176. FORECAST, BY REACTOR TECHNOLOGY, 2019-2032 (USD BILLIONS)
    177. WATER REACTORS MARKET SIZE ESTIMATES & FORECAST, BY CAPACITY, 2019-2032 (USD
    178. BILLIONS)
    179. FORECAST, BY FUEL TYPE, 2019-2032 (USD BILLIONS)
    180. WATER REACTORS MARKET SIZE ESTIMATES & FORECAST, BY REGIONAL, 2019-2032 (USD
    181. BILLIONS)
    182. & FORECAST, BY REACTOR TECHNOLOGY, 2019-2032 (USD BILLIONS)
    183. REST OF APAC PRESSURIZED WATER REACTORS MARKET SIZE ESTIMATES & FORECAST, BY
    184. CAPACITY, 2019-2032 (USD BILLIONS)
    185. REACTORS MARKET SIZE ESTIMATES & FORECAST, BY FUEL TYPE, 2019-2032 (USD BILLIONS)
    186. & FORECAST, BY REGIONAL, 2019-2032 (USD BILLIONS)
    187. WATER REACTORS MARKET SIZE ESTIMATES & FORECAST, BY REACTOR TECHNOLOGY, 2019-2032
    188. (USD BILLIONS)
    189. ESTIMATES & FORECAST, BY CAPACITY, 2019-2032 (USD BILLIONS)
    190. SOUTH AMERICA PRESSURIZED WATER REACTORS MARKET SIZE ESTIMATES & FORECAST, BY
    191. FUEL TYPE, 2019-2032 (USD BILLIONS)
    192. REACTORS MARKET SIZE ESTIMATES & FORECAST, BY REGIONAL, 2019-2032 (USD BILLIONS)
    193. FORECAST, BY REACTOR TECHNOLOGY, 2019-2032 (USD BILLIONS)
    194. REACTORS MARKET SIZE ESTIMATES & FORECAST, BY CAPACITY, 2019-2032 (USD BILLIONS)
    195. FORECAST, BY FUEL TYPE, 2019-2032 (USD BILLIONS)
    196. REACTORS MARKET SIZE ESTIMATES & FORECAST, BY REGIONAL, 2019-2032 (USD BILLIONS)
    197. FORECAST, BY REACTOR TECHNOLOGY, 2019-2032 (USD BILLIONS)
    198. REACTORS MARKET SIZE ESTIMATES & FORECAST, BY CAPACITY, 2019-2032 (USD BILLIONS)
    199. FORECAST, BY FUEL TYPE, 2019-2032 (USD BILLIONS)
    200. REACTORS MARKET SIZE ESTIMATES & FORECAST, BY REGIONAL, 2019-2032 (USD BILLIONS)
    201. FORECAST, BY REACTOR TECHNOLOGY, 2019-2032 (USD BILLIONS)
    202. WATER REACTORS MARKET SIZE ESTIMATES & FORECAST, BY CAPACITY, 2019-2032 (USD
    203. BILLIONS)
    204. FORECAST, BY FUEL TYPE, 2019-2032 (USD BILLIONS)
    205. WATER REACTORS MARKET SIZE ESTIMATES & FORECAST, BY REGIONAL, 2019-2032 (USD
    206. BILLIONS)
    207. ESTIMATES & FORECAST, BY REACTOR TECHNOLOGY, 2019-2032 (USD BILLIONS)
    208. REST OF SOUTH AMERICA PRESSURIZED WATER REACTORS MARKET SIZE ESTIMATES &
    209. FORECAST, BY CAPACITY, 2019-2032 (USD BILLIONS)
    210. PRESSURIZED WATER REACTORS MARKET SIZE ESTIMATES & FORECAST, BY FUEL TYPE, 2019-2032
    211. (USD BILLIONS)
    212. MARKET SIZE ESTIMATES & FORECAST, BY REGIONAL, 2019-2032 (USD BILLIONS)
    213. MEA PRESSURIZED WATER REACTORS MARKET SIZE ESTIMATES & FORECAST, BY REACTOR
    214. TECHNOLOGY, 2019-2032 (USD BILLIONS)
    215. MARKET SIZE ESTIMATES & FORECAST, BY CAPACITY, 2019-2032 (USD BILLIONS)
    216. MEA PRESSURIZED WATER REACTORS MARKET SIZE ESTIMATES & FORECAST, BY FUEL
    217. TYPE, 2019-2032 (USD BILLIONS)
    218. SIZE ESTIMATES & FORECAST, BY REGIONAL, 2019-2032 (USD BILLIONS)
    219. GCC COUNTRIES PRESSURIZED WATER REACTORS MARKET SIZE ESTIMATES & FORECAST,
    220. BY REACTOR TECHNOLOGY, 2019-2032 (USD BILLIONS)
    221. WATER REACTORS MARKET SIZE ESTIMATES & FORECAST, BY CAPACITY, 2019-2032 (USD
    222. BILLIONS)
    223. & FORECAST, BY FUEL TYPE, 2019-2032 (USD BILLIONS)
    224. WATER REACTORS MARKET SIZE ESTIMATES & FORECAST, BY REGIONAL, 2019-2032 (USD
    225. BILLIONS)
    226. & FORECAST, BY REACTOR TECHNOLOGY, 2019-2032 (USD BILLIONS)
    227. SOUTH AFRICA PRESSURIZED WATER REACTORS MARKET SIZE ESTIMATES & FORECAST, BY
    228. CAPACITY, 2019-2032 (USD BILLIONS)
    229. REACTORS MARKET SIZE ESTIMATES & FORECAST, BY FUEL TYPE, 2019-2032 (USD BILLIONS)
    230. & FORECAST, BY REGIONAL, 2019-2032 (USD BILLIONS)
    231. WATER REACTORS MARKET SIZE ESTIMATES & FORECAST, BY REACTOR TECHNOLOGY, 2019-2032
    232. (USD BILLIONS)
    233. ESTIMATES & FORECAST, BY CAPACITY, 2019-2032 (USD BILLIONS)
    234. REST OF MEA PRESSURIZED WATER REACTORS MARKET SIZE ESTIMATES & FORECAST, BY
    235. FUEL TYPE, 2019-2032 (USD BILLIONS)
    236. REACTORS MARKET SIZE ESTIMATES & FORECAST, BY REGIONAL, 2019-2032 (USD BILLIONS)
    237. ACQUISITION/PARTNERSHIP
    238. NORTH AMERICA PRESSURIZED WATER REACTORS MARKET ANALYSIS
    239. REACTORS MARKET ANALYSIS BY REACTOR TECHNOLOGY
    240. REACTORS MARKET ANALYSIS BY CAPACITY
    241. MARKET ANALYSIS BY FUEL TYPE
    242. BY REGIONAL
    243. BY REACTOR TECHNOLOGY
    244. BY CAPACITY
    245. BY FUEL TYPE
    246. BY REGIONAL
    247. TECHNOLOGY
    248. BY CAPACITY
    249. BY FUEL TYPE
    250. BY REGIONAL
    251. REACTOR TECHNOLOGY
    252. CAPACITY
    253. UK PRESSURIZED WATER REACTORS MARKET ANALYSIS BY REGIONAL
    254. FRANCE PRESSURIZED WATER REACTORS MARKET ANALYSIS BY REACTOR TECHNOLOGY
    255. FRANCE PRESSURIZED WATER REACTORS MARKET ANALYSIS BY CAPACITY
    256. FRANCE PRESSURIZED WATER REACTORS MARKET ANALYSIS BY FUEL TYPE
    257. FRANCE PRESSURIZED WATER REACTORS MARKET ANALYSIS BY REGIONAL
    258. RUSSIA PRESSURIZED WATER REACTORS MARKET ANALYSIS BY REACTOR TECHNOLOGY
    259. RUSSIA PRESSURIZED WATER REACTORS MARKET ANALYSIS BY CAPACITY
    260. RUSSIA PRESSURIZED WATER REACTORS MARKET ANALYSIS BY FUEL TYPE
    261. RUSSIA PRESSURIZED WATER REACTORS MARKET ANALYSIS BY REGIONAL
    262. ITALY PRESSURIZED WATER REACTORS MARKET ANALYSIS BY REACTOR TECHNOLOGY
    263. ITALY PRESSURIZED WATER REACTORS MARKET ANALYSIS BY CAPACITY
    264. ITALY PRESSURIZED WATER REACTORS MARKET ANALYSIS BY FUEL TYPE
    265. ITALY PRESSURIZED WATER REACTORS MARKET ANALYSIS BY REGIONAL
    266. SPAIN PRESSURIZED WATER REACTORS MARKET ANALYSIS BY REACTOR TECHNOLOGY
    267. SPAIN PRESSURIZED WATER REACTORS MARKET ANALYSIS BY CAPACITY
    268. SPAIN PRESSURIZED WATER REACTORS MARKET ANALYSIS BY FUEL TYPE
    269. SPAIN PRESSURIZED WATER REACTORS MARKET ANALYSIS BY REGIONAL
    270. REST OF EUROPE PRESSURIZED WATER REACTORS MARKET ANALYSIS BY REACTOR TECHNOLOGY
    271. CAPACITY
    272. FUEL TYPE
    273. REGIONAL
    274. CHINA PRESSURIZED WATER REACTORS MARKET ANALYSIS BY REACTOR TECHNOLOGY
    275. CHINA PRESSURIZED WATER REACTORS MARKET ANALYSIS BY CAPACITY
    276. CHINA PRESSURIZED WATER REACTORS MARKET ANALYSIS BY FUEL TYPE
    277. CHINA PRESSURIZED WATER REACTORS MARKET ANALYSIS BY REGIONAL
    278. INDIA PRESSURIZED WATER REACTORS MARKET ANALYSIS BY REACTOR TECHNOLOGY
    279. INDIA PRESSURIZED WATER REACTORS MARKET ANALYSIS BY CAPACITY
    280. INDIA PRESSURIZED WATER REACTORS MARKET ANALYSIS BY FUEL TYPE
    281. INDIA PRESSURIZED WATER REACTORS MARKET ANALYSIS BY REGIONAL
    282. JAPAN PRESSURIZED WATER REACTORS MARKET ANALYSIS BY REACTOR TECHNOLOGY
    283. JAPAN PRESSURIZED WATER REACTORS MARKET ANALYSIS BY CAPACITY
    284. JAPAN PRESSURIZED WATER REACTORS MARKET ANALYSIS BY FUEL TYPE
    285. JAPAN PRESSURIZED WATER REACTORS MARKET ANALYSIS BY REGIONAL
    286. SOUTH KOREA PRESSURIZED WATER REACTORS MARKET ANALYSIS BY REACTOR TECHNOLOGY
    287. SOUTH KOREA PRESSURIZED WATER REACTORS MARKET ANALYSIS BY CAPACITY
    288. SOUTH KOREA PRESSURIZED WATER REACTORS MARKET ANALYSIS BY FUEL TYPE
    289. SOUTH KOREA PRESSURIZED WATER REACTORS MARKET ANALYSIS BY REGIONAL
    290. MALAYSIA PRESSURIZED WATER REACTORS MARKET ANALYSIS BY REACTOR TECHNOLOGY
    291. MALAYSIA PRESSURIZED WATER REACTORS MARKET ANALYSIS BY CAPACITY
    292. MALAYSIA PRESSURIZED WATER REACTORS MARKET ANALYSIS BY FUEL TYPE
    293. MALAYSIA PRESSURIZED WATER REACTORS MARKET ANALYSIS BY REGIONAL
    294. THAILAND PRESSURIZED WATER REACTORS MARKET ANALYSIS BY REACTOR TECHNOLOGY
    295. THAILAND PRESSURIZED WATER REACTORS MARKET ANALYSIS BY CAPACITY
    296. THAILAND PRESSURIZED WATER REACTORS MARKET ANALYSIS BY FUEL TYPE
    297. THAILAND PRESSURIZED WATER REACTORS MARKET ANALYSIS BY REGIONAL
    298. INDONESIA PRESSURIZED WATER REACTORS MARKET ANALYSIS BY REACTOR TECHNOLOGY
    299. INDONESIA PRESSURIZED WATER REACTORS MARKET ANALYSIS BY CAPACITY
    300. INDONESIA PRESSURIZED WATER REACTORS MARKET ANALYSIS BY FUEL TYPE
    301. INDONESIA PRESSURIZED WATER REACTORS MARKET ANALYSIS BY REGIONAL
    302. REST OF APAC PRESSURIZED WATER REACTORS MARKET ANALYSIS BY REACTOR TECHNOLOGY
    303. TYPE
    304. BRAZIL PRESSURIZED WATER REACTORS MARKET ANALYSIS BY REACTOR TECHNOLOGY
    305. BRAZIL PRESSURIZED WATER REACTORS MARKET ANALYSIS BY CAPACITY
    306. BRAZIL PRESSURIZED WATER REACTORS MARKET ANALYSIS BY FUEL TYPE
    307. BRAZIL PRESSURIZED WATER REACTORS MARKET ANALYSIS BY REGIONAL
    308. MEXICO PRESSURIZED WATER REACTORS MARKET ANALYSIS BY REACTOR TECHNOLOGY
    309. MEXICO PRESSURIZED WATER REACTORS MARKET ANALYSIS BY CAPACITY
    310. MEXICO PRESSURIZED WATER REACTORS MARKET ANALYSIS BY FUEL TYPE
    311. MEXICO PRESSURIZED WATER REACTORS MARKET ANALYSIS BY REGIONAL
    312. ARGENTINA PRESSURIZED WATER REACTORS MARKET ANALYSIS BY REACTOR TECHNOLOGY
    313. ARGENTINA PRESSURIZED WATER REACTORS MARKET ANALYSIS BY CAPACITY
    314. ARGENTINA PRESSURIZED WATER REACTORS MARKET ANALYSIS BY FUEL TYPE
    315. ARGENTINA PRESSURIZED WATER REACTORS MARKET ANALYSIS BY REGIONAL
    316. REST OF SOUTH AMERICA PRESSURIZED WATER REACTORS MARKET ANALYSIS BY REACTOR
    317. TECHNOLOGY
    318. MARKET ANALYSIS BY CAPACITY
    319. REACTORS MARKET ANALYSIS BY FUEL TYPE
    320. WATER REACTORS MARKET ANALYSIS BY REGIONAL
    321. REACTORS MARKET ANALYSIS
    322. MARKET ANALYSIS BY REACTOR TECHNOLOGY
    323. WATER REACTORS MARKET ANALYSIS BY CAPACITY
    324. WATER REACTORS MARKET ANALYSIS BY FUEL TYPE
    325. WATER REACTORS MARKET ANALYSIS BY REGIONAL
    326. WATER REACTORS MARKET ANALYSIS BY REACTOR TECHNOLOGY
    327. WATER REACTORS MARKET ANALYSIS BY CAPACITY
    328. WATER REACTORS MARKET ANALYSIS BY FUEL TYPE
    329. WATER REACTORS MARKET ANALYSIS BY REGIONAL
    330. WATER REACTORS MARKET ANALYSIS BY REACTOR TECHNOLOGY
    331. WATER REACTORS MARKET ANALYSIS BY CAPACITY
    332. WATER REACTORS MARKET ANALYSIS BY FUEL TYPE
    333. WATER REACTORS MARKET ANALYSIS BY REGIONAL
    334. OF PRESSURIZED WATER REACTORS MARKET
    335. DRIVERS IMPACT ANALYSIS: PRESSURIZED WATER REACTORS MARKET
    336. RESTRAINTS IMPACT ANALYSIS: PRESSURIZED WATER REACTORS MARKET
    337. SUPPLY / VALUE CHAIN: PRESSURIZED WATER REACTORS MARKET
    338. REACTORS MARKET, BY REACTOR TECHNOLOGY, 2024 (% SHARE)
    339. REACTORS MARKET, BY REACTOR TECHNOLOGY, 2019 TO 2032 (USD Billions)
    340. PRESSURIZED WATER REACTORS MARKET, BY CAPACITY, 2024 (% SHARE)
    341. PRESSURIZED WATER REACTORS MARKET, BY CAPACITY, 2019 TO 2032 (USD Billions)
    342. PRESSURIZED WATER REACTORS MARKET, BY FUEL TYPE, 2024 (% SHARE)
    343. PRESSURIZED WATER REACTORS MARKET, BY FUEL TYPE, 2019 TO 2032 (USD Billions)
    344. (USD Billions)

    Pressurized Water Reactors Market Segmentation


    • Pressurized Water Reactors Market By Reactor Technology (USD Billion, 2019-2032)

      • Advanced Pressurized Water Reactor (APWR)
      • Compact Nuclear Reactor (CNPR)

    • Pressurized Water Reactors Market By Capacity (USD Billion, 2019-2032)

      • Below 1000 MWe
      • 1000-2000 MWe
      • Above 2000 MWe

    • Pressurized Water Reactors Market By Fuel Type (USD Billion, 2019-2032)

      • Uranium
      • Mixed Oxide (MOX) Fuel
      • Thorium

    • Pressurized Water Reactors Market By Regional (USD Billion, 2019-2032)

      • North America
      • Europe
      • South America
      • Asia Pacific
      • Middle East and Africa

    Pressurized Water Reactors Market Regional Outlook (USD Billion, 2019-2032)


    • North America Outlook (USD Billion, 2019-2032)

      • North America Pressurized Water Reactors Market by Reactor Technology Type

        • Advanced Pressurized Water Reactor (APWR)
        • Compact Nuclear Reactor (CNPR)
      • North America Pressurized Water Reactors Market by Capacity Type

        • Below 1000 MWe
        • 1000-2000 MWe
        • Above 2000 MWe
      • North America Pressurized Water Reactors Market by Fuel Type

        • Uranium
        • Mixed Oxide (MOX) Fuel
        • Thorium
      • North America Pressurized Water Reactors Market by Regional Type

        • US
        • Canada
      • US Outlook (USD Billion, 2019-2032)
      • US Pressurized Water Reactors Market by Reactor Technology Type

        • Advanced Pressurized Water Reactor (APWR)
        • Compact Nuclear Reactor (CNPR)
      • US Pressurized Water Reactors Market by Capacity Type

        • Below 1000 MWe
        • 1000-2000 MWe
        • Above 2000 MWe
      • US Pressurized Water Reactors Market by Fuel Type

        • Uranium
        • Mixed Oxide (MOX) Fuel
        • Thorium
      • CANADA Outlook (USD Billion, 2019-2032)
      • CANADA Pressurized Water Reactors Market by Reactor Technology Type

        • Advanced Pressurized Water Reactor (APWR)
        • Compact Nuclear Reactor (CNPR)
      • CANADA Pressurized Water Reactors Market by Capacity Type

        • Below 1000 MWe
        • 1000-2000 MWe
        • Above 2000 MWe
      • CANADA Pressurized Water Reactors Market by Fuel Type

        • Uranium
        • Mixed Oxide (MOX) Fuel
        • Thorium
    • Europe Outlook (USD Billion, 2019-2032)

      • Europe Pressurized Water Reactors Market by Reactor Technology Type

        • Advanced Pressurized Water Reactor (APWR)
        • Compact Nuclear Reactor (CNPR)
      • Europe Pressurized Water Reactors Market by Capacity Type

        • Below 1000 MWe
        • 1000-2000 MWe
        • Above 2000 MWe
      • Europe Pressurized Water Reactors Market by Fuel Type

        • Uranium
        • Mixed Oxide (MOX) Fuel
        • Thorium
      • Europe Pressurized Water Reactors Market by Regional Type

        • Germany
        • UK
        • France
        • Russia
        • Italy
        • Spain
        • Rest of Europe
      • GERMANY Outlook (USD Billion, 2019-2032)
      • GERMANY Pressurized Water Reactors Market by Reactor Technology Type

        • Advanced Pressurized Water Reactor (APWR)
        • Compact Nuclear Reactor (CNPR)
      • GERMANY Pressurized Water Reactors Market by Capacity Type

        • Below 1000 MWe
        • 1000-2000 MWe
        • Above 2000 MWe
      • GERMANY Pressurized Water Reactors Market by Fuel Type

        • Uranium
        • Mixed Oxide (MOX) Fuel
        • Thorium
      • UK Outlook (USD Billion, 2019-2032)
      • UK Pressurized Water Reactors Market by Reactor Technology Type

        • Advanced Pressurized Water Reactor (APWR)
        • Compact Nuclear Reactor (CNPR)
      • UK Pressurized Water Reactors Market by Capacity Type

        • Below 1000 MWe
        • 1000-2000 MWe
        • Above 2000 MWe
      • UK Pressurized Water Reactors Market by Fuel Type

        • Uranium
        • Mixed Oxide (MOX) Fuel
        • Thorium
      • FRANCE Outlook (USD Billion, 2019-2032)
      • FRANCE Pressurized Water Reactors Market by Reactor Technology Type

        • Advanced Pressurized Water Reactor (APWR)
        • Compact Nuclear Reactor (CNPR)
      • FRANCE Pressurized Water Reactors Market by Capacity Type

        • Below 1000 MWe
        • 1000-2000 MWe
        • Above 2000 MWe
      • FRANCE Pressurized Water Reactors Market by Fuel Type

        • Uranium
        • Mixed Oxide (MOX) Fuel
        • Thorium
      • RUSSIA Outlook (USD Billion, 2019-2032)
      • RUSSIA Pressurized Water Reactors Market by Reactor Technology Type

        • Advanced Pressurized Water Reactor (APWR)
        • Compact Nuclear Reactor (CNPR)
      • RUSSIA Pressurized Water Reactors Market by Capacity Type

        • Below 1000 MWe
        • 1000-2000 MWe
        • Above 2000 MWe
      • RUSSIA Pressurized Water Reactors Market by Fuel Type

        • Uranium
        • Mixed Oxide (MOX) Fuel
        • Thorium
      • ITALY Outlook (USD Billion, 2019-2032)
      • ITALY Pressurized Water Reactors Market by Reactor Technology Type

        • Advanced Pressurized Water Reactor (APWR)
        • Compact Nuclear Reactor (CNPR)
      • ITALY Pressurized Water Reactors Market by Capacity Type

        • Below 1000 MWe
        • 1000-2000 MWe
        • Above 2000 MWe
      • ITALY Pressurized Water Reactors Market by Fuel Type

        • Uranium
        • Mixed Oxide (MOX) Fuel
        • Thorium
      • SPAIN Outlook (USD Billion, 2019-2032)
      • SPAIN Pressurized Water Reactors Market by Reactor Technology Type

        • Advanced Pressurized Water Reactor (APWR)
        • Compact Nuclear Reactor (CNPR)
      • SPAIN Pressurized Water Reactors Market by Capacity Type

        • Below 1000 MWe
        • 1000-2000 MWe
        • Above 2000 MWe
      • SPAIN Pressurized Water Reactors Market by Fuel Type

        • Uranium
        • Mixed Oxide (MOX) Fuel
        • Thorium
      • REST OF EUROPE Outlook (USD Billion, 2019-2032)
      • REST OF EUROPE Pressurized Water Reactors Market by Reactor Technology Type

        • Advanced Pressurized Water Reactor (APWR)
        • Compact Nuclear Reactor (CNPR)
      • REST OF EUROPE Pressurized Water Reactors Market by Capacity Type

        • Below 1000 MWe
        • 1000-2000 MWe
        • Above 2000 MWe
      • REST OF EUROPE Pressurized Water Reactors Market by Fuel Type

        • Uranium
        • Mixed Oxide (MOX) Fuel
        • Thorium
    • APAC Outlook (USD Billion, 2019-2032)

      • APAC Pressurized Water Reactors Market by Reactor Technology Type

        • Advanced Pressurized Water Reactor (APWR)
        • Compact Nuclear Reactor (CNPR)
      • APAC Pressurized Water Reactors Market by Capacity Type

        • Below 1000 MWe
        • 1000-2000 MWe
        • Above 2000 MWe
      • APAC Pressurized Water Reactors Market by Fuel Type

        • Uranium
        • Mixed Oxide (MOX) Fuel
        • Thorium
      • APAC Pressurized Water Reactors Market by Regional Type

        • China
        • India
        • Japan
        • South Korea
        • Malaysia
        • Thailand
        • Indonesia
        • Rest of APAC
      • CHINA Outlook (USD Billion, 2019-2032)
      • CHINA Pressurized Water Reactors Market by Reactor Technology Type

        • Advanced Pressurized Water Reactor (APWR)
        • Compact Nuclear Reactor (CNPR)
      • CHINA Pressurized Water Reactors Market by Capacity Type

        • Below 1000 MWe
        • 1000-2000 MWe
        • Above 2000 MWe
      • CHINA Pressurized Water Reactors Market by Fuel Type

        • Uranium
        • Mixed Oxide (MOX) Fuel
        • Thorium
      • INDIA Outlook (USD Billion, 2019-2032)
      • INDIA Pressurized Water Reactors Market by Reactor Technology Type

        • Advanced Pressurized Water Reactor (APWR)
        • Compact Nuclear Reactor (CNPR)
      • INDIA Pressurized Water Reactors Market by Capacity Type

        • Below 1000 MWe
        • 1000-2000 MWe
        • Above 2000 MWe
      • INDIA Pressurized Water Reactors Market by Fuel Type

        • Uranium
        • Mixed Oxide (MOX) Fuel
        • Thorium
      • JAPAN Outlook (USD Billion, 2019-2032)
      • JAPAN Pressurized Water Reactors Market by Reactor Technology Type

        • Advanced Pressurized Water Reactor (APWR)
        • Compact Nuclear Reactor (CNPR)
      • JAPAN Pressurized Water Reactors Market by Capacity Type

        • Below 1000 MWe
        • 1000-2000 MWe
        • Above 2000 MWe
      • JAPAN Pressurized Water Reactors Market by Fuel Type

        • Uranium
        • Mixed Oxide (MOX) Fuel
        • Thorium
      • SOUTH KOREA Outlook (USD Billion, 2019-2032)
      • SOUTH KOREA Pressurized Water Reactors Market by Reactor Technology Type

        • Advanced Pressurized Water Reactor (APWR)
        • Compact Nuclear Reactor (CNPR)
      • SOUTH KOREA Pressurized Water Reactors Market by Capacity Type

        • Below 1000 MWe
        • 1000-2000 MWe
        • Above 2000 MWe
      • SOUTH KOREA Pressurized Water Reactors Market by Fuel Type

        • Uranium
        • Mixed Oxide (MOX) Fuel
        • Thorium
      • MALAYSIA Outlook (USD Billion, 2019-2032)
      • MALAYSIA Pressurized Water Reactors Market by Reactor Technology Type

        • Advanced Pressurized Water Reactor (APWR)
        • Compact Nuclear Reactor (CNPR)
      • MALAYSIA Pressurized Water Reactors Market by Capacity Type

        • Below 1000 MWe
        • 1000-2000 MWe
        • Above 2000 MWe
      • MALAYSIA Pressurized Water Reactors Market by Fuel Type

        • Uranium
        • Mixed Oxide (MOX) Fuel
        • Thorium
      • THAILAND Outlook (USD Billion, 2019-2032)
      • THAILAND Pressurized Water Reactors Market by Reactor Technology Type

        • Advanced Pressurized Water Reactor (APWR)
        • Compact Nuclear Reactor (CNPR)
      • THAILAND Pressurized Water Reactors Market by Capacity Type

        • Below 1000 MWe
        • 1000-2000 MWe
        • Above 2000 MWe
      • THAILAND Pressurized Water Reactors Market by Fuel Type

        • Uranium
        • Mixed Oxide (MOX) Fuel
        • Thorium
      • INDONESIA Outlook (USD Billion, 2019-2032)
      • INDONESIA Pressurized Water Reactors Market by Reactor Technology Type

        • Advanced Pressurized Water Reactor (APWR)
        • Compact Nuclear Reactor (CNPR)
      • INDONESIA Pressurized Water Reactors Market by Capacity Type

        • Below 1000 MWe
        • 1000-2000 MWe
        • Above 2000 MWe
      • INDONESIA Pressurized Water Reactors Market by Fuel Type

        • Uranium
        • Mixed Oxide (MOX) Fuel
        • Thorium
      • REST OF APAC Outlook (USD Billion, 2019-2032)
      • REST OF APAC Pressurized Water Reactors Market by Reactor Technology Type

        • Advanced Pressurized Water Reactor (APWR)
        • Compact Nuclear Reactor (CNPR)
      • REST OF APAC Pressurized Water Reactors Market by Capacity Type

        • Below 1000 MWe
        • 1000-2000 MWe
        • Above 2000 MWe
      • REST OF APAC Pressurized Water Reactors Market by Fuel Type

        • Uranium
        • Mixed Oxide (MOX) Fuel
        • Thorium
    • South America Outlook (USD Billion, 2019-2032)

      • South America Pressurized Water Reactors Market by Reactor Technology Type

        • Advanced Pressurized Water Reactor (APWR)
        • Compact Nuclear Reactor (CNPR)
      • South America Pressurized Water Reactors Market by Capacity Type

        • Below 1000 MWe
        • 1000-2000 MWe
        • Above 2000 MWe
      • South America Pressurized Water Reactors Market by Fuel Type

        • Uranium
        • Mixed Oxide (MOX) Fuel
        • Thorium
      • South America Pressurized Water Reactors Market by Regional Type

        • Brazil
        • Mexico
        • Argentina
        • Rest of South America
      • BRAZIL Outlook (USD Billion, 2019-2032)
      • BRAZIL Pressurized Water Reactors Market by Reactor Technology Type

        • Advanced Pressurized Water Reactor (APWR)
        • Compact Nuclear Reactor (CNPR)
      • BRAZIL Pressurized Water Reactors Market by Capacity Type

        • Below 1000 MWe
        • 1000-2000 MWe
        • Above 2000 MWe
      • BRAZIL Pressurized Water Reactors Market by Fuel Type

        • Uranium
        • Mixed Oxide (MOX) Fuel
        • Thorium
      • MEXICO Outlook (USD Billion, 2019-2032)
      • MEXICO Pressurized Water Reactors Market by Reactor Technology Type

        • Advanced Pressurized Water Reactor (APWR)
        • Compact Nuclear Reactor (CNPR)
      • MEXICO Pressurized Water Reactors Market by Capacity Type

        • Below 1000 MWe
        • 1000-2000 MWe
        • Above 2000 MWe
      • MEXICO Pressurized Water Reactors Market by Fuel Type

        • Uranium
        • Mixed Oxide (MOX) Fuel
        • Thorium
      • ARGENTINA Outlook (USD Billion, 2019-2032)
      • ARGENTINA Pressurized Water Reactors Market by Reactor Technology Type

        • Advanced Pressurized Water Reactor (APWR)
        • Compact Nuclear Reactor (CNPR)
      • ARGENTINA Pressurized Water Reactors Market by Capacity Type

        • Below 1000 MWe
        • 1000-2000 MWe
        • Above 2000 MWe
      • ARGENTINA Pressurized Water Reactors Market by Fuel Type

        • Uranium
        • Mixed Oxide (MOX) Fuel
        • Thorium
      • REST OF SOUTH AMERICA Outlook (USD Billion, 2019-2032)
      • REST OF SOUTH AMERICA Pressurized Water Reactors Market by Reactor Technology Type

        • Advanced Pressurized Water Reactor (APWR)
        • Compact Nuclear Reactor (CNPR)
      • REST OF SOUTH AMERICA Pressurized Water Reactors Market by Capacity Type

        • Below 1000 MWe
        • 1000-2000 MWe
        • Above 2000 MWe
      • REST OF SOUTH AMERICA Pressurized Water Reactors Market by Fuel Type

        • Uranium
        • Mixed Oxide (MOX) Fuel
        • Thorium
    • MEA Outlook (USD Billion, 2019-2032)

      • MEA Pressurized Water Reactors Market by Reactor Technology Type

        • Advanced Pressurized Water Reactor (APWR)
        • Compact Nuclear Reactor (CNPR)
      • MEA Pressurized Water Reactors Market by Capacity Type

        • Below 1000 MWe
        • 1000-2000 MWe
        • Above 2000 MWe
      • MEA Pressurized Water Reactors Market by Fuel Type

        • Uranium
        • Mixed Oxide (MOX) Fuel
        • Thorium
      • MEA Pressurized Water Reactors Market by Regional Type

        • GCC Countries
        • South Africa
        • Rest of MEA
      • GCC COUNTRIES Outlook (USD Billion, 2019-2032)
      • GCC COUNTRIES Pressurized Water Reactors Market by Reactor Technology Type

        • Advanced Pressurized Water Reactor (APWR)
        • Compact Nuclear Reactor (CNPR)
      • GCC COUNTRIES Pressurized Water Reactors Market by Capacity Type

        • Below 1000 MWe
        • 1000-2000 MWe
        • Above 2000 MWe
      • GCC COUNTRIES Pressurized Water Reactors Market by Fuel Type

        • Uranium
        • Mixed Oxide (MOX) Fuel
        • Thorium
      • SOUTH AFRICA Outlook (USD Billion, 2019-2032)
      • SOUTH AFRICA Pressurized Water Reactors Market by Reactor Technology Type

        • Advanced Pressurized Water Reactor (APWR)
        • Compact Nuclear Reactor (CNPR)
      • SOUTH AFRICA Pressurized Water Reactors Market by Capacity Type

        • Below 1000 MWe
        • 1000-2000 MWe
        • Above 2000 MWe
      • SOUTH AFRICA Pressurized Water Reactors Market by Fuel Type

        • Uranium
        • Mixed Oxide (MOX) Fuel
        • Thorium
      • REST OF MEA Outlook (USD Billion, 2019-2032)
      • REST OF MEA Pressurized Water Reactors Market by Reactor Technology Type

        • Advanced Pressurized Water Reactor (APWR)
        • Compact Nuclear Reactor (CNPR)
      • REST OF MEA Pressurized Water Reactors Market by Capacity Type

        • Below 1000 MWe
        • 1000-2000 MWe
        • Above 2000 MWe
      • REST OF MEA Pressurized Water Reactors Market by Fuel Type

        • Uranium
        • Mixed Oxide (MOX) Fuel
        • Thorium
    Report Infographic
    Free Sample Request

    Kindly complete the form below to receive a free sample of this Report

    Customer Strories

    “I am very pleased with how market segments have been defined in a relevant way for my purposes (such as "Portable Freezers & refrigerators" and "last-mile"). In general the report is well structured. Thanks very much for your efforts.”

    Victoria Milne Founder
    Case Study

    Chemicals and Materials