• Cat-intel
  • MedIntelliX
  • Resources
  • About Us
  • Hero Background
    English
    Chinese
    French
    Japanese
    Korean
    German
    Spanish

    Point of Care Diagnostics Testing Market Analysis

    ID: MRFR/HC/9161-HCR
    120 Pages
    Rahul Gotadki
    October 2025

    Point of Care Diagnostics Testing Market By Product (Glucose Monitoring, Cardiometabolic Monitoring, Infectious Disease Testing, Coagulation Monitoring, Pregnancy & Fertility Testing, Hematology Testing, Cancer/Tumor Marker Testing, Urinalysis Testing, Cholesterol, Drugs-of-Abuse Testing), By End User (Hospitals & Clinics, Diagnostic Centers, Homecare/Self Testing), By Mode of Purchase...

    Share:
    Download PDF ×

    We do not share your information with anyone. However, we may send you emails based on your report interest from time to time. You may contact us at any time to opt-out.

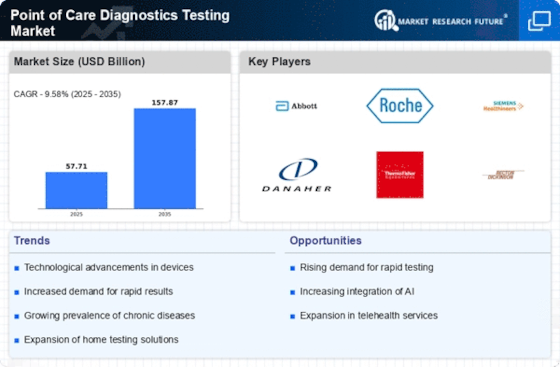
    Point of Care Diagnostics Testing Market Infographic
    $ 4,950.0
    $ 5,950.0
    $ 7,250.0

    Market Analysis

    In-depth Analysis of Point of Care Diagnostics Testing Market Industry Landscape

    There has been a significant evolution in the market dynamics for Point-Of-Care Diagnostics/ Testing (POCT), completely transforming medical diagnostics. The term "point-of-care" refers to tests performed near patients, producing quick results that inform immediate clinical decisions. The need for faster and more convenient diagnostic solutions is one of the major factors driving growth in the POCT market. Traditionally, laboratory-based testing was characterized by lengthy procedures and delays before results were presented. Decentralization of healthcare services has played a key role in shaping the growth of the POCT market. As healthcare delivery models shift towards more community-based and patient-centric approaches, the demand for point-of-care testing has increased. POCT allows healthcare professionals to carry out diagnostic tests in various settings, including physician offices, clinics, pharmacies, or even at home. Technological advancements have been a driving force behind innovative POCT solutions. The development of portable and user-friendly testing platforms has been achieved through the miniaturization of diagnostic devices and the integration of microfluidics as well as biomolecules. Application of biosensors coupled with miniaturization techniques and microfluidic systems has enabled the production of portable and easy-to-use diagnostics. Market competition between established companies and newcomers has become fiercer, with both aiming to claim their part of the growing POCT market. Well-established diagnostic firms are expanding their portfolios on POCT through acquisitions or collaborations, while new startups bring about unique technologies along with devices. The emergence of the COVID-19 pandemic has greatly influenced these dynamics, resulting in changes within this sector. The global spread of the virus necessitates fast, widespread test administration to identify and control its spread, thus leading to an increase in demand for point-of-care test solutions. Regulatory considerations highly influence the market dynamics of POCT. For the safety and efficiency of point-of-care diagnostic devices, regulators around the world have established standards and guidelines. Getting approvals from regulators is a critical move for manufacturers because it influences product development timelines and entry into the market. The regulatory framework has also been evolving in line with peculiar challenges and opportunities presented by point-of-care testing. Also, the market dynamics of POCT depend on cost-effectiveness. In view of this, affordable point-of-care solutions are increasingly being sought as value-based healthcare gains ground. This aspect is crucial, especially in areas characterized by scarcity of resources or where healthcare decisions are greatly affected by the costs involved.

    Market Summary

    The Global Point of Care Diagnostics Testing Market is projected to experience substantial growth from 57.7 USD Billion in 2024 to 157.9 USD Billion by 2032.

    Key Market Trends & Highlights

    Point of Care Diagnostics Testing Key Trends and Highlights

    • The market is expected to grow at a compound annual growth rate of 9.58 percent from 2024 to 2032. By 2032, the market valuation is anticipated to reach 157.9 USD Billion, indicating a robust expansion. In 2024, the market is valued at 57.7 USD Billion, reflecting a strong foundation for future growth. Growing adoption of point of care diagnostics due to increasing demand for rapid and accurate testing is a major market driver.

    Market Size & Forecast

    2024 Market Size 57.7 (USD Billion)
    2032 Market Size 157.9 (USD Billion)
    CAGR (2024-2032) 9.58%
    Largest Regional Market Share in 2024 latin_america)

    Major Players

    <p>Abbott Laboratories (US), Chembio Diagnostics, Inc. (US), Hoffmann-La Roche Ltd (Switzerland), Johnson &amp; Johnson Services, Inc. (US), Siemens Healthineers GmbH (Germany), Becton, Dickinson and Company (US), Danaher Corporation (US), PTS Diagnostics (US), Nova Biomedical (US), Quidel Corporation (US), Sekisui Diagnostics (US), Trinity Biotech (Ireland), Instrumentation Laboratory Company (Werfen) (US), EKF Diagnostics Holdings plc (UK)</p>

    Market Trends

    Drivers

    Increasing demand for COVID-19 POC test kits

    <p>The Global Point of Care Diagnostics Testing Market is poised for substantial growth, driven by advancements in technology and an increasing demand for rapid diagnostic solutions in various healthcare settings.</p>

    U.S. Food and Drug Administration (FDA)

    Point of Care Diagnostics Testing Market Market Drivers

    Market Trends and Projections

    Government Initiatives and Funding

    Government initiatives and funding significantly impact the Global Point of Care Diagnostics Testing Market Industry, as various health authorities recognize the importance of accessible diagnostic solutions. Investments in point-of-care technologies are being prioritized to improve healthcare delivery, particularly in underserved regions. Programs aimed at enhancing diagnostic infrastructure and training healthcare professionals are being implemented globally. These initiatives not only foster innovation but also encourage collaboration between public and private sectors, ultimately driving market growth. As governments continue to support point-of-care diagnostics, the industry is poised for expansion, aligning with global health objectives.

    Shift Towards Home Healthcare Services

    The Global Point of Care Diagnostics Testing Market Industry is witnessing a notable shift towards home healthcare services, driven by the increasing preference for at-home testing and monitoring. Patients are increasingly opting for convenient testing options that allow them to manage their health from the comfort of their homes. This trend is supported by advancements in telemedicine and mobile health technologies, which facilitate remote consultations and data sharing. As a result, the market is likely to expand, with projections indicating a compound annual growth rate of 9.58% from 2025 to 2035, reflecting the growing acceptance of home-based diagnostic solutions.

    Increasing Prevalence of Chronic Diseases

    The Global Point of Care Diagnostics Testing Market Industry is significantly influenced by the rising prevalence of chronic diseases such as diabetes, cardiovascular disorders, and infectious diseases. As these conditions require continuous monitoring and management, point-of-care testing offers a practical solution for patients and healthcare providers. The ability to conduct tests in various settings, including home care and remote locations, enhances patient compliance and engagement in their health management. This trend is expected to propel market growth, as the demand for accessible and efficient diagnostic solutions continues to rise in response to the global health landscape.

    Rising Demand for Rapid Testing Solutions

    The Global Point of Care Diagnostics Testing Market Industry experiences a surge in demand for rapid testing solutions, driven by the need for timely diagnosis and treatment. Healthcare providers increasingly prefer point-of-care testing due to its ability to deliver results within minutes, facilitating quicker clinical decisions. This trend is particularly evident in emergency departments and outpatient settings, where immediate test results can significantly impact patient outcomes. The market is projected to reach 57.7 USD Billion in 2024, reflecting a growing recognition of the value of rapid diagnostics in enhancing healthcare efficiency and patient care.

    Technological Advancements in Diagnostic Devices

    Technological innovations play a crucial role in the Global Point of Care Diagnostics Testing Market Industry, with advancements in microfluidics, biosensors, and mobile health applications enhancing diagnostic capabilities. These technologies enable the development of more accurate, user-friendly, and portable testing devices. For instance, the integration of artificial intelligence in diagnostic tools is streamlining data analysis and improving result accuracy. As these technologies evolve, they are expected to drive market growth, contributing to an anticipated increase in market value to 157.9 USD Billion by 2035, as healthcare systems worldwide adopt more sophisticated point-of-care solutions.

    Market Segment Insights

    Point of Care Diagnostics Testing Product Insights

    Point of Care Diagnostics Testing End User Insights

    Point of Care Diagnostics Testing Mode of Purchase Insights

    Point of Care Diagnostics Testing Platform Insights

    Get more detailed insights about Point of Care Diagnostics Testing Market Research Report - Global Forecast till 2032

    Regional Insights

    Key Companies in the Point of Care Diagnostics Testing Market market include

    Industry Developments

    • In June 2021,DCN Dx(US) acquired the pointofcare diagnostics development company PortaScience Inc. (US). This acquisition will expand the point of care product portfolio of the company.
    • In April 2021,the Indian Institute of Technology Kharagpur (India), an Indian engineering institute,launched a nucleic acid-based pointof care diagnostic devicefor COVID-19 diagnosis.
    • In April 2021,LumiraDx (US), a next-generation point of care diagnostics testing company,announced its merger with CA Healthcare Acquisition (CAHC) (US)in a deal worth USD 5 billion.
    • In March 2021, MatMaCorp (US) launched MYRTA, a handheld real-time POCPCR device for molecular diagnostics.
    • In March 2020, Abbott(US) launched the fastest available molecular pointofcare test to detect the coronavirus in less than 5 minutes.

    Future Outlook

    Point of Care Diagnostics Testing Market Future Outlook

    <p>The Global Point of Care Diagnostics Testing Market is projected to grow at a 9.58% CAGR from 2024 to 2032, driven by technological advancements, increasing demand for rapid testing, and rising healthcare expenditures.</p>

    New opportunities lie in:

    • <p>Develop portable diagnostic devices for remote healthcare settings. Invest in AI-driven analytics for enhanced diagnostic accuracy. Expand partnerships with telehealth platforms to integrate testing solutions.</p>

    <p>By 2035, the market is expected to achieve substantial growth, reflecting a robust demand for innovative diagnostic solutions.</p>

    Market Segmentation

    Point of Care Diagnostics Testing Product Outlook

    • {""=>["Strips"
    • "Meters"
    • "Lancets"]}
    • {""=>["Cardiac Marker Testing Products"
    • "Blood Gas/Electrolyte Testing Products"
    • "HbA1c Testing Products"]}
    • {""=>["HIV Testing  "
    • "Respiratory Infection Testing"
    • "Hepatitis Testing"
    • "Sexually Transmitted Disease Testing"
    • "Others"]}
    • {""=>["PT/INR Testing"
    • "ACT/APTT Testing"]}

    Point of Care Diagnostics Testing End User Outlook

    • Hospitals & Clinics
    • Diagnostic Centers
    • Homecare/Self Testing
    • Others

    Point of Care Diagnostics Testing Platform Outlook

    • Immunoassays
    • Molecular Diagnostics
    • Dipsticks
    • Others

    Point of Care Diagnostics Testing Mode of Purchase Outlook

    • OTC Testing Products
    • Prescription-based testing products

    Report Scope

    Report Attribute/MetricDetails
    Market Size 202352.70 (USD Billion)
    Market Size 202457.71 (USD Billion)
    Market Size 2032119.36 (USD Billion)
    Compound Annual Growth Rate (CAGR)9.77 % (2024 - 2032)
    Report CoverageRevenue Forecast, Competitive Landscape, Growth Factors, and Trends
    Base Year2023
    Market Forecast Period2024 - 2032
    Historical Data2018-2022
      Geographies Covered  North America, Europe, Asia-Pacific, and Rest of the World (RoW)
      Key Vendors  Abbott Laboratories (US),Siemens Healthineers GmbH (Germany),Chembio Diagnostics, Inc.(US),Hoffmann-La Roche Ltd (Switzerland),Johnson & Johnson Services, Inc. (US),Becton, Dickinson and Company (US),Danaher Corporation (US),PTS Diagnostics (US),Nova Biomedical (US),QuidelCorporation (US)
      Key Market Opportunities  Increasing healthcare issues increasing population diagnosed
      Key Market Drivers  Increasing demand for COVID-19 POC test kits Risingnumber of chronic disease cases across the globe

    Market Highlights

    Author

    Rahul Gotadki
    Assistant Manager

    She holds an experience of about 6+ years in market research and business consulting, working under the spectrum of information communication technology, telecommunications and semiconductor domains. aarti conceptualizes and implements a scalable business strategy and provides strategic leadership to the clients. her expertise lies in market estimation, competitive intelligence, pipeline analysis, customer assessment, etc.

    Leave a Comment

    Latest Comments

    John Doe
    john@example.com

    This is a great article! Really helped me understand the topic better.

    Posted on July 23, 2025, 10:15 AM
    Jane Smith
    jane@domain.com

    Thanks for sharing this. I’ve bookmarked it for later reference.

    Posted on July 22, 2025, 7:45 PM

    FAQs

    What is the CAGR for Point of Care Diagnostics Testing Market?

    The Point of Care Diagnostics/Testing Market can expand at 9.77% CAGR by 2032.

    Who are key players of the Point of Care Diagnostics Testing Market?

    Abbott Laboratories (US),Siemens Healthineers GmbH (Germany),Chembio Diagnostics, Inc.(US),Hoffmann-La Roche Ltd (Switzerland),Johnson &amp; Johnson Services, Inc. (US),Becton, Dickinson and Company (US),Danaher Corporation (US),PTS Diagnostics (US),Nova Biomedical (US),QuidelCorporation (US) Are the key players of market

    What is the valuation of the Point of Care Diagnostics Testing Market?

    By 2032, the Point of Care Diagnostics/Testing Market value can exceed USD 119.36 Billion.

    What is the Point of Care Diagnostics Testing Market driver?

    Increasing demand for COVID-19 POC test kits is driving the Point of Care Diagnostics/Testing Market.

    What is the Point of Care Diagnostics Testing Market restrain?

    Increases the potential of rapid medical diagnosis restrain the Point of Care Diagnostics/Testing Market.

    1. . REPORT PROLOGUE
    2. . MARKET INTRODUCTION
    3. . Definition
    4. . Scope of the Study
    5. . Research Objective
    6. . Assumptions
    7. . Limitations
    8. . RESEARCH METHODOLOGY
    9. . Overview
    10. . Data Mining
    11. . Secondary Research
    12. . Primary Research
    13. . Primary Interviews and Information Gathering Process
    14. . Breakdown of Primary Respondents
    15. . Forecasting Cellulite Type
    16. . Market Size Estimation
    17. . Bottom-Up Approach
    18. . Top-Down Approach
    19. . Data Triangulation
    20. . Validation
    21. . MARKET DYNAMICS
    22. . Overview
    23. . Drivers
    24. . Restraints
    25. . Opportunities
    26. . MARKET FACTOR ANALYSIS
    27. . Porter’s Five Forces Analysis
    28. . Bargaining Power of Suppliers
    29. . Bargaining Power of Buyers
    30. . Threat of New Entrants
    31. . Threat of Substitutes
    32. . Intensity of Rivalry
    33. . Value Chain Analysis
    34. . COVID-19 Impact Analysis
    35. . Market Impact Analysis
    36. . Impact on Supply Chain
    37. . Regional Impact
    38. . Opportunity and Threat Analysis
    39. . GLOBAL Point of Care Diagnostics Testing MARKET, BY PRODUCT
    40. . Overview
    41. . Glucose Monitoring Market Estimates & Forecast, by Region, 2022–2030 Market Estimates & Forecast, by Country, 2022–2030
    42. . Strips Market Estimates & Forecast, by Region, 2022–2030 Market Estimates & Forecast, by Country, 2022–2030
    43. . Meters Market Estimates & Forecast, by Region, 2022–2030 Market Estimates & Forecast, by Country, 2022–2030
    44. . Lancets Market Estimates & Forecast, by Region, 2022–2030 Market Estimates & Forecast, by Country, 2022–2030
    45. . Cardiometabolic Monitoring Market Estimates & Forecast, by Region, 2022–2030 Market Estimates & Forecast, by Country, 2022–2030
    46. . Cardiac Marker Testing Products Market Estimates & Forecast, by Region, 2022–2030 Market Estimates & Forecast, by Country, 2022–2030
    47. . Blood Gas/Electrolyte Testing Products Market Estimates & Forecast, by Region, 2022–2030 Market Estimates & Forecast, by Country, 2022–2030
    48. . HbA1c Testing Products Market Estimates & Forecast, by Region, 2022–2030 Market Estimates & Forecast, by Country, 2022–2030
    49. . Infectious Disease Testing Market Estimates & Forecast, by Region, 2022–2030 Market Estimates & Forecast, by Country, 2022–2030
    50. . HIV Testing Market Estimates & Forecast, by Region, 2022–2030 Market Estimates & Forecast, by Country, 2022–2030
    51. . Respiratory Infection Testing Market Estimates & Forecast, by Region, 2022–2030 Market Estimates & Forecast, by Country, 2022–2030
    52. . Hepatitis Testing Market Estimates & Forecast, by Region, 2022–2030 Market Estimates & Forecast, by Country, 2022–2030
    53. . Sexually Transmitted Disease Testing Market Estimates & Forecast, by Region, 2022–2030 Market Estimates & Forecast, by Country, 2022–2030
    54. . Others Market Estimates & Forecast, by Region, 2022–2030 Market Estimates & Forecast, by Country, 2022–2030
    55. . Coagulation Monitoring Market Estimates & Forecast, by Region, 2022–2030 Market Estimates & Forecast, by Country, 2022–2030
    56. . PT/INR Testing Market Estimates & Forecast, by Region, 2022–2030 Market Estimates & Forecast, by Country, 2022–2030
    57. . ACT/APTT Testing Market Estimates & Forecast, by Region, 2022–2030 Market Estimates & Forecast, by Country, 2022–2030
    58. . Pregnancy & Fertility Testing Market Estimates & Forecast, by Region, 2022–2030 Market Estimates & Forecast, by Country, 2022–2030
    59. . Hematology Testing Market Estimates & Forecast, by Region, 2022–2030 Market Estimates & Forecast, by Country, 2022–2030
    60. . Cancer/Tumor Marker Testing Market Estimates & Forecast, by Region, 2022–2030 Market Estimates & Forecast, by Country, 2022–2030
    61. . Urinalysis Testing Market Estimates & Forecast, by Region, 2022–2030 Market Estimates & Forecast, by Country, 2022–2030
    62. . Cholesterol Market Estimates & Forecast, by Region, 2022–2030 Market Estimates & Forecast, by Country, 2022–2030
    63. . Drugs-of-Abuse Testing Market Estimates & Forecast, by Region, 2022–2030 Market Estimates & Forecast, by Country, 2022–2030
    64. . Others Market Estimates & Forecast, by Region, 2022–2030 Market Estimates & Forecast, by Country, 2022–2030
    65. . GLOBAL Point of Care Diagnostics Testing MARKET, BY END USER
    66. . Overview
    67. . Hospitals & Clinics Market Estimates & Forecast, by Region, 2022–2030 Market Estimates & Forecast, by Country, 2022–2030
    68. . Diagnostic Centers Market Estimates & Forecast, by Region, 2022–2030 Market Estimates & Forecast, by Country, 2022–2030
    69. . Homecare/Self Testing Market Estimates & Forecast, by Region, 2022–2030 Market Estimates & Forecast, by Country, 2022–2030
    70. . Others Market Estimates & Forecast, by Region, 2022–2030 Market Estimates & Forecast, by Country, 2022–2030
    71. . GLOBAL Point of Care Diagnostics Testing MARKET, BY MODE OF PURCHASE
    72. . Overview
    73. . OTC Testing Products Market Estimates & Forecast, by Region, 2022–2030 Market Estimates & Forecast, by Country, 2022–2030
    74. . Prescription-based testing products Market Estimates & Forecast, by Region, 2022–2030 Market Estimates & Forecast, by Country, 2022–2030
    75. . GLOBAL Point of Care Diagnostics Testing MARKET, BY PLATFORM
    76. . Overview
    77. . Immunoassays Market Estimates & Forecast, by Region, 2022–2030 Market Estimates & Forecast, by Country, 2022–2030
    78. . Dipsticks Market Estimates & Forecast, by Region, 2022–2030 Market Estimates & Forecast, by Country, 2022–2030
    79. . Molecular Diagnostics Market Estimates & Forecast, by Region, 2022–2030 Market Estimates & Forecast, by Country, 2022–2030
    80. . Others Market Estimates & Forecast, by Region, 2022–2030 Market Estimates & Forecast, by Country, 2022–2030
    81. . GLOBAL Point of Care Diagnostics Testing MARKET, BY REGION
    82. . Overview
    83. . North America
    84. . US
    85. . Canada
    86. . Europe
    87. . Germany
    88. . France
    89. . UK
    90. . Italy
    91. . Spain
    92. . Rest of Europe
    93. . Asia-Pacific
    94. . China
    95. . India
    96. . Japan
    97. . South Korea
    98. . Australia
    99. . Rest of Asia-Pacific
    100. . Rest of the World
    101. . Middle East
    102. . Africa
    103. . Latin America
    104. . COMPANY LANDSCAPE
    105. . Overview
    106. . Competitive Analysis
    107. . Market Share Analysis
    108. . Major Growth Strategy in the Global Point of Care Diagnostics Testing Market
    109. . Competitive Benchmarking
    110. . Leading Players in Terms of Number of Developments in the Global Point of Care Diagnostics Testing Market
    111. . Key developments and Growth Strategies
    112. . New ProductLaunch/Service Deployment
    113. . Merger &Acquisitions
    114. . Joint Ventures
    115. . Major Players Financial Matrix
    116. . Sales & Operating Income, 2020
    117. . Major Players R&D Expenditure, 2020
    118. . COMPANY PROFILES
    119. . Abbott Laboratories
    120. . Company Overview
    121. . Product Offered
    122. . Financial Overview
    123. . Key Developments
    124. . SWOT Analysis
    125. . Key Strategies
    126. . Siemens Healthineers GmbH
    127. . Company Overview
    128. . Product Offered
    129. . Financial Overview
    130. . Key Developments
    131. . SWOT Analysis
    132. . Key Strategies
    133. . Chembio Diagnostics, Inc.
    134. . Company Overview
    135. . Product Offered
    136. . Financial Overview
    137. . Key Developments
    138. . SWOT Analysis
    139. . Key Strategies
    140. . F. Hoffmann-La Roche Ltd
    141. . Company Overview
    142. . Product Offered
    143. . Financial Overview
    144. . Key Developments
    145. . SWOT Analysis
    146. . Key Strategies
    147. . Johnson & Johnson Services, Inc.
    148. . Company Overview
    149. . Product Offered
    150. . Financial Overview
    151. . Key Developments
    152. . SWOT Analysis
    153. . Key Strategies
    154. . Becton, Dickinson and Company
    155. . Company Overview
    156. . Product Offered
    157. . Financial Overview
    158. . Key Developments
    159. . SWOT Analysis
    160. . Key Strategies
    161. . Danaher Corporation
    162. . Company Overview
    163. . Product Offered
    164. . Financial Overview
    165. . Key Developments
    166. . SWOT Analysis
    167. . Key Strategies
    168. . PTS Diagnostics
    169. . Company Overview
    170. . Product Offered
    171. . Financial Overview
    172. . Key Developments
    173. . SWOT Analysis
    174. . Key Strategies
    175. . Nova Biomedical
    176. . Company Overview
    177. . Product Offered
    178. . Financial Overview
    179. . Key Developments
    180. . SWOT Analysis
    181. . Key Strategies
    182. . Quidel Corporation
    183. . Company Overview
    184. . Product Offered
    185. . Financial Overview
    186. . Key Developments
    187. . SWOT Analysis
    188. . Key Strategies
    189. . Sekisui Diagnostics
    190. . Company Overview
    191. . Product Offered
    192. . Financial Overview
    193. . Key Developments
    194. . SWOT Analysis
    195. . Key Strategies
    196. . Trinity Biotech
    197. . Company Overview
    198. . Product Offered
    199. . Financial Overview
    200. . Key Developments
    201. . SWOT Analysis
    202. . Key Strategies
    203. . AccuBioTech Co., Ltd.
    204. . Company Overview
    205. . Product Offered
    206. . Financial Overview
    207. . Key Developments
    208. . SWOT Analysis
    209. . Key Strategies
    210. . Instrumentation Laboratory Company (Werfen)
    211. . Company Overview
    212. . Product Offered
    213. . Financial Overview
    214. . Key Developments
    215. . SWOT Analysis
    216. . Key Strategies
    217. . EKF Diagnostics Holdings plc
    218. . Company Overview
    219. . Product Offered
    220. . Financial Overview
    221. . Key Developments
    222. . SWOT Analysis
    223. . Key Strategies
    224. . APPENDIX
    225. . References
    226. . Related Reports LIST OF TABLES TABLE 1 GLOBAL Point of Care Diagnostics Testing MARKET SYNOPSIS, 2022–2030 TABLE 2 GLOBAL Point of Care Diagnostics Testing MARKET ESTIMATES &FORECAST, 2022–2030(USD MILLION) TABLE 3 GLOBAL Point of Care Diagnostics Testing MARKET, BYPRODUCT, 2022–2030 (USD MILLION) TABLE 4 GLOBAL Point of Care Diagnostics Testing MARKET, BY END USER,2022–2030 (USD MILLION) TABLE 5 GLOBAL Point of Care Diagnostics Testing MARKET, BY MODE OF PURCHASE, 2022–2030 (USD MILLION) TABLE 6 GLOBAL Point of Care Diagnostics Testing MARKET, BY PLATFORM, 2022–2030 (USD MILLION) TABLE 7 NORTH AMERICA OF CARE DIAGNOSTICS/TESTING MARKET, BY PRODUCT, 2022–2030 (USD MILLION) TABLE 8 NORTH AMERICAPoint of Care Diagnostics Testing MARKET, BY END USER,2022–2030 (USD MILLION) TABLE 9 NORTH AMERICAPoint of Care Diagnostics Testing MARKET, BY MODE OF PURCHASE, 2022–2030 (USD MILLION) TABLE 10 NORTH AMERICAPoint of Care Diagnostics Testing MARKET, BY PLATFORM, 2022–2030 (USD MILLION) TABLE 11 US: Point of Care Diagnostics Testing MARKET, BY PRODUCT, 2022–2030 (USD MILLION) TABLE 12 US Point of Care Diagnostics Testing MARKET, BY END USER, 2022–2030 (USD MILLION) TABLE 13 US: Point of Care Diagnostics Testing MARKET, BY MODE OF PURCHASE, 2022–2030 (USD MILLION) TABLE 14 US: Point of Care Diagnostics Testing MARKET, BY PLATFORM, 2022–2030 (USD MILLION) TABLE 15 CANADA: Point of Care Diagnostics Testing MARKET, BY PRODUCT, 2022–2030 (USD MILLION) TABLE 16 CANADA Point of Care Diagnostics Testing MARKET, BY END USER, 2022–2030 (USD MILLION) TABLE 17 CANADA: Point of Care Diagnostics Testing MARKET, BY MODE OF PURCHASE, 2022–2030 (USD MILLION) TABLE 18 CANADA: Point of Care Diagnostics Testing MARKET, BY PLATFORM, 2022–2030 (USD MILLION) TABLE 19 EUROPE: Point of Care Diagnostics Testing MARKET, BY PRODUCT, 2022–2030 (USD MILLION) TABLE 20 EUROPE: Point of Care Diagnostics Testing MARKET, BY END USER, 2022–2030 (USD MILLION) TABLE 21 EUROPE: Point of Care Diagnostics Testing MARKET, BY MODE OF PURCHASE, 2022–2030 (USD MILLION) TABLE 22 EUROPE: Point of Care Diagnostics Testing MARKET, BY PLATFORM, 2022–2030 (USD MILLION) TABLE 23 GERMANY: Point of Care Diagnostics Testing MARKET, BY PRODUCT, 2022–2030 (USD MILLION) TABLE 24 GERMANY: Point of Care Diagnostics Testing MARKET, BY END USER, 2022–2030 (USD MILLION) TABLE 25 GERMANY: Point of Care Diagnostics Testing MARKET, BY MODE OF PURCHASE, 2022–2030 (USD MILLION) TABLE 26 GERMANY: Point of Care Diagnostics Testing MARKET, BY PLATFORM, 2022–2030 (USD MILLION) TABLE 27 FRANCE: Point of Care Diagnostics Testing MARKET, BY PRODUCT, 2022–2030 (USD MILLION) TABLE 28 FRANCE: Point of Care Diagnostics Testing MARKET, BY END USER, 2022–2030 (USD MILLION) TABLE 29 FRANCE: Point of Care Diagnostics Testing MARKET, BY MODE OF PURCHASE, 2022–2030 (USD MILLION) TABLE 30 FRANCE: Point of Care Diagnostics Testing MARKET, BY PLATFORM, 2022–2030 (USD MILLION) TABLE 31 UK: Point of Care Diagnostics Testing MARKET, BY PRODUCT, 2022–2030 (USD MILLION) TABLE 32 UK: Point of Care Diagnostics Testing MARKET, BY END USER, 2022–2030 (USD MILLION) TABLE 33 UK: Point of Care Diagnostics Testing MARKET, BY MODE OF PURCHASE, 2022–2030 (USD MILLION) TABLE 34 UK: Point of Care Diagnostics Testing MARKET, BY PLATFORM, 2022–2030 (USD MILLION) TABLE 35 ITALY: Point of Care Diagnostics Testing MARKET, BY PRODUCT, 2022–2030 (USD MILLION) TABLE 36 ITALY: Point of Care Diagnostics Testing MARKET, BY END USER2022–2030 (USD MILLION) TABLE 37 ITALY: Point of Care Diagnostics Testing MARKET, BY MODE OF PURCHASE, 2022–2030 (USD MILLION) TABLE 38 ITALY: Point of Care Diagnostics Testing MARKET, BY PLATFORM, 2022–2030 (USD MILLION) TABLE 39 SPAIN: Point of Care Diagnostics Testing MARKET, BY PRODUCT, 2022–2030 (USD MILLION) TABLE 40 SPAIN: Point of Care Diagnostics Testing MARKET, BY END USER, 2022–2030 (USD MILLION) TABLE 41 SPAIN: Point of Care Diagnostics Testing MARKET, BY MODE OF PURCHASE, 2022–2030 (USD MILLION) TABLE 42 SPAIN: Point of Care Diagnostics Testing MARKET, BYPLATFORM2022–2030 (USD MILLION) TABLE 43 REST OF EUROPE: Point of Care Diagnostics Testing MARKET, BY PRODUCT, 2022–2030 (USD MILLION) TABLE 44 REST OF EUROPE: Point of Care Diagnostics Testing MARKET, BY END USER, 2022–2030 (USD MILLION) TABLE 45 REST OF EUROPE: Point of Care Diagnostics Testing MARKET, BY MODE OF PURCHASE, 2022–2030 (USD MILLION) TABLE 46 REST OF EUROPE: Point of Care Diagnostics Testing MARKET, BY PLATFORM, 2022–2030 (USD MILLION) TABLE 47 ASIA-PACIFIC: Point of Care Diagnostics Testing MARKET, BY PRODUCT, 2022–2030 (USD MILLION) TABLE 48 ASIA-PACIFIC: Point of Care Diagnostics Testing MARKET, BY END USER, 2022–2030 (USD MILLION) TABLE 49 ASIA-PACIFIC: Point of Care Diagnostics Testing MARKET, BY MODE OF PURCHASE, 2022–2030 (USD MILLION) TABLE 50 ASIA-PACIFIC: Point of Care Diagnostics Testing MARKET, BY PLATFORM, 2022–2030 (USD MILLION) TABLE 51 CHINA: Point of Care Diagnostics Testing MARKET, BY PRODUCT, 2022–2030 (USD MILLION) TABLE 52 CHINA: Point of Care Diagnostics Testing MARKET, BY END USER, 2022–2030 (USD MILLION) TABLE 53 CHINA: Point of Care Diagnostics Testing MARKET, BY MODE OF PURCHASE, 2022–2030 (USD MILLION) TABLE 54 CHINA: Point of Care Diagnostics Testing MARKET, BY PLATFORM, 2022–2030 (USD MILLION) TABLE 55 INDIA: Point of Care Diagnostics Testing MARKET, BY PRODUCT, 2022–2030 (USD MILLION) TABLE 56 INDIA: Point of Care Diagnostics Testing MARKET, BY END USER, 2022–2030 (USD MILLION) TABLE 57 INDIA: Point of Care Diagnostics Testing MARKET, BY MODE OF PURCHASE, 2022–2030 (USD MILLION) TABLE 58 INDIA: Point of Care Diagnostics Testing MARKET, BY PLATFORM, 2022–2030 (USD MILLION) TABLE 59 JAPAN: Point of Care Diagnostics Testing MARKET, BY PRODUCT, 2022–2030 (USD MILLION) TABLE 60 JAPAN: Point of Care Diagnostics Testing MARKET, BY END USER, 2022–2030 (USD MILLION) TABLE 61 JAPAN: Point of Care Diagnostics Testing MARKET, BY MODE OF PURCHASE, 2022–2030 (USD MILLION) TABLE 62 JAPAN: Point of Care Diagnostics Testing MARKET, BY PLATFORM, 2022–2030 (USD MILLION) TABLE 63 SOUTH KOREA: Point of Care Diagnostics Testing MARKET, BY PRODUCT, 2022–2030 (USD MILLION) TABLE 64 SOUTH KOREA: Point of Care Diagnostics Testing MARKET, BY END USER, 2022–2030 (USD MILLION) TABLE 65 SOUTH KOREA: Point of Care Diagnostics Testing MARKET, BY MODE OF PURCHASE, 2022–2030 (USD MILLION) TABLE 66 SOUTH KOREA: Point of Care Diagnostics Testing MARKET, BY PLATFORM, 2022–2030 (USD MILLION) TABLE 67 AUSTRALIA: Point of Care Diagnostics Testing MARKET, BY PRODUCT, 2022–2030 (USD MILLION) TABLE 68 AUSTRALIA: Point of Care Diagnostics Testing MARKET, BY END USER, 2022–2030 (USD MILLION) TABLE 69 AUSTRALIA: Point of Care Diagnostics Testing MARKET, BY MODE OF PURCHASE, 2022–2030 (USD MILLION) TABLE 70 AUSTRALIA: Point of Care Diagnostics Testing MARKET, BY PLATFORM, 2022–2030 (USD MILLION) TABLE 71 REST OF ASIA-PACIFIC: Point of Care Diagnostics Testing MARKET, BY PRODUCT, 2022–2030 (USD MILLION) TABLE 72 REST OF ASIA-PACIFIC: Point of Care Diagnostics Testing MARKET, BY END USER, 2022–2030 (USD MILLION) TABLE 73 REST OF ASIA-PACIFIC: Point of Care Diagnostics Testing MARKET, BY MODE OF PURCHASE, 2022–2030 (USD MILLION) TABLE 74 REST OF ASIA-PACIFIC: Point of Care Diagnostics Testing MARKET, BY PLATFORM, 2022–2030 (USD MILLION) TABLE 75 REST OF WORLD: Point of Care Diagnostics Testing MARKET, BY PRODUCT, 2022–2030 (USD MILLION) TABLE 76 REST OF WORLD: Point of Care Diagnostics Testing MARKET, BY END USER, 2022–2030 (USD MILLION) TABLE 77 REST OF WORLD: Point of Care Diagnostics Testing MARKET, BY MODE OF PURCHASE, 2022–2030 (USD MILLION) TABLE 78 REST OF WORLD: Point of Care Diagnostics Testing MARKET, BY PLATFORM, 2022–2030 (USD MILLION) TABLE 79 MIDDLE EAST: Point of Care Diagnostics Testing MARKET, BY PRODUCT, 2022–2030 (USD MILLION) TABLE 80 MIDDLE EAST: Point of Care Diagnostics Testing MARKET, BY END USER, 2022–2030 (USD MILLION) TABLE 81 MIDDLE EAST: Point of Care Diagnostics Testing MARKET, BY MODE OF PURCHASE, 2022–2030 (USD MILLION) TABLE 82 MIDDLE EAST: Point of Care Diagnostics Testing MARKET, BY PLATFORM, 2022–2030 (USD MILLION) TABLE 83 AFRICA: Point of Care Diagnostics Testing MARKET, BY PRODUCT, 2022–2030 (USD MILLION) TABLE 84 AFRICA: Point of Care Diagnostics Testing MARKET, BY END USER, 2022–2030 (USD MILLION) TABLE 85 AFRICA: Point of Care Diagnostics Testing MARKET, BY MODE OF PURCHASE, 2022–2030 (USD MILLION) TABLE 86 AFRICA: Point of Care Diagnostics Testing MARKET, BY PLATFORM, 2022–2030 (USD MILLION) TABLE 87 LATIN AMERICA: Point of Care Diagnostics Testing MARKET, BY PRODUCT, 2022–2030 (USD MILLION) TABLE 88 LATIN AMERICA: Point of Care Diagnostics Testing MARKET, BY END USER, 2022–2030 (USD MILLION) TABLE 89 LATIN AMERICA: Point of Care Diagnostics Testing MARKET, BY MODE OF PURCHASE, 2022–2030 (USD MILLION) TABLE 90 LATIN AMERICA: Point of Care Diagnostics Testing MARKET, BY PLATFORM, 2022–2030 (USD MILLION) LIST OF FIGURES FIGURE 1 RESEARCH PROCESS FIGURE 2 MARKET STRUCTURE FOR THE GLOBAL POINT OF CAREDIAGNOSTICS/TESTING MARKET FIGURE 3 MARKET DYNAMICS FOR THE GLOBAL Point of Care Diagnostics Testing MARKET FIGURE 4 GLOBAL Point of Care Diagnostics Testing MARKET SHARE, BY PRODUCT, 2020 (%) FIGURE 5 GLOBAL Point of Care Diagnostics Testing MARKET SHARE, BY END USER, 2020 (%) FIGURE 6 GLOBAL Point of Care Diagnostics Testing MARKET SHARE, BY MODE OF PURCHASE, 2020 (%) FIGURE 7 GLOBAL Point of Care Diagnostics Testing MARKET SHARE, BY PLATFORM, 2020 (%) FIGURE 8 GLOBAL Point of Care Diagnostics Testing MARKET SHARE, BY REGION, 2020 (%) FIGURE 9 NORTH AMERICAPoint of Care Diagnostics Testing MARKET SHARE, BY PRODUCT, 2020 (%) FIGURE 10 NORTH AMERICAPoint of Care Diagnostics Testing MARKET SHARE, BY END USER, 2020 (%) FIGURE 11 NORTH AMERICAPoint of Care Diagnostics Testing MARKET SHARE, BY MODE OF PURCHASE, 2020 (%) FIGURE 12 NORTH AMERICAPoint of Care Diagnostics Testing MARKET SHARE, BY PLATFORM, 2020 (%) FIGURE 13 EUROPEPoint of Care Diagnostics Testing MARKET SHARE, BY PRODUCT, 2020 (%) FIGURE 14 EUROPEPoint of Care Diagnostics Testing MARKET SHARE, BY END USER, 2020 (%) FIGURE 15 EUROPEPoint of Care Diagnostics Testing MARKET SHARE, BY MODE OF PURCHASE, 2020 (%) FIGURE 16 EUROPEPoint of Care Diagnostics Testing MARKET SHARE, BY PLATFORM, 2020 (%) FIGURE 17 ASIA-PACIFICPoint of Care Diagnostics Testing MARKET SHARE, BY PRODUCT, 2020 (%) FIGURE 18 ASIA-PACIFICPoint of Care Diagnostics Testing MARKET SHARE, BY END USER, 2020 (%) FIGURE 19 ASIA-PACIFICPoint of Care Diagnostics Testing MARKET SHARE, BY MODE OF PURCHASE, 2020 (%) FIGURE 20 ASIA-PACIFICPoint of Care Diagnostics Testing MARKET SHARE, BY PLATFORM, 2020 (%) FIGURE 21 REST OF THE WORLDPoint of Care Diagnostics Testing MARKET SHARE, BY PRODUCT, 2020 (%) FIGURE 22 REST OF THE WORLD Point of Care Diagnostics Testing MARKET SHARE, BY END USER, 2020 (%) FIGURE 23 REST OF THE WORLDPoint of Care Diagnostics Testing MARKET SHARE, BY MODE OF PURCHASE, 2020 (%) FIGURE 24 REST OF THE WORLD Point of Care Diagnostics Testing MARKET SHARE, BY PLATFORM, 2020 (%) FIGURE 25 ABBOTT LABORATORIES .: KEY FINANCIALS FIGURE 26 ABBOTT LABORATORIES : SEGMENTAL REVENUE FIGURE 27 ABBOTT LABORATORIES : REGIONAL REVENUE FIGURE 28 SIEMENS HEALTHINEERS GMBH : KEY FINANCIALS FIGURE 29 SIEMENS HEALTHINEERS GMBH : SEGMENTAL REVENUE FIGURE 30 SIEMENS HEALTHINEERS GMBH : REGIONAL REVENUE FIGURE 31 CHEMBIO DIAGNOSTICS, INC. : KEY FINANCIALS FIGURE 32 CHEMBIO DIAGNOSTICS, INC. : SEGMENTAL REVENUE FIGURE 33 CHEMBIO DIAGNOSTICS, INC. : REGIONAL REVENUE FIGURE 34 F. HOFFMANN-LA ROCHE LTD.: KEY FINANCIALS FIGURE 35 F. HOFFMANN-LA ROCHE LTD.: SEGMENTAL REVENUE FIGURE 36 F. HOFFMANN-LA ROCHE LTD.: REGIONAL REVENUE FIGURE 37 JOHNSON & JOHNSON SERVICES, INC. : KEY FINANCIALS FIGURE 38 JOHNSON & JOHNSON SERVICES, INC. : SEGMENTAL REVENUE FIGURE 39 JOHNSON & JOHNSON SERVICES, INC. : REGIONAL REVENUE FIGURE 40 BECTON, DICKINSON AND COMPANY : KEY FINANCIALS FIGURE 41 BECTON, DICKINSON AND COMPANY : SEGMENTAL REVENUE FIGURE 42 BECTON, DICKINSON AND COMPANY : REGIONAL REVENUE FIGURE 43 DANAHER CORPORATION : KEY FINANCIALS FIGURE 44 DANAHER CORPORATION : SEGMENTAL REVENUE FIGURE 45 DANAHER CORPORATION : REGIONAL REVENUE FIGURE 46 PTS DIAGNOSTICS: KEY FINANCIALS FIGURE 47 PTS DIAGNOSTICS: SEGMENTAL REVENUE FIGURE 48 PTS DIAGNOSTICS: REGIONAL REVENUE FIGURE 49 NOVA BIOMEDICAL : KEY FINANCIALS FIGURE 50 NOVA BIOMEDICAL : SEGMENTAL REVENUE FIGURE 51 NOVA BIOMEDICAL : REGIONAL REVENUE FIGURE 52 QUIDEL CORPORATION : KEY FINANCIALS FIGURE 53 QUIDEL CORPORATION : SEGMENTAL REVENUE FIGURE 54 QUIDEL CORPORATION : REGIONAL REVENUE FIGURE 55 SEKISUI DIAGNOSTICS : KEY FINANCIALS FIGURE 56 SEKISUI DIAGNOSTICS : SEGMENTAL REVENUE FIGURE 57 SEKISUI DIAGNOSTICS : REGIONAL REVENUE FIGURE 58 TRINITY BIOTECH : KEY FINANCIALS FIGURE 59 TRINITY BIOTECH : SEGMENTAL REVENUE FIGURE 60 TRINITY BIOTECH : REGIONAL REVENUE FIGURE 61 ACCUBIOTECH CO., LTD.: KEY FINANCIALS FIGURE 62 ACCUBIOTECH CO., LTD.: SEGMENTAL REVENUE FIGURE 63 ACCUBIOTECH CO., LTD.: REGIONAL REVENUE FIGURE 64 INSTRUMENTATION LABORATORY COMPANY (WERFEN): KEY FINANCIALS FIGURE 65 INSTRUMENTATION LABORATORY COMPANY (WERFEN): SEGMENTAL REVENUE FIGURE 66 INSTRUMENTATION LABORATORY COMPANY (WERFEN): REGIONAL REVENUE FIGURE 67 EKF DIAGNOSTICS HOLDINGS PLC: KEY FINANCIALS FIGURE 68 EKF DIAGNOSTICS HOLDINGS PLC: SEGMENTAL REVENUE FIGURE 69 EKF DIAGNOSTICS HOLDINGS PLC: REGIONAL REVENUE
    227. List of Tables and Figures
      1. Table FIGURE 1 RESEARCH PROCESS FIGURE 2 MARKET STRUCTURE FOR THE GLOBAL POINT OF CAREDIAGNOSTICS/TESTING MARKET FIGURE 3 MARKET DYNAMICS FOR THE GLOBAL Point of Care Diagnostics Testing MARKET FIGURE 4 GLOBAL Point of Care Diagnostics Testing MARKET SHARE, BY PRODUCT, 2020 (%) FIGURE 5 GLOBAL Point of Care Diagnostics Testing MARKET SHARE, BY END USER, 2020 (%) FIGURE 6 GLOBAL Point of Care Diagnostics Testing MARKET SHARE, BY MODE OF PURCHASE, 2020 (%) FIGURE 7 GLOBAL Point of Care Diagnostics Testing MARKET SHARE, BY PLATFORM, 2020 (%) FIGURE 8 GLOBAL Point of Care Diagnostics Testing MARKET SHARE, BY REGION, 2020 (%) FIGURE 9 NORTH AMERICAPoint of Care Diagnostics Testing MARKET SHARE, BY PRODUCT, 2020 (%) FIGURE 10 NORTH AMERICAPoint of Care Diagnostics Testing MARKET SHARE, BY END USER, 2020 (%) FIGURE 11 NORTH AMERICAPoint of Care Diagnostics Testing MARKET SHARE, BY MODE OF PURCHASE, 2020 (%) FIGURE 12 NORTH AMERICAPoint of Care Diagnostics Testing MARKET SHARE, BY PLATFORM, 2020 (%) FIGURE 13 EUROPEPoint of Care Diagnostics Testing MARKET SHARE, BY PRODUCT, 2020 (%) FIGURE 14 EUROPEPoint of Care Diagnostics Testing MARKET SHARE, BY END USER, 2020 (%) FIGURE 15 EUROPEPoint of Care Diagnostics Testing MARKET SHARE, BY MODE OF PURCHASE, 2020 (%) FIGURE 16 EUROPEPoint of Care Diagnostics Testing MARKET SHARE, BY PLATFORM, 2020 (%) FIGURE 17 ASIA-PACIFICPoint of Care Diagnostics Testing MARKET SHARE, BY PRODUCT, 2020 (%) FIGURE 18 ASIA-PACIFICPoint of Care Diagnostics Testing MARKET SHARE, BY END USER, 2020 (%) FIGURE 19 ASIA-PACIFICPoint of Care Diagnostics Testing MARKET SHARE, BY MODE OF PURCHASE, 2020 (%) FIGURE 20 ASIA-PACIFICPoint of Care Diagnostics Testing MARKET SHARE, BY PLATFORM, 2020 (%) FIGURE 21 REST OF THE WORLDPoint of Care Diagnostics Testing MARKET SHARE, BY PRODUCT, 2020 (%) FIGURE 22 REST OF THE WORLD Point of Care Diagnostics Testing MARKET SHARE, BY END USER, 2020 (%) FIGURE 23 REST OF THE WORLDPoint of Care Diagnostics Testing MARKET SHARE, BY MODE OF PURCHASE, 2020 (%) FIGURE 24 REST OF THE WORLD Point of Care Diagnostics Testing MARKET SHARE, BY PLATFORM, 2020 (%) FIGURE 25 ABBOTT LABORATORIES .: KEY FINANCIALS FIGURE 26 ABBOTT LABORATORIES : SEGMENTAL REVENUE FIGURE 27 ABBOTT LABORATORIES : REGIONAL REVENUE FIGURE 28 SIEMENS HEALTHINEERS GMBH : KEY FINANCIALS FIGURE 29 SIEMENS HEALTHINEERS GMBH : SEGMENTAL REVENUE FIGURE 30 SIEMENS HEALTHINEERS GMBH : REGIONAL REVENUE FIGURE 31 CHEMBIO DIAGNOSTICS, INC. : KEY FINANCIALS FIGURE 32 CHEMBIO DIAGNOSTICS, INC. : SEGMENTAL REVENUE FIGURE 33 CHEMBIO DIAGNOSTICS, INC. : REGIONAL REVENUE FIGURE 34 F. HOFFMANN-LA ROCHE LTD.: KEY FINANCIALS FIGURE 35 F. HOFFMANN-LA ROCHE LTD.: SEGMENTAL REVENUE FIGURE 36 F. HOFFMANN-LA ROCHE LTD.: REGIONAL REVENUE FIGURE 37 JOHNSON & JOHNSON SERVICES, INC. : KEY FINANCIALS FIGURE 38 JOHNSON & JOHNSON SERVICES, INC. : SEGMENTAL REVENUE FIGURE 39 JOHNSON & JOHNSON SERVICES, INC. : REGIONAL REVENUE FIGURE 40 BECTON, DICKINSON AND COMPANY : KEY FINANCIALS FIGURE 41 BECTON, DICKINSON AND COMPANY : SEGMENTAL REVENUE FIGURE 42 BECTON, DICKINSON AND COMPANY : REGIONAL REVENUE FIGURE 43 DANAHER CORPORATION : KEY FINANCIALS FIGURE 44 DANAHER CORPORATION : SEGMENTAL REVENUE FIGURE 45 DANAHER CORPORATION : REGIONAL REVENUE FIGURE 46 PTS DIAGNOSTICS: KEY FINANCIALS FIGURE 47 PTS DIAGNOSTICS: SEGMENTAL REVENUE FIGURE 48 PTS DIAGNOSTICS: REGIONAL REVENUE FIGURE 49 NOVA BIOMEDICAL : KEY FINANCIALS FIGURE 50 NOVA BIOMEDICAL : SEGMENTAL REVENUE FIGURE 51 NOVA BIOMEDICAL : REGIONAL REVENUE FIGURE 52 QUIDEL CORPORATION : KEY FINANCIALS FIGURE 53 QUIDEL CORPORATION : SEGMENTAL REVENUE FIGURE 54 QUIDEL CORPORATION : REGIONAL REVENUE FIGURE 55 SEKISUI DIAGNOSTICS : KEY FINANCIALS FIGURE 56 SEKISUI DIAGNOSTICS : SEGMENTAL REVENUE FIGURE 57 SEKISUI DIAGNOSTICS : REGIONAL REVENUE FIGURE 58 TRINITY BIOTECH : KEY FINANCIALS FIGURE 59 TRINITY BIOTECH : SEGMENTAL REVENUE FIGURE 60 TRINITY BIOTECH : REGIONAL REVENUE FIGURE 61 ACCUBIOTECH CO., LTD.: KEY FINANCIALS FIGURE 62 ACCUBIOTECH CO., LTD.: SEGMENTAL REVENUE FIGURE 63 ACCUBIOTECH CO., LTD.: REGIONAL REVENUE FIGURE 64 INSTRUMENTATION LABORATORY COMPANY (WERFEN): KEY FINANCIALS FIGURE 65 INSTRUMENTATION LABORATORY COMPANY (WERFEN): SEGMENTAL REVENUE FIGURE 66 INSTRUMENTATION LABORATORY COMPANY (WERFEN): REGIONAL REVENUE FIGURE 67 EKF DIAGNOSTICS HOLDINGS PLC: KEY FINANCIALS FIGURE 68 EKF DIAGNOSTICS HOLDINGS PLC: SEGMENTAL REVENUE FIGURE 69 EKF DIAGNOSTICS HOLDINGS PLC: REGIONAL REVENUE
    228. Table FIGURE 1 RESEARCH PROCESS FIGURE 2 MARKET STRUCTURE FOR THE GLOBAL POINT OF CAREDIAGNOSTICS/TESTING MARKET FIGURE 3 MARKET DYNAMICS FOR THE GLOBAL Point of Care Diagnostics Testing MARKET FIGURE 4 GLOBAL Point of Care Diagnostics Testing MARKET SHARE, BY PRODUCT, 2020 (%) FIGURE 5 GLOBAL Point of Care Diagnostics Testing MARKET SHARE, BY END USER, 2020 (%) FIGURE 6 GLOBAL Point of Care Diagnostics Testing MARKET SHARE, BY MODE OF PURCHASE, 2020 (%) FIGURE 7 GLOBAL Point of Care Diagnostics Testing MARKET SHARE, BY PLATFORM, 2020 (%) FIGURE 8 GLOBAL Point of Care Diagnostics Testing MARKET SHARE, BY REGION, 2020 (%) FIGURE 9 NORTH AMERICAPoint of Care Diagnostics Testing MARKET SHARE, BY PRODUCT, 2020 (%) FIGURE 10 NORTH AMERICAPoint of Care Diagnostics Testing MARKET SHARE, BY END USER, 2020 (%) FIGURE 11 NORTH AMERICAPoint of Care Diagnostics Testing MARKET SHARE, BY MODE OF PURCHASE, 2020 (%) FIGURE 12 NORTH AMERICAPoint of Care Diagnostics Testing MARKET SHARE, BY PLATFORM, 2020 (%) FIGURE 13 EUROPEPoint of Care Diagnostics Testing MARKET SHARE, BY PRODUCT, 2020 (%) FIGURE 14 EUROPEPoint of Care Diagnostics Testing MARKET SHARE, BY END USER, 2020 (%) FIGURE 15 EUROPEPoint of Care Diagnostics Testing MARKET SHARE, BY MODE OF PURCHASE, 2020 (%) FIGURE 16 EUROPEPoint of Care Diagnostics Testing MARKET SHARE, BY PLATFORM, 2020 (%) FIGURE 17 ASIA-PACIFICPoint of Care Diagnostics Testing MARKET SHARE, BY PRODUCT, 2020 (%) FIGURE 18 ASIA-PACIFICPoint of Care Diagnostics Testing MARKET SHARE, BY END USER, 2020 (%) FIGURE 19 ASIA-PACIFICPoint of Care Diagnostics Testing MARKET SHARE, BY MODE OF PURCHASE, 2020 (%) FIGURE 20 ASIA-PACIFICPoint of Care Diagnostics Testing MARKET SHARE, BY PLATFORM, 2020 (%) FIGURE 21 REST OF THE WORLDPoint of Care Diagnostics Testing MARKET SHARE, BY PRODUCT, 2020 (%) FIGURE 22 REST OF THE WORLD Point of Care Diagnostics Testing MARKET SHARE, BY END USER, 2020 (%) FIGURE 23 REST OF THE WORLDPoint of Care Diagnostics Testing MARKET SHARE, BY MODE OF PURCHASE, 2020 (%) FIGURE 24 REST OF THE WORLD Point of Care Diagnostics Testing MARKET SHARE, BY PLATFORM, 2020 (%) FIGURE 25 ABBOTT LABORATORIES .: KEY FINANCIALS FIGURE 26 ABBOTT LABORATORIES : SEGMENTAL REVENUE FIGURE 27 ABBOTT LABORATORIES : REGIONAL REVENUE FIGURE 28 SIEMENS HEALTHINEERS GMBH : KEY FINANCIALS FIGURE 29 SIEMENS HEALTHINEERS GMBH : SEGMENTAL REVENUE FIGURE 30 SIEMENS HEALTHINEERS GMBH : REGIONAL REVENUE FIGURE 31 CHEMBIO DIAGNOSTICS, INC. : KEY FINANCIALS FIGURE 32 CHEMBIO DIAGNOSTICS, INC. : SEGMENTAL REVENUE FIGURE 33 CHEMBIO DIAGNOSTICS, INC. : REGIONAL REVENUE FIGURE 34 F. HOFFMANN-LA ROCHE LTD.: KEY FINANCIALS FIGURE 35 F. HOFFMANN-LA ROCHE LTD.: SEGMENTAL REVENUE FIGURE 36 F. HOFFMANN-LA ROCHE LTD.: REGIONAL REVENUE FIGURE 37 JOHNSON & JOHNSON SERVICES, INC. : KEY FINANCIALS FIGURE 38 JOHNSON & JOHNSON SERVICES, INC. : SEGMENTAL REVENUE FIGURE 39 JOHNSON & JOHNSON SERVICES, INC. : REGIONAL REVENUE FIGURE 40 BECTON, DICKINSON AND COMPANY : KEY FINANCIALS FIGURE 41 BECTON, DICKINSON AND COMPANY : SEGMENTAL REVENUE FIGURE 42 BECTON, DICKINSON AND COMPANY : REGIONAL REVENUE FIGURE 43 DANAHER CORPORATION : KEY FINANCIALS FIGURE 44 DANAHER CORPORATION : SEGMENTAL REVENUE FIGURE 45 DANAHER CORPORATION : REGIONAL REVENUE FIGURE 46 PTS DIAGNOSTICS: KEY FINANCIALS FIGURE 47 PTS DIAGNOSTICS: SEGMENTAL REVENUE FIGURE 48 PTS DIAGNOSTICS: REGIONAL REVENUE FIGURE 49 NOVA BIOMEDICAL : KEY FINANCIALS FIGURE 50 NOVA BIOMEDICAL : SEGMENTAL REVENUE FIGURE 51 NOVA BIOMEDICAL : REGIONAL REVENUE FIGURE 52 QUIDEL CORPORATION : KEY FINANCIALS FIGURE 53 QUIDEL CORPORATION : SEGMENTAL REVENUE FIGURE 54 QUIDEL CORPORATION : REGIONAL REVENUE FIGURE 55 SEKISUI DIAGNOSTICS : KEY FINANCIALS FIGURE 56 SEKISUI DIAGNOSTICS : SEGMENTAL REVENUE FIGURE 57 SEKISUI DIAGNOSTICS : REGIONAL REVENUE FIGURE 58 TRINITY BIOTECH : KEY FINANCIALS FIGURE 59 TRINITY BIOTECH : SEGMENTAL REVENUE FIGURE 60 TRINITY BIOTECH : REGIONAL REVENUE FIGURE 61 ACCUBIOTECH CO., LTD.: KEY FINANCIALS FIGURE 62 ACCUBIOTECH CO., LTD.: SEGMENTAL REVENUE FIGURE 63 ACCUBIOTECH CO., LTD.: REGIONAL REVENUE FIGURE 64 INSTRUMENTATION LABORATORY COMPANY (WERFEN): KEY FINANCIALS FIGURE 65 INSTRUMENTATION LABORATORY COMPANY (WERFEN): SEGMENTAL REVENUE FIGURE 66 INSTRUMENTATION LABORATORY COMPANY (WERFEN): REGIONAL REVENUE FIGURE 67 EKF DIAGNOSTICS HOLDINGS PLC: KEY FINANCIALS FIGURE 68 EKF DIAGNOSTICS HOLDINGS PLC: SEGMENTAL REVENUE FIGURE 69 EKF DIAGNOSTICS HOLDINGS PLC: REGIONAL REVENUE

    Point of Care Diagnostics Testing Market Segmentation

    Market Segmentation Overview

    • Detailed segmentation data will be available in the full report
    • Comprehensive analysis by multiple parameters
    • Regional and country-level breakdowns
    • Market size forecasts by segment
    Infographic

    Free Sample Request

    Kindly complete the form below to receive a free sample of this Report

    Get Free Sample

    Customer Strories

    “I am very pleased with how market segments have been defined in a relevant way for my purposes (such as "Portable Freezers & refrigerators" and "last-mile"). In general the report is well structured. Thanks very much for your efforts.”

    Victoria Milne

    Founder
    Case Study
    Chemicals and Materials