• Cat-intel
  • MedIntelliX
  • Resources
  • About Us
  • Request Free Sample ×

    Kindly complete the form below to receive a free sample of this Report

    Leading companies partner with us for data-driven Insights

    clients tt-cursor

    Pelletized Activated Carbon Market

    ID: MRFR/CnM/21648-HCR
    111 Pages
    Priya Nagrale
    September 2025

    Pelletized Activated Carbon Market Research Report By Application (Liquid Phase, Gas Phase), By Source (Coal, Wood, Coconut Shells), By Manufacturing Process (Physical, Chemical), By Mesh Size (8x30 Mesh, 12x40 Mesh, 4x8 Mesh) and By Regional (North America, Europe, South America, Asia Pacific, Middle East and Africa)  - Forecast to 2034

    Share:
    Download PDF ×

    We do not share your information with anyone. However, we may send you emails based on your report interest from time to time. You may contact us at any time to opt-out.

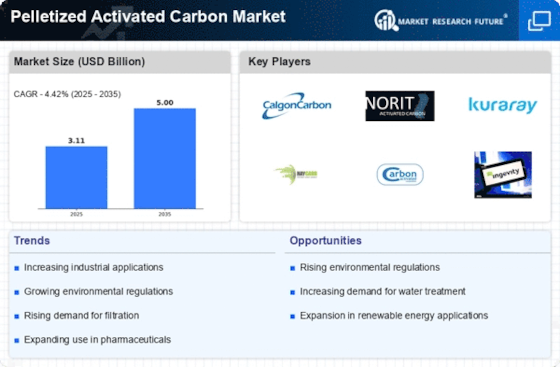
    Pelletized Activated Carbon Market Research Report - Global Forecast till 2034 Infographic
    Purchase Options
    $ 4,950.0
    $ 5,950
    $ 7,250.0
    Table of Contents

    Pelletized Activated Carbon Market Summary

    The global pelletized activated carbon market is projected to grow significantly, reaching 5000 USD million by 2035.

    Key Market Trends & Highlights

    Pelletized Activated Carbon Key Trends and Highlights

    • The market valuation is expected to increase from 2500 USD million in 2024 to 5000 USD million by 2035.
    • A compound annual growth rate (CAGR) of 6.5 percent is anticipated from 2025 to 2035.
    • The demand for pelletized activated carbon is likely driven by its applications in air and water treatment processes.
    • Growing adoption of advanced filtration technologies due to increasing environmental regulations is a major market driver.

    Market Size & Forecast

    2024 Market Size 2500 (USD Million)
    2035 Market Size 5000 (USD Million)
    CAGR (2025 - 2035) 6.5%

    Major Players

    Apple Inc (US), Microsoft Corp (US), Amazon.com Inc (US), Alphabet Inc (US), Berkshire Hathaway Inc (US), Tesla Inc (US), Meta Platforms Inc (US), Johnson & Johnson (US), Visa Inc (US), Procter & Gamble Co (US)

    Pelletized Activated Carbon Market Trends

    A surge in demand for water purification, gas purification, and air purification applications is driving the growing market of pelleted activated carbon. The market is poised for significant growth as environmental sustainability becomes more important to industries and strict regulations encourage the adoption of advanced filtration technologies.

    The key factors contributing to this growth include increasing levels of air and water pollution, a rise in the demand for drinking water, and industrialization in developing countries. Moreover, within drug formulations in pharmaceuticals, pelletized activated carbon provides tasteless and odorless ingredients that require diverse needs for different products. It can also be used as an adsorbent to provide high-quality materials.

    Presently, there are several trends suggesting that production processes linked with activated carbons tend to be sustainable and environmentally friendly, such as the utilization of renewable feedstocks or waste streams. Also, innovative technologies aimed at increasing the adsorption capability of activated carbons through modification are responsible for shaping the landscape of this industry. Besides enhancing its performance with respect to emerging demands, researchers are currently deducing new potential areas where pelletized activated carbon could be deployed.

    The increasing emphasis on environmental sustainability and stringent regulations regarding air and water quality are driving the demand for pelletized activated carbon across various industries.

    U.S. Environmental Protection Agency

    Pelletized Activated Carbon Market Drivers

    Market Growth Projections

    The Global Pelletized Activated Carbon Market Industry is projected to experience substantial growth over the coming years. With a market value of 2500 USD Million in 2024, it is anticipated to reach 5000 USD Million by 2035, reflecting a robust CAGR of 6.5% from 2025 to 2035. This growth is driven by various factors, including increasing environmental regulations, technological advancements, and expanding applications across multiple sectors. The market's trajectory suggests a dynamic landscape, where innovation and sustainability play pivotal roles in shaping future developments.

    Rising Environmental Awareness

    Growing environmental awareness among consumers and industries significantly influences the Global Pelletized Activated Carbon Market Industry. As sustainability becomes a priority, businesses are increasingly adopting eco-friendly practices, including the use of activated carbon for air and water purification. This shift is evident in various sectors, such as food and beverage, pharmaceuticals, and manufacturing, where companies aim to reduce their environmental footprint. The market is expected to expand as more organizations recognize the benefits of pelletized activated carbon in achieving compliance with environmental regulations and enhancing corporate responsibility.

    Expanding Applications Across Industries

    The versatility of pelletized activated carbon contributes to its expanding applications across diverse industries, thereby propelling the Global Pelletized Activated Carbon Market Industry. From water treatment to air purification and food processing, the material's effectiveness in adsorbing impurities makes it invaluable. Industries such as automotive and pharmaceuticals are increasingly utilizing activated carbon for various purposes, including emissions control and drug manufacturing. This broad applicability suggests a sustained demand trajectory, with the market expected to reach 5000 USD Million by 2035, reflecting its integral role in modern industrial processes.

    Regulatory Support for Pollution Control

    Regulatory frameworks aimed at pollution control significantly bolster the Global Pelletized Activated Carbon Market Industry. Governments worldwide are implementing stringent regulations to mitigate air and water pollution, creating a favorable environment for activated carbon solutions. Compliance with these regulations often necessitates the use of advanced filtration technologies, including pelletized activated carbon. As industries strive to meet these standards, the demand for activated carbon is likely to rise. This regulatory support not only enhances market growth but also encourages innovation in carbon production and application, ensuring a sustainable future.

    Increasing Demand for Water Treatment Solutions

    The Global Pelletized Activated Carbon Market Industry experiences heightened demand driven by the need for effective water treatment solutions. As water quality regulations become more stringent, industries and municipalities seek advanced filtration technologies. Pelletized activated carbon is recognized for its superior adsorption capabilities, making it a preferred choice for removing contaminants from water. In 2024, the market is projected to reach 2500 USD Million, reflecting the growing emphasis on clean water access. This trend is likely to continue as global populations increase and urbanization accelerates, necessitating innovative water treatment methods.

    Technological Advancements in Carbon Production

    Technological advancements in the production of pelletized activated carbon are poised to drive growth in the Global Pelletized Activated Carbon Market Industry. Innovations in activation processes and raw material sourcing enhance the efficiency and effectiveness of activated carbon. For instance, the development of more sustainable production methods can reduce costs and improve product quality. As these technologies evolve, they may lead to increased adoption across various applications, including air purification and industrial processes. The market is projected to grow at a CAGR of 6.5% from 2025 to 2035, indicating a robust future driven by these advancements.

    Market Segment Insights

    Pelletized Activated Carbon Market Source Insights  

    Pelletized activated carbon’s quality and cost-effectiveness depend heavily on the source sector. Coal-based activated carbon is extensively used, with more than 50% of the  market share, because it has a high surface area and adsorption capacity. Coconut shell-based activated carbon made from hardwoods such as coconut shells is a new entrant that provides better adsorptive properties for applications where cleanliness and selectivity are important. In water treatment as well as gas purification systems, activated carbons derived from coconut shells are considered hard and extremely durable.

    The demand for highly efficient activated carbon is growing across many different sectors, such as pharmaceuticals, water and wastewater treatment, and food and beverages, among others, which will be the leading factor propelling the growth of the pelletized activated carbon market. The coal sources accounted for a share of about USD 1.5 billion in the  coal-based pelletized activated carbon market in 2023. It is expected that this segment will cross at least USD 2.2 billion by 2030 at a CAGR of 4.5%.

    Additionally, the wood source segment is envisaged to show constant growth up to USD 0.8 billion by 2030, while the coconut shell source segment is predicted to rise with a CAGR of 5.2%, and it will achieve USD 0.4 billion up to the forecast period end.

    Pelletized Activated Carbon Market Manufacturing Process Insights  

    Manufacturing processes can be divided into two groups: Physical and chemical processes. In this case, the physical activation is done by heating the raw material without air, while chemical activation adds chemicals such as phosphoric acid or zinc chloride to make an explicit porous structure. Despite some disadvantages, each of these methods has its own advantages, with the latter being most commonly used because it is relatively cheaper. In 2023, Physical activation accounted for a greater percentage of total revenue at about 65% compared to the remaining 35% from Chemical Activation.

    The physical activation market is predicted to grow at a CAGR of 4.2% during the forecast period starting from 2024 till 2034 and reach USD 2.7 billion by the end of that period in 2034. Likewise, the Chemical Activation segment expects growth at a CAGR of around 4.6% over this same time period, resulting in a valuation worth approximately USD 1.5 billion by the end of 2034.

    Pelletized Activated Carbon Market Mesh Size Insights  

    Mesh Size Segment Insights and Overview The  pelletized activated carbon market is segmented by mesh size into 8x30 Mesh, 12x40 Mesh, and 4x8 Mesh. Among these, the 8x30 Mesh segment held the largest market share in 2023, accounting for over 45% of the  Pelletized Activated Carbon Market revenue. The 12x40 Mesh segment is expected to witness the highest growth rate over the forecast period, owing to its increasing adoption in water treatment applications.

    The 4x8 Mesh segment is primarily used in gas purification and has a significant market share.The Pelletized Activated Carbon Market is driven by factors such as increasing demand for water purification, growing awareness about environmental protection, and stringent government regulations on wastewater discharge. The market is also expected to benefit from the rising adoption of activated carbon in various industries, including pharmaceuticals, food and beverages, and automotive. The Pelletized Activated Carbon Market is highly competitive, with several major players operating in the market.

    Some of the key players include Cabot Corporation, Calgon Carbon Corporation, and Kuraray Co., Ltd.These companies are investing in research and development to improve the performance and efficiency of their products. They are also expanding their production capacities to meet the growing demand for pelletized activated carbon.

    Get more detailed insights about Pelletized Activated Carbon Market Research Report - Global Forecast till 2034

    Regional Insights

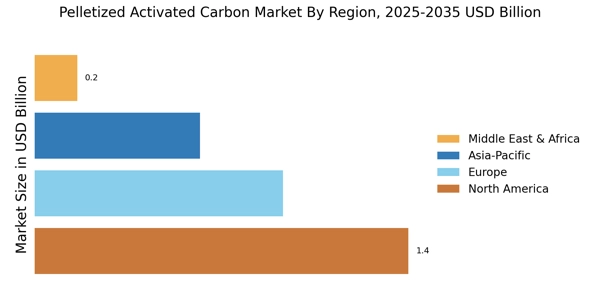
    The regional segmentation of the  Pelletized Activated Carbon Market provides insights into the market's geographic distribution and growth potential. North America held the largest market share in 2023, accounting for approximately 35% of the  revenue. The region's dominance is attributed to the presence of well-established water and wastewater treatment industries, stringent environmental regulations, and a growing demand for activated carbon in various applications.

    Europe is another significant region, with a market size of USD 750 million in 2023 and a projected growth rate of 4.2% CAGR during the forecast period.The region's growth is driven by increasing awareness of environmental sustainability and the adoption of advanced water treatment technologies. The APAC region is expected to witness the fastest growth, with a CAGR of 5.5% over the forecast period. The region's growth is attributed to rapid urbanization, industrialization, and increasing disposable income, leading to a surge in demand for water purification and wastewater treatment solutions.

    Pelletized Activated Carbon Market Regional

    Source: Primary Research, Secondary Research, Market Research Future Database and Analyst Review

    Key Players and Competitive Insights

    Major players in the Pelletized Activated Carbon Market industry are constantly striving to expand their market reach and develop innovative products to cater to the evolving needs of customers. Leading Pelletized Activated Carbon Market players are investing heavily in research and development to enhance the efficiency and performance of their products. The Pelletized Activated Carbon Market industry is highly competitive, with key players focusing on strategic partnerships and mergers and acquisitions to strengthen their market position.

    The Pelletized Activated Carbon Market competitive landscape is expected to remain dynamic in the coming years, driven by technological advancements and the increasing demand for effective purification solutions in various industries.A prominent competitor in the  Pelletized Activated Carbon Market is Cabot Corporation. The company holds a significant market share and is known for its high-quality activated carbon products. Cabot Corporation has a  presence and caters to a wide range of industries, including water treatment, food processing, and pharmaceutical manufacturing. The company continuously invests in research and development to improve its product offerings and maintain its competitive edge.

    Cabot Corporation emphasizes sustainability and environmental responsibility in its operations and product development.Another major competitor in the  Pelletized Activated Carbon Market is Jacobi Carbons. The company is recognized for its expertise in activated carbon production and its commitment to innovation. Jacobi Carbons has a strong  presence with manufacturing facilities in various regions. The company offers a wide range of pelletized activated carbon products tailored to meet the specific requirements of different industries. Jacobi Carbons focuses on providing customized solutions to its customers and collaborates with them to develop tailored activated carbon solutions.

    The company's commitment to quality and customer satisfaction has enabled it to establish a strong reputation in the Pelletized Activated Carbon Market.

    Key Companies in the Pelletized Activated Carbon Market market include

    Industry Developments

    Rising demand for pelletized activated carbon in water and wastewater treatment, coupled with growing awareness about environmental sustainability, drives market growth. Additionally, increasing industrialization and stringent government regulations regarding pollution control further contribute to market expansion. Key developments include strategic partnerships, product innovations, and capacity expansions by leading market players. For instance, in 2023, Cabot Corporation announced plans to invest USD 15 million to expand its activated carbon production capacity in the Asia-Pacific region.

    Future Outlook

    Pelletized Activated Carbon Market Future Outlook

    The Global Pelletized Activated Carbon Market is projected to grow at a 6.5% CAGR from 2024 to 2035, driven by increasing environmental regulations and demand for air and water purification.

    New opportunities lie in:

    • Develop advanced pelletized carbon products for emerging filtration technologies.
    • Expand into renewable energy sectors for carbon capture applications.
    • Leverage e-commerce platforms to enhance distribution and market reach.

    By 2035, the market is expected to achieve substantial growth, reflecting robust demand and innovation.

    Market Segmentation

    Pelletized Activated Carbon Market Source Outlook

    • Coal
    • Wood
    • Coconut Shells

    Pelletized Activated Carbon Market Regional Outlook

    • North America
    • Europe
    • South America
    • Asia Pacific
    • Middle East and Africa

    Pelletized Activated Carbon Market Mesh Size Outlook

    • 8x30 Mesh
    • 12x40 Mesh
    • 4x8 Mesh

    Pelletized Activated Carbon Market Application Outlook

    • Liquid Phase
    • Gas Phase

    Pelletized Activated Carbon Market Manufacturing Process Outlook

    • Physical
    • Chemical

    Report Scope

    Report Attribute/Metric Details 
    Market Size 2024 3.11 (USD Billion)
    Market Size 2025  3.25 (USD Billion)
    Market Size 2034 4.79 (USD Billion)
    Compound Annual Growth Rate (CAGR) 4.4% (2025 - 2034)
    Report Coverage Revenue Forecast, Competitive Landscape, Growth Factors, and Trends
    Base Year 2024
    Market Forecast Period 2025 - 2034
    Historical Data 2020 - 2024
    Market Forecast Units USD Billion
    Key Companies Profiled Purolite Corporation, Jacobi Carbons, Cabot Corporation, Aquacarboneutral, Kuraray, CPL Carbon Link, Tedia Company, Calgon Carbon Corporation, Br Carbon, Carbon Activated, West Virginia Activated Carbon Company, Grainger, Carbon Resources, Norit Activated Carbon, Ingevity Corporation
    Segments Covered Application, Source, Manufacturing Process, Mesh Size, Regional
    Key Market Opportunities Water Treatment Industrialization Healthcare Pharmaceutical Food and Beverages Growing Demand Environmental Regulations Stringent Norms Rising Demand for Activated Carbon with High Adsorption Capacity
    Key Market Dynamics Rising demand for water treatment Increasing adoption in the food and beverage industry Growing environmental regulations Technological advancements in production Expanding applications in pharmaceuticals
    Countries Covered North America, Europe, APAC, South America, MEA

    Market Highlights

    Author
    Priya Nagrale
    Senior Research Analyst

    With an experience of over five years in market research industry (Chemicals & Materials domain), I gather and analyze market data from diverse sources to produce results, which are then presented back to a client. Also, provide recommendations based on the findings. As a Senior Research Analyst, I perform quality checks (QC) for market estimations, QC for reports, and handle queries and work extensively on client customizations. Also, handle the responsibilities of client proposals, report planning, report finalization, and execution

    Leave a Comment

    FAQs

    What is the market size of the Pelletized Activated Carbon Market?

    The Pelletized Activated Carbon Market was valued at around USD 3.11 billion in 2024 and is expected to reach around USD 4.79 billion by 2034, growing at a CAGR of approximately 4.4% over the forecast period 2025 to 2034.

    Which region is the largest consumer of Pelletized Activated Carbon?

    North America is the largest consumer of pelletized activated carbon, accounting for over 50% of the market share. The region's rapid industrialization and growing population are the primary drivers of this growth.

    What are the key applications of Pelletized Activated Carbon?

    Pelletized activated carbon is extensively used in various applications, including water treatment, gas purification, food and beverage processing, and pharmaceuticals. It is particularly effective in removing contaminants, impurities, and odors from liquids and gases.

    Who are the key competitors in the Pelletized Activated Carbon Market?

    Some of the key competitors in the Pelletized Activated Carbon Market include Cabot Corporation, Calgon Carbon Corporation, Jacobi Carbons, Kuraray Co., Ltd., and Osaka Gas Chemicals Co., Ltd.

    What are the growth drivers for the Pelletized Activated Carbon Market?

    The growth of the Pelletized Activated Carbon Market is primarily driven by increasing demand for water and air purification, stringent environmental regulations, and rising industrialization in emerging economies.

    What are the challenges faced by the Pelletized Activated Carbon Market?

    The Pelletized Activated Carbon Market faces challenges such as fluctuating raw material prices, intense competition, and the availability of alternative technologies for water and air purification.

    What are the emerging trends in the Pelletized Activated Carbon Market?

    Emerging trends in the Pelletized Activated Carbon Market include the development of sustainable and eco-friendly activated carbon, the use of advanced technologies for production, and the growing demand for customized solutions.

    What is the impact of COVID-19 on the Pelletized Activated Carbon Market?

    The COVID-19 pandemic had a moderate impact on the Pelletized Activated Carbon Market. While some industries experienced a decline in demand, others, such as healthcare and water treatment, saw increased demand for activated carbon.

    What is the forecast for the Pelletized Activated Carbon Market?

    The Pelletized Activated Carbon Market is expected to grow steadily over the forecast period, driven by increasing demand from various industries and the growing awareness of the importance of clean water and air.

    What are the key factors influencing the growth of the Pelletized Activated Carbon Market?

    Key factors influencing the growth of the Pelletized Activated Carbon Market include the increasing demand for clean water and air, stringent environmental regulations, and the growing adoption of pelletized activated carbon in various industries.

    1. 'TABLE OF CONTENTS
    2. EXECUTIVE SUMMARY
      1. Market Overview
      2. Key Findings
      3. Market Segmentation
      4. Competitive Landscape
      5. Challenges and Opportunities
      6. Future Outlook
    3. MARKET INTRODUCTION
      1. Definition
      2. Scope of the study
    4. Research Objective
      1. Assumption
        1. Limitations
    5. RESEARCH
    6. METHODOLOGY
      1. Overview
      2. Data Mining
      3. Secondary Research
      4. Primary Research
        1. Primary Interviews and Information Gathering
    7. Process
      1. Breakdown of Primary Respondents
      2. Forecasting Model
      3. Market Size Estimation
        1. Bottom-Up Approach
        2. Top-Down
    8. Approach
      1. Data Triangulation
      2. Validation
    9. MARKET
    10. DYNAMICS
      1. Overview
      2. Drivers
      3. Restraints
    11. Opportunities
    12. MARKET FACTOR ANALYSIS
      1. Value chain Analysis
      2. Porter''s Five Forces Analysis
        1. Bargaining Power of Suppliers
        2. Bargaining Power of Buyers
        3. Threat of New Entrants
        4. Threat of Substitutes
        5. Intensity of Rivalry
      3. COVID-19
    13. Impact Analysis
      1. Market Impact Analysis
        1. Regional Impact
        2. Opportunity and Threat Analysis
    14. PELLETIZED ACTIVATED
    15. CARBON MARKET, BY APPLICATION (USD BILLION)
      1. Liquid Phase
      2. Gas
    16. Phase
    17. PELLETIZED ACTIVATED CARBON MARKET, BY SOURCE (USD BILLION)
      1. Coal
      2. Wood
      3. Coconut Shells
    18. PELLETIZED
    19. ACTIVATED CARBON MARKET, BY MANUFACTURING PROCESS (USD BILLION)
      1. Physical
      2. Chemical
    20. PELLETIZED ACTIVATED CARBON MARKET, BY MESH SIZE
    21. (USD BILLION)
      1. 8x30 Mesh
      2. 12x40 Mesh
      3. 4x8 Mesh
    22. PELLETIZED ACTIVATED CARBON MARKET, BY REGIONAL (USD BILLION)
    23. North America
      1. US
        1. Canada
      2. Europe
    24. Germany
      1. UK
        1. France
        2. Russia
    25. Italy
      1. Spain
        1. Rest of Europe
      2. APAC
    26. China
      1. India
        1. Japan
        2. South Korea
    27. Malaysia
      1. Thailand
        1. Indonesia
        2. Rest of APAC
      2. South America
        1. Brazil
        2. Mexico
    28. Argentina
      1. Rest of South America
      2. MEA
        1. GCC
    29. Countries
      1. South Africa
        1. Rest of MEA
    30. COMPETITIVE LANDSCAPE
      1. Overview
      2. Competitive Analysis
      3. Market
    31. share Analysis
      1. Major Growth Strategy in the Pelletized Activated Carbon
    32. Market
      1. Competitive Benchmarking
      2. Leading Players in Terms
    33. of Number of Developments in the Pelletized Activated Carbon Market
    34. Key developments and growth strategies
      1. New Product Launch/Service
    35. Deployment
      1. Merger & Acquisitions
        1. Joint Ventures
      2. Major Players Financial Matrix
        1. Sales and Operating Income
        2. Major Players R&D Expenditure. 2023
    36. COMPANY PROFILES
      1. Purolite Corporation
        1. Financial Overview
    37. Products Offered
      1. Key Developments
        1. SWOT Analysis
        2. Key Strategies
      2. Jacobi Carbons
        1. Financial Overview
        2. Products Offered
        3. Key Developments
        4. SWOT
    38. Analysis
      1. Key Strategies
      2. Cabot Corporation
    39. Financial Overview
      1. Products Offered
        1. Key Developments
        2. SWOT Analysis
        3. Key Strategies
      2. Aquacarboneutral
        1. Financial Overview
        2. Products Offered
        3. Key
    40. Developments
      1. SWOT Analysis
        1. Key Strategies
    41. Kuraray
      1. Financial Overview
        1. Products Offered
    42. Key Developments
      1. SWOT Analysis
        1. Key Strategies
    43. CPL Carbon Link
      1. Financial Overview
        1. Products Offered
        2. Key Developments
        3. SWOT Analysis
        4. Key Strategies
      2. Tedia Company
        1. Financial Overview
        2. Products
    44. Offered
      1. Key Developments
        1. SWOT Analysis
    45. Key Strategies
      1. Calgon Carbon Corporation
        1. Financial Overview
        2. Products Offered
        3. Key Developments
        4. SWOT
    46. Analysis
      1. Key Strategies
      2. Br Carbon
        1. Financial
    47. Overview
      1. Products Offered
        1. Key Developments
    48. SWOT Analysis
      1. Key Strategies
      2. Carbon Activated
    49. Financial Overview
      1. Products Offered
        1. Key Developments
        2. SWOT Analysis
        3. Key Strategies
      2. West Virginia
    50. Activated Carbon Company
      1. Financial Overview
        1. Products
    51. Offered
      1. Key Developments
        1. SWOT Analysis
    52. Key Strategies
      1. Grainger
        1. Financial Overview
    53. Products Offered
      1. Key Developments
        1. SWOT Analysis
        2. Key Strategies
      2. Carbon Resources
        1. Financial
    54. Overview
      1. Products Offered
        1. Key Developments
    55. SWOT Analysis
      1. Key Strategies
      2. Norit Activated Carbon
        1. Financial Overview
        2. Products Offered
    56. Key Developments
      1. SWOT Analysis
        1. Key Strategies
      2. Ingevity Corporation
        1. Financial Overview
        2. Products
    57. Offered
      1. Key Developments
        1. SWOT Analysis
    58. Key Strategies
    59. APPENDIX
      1. References
      2. Related Reports
    60. NORTH AMERICA PELLETIZED ACTIVATED CARBON MARKET SIZE ESTIMATES & FORECAST,
    61. BY APPLICATION, 2019-2034 (USD BILLIONS)
    62. ACTIVATED CARBON MARKET SIZE ESTIMATES & FORECAST, BY SOURCE, 2019-2034 (USD
    63. BILLIONS)
    64. & FORECAST, BY MANUFACTURING PROCESS, 2019-2034 (USD BILLIONS)
    65. NORTH AMERICA PELLETIZED ACTIVATED CARBON MARKET SIZE ESTIMATES & FORECAST,
    66. BY MESH SIZE, 2019-2034 (USD BILLIONS)
    67. CARBON MARKET SIZE ESTIMATES & FORECAST, BY REGIONAL, 2019-2034 (USD BILLIONS)
    68. BY APPLICATION, 2019-2034 (USD BILLIONS)
    69. CARBON MARKET SIZE ESTIMATES & FORECAST, BY SOURCE, 2019-2034 (USD BILLIONS)
    70. BY MANUFACTURING PROCESS, 2019-2034 (USD BILLIONS)
    71. ACTIVATED CARBON MARKET SIZE ESTIMATES & FORECAST, BY MESH SIZE, 2019-2034 (USD
    72. BILLIONS)
    73. FORECAST, BY REGIONAL, 2019-2034 (USD BILLIONS)
    74. ACTIVATED CARBON MARKET SIZE ESTIMATES & FORECAST, BY APPLICATION, 2019-2034
    75. (USD BILLIONS)
    76. & FORECAST, BY SOURCE, 2019-2034 (USD BILLIONS)
    77. ACTIVATED CARBON MARKET SIZE ESTIMATES & FORECAST, BY MANUFACTURING PROCESS,
    78. 2034 (USD BILLIONS)
    79. SIZE ESTIMATES & FORECAST, BY MESH SIZE, 2019-2034 (USD BILLIONS)
    80. CANADA PELLETIZED ACTIVATED CARBON MARKET SIZE ESTIMATES & FORECAST, BY
    81. REGIONAL, 2019-2034 (USD BILLIONS)
    82. MARKET SIZE ESTIMATES & FORECAST, BY APPLICATION, 2019-2034 (USD BILLIONS)
    83. BY SOURCE, 2019-2034 (USD BILLIONS)
    84. CARBON MARKET SIZE ESTIMATES & FORECAST, BY MANUFACTURING PROCESS, 2019-2034
    85. (USD BILLIONS)
    86. & FORECAST, BY MESH SIZE, 2019-2034 (USD BILLIONS)
    87. ACTIVATED CARBON MARKET SIZE ESTIMATES & FORECAST, BY REGIONAL, 2019-2034 (USD
    88. BILLIONS)
    89. & FORECAST, BY APPLICATION, 2019-2034 (USD BILLIONS)
    90. PELLETIZED ACTIVATED CARBON MARKET SIZE ESTIMATES & FORECAST, BY SOURCE, 2019-2034
    91. (USD BILLIONS)
    92. & FORECAST, BY MANUFACTURING PROCESS, 2019-2034 (USD BILLIONS)
    93. GERMANY PELLETIZED ACTIVATED CARBON MARKET SIZE ESTIMATES & FORECAST, BY MESH
    94. SIZE, 2019-2034 (USD BILLIONS)
    95. MARKET SIZE ESTIMATES & FORECAST, BY REGIONAL, 2019-2034 (USD BILLIONS)
    96. BY APPLICATION, 2019-2034 (USD BILLIONS)
    97. CARBON MARKET SIZE ESTIMATES & FORECAST, BY SOURCE, 2019-2034 (USD BILLIONS)
    98. BY MANUFACTURING PROCESS, 2019-2034 (USD BILLIONS)
    99. ACTIVATED CARBON MARKET SIZE ESTIMATES & FORECAST, BY MESH SIZE, 2019-2034 (USD
    100. BILLIONS)
    101. FORECAST, BY REGIONAL, 2019-2034 (USD BILLIONS)
    102. ACTIVATED CARBON MARKET SIZE ESTIMATES & FORECAST, BY APPLICATION, 2019-2034
    103. (USD BILLIONS)
    104. & FORECAST, BY SOURCE, 2019-2034 (USD BILLIONS)
    105. ACTIVATED CARBON MARKET SIZE ESTIMATES & FORECAST, BY MANUFACTURING PROCESS,
    106. 2034 (USD BILLIONS)
    107. SIZE ESTIMATES & FORECAST, BY MESH SIZE, 2019-2034 (USD BILLIONS)
    108. FRANCE PELLETIZED ACTIVATED CARBON MARKET SIZE ESTIMATES & FORECAST, BY
    109. REGIONAL, 2019-2034 (USD BILLIONS)
    110. MARKET SIZE ESTIMATES & FORECAST, BY APPLICATION, 2019-2034 (USD BILLIONS)
    111. BY SOURCE, 2019-2034 (USD BILLIONS)
    112. CARBON MARKET SIZE ESTIMATES & FORECAST, BY MANUFACTURING PROCESS, 2019-2034
    113. (USD BILLIONS)
    114. & FORECAST, BY MESH SIZE, 2019-2034 (USD BILLIONS)
    115. ACTIVATED CARBON MARKET SIZE ESTIMATES & FORECAST, BY REGIONAL, 2019-2034 (USD
    116. BILLIONS)
    117. & FORECAST, BY APPLICATION, 2019-2034 (USD BILLIONS)
    118. ACTIVATED CARBON MARKET SIZE ESTIMATES & FORECAST, BY SOURCE, 2019-2034 (USD
    119. BILLIONS)
    120. & FORECAST, BY MANUFACTURING PROCESS, 2019-2034 (USD BILLIONS)
    121. ITALY PELLETIZED ACTIVATED CARBON MARKET SIZE ESTIMATES & FORECAST, BY MESH
    122. SIZE, 2019-2034 (USD BILLIONS)
    123. MARKET SIZE ESTIMATES & FORECAST, BY REGIONAL, 2019-2034 (USD BILLIONS)
    124. BY APPLICATION, 2019-2034 (USD BILLIONS)
    125. CARBON MARKET SIZE ESTIMATES & FORECAST, BY SOURCE, 2019-2034 (USD BILLIONS)
    126. BY MANUFACTURING PROCESS, 2019-2034 (USD BILLIONS)
    127. ACTIVATED CARBON MARKET SIZE ESTIMATES & FORECAST, BY MESH SIZE, 2019-2034 (USD
    128. BILLIONS)
    129. & FORECAST, BY REGIONAL, 2019-2034 (USD BILLIONS)
    130. PELLETIZED ACTIVATED CARBON MARKET SIZE ESTIMATES & FORECAST, BY APPLICATION,
    131. 2034 (USD BILLIONS)
    132. MARKET SIZE ESTIMATES & FORECAST, BY SOURCE, 2019-2034 (USD BILLIONS)
    133. REST OF EUROPE PELLETIZED ACTIVATED CARBON MARKET SIZE ESTIMATES & FORECAST,
    134. BY MANUFACTURING PROCESS, 2019-2034 (USD BILLIONS)
    135. PELLETIZED ACTIVATED CARBON MARKET SIZE ESTIMATES & FORECAST, BY MESH SIZE,
    136. 2034 (USD BILLIONS)
    137. MARKET SIZE ESTIMATES & FORECAST, BY REGIONAL, 2019-2034 (USD BILLIONS)
    138. BY APPLICATION, 2019-2034 (USD BILLIONS)
    139. CARBON MARKET SIZE ESTIMATES & FORECAST, BY SOURCE, 2019-2034 (USD BILLIONS)
    140. BY MANUFACTURING PROCESS, 2019-2034 (USD BILLIONS)
    141. ACTIVATED CARBON MARKET SIZE ESTIMATES & FORECAST, BY MESH SIZE, 2019-2034 (USD
    142. BILLIONS)
    143. & FORECAST, BY REGIONAL, 2019-2034 (USD BILLIONS)
    144. ACTIVATED CARBON MARKET SIZE ESTIMATES & FORECAST, BY APPLICATION, 2019-2034
    145. (USD BILLIONS)
    146. & FORECAST, BY SOURCE, 2019-2034 (USD BILLIONS)
    147. ACTIVATED CARBON MARKET SIZE ESTIMATES & FORECAST, BY MANUFACTURING PROCESS,
    148. 2034 (USD BILLIONS)
    149. SIZE ESTIMATES & FORECAST, BY MESH SIZE, 2019-2034 (USD BILLIONS)
    150. CHINA PELLETIZED ACTIVATED CARBON MARKET SIZE ESTIMATES & FORECAST, BY REGIONAL,
    151. 2034 (USD BILLIONS)
    152. SIZE ESTIMATES & FORECAST, BY APPLICATION, 2019-2034 (USD BILLIONS)
    153. INDIA PELLETIZED ACTIVATED CARBON MARKET SIZE ESTIMATES & FORECAST, BY SOURCE,
    154. 2034 (USD BILLIONS)
    155. SIZE ESTIMATES & FORECAST, BY MANUFACTURING PROCESS, 2019-2034 (USD BILLIONS)
    156. BY MESH SIZE, 2019-2034 (USD BILLIONS)
    157. CARBON MARKET SIZE ESTIMATES & FORECAST, BY REGIONAL, 2019-2034 (USD BILLIONS)
    158. BY APPLICATION, 2019-2034 (USD BILLIONS)
    159. CARBON MARKET SIZE ESTIMATES & FORECAST, BY SOURCE, 2019-2034 (USD BILLIONS)
    160. BY MANUFACTURING PROCESS, 2019-2034 (USD BILLIONS)
    161. ACTIVATED CARBON MARKET SIZE ESTIMATES & FORECAST, BY MESH SIZE, 2019-2034 (USD
    162. BILLIONS)
    163. & FORECAST, BY REGIONAL, 2019-2034 (USD BILLIONS)
    164. PELLETIZED ACTIVATED CARBON MARKET SIZE ESTIMATES & FORECAST, BY APPLICATION,
    165. 2034 (USD BILLIONS)
    166. MARKET SIZE ESTIMATES & FORECAST, BY SOURCE, 2019-2034 (USD BILLIONS)
    167. SOUTH KOREA PELLETIZED ACTIVATED CARBON MARKET SIZE ESTIMATES & FORECAST,
    168. BY MANUFACTURING PROCESS, 2019-2034 (USD BILLIONS)
    169. ACTIVATED CARBON MARKET SIZE ESTIMATES & FORECAST, BY MESH SIZE, 2019-2034 (USD
    170. BILLIONS)
    171. & FORECAST, BY REGIONAL, 2019-2034 (USD BILLIONS)
    172. ACTIVATED CARBON MARKET SIZE ESTIMATES & FORECAST, BY APPLICATION, 2019-2034
    173. (USD BILLIONS)
    174. ESTIMATES & FORECAST, BY SOURCE, 2019-2034 (USD BILLIONS)
    175. PELLETIZED ACTIVATED CARBON MARKET SIZE ESTIMATES & FORECAST, BY MANUFACTURING
    176. PROCESS, 2019-2034 (USD BILLIONS)
    177. CARBON MARKET SIZE ESTIMATES & FORECAST, BY MESH SIZE, 2019-2034 (USD BILLIONS)
    178. FORECAST, BY REGIONAL, 2019-2034 (USD BILLIONS)
    179. ACTIVATED CARBON MARKET SIZE ESTIMATES & FORECAST, BY APPLICATION, 2019-2034
    180. (USD BILLIONS)
    181. ESTIMATES & FORECAST, BY SOURCE, 2019-2034 (USD BILLIONS)
    182. PELLETIZED ACTIVATED CARBON MARKET SIZE ESTIMATES & FORECAST, BY MANUFACTURING
    183. PROCESS, 2019-2034 (USD BILLIONS)
    184. CARBON MARKET SIZE ESTIMATES & FORECAST, BY MESH SIZE, 2019-2034 (USD BILLIONS)
    185. FORECAST, BY REGIONAL, 2019-2034 (USD BILLIONS)
    186. ACTIVATED CARBON MARKET SIZE ESTIMATES & FORECAST, BY APPLICATION, 2019-2034
    187. (USD BILLIONS)
    188. ESTIMATES & FORECAST, BY SOURCE, 2019-2034 (USD BILLIONS)
    189. PELLETIZED ACTIVATED CARBON MARKET SIZE ESTIMATES & FORECAST, BY MANUFACTURING
    190. PROCESS, 2019-2034 (USD BILLIONS)
    191. CARBON MARKET SIZE ESTIMATES & FORECAST, BY MESH SIZE, 2019-2034 (USD BILLIONS)
    192. FORECAST, BY REGIONAL, 2019-2034 (USD BILLIONS)
    193. ACTIVATED CARBON MARKET SIZE ESTIMATES & FORECAST, BY APPLICATION, 2019-2034
    194. (USD BILLIONS)
    195. ESTIMATES & FORECAST, BY SOURCE, 2019-2034 (USD BILLIONS)
    196. OF APAC PELLETIZED ACTIVATED CARBON MARKET SIZE ESTIMATES & FORECAST, BY MANUFACTURING
    197. PROCESS, 2019-2034 (USD BILLIONS)
    198. CARBON MARKET SIZE ESTIMATES & FORECAST, BY MESH SIZE, 2019-2034 (USD BILLIONS)
    199. & FORECAST, BY REGIONAL, 2019-2034 (USD BILLIONS)
    200. PELLETIZED ACTIVATED CARBON MARKET SIZE ESTIMATES & FORECAST, BY APPLICATION,
    201. 2034 (USD BILLIONS)
    202. MARKET SIZE ESTIMATES & FORECAST, BY SOURCE, 2019-2034 (USD BILLIONS)
    203. SOUTH AMERICA PELLETIZED ACTIVATED CARBON MARKET SIZE ESTIMATES & FORECAST,
    204. BY MANUFACTURING PROCESS, 2019-2034 (USD BILLIONS)
    205. PELLETIZED ACTIVATED CARBON MARKET SIZE ESTIMATES & FORECAST, BY MESH SIZE,
    206. 2034 (USD BILLIONS)
    207. MARKET SIZE ESTIMATES & FORECAST, BY REGIONAL, 2019-2034 (USD BILLIONS)
    208. BY APPLICATION, 2019-2034 (USD BILLIONS)
    209. CARBON MARKET SIZE ESTIMATES & FORECAST, BY SOURCE, 2019-2034 (USD BILLIONS)
    210. FORECAST, BY MANUFACTURING PROCESS, 2019-2034 (USD BILLIONS)
    211. PELLETIZED ACTIVATED CARBON MARKET SIZE ESTIMATES & FORECAST, BY MESH SIZE,
    212. 2034 (USD BILLIONS)
    213. SIZE ESTIMATES & FORECAST, BY REGIONAL, 2019-2034 (USD BILLIONS)
    214. MEXICO PELLETIZED ACTIVATED CARBON MARKET SIZE ESTIMATES & FORECAST, BY
    215. APPLICATION, 2019-2034 (USD BILLIONS)
    216. CARBON MARKET SIZE ESTIMATES & FORECAST, BY SOURCE, 2019-2034 (USD BILLIONS)
    217. FORECAST, BY MANUFACTURING PROCESS, 2019-2034 (USD BILLIONS)
    218. PELLETIZED ACTIVATED CARBON MARKET SIZE ESTIMATES & FORECAST, BY MESH SIZE,
    219. 2034 (USD BILLIONS)
    220. SIZE ESTIMATES & FORECAST, BY REGIONAL, 2019-2034 (USD BILLIONS)
    221. ARGENTINA PELLETIZED ACTIVATED CARBON MARKET SIZE ESTIMATES & FORECAST,
    222. BY APPLICATION, 2019-2034 (USD BILLIONS)
    223. CARBON MARKET SIZE ESTIMATES & FORECAST, BY SOURCE, 2019-2034 (USD BILLIONS)
    224. FORECAST, BY MANUFACTURING PROCESS, 2019-2034 (USD BILLIONS)
    225. PELLETIZED ACTIVATED CARBON MARKET SIZE ESTIMATES & FORECAST, BY MESH SIZE,
    226. 2034 (USD BILLIONS)
    227. MARKET SIZE ESTIMATES & FORECAST, BY REGIONAL, 2019-2034 (USD BILLIONS)
    228. & FORECAST, BY APPLICATION, 2019-2034 (USD BILLIONS)
    229. SOUTH AMERICA PELLETIZED ACTIVATED CARBON MARKET SIZE ESTIMATES & FORECAST,
    230. BY SOURCE, 2019-2034 (USD BILLIONS)
    231. ACTIVATED CARBON MARKET SIZE ESTIMATES & FORECAST, BY MANUFACTURING PROCESS,
    232. 2034 (USD BILLIONS)
    233. CARBON MARKET SIZE ESTIMATES & FORECAST, BY MESH SIZE, 2019-2034 (USD BILLIONS)
    234. & FORECAST, BY REGIONAL, 2019-2034 (USD BILLIONS)
    235. ACTIVATED CARBON MARKET SIZE ESTIMATES & FORECAST, BY APPLICATION, 2019-2034
    236. (USD BILLIONS)
    237. & FORECAST, BY SOURCE, 2019-2034 (USD BILLIONS)
    238. ACTIVATED CARBON MARKET SIZE ESTIMATES & FORECAST, BY MANUFACTURING PROCESS,
    239. 2034 (USD BILLIONS)
    240. SIZE ESTIMATES & FORECAST, BY MESH SIZE, 2019-2034 (USD BILLIONS)
    241. MEA PELLETIZED ACTIVATED CARBON MARKET SIZE ESTIMATES & FORECAST, BY REGIONAL,
    242. 2034 (USD BILLIONS)
    243. MARKET SIZE ESTIMATES & FORECAST, BY APPLICATION, 2019-2034 (USD BILLIONS)
    244. FORECAST, BY SOURCE, 2019-2034 (USD BILLIONS)
    245. ACTIVATED CARBON MARKET SIZE ESTIMATES & FORECAST, BY MANUFACTURING PROCESS,
    246. 2034 (USD BILLIONS)
    247. MARKET SIZE ESTIMATES & FORECAST, BY MESH SIZE, 2019-2034 (USD BILLIONS)
    248. FORECAST, BY REGIONAL, 2019-2034 (USD BILLIONS)
    249. ACTIVATED CARBON MARKET SIZE ESTIMATES & FORECAST, BY APPLICATION, 2019-2034
    250. (USD BILLIONS)
    251. SIZE ESTIMATES & FORECAST, BY SOURCE, 2019-2034 (USD BILLIONS)
    252. SOUTH AFRICA PELLETIZED ACTIVATED CARBON MARKET SIZE ESTIMATES & FORECAST, BY
    253. MANUFACTURING PROCESS, 2019-2034 (USD BILLIONS)
    254. ACTIVATED CARBON MARKET SIZE ESTIMATES & FORECAST, BY MESH SIZE, 2019-2034 (USD
    255. BILLIONS)
    256. ESTIMATES & FORECAST, BY REGIONAL, 2019-2034 (USD BILLIONS)
    257. REST OF MEA PELLETIZED ACTIVATED CARBON MARKET SIZE ESTIMATES & FORECAST, BY
    258. APPLICATION, 2019-2034 (USD BILLIONS)
    259. CARBON MARKET SIZE ESTIMATES & FORECAST, BY SOURCE, 2019-2034 (USD BILLIONS)
    260. FORECAST, BY MANUFACTURING PROCESS, 2019-2034 (USD BILLIONS)
    261. OF MEA PELLETIZED ACTIVATED CARBON MARKET SIZE ESTIMATES & FORECAST, BY MESH
    262. SIZE, 2019-2034 (USD BILLIONS)
    263. CARBON MARKET SIZE ESTIMATES & FORECAST, BY REGIONAL, 2019-2034 (USD BILLIONS)
    264. NORTH AMERICA PELLETIZED ACTIVATED CARBON MARKET ANALYSIS
    265. ACTIVATED CARBON MARKET ANALYSIS BY APPLICATION
    266. CARBON MARKET ANALYSIS BY SOURCE
    267. MARKET ANALYSIS BY MANUFACTURING PROCESS
    268. CARBON MARKET ANALYSIS BY MESH SIZE
    269. MARKET ANALYSIS BY REGIONAL
    270. ANALYSIS BY APPLICATION
    271. ANALYSIS BY SOURCE
    272. BY MANUFACTURING PROCESS
    273. ANALYSIS BY MESH SIZE
    274. ANALYSIS BY REGIONAL
    275. ANALYSIS
    276. APPLICATION
    277. BY SOURCE
    278. MANUFACTURING PROCESS
    279. ANALYSIS BY MESH SIZE
    280. ANALYSIS BY REGIONAL
    281. BY APPLICATION
    282. SOURCE
    283. PROCESS
    284. SIZE
    285. PROCESS
    286. SIZE
    287. PROCESS
    288. SIZE
    289. PROCESS
    290. SIZE
    291. PROCESS
    292. SIZE
    293. PROCESS
    294. BY MESH SIZE
    295. ANALYSIS BY REGIONAL
    296. PROCESS
    297. SIZE
    298. PROCESS
    299. SIZE
    300. PROCESS
    301. SIZE
    302. PROCESS
    303. BY MESH SIZE
    304. BY REGIONAL
    305. BY APPLICATION
    306. BY SOURCE
    307. BY MANUFACTURING PROCESS
    308. ANALYSIS BY MESH SIZE
    309. ANALYSIS BY REGIONAL
    310. ANALYSIS BY APPLICATION
    311. ANALYSIS BY SOURCE
    312. ANALYSIS BY MANUFACTURING PROCESS
    313. CARBON MARKET ANALYSIS BY MESH SIZE
    314. CARBON MARKET ANALYSIS BY REGIONAL
    315. CARBON MARKET ANALYSIS BY APPLICATION
    316. CARBON MARKET ANALYSIS BY SOURCE
    317. CARBON MARKET ANALYSIS BY MANUFACTURING PROCESS
    318. ACTIVATED CARBON MARKET ANALYSIS BY MESH SIZE
    319. ACTIVATED CARBON MARKET ANALYSIS BY REGIONAL
    320. ACTIVATED CARBON MARKET ANALYSIS BY APPLICATION
    321. ACTIVATED CARBON MARKET ANALYSIS BY SOURCE
    322. ACTIVATED CARBON MARKET ANALYSIS BY MANUFACTURING PROCESS
    323. OF APAC PELLETIZED ACTIVATED CARBON MARKET ANALYSIS BY MESH SIZE
    324. REST OF APAC PELLETIZED ACTIVATED CARBON MARKET ANALYSIS BY REGIONAL
    325. SOUTH AMERICA PELLETIZED ACTIVATED CARBON MARKET ANALYSIS
    326. PELLETIZED ACTIVATED CARBON MARKET ANALYSIS BY APPLICATION
    327. PELLETIZED ACTIVATED CARBON MARKET ANALYSIS BY SOURCE
    328. ACTIVATED CARBON MARKET ANALYSIS BY MANUFACTURING PROCESS
    329. PELLETIZED ACTIVATED CARBON MARKET ANALYSIS BY MESH SIZE
    330. PELLETIZED ACTIVATED CARBON MARKET ANALYSIS BY REGIONAL
    331. PELLETIZED ACTIVATED CARBON MARKET ANALYSIS BY APPLICATION
    332. PELLETIZED ACTIVATED CARBON MARKET ANALYSIS BY SOURCE
    333. ACTIVATED CARBON MARKET ANALYSIS BY MANUFACTURING PROCESS
    334. PELLETIZED ACTIVATED CARBON MARKET ANALYSIS BY MESH SIZE
    335. PELLETIZED ACTIVATED CARBON MARKET ANALYSIS BY REGIONAL
    336. PELLETIZED ACTIVATED CARBON MARKET ANALYSIS BY APPLICATION
    337. PELLETIZED ACTIVATED CARBON MARKET ANALYSIS BY SOURCE
    338. PELLETIZED ACTIVATED CARBON MARKET ANALYSIS BY MANUFACTURING PROCESS
    339. ARGENTINA PELLETIZED ACTIVATED CARBON MARKET ANALYSIS BY MESH SIZE
    340. ARGENTINA PELLETIZED ACTIVATED CARBON MARKET ANALYSIS BY REGIONAL
    341. REST OF SOUTH AMERICA PELLETIZED ACTIVATED CARBON MARKET ANALYSIS BY APPLICATION
    342. BY SOURCE
    343. ANALYSIS BY MANUFACTURING PROCESS
    344. ACTIVATED CARBON MARKET ANALYSIS BY MESH SIZE
    345. PELLETIZED ACTIVATED CARBON MARKET ANALYSIS BY REGIONAL
    346. ACTIVATED CARBON MARKET ANALYSIS
    347. CARBON MARKET ANALYSIS BY APPLICATION
    348. ACTIVATED CARBON MARKET ANALYSIS BY SOURCE
    349. ACTIVATED CARBON MARKET ANALYSIS BY MANUFACTURING PROCESS
    350. COUNTRIES PELLETIZED ACTIVATED CARBON MARKET ANALYSIS BY MESH SIZE
    351. GCC COUNTRIES PELLETIZED ACTIVATED CARBON MARKET ANALYSIS BY REGIONAL
    352. SOUTH AFRICA PELLETIZED ACTIVATED CARBON MARKET ANALYSIS BY APPLICATION
    353. PROCESS
    354. BY MESH SIZE
    355. BY REGIONAL
    356. BY APPLICATION
    357. ANALYSIS BY SOURCE
    358. ANALYSIS BY MANUFACTURING PROCESS
    359. CARBON MARKET ANALYSIS BY MESH SIZE
    360. CARBON MARKET ANALYSIS BY REGIONAL
    361. ACTIVATED CARBON MARKET
    362. DRO ANALYSIS OF PELLETIZED ACTIVATED CARBON MARKET
    363. IMPACT ANALYSIS: PELLETIZED ACTIVATED CARBON MARKET
    364. IMPACT ANALYSIS: PELLETIZED ACTIVATED CARBON MARKET
    365. CHAIN: PELLETIZED ACTIVATED CARBON MARKET
    366. CARBON MARKET, BY APPLICATION, 2024 (% SHARE)
    367. CARBON MARKET, BY APPLICATION, 2019 TO 2034 (USD Billions)
    368. ACTIVATED CARBON MARKET, BY SOURCE, 2024 (% SHARE)
    369. ACTIVATED CARBON MARKET, BY SOURCE, 2019 TO 2034 (USD Billions)
    370. PELLETIZED ACTIVATED CARBON MARKET, BY MANUFACTURING PROCESS, 2024 (% SHARE)
    371. TO 2034 (USD Billions)
    372. MESH SIZE, 2024 (% SHARE)
    373. BY MESH SIZE, 2019 TO 2034 (USD Billions)
    374. CARBON MARKET, BY REGIONAL, 2024 (% SHARE)
    375. CARBON MARKET, BY REGIONAL, 2019 TO 2034 (USD Billions)
    376. OF MAJOR COMPETITORS'

    Pelletized Activated Carbon Market Segmentation

    • Pelletized Activated Carbon Market By Application (USD Billion, 2019-2034)

      • Liquid Phase
      • Gas Phase
    • Pelletized Activated Carbon Market By Source (USD Billion, 2019-2034)

      • Coal
      • Wood
      • Coconut Shells
    • Pelletized Activated Carbon Market By Manufacturing Process (USD Billion, 2019-2034)

      • Physical
      • Chemical
    • Pelletized Activated Carbon Market By Mesh Size (USD Billion, 2019-2034)

      • 8x30 Mesh
      • 12x40 Mesh
      • 4x8 Mesh
    • Pelletized Activated Carbon Market By Regional (USD Billion, 2019-2034)

      • North America
      • Europe
      • South America
      • Asia Pacific
      • Middle East and Africa

    Pelletized Activated Carbon Market Regional Outlook (USD Billion, 2019-2034)

    • North America Outlook (USD Billion, 2019-2034)

      • North America Pelletized Activated Carbon Market by Application Type

        • Liquid Phase
        • Gas Phase
      • North America Pelletized Activated Carbon Market by Source Type

        • Coal
        • Wood
        • Coconut Shells
      • North America Pelletized Activated Carbon Market by Manufacturing Process Type

        • Physical
        • Chemical
      • North America Pelletized Activated Carbon Market by Mesh Size Type

        • 8x30 Mesh
        • 12x40 Mesh
        • 4x8 Mesh
      • North America Pelletized Activated Carbon Market by Regional Type

        • US
        • Canada
      • US Outlook (USD Billion, 2019-2034)
      • US Pelletized Activated Carbon Market by Application Type

        • Liquid Phase
        • Gas Phase
      • US Pelletized Activated Carbon Market by Source Type

        • Coal
        • Wood
        • Coconut Shells
      • US Pelletized Activated Carbon Market by Manufacturing Process Type

        • Physical
        • Chemical
      • US Pelletized Activated Carbon Market by Mesh Size Type

        • 8x30 Mesh
        • 12x40 Mesh
        • 4x8 Mesh
      • CANADA Outlook (USD Billion, 2019-2034)
      • CANADA Pelletized Activated Carbon Market by Application Type

        • Liquid Phase
        • Gas Phase
      • CANADA Pelletized Activated Carbon Market by Source Type

        • Coal
        • Wood
        • Coconut Shells
      • CANADA Pelletized Activated Carbon Market by Manufacturing Process Type

        • Physical
        • Chemical
      • CANADA Pelletized Activated Carbon Market by Mesh Size Type

        • 8x30 Mesh
        • 12x40 Mesh
        • 4x8 Mesh
    • Europe Outlook (USD Billion, 2019-2034)

      • Europe Pelletized Activated Carbon Market by Application Type

        • Liquid Phase
        • Gas Phase
      • Europe Pelletized Activated Carbon Market by Source Type

        • Coal
        • Wood
        • Coconut Shells
      • Europe Pelletized Activated Carbon Market by Manufacturing Process Type

        • Physical
        • Chemical
      • Europe Pelletized Activated Carbon Market by Mesh Size Type

        • 8x30 Mesh
        • 12x40 Mesh
        • 4x8 Mesh
      • Europe Pelletized Activated Carbon Market by Regional Type

        • Germany
        • UK
        • France
        • Russia
        • Italy
        • Spain
        • Rest of Europe
      • GERMANY Outlook (USD Billion, 2019-2034)
      • GERMANY Pelletized Activated Carbon Market by Application Type

        • Liquid Phase
        • Gas Phase
      • GERMANY Pelletized Activated Carbon Market by Source Type

        • Coal
        • Wood
        • Coconut Shells
      • GERMANY Pelletized Activated Carbon Market by Manufacturing Process Type

        • Physical
        • Chemical
      • GERMANY Pelletized Activated Carbon Market by Mesh Size Type

        • 8x30 Mesh
        • 12x40 Mesh
        • 4x8 Mesh
      • UK Outlook (USD Billion, 2019-2034)
      • UK Pelletized Activated Carbon Market by Application Type

        • Liquid Phase
        • Gas Phase
      • UK Pelletized Activated Carbon Market by Source Type

        • Coal
        • Wood
        • Coconut Shells
      • UK Pelletized Activated Carbon Market by Manufacturing Process Type

        • Physical
        • Chemical
      • UK Pelletized Activated Carbon Market by Mesh Size Type

        • 8x30 Mesh
        • 12x40 Mesh
        • 4x8 Mesh
      • FRANCE Outlook (USD Billion, 2019-2034)
      • FRANCE Pelletized Activated Carbon Market by Application Type

        • Liquid Phase
        • Gas Phase
      • FRANCE Pelletized Activated Carbon Market by Source Type

        • Coal
        • Wood
        • Coconut Shells
      • FRANCE Pelletized Activated Carbon Market by Manufacturing Process Type

        • Physical
        • Chemical
      • FRANCE Pelletized Activated Carbon Market by Mesh Size Type

        • 8x30 Mesh
        • 12x40 Mesh
        • 4x8 Mesh
      • RUSSIA Outlook (USD Billion, 2019-2034)
      • RUSSIA Pelletized Activated Carbon Market by Application Type

        • Liquid Phase
        • Gas Phase
      • RUSSIA Pelletized Activated Carbon Market by Source Type

        • Coal
        • Wood
        • Coconut Shells
      • RUSSIA Pelletized Activated Carbon Market by Manufacturing Process Type

        • Physical
        • Chemical
      • RUSSIA Pelletized Activated Carbon Market by Mesh Size Type

        • 8x30 Mesh
        • 12x40 Mesh
        • 4x8 Mesh
      • ITALY Outlook (USD Billion, 2019-2034)
      • ITALY Pelletized Activated Carbon Market by Application Type

        • Liquid Phase
        • Gas Phase
      • ITALY Pelletized Activated Carbon Market by Source Type

        • Coal
        • Wood
        • Coconut Shells
      • ITALY Pelletized Activated Carbon Market by Manufacturing Process Type

        • Physical
        • Chemical
      • ITALY Pelletized Activated Carbon Market by Mesh Size Type

        • 8x30 Mesh
        • 12x40 Mesh
        • 4x8 Mesh
      • SPAIN Outlook (USD Billion, 2019-2034)
      • SPAIN Pelletized Activated Carbon Market by Application Type

        • Liquid Phase
        • Gas Phase
      • SPAIN Pelletized Activated Carbon Market by Source Type

        • Coal
        • Wood
        • Coconut Shells
      • SPAIN Pelletized Activated Carbon Market by Manufacturing Process Type

        • Physical
        • Chemical
      • SPAIN Pelletized Activated Carbon Market by Mesh Size Type

        • 8x30 Mesh
        • 12x40 Mesh
        • 4x8 Mesh
      • REST OF EUROPE Outlook (USD Billion, 2019-2034)
      • REST OF EUROPE Pelletized Activated Carbon Market by Application Type

        • Liquid Phase
        • Gas Phase
      • REST OF EUROPE Pelletized Activated Carbon Market by Source Type

        • Coal
        • Wood
        • Coconut Shells
      • REST OF EUROPE Pelletized Activated Carbon Market by Manufacturing Process Type

        • Physical
        • Chemical
      • REST OF EUROPE Pelletized Activated Carbon Market by Mesh Size Type

        • 8x30 Mesh
        • 12x40 Mesh
        • 4x8 Mesh
    • APAC Outlook (USD Billion, 2019-2034)

      • APAC Pelletized Activated Carbon Market by Application Type

        • Liquid Phase
        • Gas Phase
      • APAC Pelletized Activated Carbon Market by Source Type

        • Coal
        • Wood
        • Coconut Shells
      • APAC Pelletized Activated Carbon Market by Manufacturing Process Type

        • Physical
        • Chemical
      • APAC Pelletized Activated Carbon Market by Mesh Size Type

        • 8x30 Mesh
        • 12x40 Mesh
        • 4x8 Mesh
      • APAC Pelletized Activated Carbon Market by Regional Type

        • China
        • India
        • Japan
        • South Korea
        • Malaysia
        • Thailand
        • Indonesia
        • Rest of APAC
      • CHINA Outlook (USD Billion, 2019-2034)
      • CHINA Pelletized Activated Carbon Market by Application Type

        • Liquid Phase
        • Gas Phase
      • CHINA Pelletized Activated Carbon Market by Source Type

        • Coal
        • Wood
        • Coconut Shells
      • CHINA Pelletized Activated Carbon Market by Manufacturing Process Type

        • Physical
        • Chemical
      • CHINA Pelletized Activated Carbon Market by Mesh Size Type

        • 8x30 Mesh
        • 12x40 Mesh
        • 4x8 Mesh
      • INDIA Outlook (USD Billion, 2019-2034)
      • INDIA Pelletized Activated Carbon Market by Application Type

        • Liquid Phase
        • Gas Phase
      • INDIA Pelletized Activated Carbon Market by Source Type

        • Coal
        • Wood
        • Coconut Shells
      • INDIA Pelletized Activated Carbon Market by Manufacturing Process Type

        • Physical
        • Chemical
      • INDIA Pelletized Activated Carbon Market by Mesh Size Type

        • 8x30 Mesh
        • 12x40 Mesh
        • 4x8 Mesh
      • JAPAN Outlook (USD Billion, 2019-2034)
      • JAPAN Pelletized Activated Carbon Market by Application Type

        • Liquid Phase
        • Gas Phase
      • JAPAN Pelletized Activated Carbon Market by Source Type

        • Coal
        • Wood
        • Coconut Shells
      • JAPAN Pelletized Activated Carbon Market by Manufacturing Process Type

        • Physical
        • Chemical
      • JAPAN Pelletized Activated Carbon Market by Mesh Size Type

        • 8x30 Mesh
        • 12x40 Mesh
        • 4x8 Mesh
      • SOUTH KOREA Outlook (USD Billion, 2019-2034)
      • SOUTH KOREA Pelletized Activated Carbon Market by Application Type

        • Liquid Phase
        • Gas Phase
      • SOUTH KOREA Pelletized Activated Carbon Market by Source Type

        • Coal
        • Wood
        • Coconut Shells
      • SOUTH KOREA Pelletized Activated Carbon Market by Manufacturing Process Type

        • Physical
        • Chemical
      • SOUTH KOREA Pelletized Activated Carbon Market by Mesh Size Type

        • 8x30 Mesh
        • 12x40 Mesh
        • 4x8 Mesh
      • MALAYSIA Outlook (USD Billion, 2019-2034)
      • MALAYSIA Pelletized Activated Carbon Market by Application Type

        • Liquid Phase
        • Gas Phase
      • MALAYSIA Pelletized Activated Carbon Market by Source Type

        • Coal
        • Wood
        • Coconut Shells
      • MALAYSIA Pelletized Activated Carbon Market by Manufacturing Process Type

        • Physical
        • Chemical
      • MALAYSIA Pelletized Activated Carbon Market by Mesh Size Type

        • 8x30 Mesh
        • 12x40 Mesh
        • 4x8 Mesh
      • THAILAND Outlook (USD Billion, 2019-2034)
      • THAILAND Pelletized Activated Carbon Market by Application Type

        • Liquid Phase
        • Gas Phase
      • THAILAND Pelletized Activated Carbon Market by Source Type

        • Coal
        • Wood
        • Coconut Shells
      • THAILAND Pelletized Activated Carbon Market by Manufacturing Process Type

        • Physical
        • Chemical
      • THAILAND Pelletized Activated Carbon Market by Mesh Size Type

        • 8x30 Mesh
        • 12x40 Mesh
        • 4x8 Mesh
      • INDONESIA Outlook (USD Billion, 2019-2034)
      • INDONESIA Pelletized Activated Carbon Market by Application Type

        • Liquid Phase
        • Gas Phase
      • INDONESIA Pelletized Activated Carbon Market by Source Type

        • Coal
        • Wood
        • Coconut Shells
      • INDONESIA Pelletized Activated Carbon Market by Manufacturing Process Type

        • Physical
        • Chemical
      • INDONESIA Pelletized Activated Carbon Market by Mesh Size Type

        • 8x30 Mesh
        • 12x40 Mesh
        • 4x8 Mesh
      • REST OF APAC Outlook (USD Billion, 2019-2034)
      • REST OF APAC Pelletized Activated Carbon Market by Application Type

        • Liquid Phase
        • Gas Phase
      • REST OF APAC Pelletized Activated Carbon Market by Source Type

        • Coal
        • Wood
        • Coconut Shells
      • REST OF APAC Pelletized Activated Carbon Market by Manufacturing Process Type

        • Physical
        • Chemical
      • REST OF APAC Pelletized Activated Carbon Market by Mesh Size Type

        • 8x30 Mesh
        • 12x40 Mesh
        • 4x8 Mesh
    • South America Outlook (USD Billion, 2019-2034)

      • South America Pelletized Activated Carbon Market by Application Type

        • Liquid Phase
        • Gas Phase
      • South America Pelletized Activated Carbon Market by Source Type

        • Coal
        • Wood
        • Coconut Shells
      • South America Pelletized Activated Carbon Market by Manufacturing Process Type

        • Physical
        • Chemical
      • South America Pelletized Activated Carbon Market by Mesh Size Type

        • 8x30 Mesh
        • 12x40 Mesh
        • 4x8 Mesh
      • South America Pelletized Activated Carbon Market by Regional Type

        • Brazil
        • Mexico
        • Argentina
        • Rest of South America
      • BRAZIL Outlook (USD Billion, 2019-2034)
      • BRAZIL Pelletized Activated Carbon Market by Application Type

        • Liquid Phase
        • Gas Phase
      • BRAZIL Pelletized Activated Carbon Market by Source Type

        • Coal
        • Wood
        • Coconut Shells
      • BRAZIL Pelletized Activated Carbon Market by Manufacturing Process Type

        • Physical
        • Chemical
      • BRAZIL Pelletized Activated Carbon Market by Mesh Size Type

        • 8x30 Mesh
        • 12x40 Mesh
        • 4x8 Mesh
      • MEXICO Outlook (USD Billion, 2019-2034)
      • MEXICO Pelletized Activated Carbon Market by Application Type

        • Liquid Phase
        • Gas Phase
      • MEXICO Pelletized Activated Carbon Market by Source Type

        • Coal
        • Wood
        • Coconut Shells
      • MEXICO Pelletized Activated Carbon Market by Manufacturing Process Type

        • Physical
        • Chemical
      • MEXICO Pelletized Activated Carbon Market by Mesh Size Type

        • 8x30 Mesh
        • 12x40 Mesh
        • 4x8 Mesh
      • ARGENTINA Outlook (USD Billion, 2019-2034)
      • ARGENTINA Pelletized Activated Carbon Market by Application Type

        • Liquid Phase
        • Gas Phase
      • ARGENTINA Pelletized Activated Carbon Market by Source Type

        • Coal
        • Wood
        • Coconut Shells
      • ARGENTINA Pelletized Activated Carbon Market by Manufacturing Process Type

        • Physical
        • Chemical
      • ARGENTINA Pelletized Activated Carbon Market by Mesh Size Type

        • 8x30 Mesh
        • 12x40 Mesh
        • 4x8 Mesh
      • REST OF SOUTH AMERICA Outlook (USD Billion, 2019-2034)
      • REST OF SOUTH AMERICA Pelletized Activated Carbon Market by Application Type

        • Liquid Phase
        • Gas Phase
      • REST OF SOUTH AMERICA Pelletized Activated Carbon Market by Source Type

        • Coal
        • Wood
        • Coconut Shells
      • REST OF SOUTH AMERICA Pelletized Activated Carbon Market by Manufacturing Process Type

        • Physical
        • Chemical
      • REST OF SOUTH AMERICA Pelletized Activated Carbon Market by Mesh Size Type

        • 8x30 Mesh
        • 12x40 Mesh
        • 4x8 Mesh
    • MEA Outlook (USD Billion, 2019-2034)

      • MEA Pelletized Activated Carbon Market by Application Type

        • Liquid Phase
        • Gas Phase
      • MEA Pelletized Activated Carbon Market by Source Type

        • Coal
        • Wood
        • Coconut Shells
      • MEA Pelletized Activated Carbon Market by Manufacturing Process Type

        • Physical
        • Chemical
      • MEA Pelletized Activated Carbon Market by Mesh Size Type

        • 8x30 Mesh
        • 12x40 Mesh
        • 4x8 Mesh
      • MEA Pelletized Activated Carbon Market by Regional Type

        • GCC Countries
        • South Africa
        • Rest of MEA
      • GCC COUNTRIES Outlook (USD Billion, 2019-2034)
      • GCC COUNTRIES Pelletized Activated Carbon Market by Application Type

        • Liquid Phase
        • Gas Phase
      • GCC COUNTRIES Pelletized Activated Carbon Market by Source Type

        • Coal
        • Wood
        • Coconut Shells
      • GCC COUNTRIES Pelletized Activated Carbon Market by Manufacturing Process Type

        • Physical
        • Chemical
      • GCC COUNTRIES Pelletized Activated Carbon Market by Mesh Size Type

        • 8x30 Mesh
        • 12x40 Mesh
        • 4x8 Mesh
      • SOUTH AFRICA Outlook (USD Billion, 2019-2034)
      • SOUTH AFRICA Pelletized Activated Carbon Market by Application Type

        • Liquid Phase
        • Gas Phase
      • SOUTH AFRICA Pelletized Activated Carbon Market by Source Type

        • Coal
        • Wood
        • Coconut Shells
      • SOUTH AFRICA Pelletized Activated Carbon Market by Manufacturing Process Type

        • Physical
        • Chemical
      • SOUTH AFRICA Pelletized Activated Carbon Market by Mesh Size Type

        • 8x30 Mesh
        • 12x40 Mesh
        • 4x8 Mesh
      • REST OF MEA Outlook (USD Billion, 2019-2034)
      • REST OF MEA Pelletized Activated Carbon Market by Application Type

        • Liquid Phase
        • Gas Phase
      • REST OF MEA Pelletized Activated Carbon Market by Source Type

        • Coal
        • Wood
        • Coconut Shells
      • REST OF MEA Pelletized Activated Carbon Market by Manufacturing Process Type

        • Physical
        • Chemical
      • REST OF MEA Pelletized Activated Carbon Market by Mesh Size Type

        • 8x30 Mesh
        • 12x40 Mesh
        • 4x8 Mesh
    Report Infographic
    Free Sample Request

    Kindly complete the form below to receive a free sample of this Report

    Customer Strories

    “I am very pleased with how market segments have been defined in a relevant way for my purposes (such as "Portable Freezers & refrigerators" and "last-mile"). In general the report is well structured. Thanks very much for your efforts.”

    Victoria Milne Founder
    Case Study

    Chemicals and Materials