• Cat-intel
  • MedIntelliX
  • Resources
  • About Us
  • Request Free Sample ×

    Kindly complete the form below to receive a free sample of this Report

    Leading companies partner with us for data-driven Insights

    clients tt-cursor

    Non Lethal Weapons Market

    ID: MRFR/A&D/0845-CR
    103 Pages
    Sejal Akre
    October 2016

    Non-Lethal Weapons Market Report by Type (Direct Contact Weapons and Directed Energy Weapons), by Disabling Mechanism (Impact, Irritant Chemicals and Intense Sound/Light), by End-User (Law Enforcement and Military) and by Region Forecast to 2032

    Share:
    Download PDF ×

    We do not share your information with anyone. However, we may send you emails based on your report interest from time to time. You may contact us at any time to opt-out.

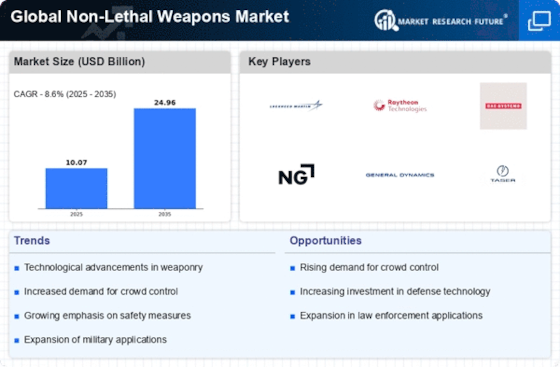
    Non-Lethal Weapons Market Report Information – Forecast to 2032 Infographic
    Purchase Options
    $ 4,950.0
    $ 5,950.0
    $ 7,250.0
    Table of Contents

    Non Lethal Weapons Market Summary

    As per Market Research Future Analysis, the Global Non-Lethal Weapons Market was valued at USD 8.54 billion in 2023 and is projected to reach USD 17.94 billion by 2032, growing at a CAGR of 8.6% from 2024 to 2032. The market is driven by increasing political disputes and civil unrest, leading to higher demand for non-lethal weapons for crowd control and law enforcement. However, stringent environmental regulations may pose challenges to market expansion. Recent developments include the acquisition of non-lethal weapons by law enforcement agencies in response to civil protests, highlighting the growing militarization of police forces. The North American region is expected to dominate the market, driven by significant investments from the U.S. Department of Defense in less-lethal technologies.

    Key Market Trends & Highlights

    The non-lethal weapons market is witnessing significant growth driven by various factors.

    • Market Size in 2023: USD 8.54 billion; Projected Market Size by 2032: USD 17.94 billion.
    • CAGR during 2024-2032: 8.6%; indicating robust growth potential.
    • North America is expected to hold the largest market share, primarily due to U.S. defense investments.
    • Emerging economies are increasing defense expenditures, enhancing market competition.

    Market Size & Forecast

    2023 Market Size USD 8.54 billion
    2032 Market Size USD 17.94 billion
    CAGR 8.6%

    Major Players

    Amtec Less-Lethal Systems, Inc.; United Tactical Systems, LLC; Lamperd Less Lethal Inc.; Armament Systems & Procedures Inc.; Nonlethal Technologies, Inc.; Axon Enterprise, Inc.; Mission Less Lethal Technologies; Combined Systems, Inc.; FN Herstal, S.A.; Condor Non-Lethal Technologies.

    Non Lethal Weapons Market Trends

    The increasing emphasis on public safety and the need for effective crowd control measures are driving advancements in non-lethal weapon technologies, which are becoming essential tools for law enforcement agencies worldwide.

    U.S. Department of Defense

    Non Lethal Weapons Market Drivers

    Increasing Demand for Public Safety Solutions

    The Global Global Non-Lethal Weapons Market Industry experiences a notable surge in demand for public safety solutions. Governments and law enforcement agencies are increasingly adopting non-lethal weapons to manage civil unrest and maintain order without resorting to lethal force. This trend is particularly evident in urban areas where protests and demonstrations are common. The market is projected to reach 9.25 USD Billion in 2024, reflecting a growing recognition of the need for effective crowd control measures. As public safety concerns escalate, the adoption of non-lethal weapons is likely to expand, contributing to the overall growth of the Global Global Non-Lethal Weapons Market Industry.

    Market Segment Insights

    Regional Insights

    Key Companies in the Non Lethal Weapons Market market include

    Industry Developments

    The rising investments in the market segments are helping in improving the quality of the segment products and further, enhancing their ability to meet the rising needs of the  target audience especially during the forecast period that will be ending in 2028. In 2017, The law enforcement segment had been accounted to emerge and grow as the largest market share as these organizations are mostly ordered for processes like restraining, subduing, or incapacitating the threat that is associated rather than neutralizing the same.

    The APAC region, as a part of the  non-lethal weapons market share, of expected to exhibit the highest degree of growth rate in the non-lethal weapons market operations during the historic forecast period that had ended in 2019. The  market is likely to carry similar trends and hence, the APAC region is likely to register a prominent market growth. The Asian-Pacific market is expected to grow at the highest CAGR because of the measures that have been taken by several Asia-Pacific countries such as India, China, Australia, South Korea, and others benefitting the market size during the period.

    The directed energy weapons  market segment is likely to be growing at a higher market CAGR in comparison with the direct contact weapons due to rising advancements and developments in laser technologies followed by microwave-based weapons, such as active denial systems or ‘pain ray’ weapons. This will help propel the market size during the ongoing forecast period of 2021-2028.

    Intended Audience

    Non-Lethal Weapon producers, dealers, and manufacturers Component demand groups, sellers, and providers Ammunitions producers and manufacturers Defense companies and organizations Research firms and institutions Regulatory companies and bodies

    Future Outlook

    Non Lethal Weapons Market Future Outlook

    The Global Non-Lethal Weapons Market is projected to grow at an 8.62% CAGR from 2024 to 2035, driven by technological advancements, increasing security concerns, and demand for crowd control solutions.

    New opportunities lie in:

    • Develop smart non-lethal weapon systems integrating AI for enhanced decision-making.
    • Expand product lines to include eco-friendly non-lethal options targeting environmental sustainability.
    • Forge partnerships with law enforcement agencies to tailor solutions for specific operational needs.

    By 2035, the market is expected to be robust, reflecting significant advancements and heightened demand.

    Market Segmentation

    Report Scope

    Attribute/Metric Details
    Market Size 2022 USD 8.54 billion
    Market Size 2032 USD 17.94 billion
    Compound Annual Growth Rate (CAGR) 8.6% (2022-2032)
    Base Year 2020
    Forecast Period 2022-2032
    Historical Data 2020
    Forecast Units Value (USD Billion)
    Report Coverage Revenue Forecast, Competitive Landscape, Growth Factors, and Trends
    Segments Covered Type, Disabling Mechanism, End-User, and Region
    Geographies Covered North America, Europe, Asia Pacific, and the Rest of the World
    Countries Covered The U.S, Canada, Mexico, Germany, France, the UK, Italy, Spain, China, Japan, India, Australia and New Zealand, South America, the Middle East, and Africa
    Key Companies Profiled Ingredion Incorporated (US), ADM (US), Cargill, Incorporated (US), Roquette Frères (France), DuPont (Denmark), International Flavors & Fragrances Inc. (US), GLG LIFE TECH CORP (Canada), Tate & Lyle (UK), Kerry Group (Ireland), and Südzucker AG (Germany)
    Key Market Opportunities Controlling illegal protests against the governments and their orders to maintain law and order
    Key Market Dynamics Militarization of law enforcement agencies

    Market Highlights

    Author
    Sejal Akre
    Senior Research Analyst

    She has over 5 years of rich experience, in market research and consulting providing valuable market insights to client. Hands on expertise in management consulting, and extensive knowledge in domain including ICT, Automotive & Transportation and Aerospace & Defense. She is skilled in Go-to market strategy, industry analysis, market sizing, in depth company profiling, competitive intelligence & benchmarking and value chain amongst others.

    Leave a Comment

    FAQs

    Why is North America expected to acquire the largest market share of the global non-lethal weapons industry?

    The US is estimated to be the largest market for non-lethal weapons. Besides, the US has the highest ratio of civil ownership of guns, which can aid in the regional market expansion.

    What are the significant factors driving the global non-lethal weapons industry?

    Militarization of police forces, growing unrest in various countries, and increasing border tension are anticipated to underpin the market expansion during the review period.

    What is the anticipated market value of the global market for non-lethal weapons?

    The global non-lethal weapons market is anticipated to acquire significant market value during the review period.

    What is the expected CAGR of the global non-lethal weapons market?

    The global non-lethal weapons market is expected to expand at a notable CAGR during the forecast period.

    Who are eminent players of the global non-lethal weapons industry?

    Amtec Less-Lethal Systems, Inc. (the US), Lamperd Less Lethal Inc. (Canada), Nonlethal Technologies, Inc. (the US), and Axon Enterprise, Inc. (US) are some of the eminent players in the global non-lethal weapons market.

    1. '1 Executive Summary
    2. Scope Of The
    3. Report
    4. Market Definition
      1. Scope Of The Study
        1. Definition
        2. Research Objective
        3. List Of Assumptions
        4. Limitations
    5. Research Methodology
      1. Research Process
      2. Primary Research
      3. Secondary
    6. Research
    7. Market Size Estimation
      1. Forecast Model
    8. Market Landscape
      1. Porter’s Five Forces Analysis
        1. Threat Of
    9. New Entrants
    10. Bargaining Power Of Buyers
      1. Threat Of Substitutes
        1. Segment Rivalry
        2. Bargaining Power Of Supplies
      2. Value Chain/Supply
    11. Chain Analysis
    12. Market Dynamics
    13. Introduction
    14. Market Drivers
    15. Market Restraints
      1. Market Opportunities
      2. Market Trends
      3. Patent Trends
      4. Regulatory Landscape
    16. Global Non-Lethal Weapons Market,
    17. By Type
    18. Introduction
    19. Direct Contact Non-Lethal Weapons
      1. Market Estimates & Forecast, 2022–2032
        1. Market Estimates
    20. & Forecast, By Region, 2022–2032
      1. Directed Energy Non-Lethal Weapons
        1. Market Estimates
    21. & Forecast, 2022–2032
      1. Market Estimates & Forecast, By Region, 2022–2032
    22. Global Non-Lethal
    23. Weapons Market, By Disabling Mechanism
      1. Introduction
      2. Impact
        1. Market Estimates & Forecast, 2022–2032
        2. Market Estimates
    24. & Forecast, By Region, 2022–2032
      1. Irritant Chemicals
        1. Market Estimates & Forecast, 2022–2032
        2. Market Estimates
    25. & Forecast, By Region, 2022–2032
      1. Intense Sound/Light
        1. Market Estimates &
    26. Forecast, 2022–2032
      1. Market Estimates & Forecast, By Region, 2022–2032
    27. Global Non-Lethal
    28. Weapons Market, By End-User
      1. Introduction
      2. Law Enforcement
        1. Market Estimates & Forecast, 2022–2032
        2. Market Estimates
    29. & Forecast, By Region, 2022–2032
      1. Military
        1. Market Estimates & Forecast, 2022–2032
        2. Market Estimates
    30. & Forecast, By Region, 2022–2032
    31. Global Non-Lethal Weapons Market, By Region
      1. Introduction
      2. North America
        1. Market Estimates
    32. & Forecast, By Country, 2022–2032
      1. Market Estimates & Forecast, By Type,
    33. Market Estimates & Forecast, By Disabling Mechanism, 2022–2032
      1. Market Estimates
    34. & Forecast, By End-User, 2022–2032
      1. US
        1. Market Estimates & Forecast, By Type,
    35. Market Estimates & Forecast, By Disabling Mechanism, 2022–2032
      1. Market
    36. Estimates & Forecast, By End-User, 2022–2032
      1. Canada
        1. Market Estimates & Forecast, By Type,
    37. Market Estimates & Forecast, By Disabling Mechanism, 2022–2032
      1. Market
    38. Estimates & Forecast, By End-User, 2022–2032
      1. Europe
        1. Market Estimates & Forecast, By Country,
    39. Market Estimates & Forecast, By Type, 2022–2032
      1. Market Estimates &
    40. Forecast, By Disabling Mechanism, 2022–2032
      1. Market Estimates & Forecast, By End-User,
    41. UK
    42. Market Estimates & Forecast, By Type, 2022–2032
      1. Market Estimates &
    43. Forecast, By Disabling Mechanism, 2022–2032
      1. Market Estimates & Forecast, By End-User,
    44. Germany
    45. Market Estimates & Forecast, By Type, 2022–2032
      1. Market Estimates &
    46. Forecast, By Disabling Mechanism, 2022–2032
      1. Market Estimates & Forecast, By End-User,
    47. France
    48. Market Estimates & Forecast, By Type, 2022–2032
      1. Market Estimates &
    49. Forecast, By Disabling Mechanism, 2022–2032
      1. Market Estimates & Forecast, By End-User,
    50. Russia
    51. Market Estimates & Forecast, By Type, 2022–2032
      1. Market Estimates &
    52. Forecast, By Disabling Mechanism, 2022–2032
      1. Market Estimates & Forecast, By End-User,
    53. Rest Of Europe
    54. Market Estimates & Forecast, By Type, 2022–2032
      1. Market Estimates &
    55. Forecast, By Disabling Mechanism, 2022–2032
      1. Market Estimates & Forecast, By End-User,
    56. Asia-Pacific
    57. Market Estimates & Forecast, By Country, 2022–2032
      1. Market Estimates &
    58. Forecast, By Type, 2022–2032
      1. Market Estimates & Forecast, By Disabling Mechanism,
    59. Market Estimates & Forecast, By End-User, 2022–2032
      1. China
        1. Market Estimates
    60. & Forecast, By Type, 2022–2032
      1. Market Estimates & Forecast, By Disabling
    61. Mechanism, 2022–2032
      1. Market Estimates & Forecast, By End-User, 2022–2032
        1. Japan
    62. Estimates & Forecast, By Type, 2022–2032
      1. Market Estimates & Forecast, By Disabling
    63. Mechanism, 2022–2032
      1. Market Estimates & Forecast, By End-User, 2022–2032
        1. India
    64. Estimates & Forecast, By Type, 2022–2032
      1. Market Estimates & Forecast, By Disabling
    65. Mechanism, 2022–2032
      1. Market Estimates & Forecast, By End-User, 2022–2032
        1. Rest Of
    66. Asia-Pacific
    67. Market Estimates & Forecast, By Type, 2022–2032
      1. Market Estimates &
    68. Forecast, By Disabling Mechanism, 2022–2032
      1. Market Estimates & Forecast, By End-User,
    69. Market Estimates & Forecast, By Disabling Mechanism, 2022–2032
      1. Rest Of The
    70. World
    71. Market Estimates & Forecast, By Region, 2022–2032
      1. Market Estimates &
    72. Forecast, By Type, 2022–2032
      1. Market Estimates & Forecast, By Disabling Mechanism,
    73. Market Estimates & Forecast, By End-User, 2022–2032
      1. Middle East & Africa
        1. Market
    74. Estimates & Forecast, By Type, 2022–2032
      1. Market Estimates & Forecast, By Disabling
    75. Mechanism, 2022–2032
      1. Market Estimates & Forecast, By End-User, 2022–2032
        1. Latin America
    76. Estimates & Forecast, By Type, 2022–2032
      1. Market Estimates & Forecast, By Disabling
    77. Mechanism, 2022–2032
      1. Market Estimates & Forecast, By End-User, 2022–2032
    78. Competitive Landscape
    79. Competitive Scenario
      1. Competitive Overview
      2. Competitive Benchmarking
      3. Market Share Analysis
    80. Company Profiles
      1. Amtec Less-Lethal
    81. Systems, Inc.
    82. Company Overview
    83. Product Offering
    84. Financial Overview
      1. Key Developments
        1. Swot Analysis
        2. Strategy
      2. Armament Systems & Procedures Inc.
        1. Company
    85. Overview
    86. Product Offering
    87. Financial Overview
      1. Key Developments
        1. Swot Analysis
        2. Strategy
      2. Axon Enterprise, Inc.
        1. Company Overview
        2. Product
    88. Offering
    89. Financial Overview
      1. Key Developments
        1. Swot Analysis
        2. Strategy
      2. Combined Systems, Inc.
        1. Company Overview
        2. Product
    90. Offering
    91. Financial Overview
      1. Key Developments
        1. Swot Analysis
        2. Strategy
      2. Condor Non-Lethal Technologies
        1. Company Overview
        2. Product
    92. Offering
    93. Financial Overview
      1. Key Developments
        1. Swot Analysis
        2. Strategy
      2. FN Herstal, S.A.
        1. Company Overview
        2. Product Offering
        3. Financial
    94. Overview
    95. Key Developments
    96. Swot Analysis
    97. Strategy
    98. Lamperd Less Lethal Inc.
      1. Company Overview
        1. Product Offering
        2. Financial Overview
        3. Key Developments
        4. Swot Analysis
        5. Strategy
      2. Mission Less
    99. Lethal Technologies
      1. Company Overview
        1. Product Offering
        2. Financial Overview
        3. Key Developments
        4. Swot Analysis
        5. Strategy
      2. Nonlethal
    100. Technologies, Inc.
      1. Company Overview
        1. Product Offering
        2. Financial Overview
        3. Key Developments
        4. Swot Analysis
        5. Strategy
      2. United Tactical
    101. Systems, LLC
    102. Company Overview
    103. Product Offering
    104. Financial Overview
      1. Key Developments
        1. Swot Analysis
        2. Strategy 
    105. List Of Tables
    106. North America: Non-Lethal Weapons Market, By Country, 2022–2032
    107. Non-Lethal Weapons Market, By Country, 2022–2032
    108. By Country, 2022–2032
    109. Non-Lethal Weapons Type Market, By Region, 2022–2032
    110. Weapons Type Market, By Country, 2022–2032
    111. Country, 2022–2032
    112. The World: Non-Lethal Weapons Type Market, By Country, 2022–2032
    113. Non-Lethal Weapons Disabling Mechanism Market, By Region, 2022–2032
    114. America: Non-Lethal Weapons Disabling Mechanism Market, By Country, 2022–2032
    115. Non-Lethal Weapons Disabling Mechanism Market, By Country, 2022–2032
    116. Non-Lethal Weapons Disabling Mechanism Market, By Country, 2022–2032
    117. The World: Non-Lethal Weapons Disabling Mechanism Market, By Country, 2022–2032
    118. Non-Lethal Weapons End-User Market, By Region, 2022–2032
    119. Weapons End-User Market, By Country, 2022–2032
    120. By Country, 2022–2032
    121. Rest Of The World: Non-Lethal Weapons End-User Market, By Country, 2022–2032
    122. Non-Lethal Weapons Market, By Region, 2022–2032
    123. Global Non-Lethal Weapons Market, By Disabling Mechanism, 2022–2032
    124. Non-Lethal Weapons Market, By End-User, 2022–2032
    125. Weapons Market, By Country, 2022–2032
    126. By Type, 2022–2032
    127. North America: Non-Lethal Weapons Market, By End-User, 2022–2032
    128. Non-Lethal Weapons Market, By Country, 2022–2032
    129. Europe: Non-Lethal Weapons Market, By Disabling Mechanism, 2022–2032
    130. Non-Lethal Weapons Market, By End-User, 2022–2032
    131. Weapons Market, By Country, 2022–2032
    132. By Type, 2022–2032
    133. Asia-Pacific: Non-Lethal Weapons Market, By End-User, 2022–2032
    134. The World: Non-Lethal Weapons Market, By Region, 2022–2032
    135. World: Non-Lethal Weapons Market, By Type, 2022–2032
    136. Weapons Market, By Disabling Mechanism, 2022–2032
    137. Weapons Market, By End-User, 2022–2032 
    138. Lsit Of Figures
    139. Bottom-Up Approaches
    140. Analysis: Market Restraints
    141. Market Share, By Type, 2022 (%)
    142. (USD Million)
    143. Global Non-Lethal Weapons Market Share, By Disabling Mechanism, 2022 (%)
    144. Non-Lethal Weapons Market, By Disabling Mechanism, 2022–2032 (USD Million)
    145. Non-Lethal Weapons Market Share, By End-User, 2022 (%)
    146. –2032 (USD Million)
    147. Region, 2022
    148. Global Non-Lethal Weapons Market, By Region, 2022–2032 (USD Million)
    149. America: Non-Lethal Weapons Market Share (%), 2022
    150. By Country, 2022–2032 (USD Million)
    151. arial, helvetic'

    Non-Lethal Weapons Market Segmentation

    Market Segmentation Overview

    • Detailed segmentation data will be available in the full report
    • Comprehensive analysis by multiple parameters
    • Regional and country-level breakdowns
    • Market size forecasts by segment
    Non-Lethal Weapons Market Report Information – Forecast to 2032 Infographic
    Free Sample Request

    Kindly complete the form below to receive a free sample of this Report

    Customer Strories

    “I am very pleased with how market segments have been defined in a relevant way for my purposes (such as "Portable Freezers & refrigerators" and "last-mile"). In general the report is well structured. Thanks very much for your efforts.”

    Victoria Milne Founder
    Case Study

    Chemicals and Materials