Advancements in Research and Development
The Near Infrared Imaging Market is benefiting from continuous advancements in research and development. Innovations in sensor technology and imaging algorithms are enhancing the capabilities of near infrared imaging systems, making them more efficient and user-friendly. Research institutions and technology companies are investing heavily in developing new applications, particularly in fields such as biomedical research and food safety. For instance, the integration of artificial intelligence with near infrared imaging is opening new avenues for data analysis and interpretation. This trend is expected to drive market growth, with R&D investments projected to increase by approximately 15% over the next few years. As these advancements unfold, the near infrared imaging market is likely to see a surge in new applications and improved performance, further solidifying its position in various sectors.
Rising Focus on Environmental Monitoring
The Near Infrared Imaging Market is increasingly relevant in the context of environmental monitoring. With growing concerns about climate change and pollution, there is a heightened demand for technologies that can provide accurate and timely data on environmental conditions. Near infrared imaging is particularly effective in assessing vegetation health, soil moisture, and water quality. Recent studies indicate that the market for environmental monitoring applications is expected to grow significantly, with a projected increase of around 10% annually. This trend reflects a broader societal shift towards sustainability and the need for effective monitoring solutions. As regulatory frameworks become more stringent, the adoption of near infrared imaging for environmental applications is likely to gain momentum, positioning it as a critical tool for environmental scientists and policymakers.
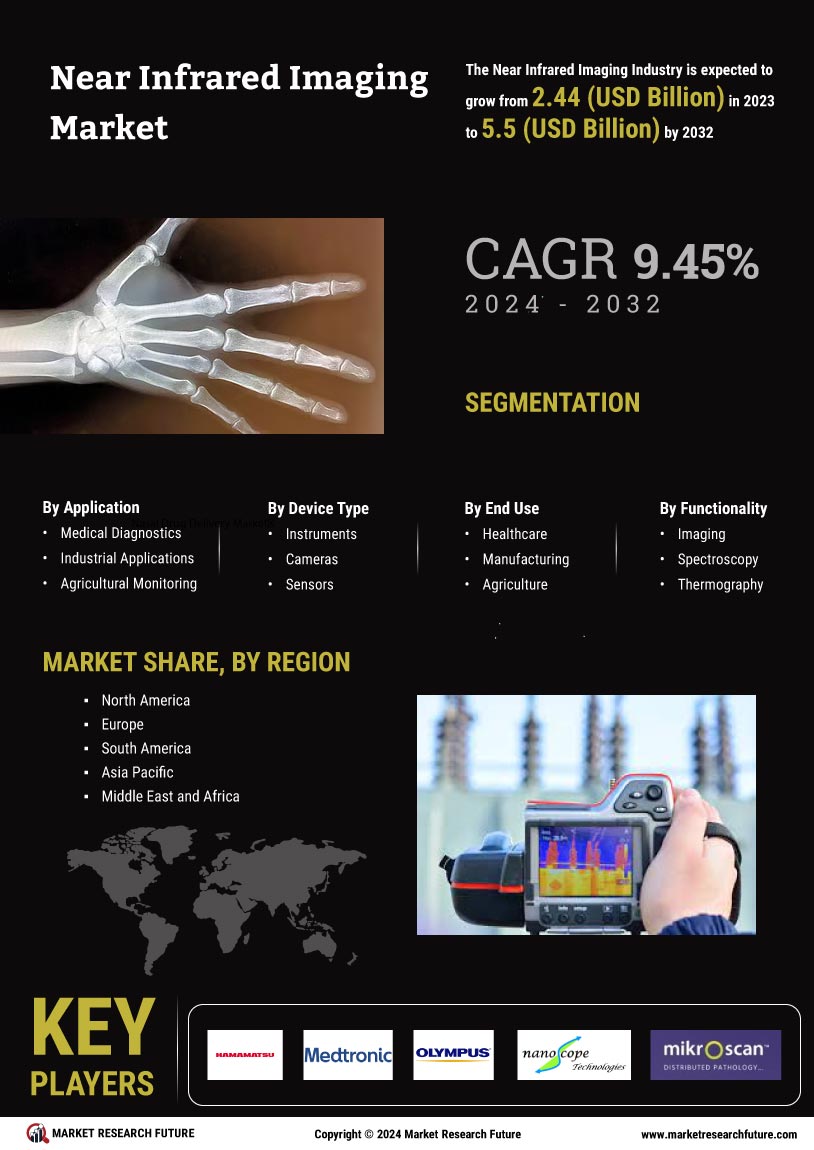
Emerging Applications in Medical Diagnostics
The Near Infrared Imaging Market is poised for growth due to emerging applications in medical diagnostics. The ability of near infrared imaging to provide real-time, high-resolution images of biological tissues is revolutionizing the way medical professionals diagnose and monitor various conditions. This technology is particularly valuable in oncology, where it aids in tumor detection and characterization. Recent estimates indicate that the medical diagnostics segment is projected to grow at a compound annual growth rate of around 9% over the next several years. This growth is fueled by the increasing prevalence of chronic diseases and the demand for non-invasive diagnostic techniques. As healthcare providers seek innovative solutions to improve patient outcomes, the adoption of near infrared imaging in medical diagnostics is likely to gain traction, further enhancing its significance in the healthcare landscape.
Increasing Adoption in Industrial Applications
The Near Infrared Imaging Market is witnessing a notable increase in adoption across various industrial sectors. Industries such as manufacturing and quality control are increasingly utilizing near infrared imaging for non-destructive testing and material analysis. This technology allows for real-time monitoring of production processes, enhancing efficiency and reducing waste. According to recent data, the industrial segment is projected to grow at a compound annual growth rate of approximately 8% over the next five years. This growth is driven by the need for improved quality assurance and the ability to detect defects early in the production cycle. As industries continue to prioritize operational excellence, the demand for near infrared imaging solutions is likely to expand, further solidifying its role in the industrial landscape.
Growing Demand in Food Safety and Quality Control
The Near Infrared Imaging Market is experiencing a surge in demand driven by the food safety and quality control sectors. As consumers become more health-conscious and regulatory standards tighten, food manufacturers are increasingly adopting near infrared imaging technologies to ensure product quality and safety. This method allows for rapid, non-destructive testing of food products, enabling the detection of contaminants and the assessment of nutritional content. Recent market analyses suggest that the food safety segment is expected to grow at a rate of approximately 12% annually. This growth is indicative of the industry's commitment to maintaining high standards and the increasing reliance on advanced technologies to meet consumer expectations. As the food industry continues to evolve, the role of near infrared imaging in ensuring food safety is likely to expand.