• Cat-intel
  • MedIntelliX
  • Resources
  • About Us
  • Hero Background
    English
    Chinese
    French
    Japanese
    Korean
    German
    Spanish

    Near Infrared Imaging Market Analysis

    ID: MRFR/HC/5955-HCR
    200 Pages
    Rahul Gotadki
    October 2025

    Near Infrared Imaging Market Research Report By Application (Medical Diagnostics, Industrial Inspection, Agricultural Monitoring, Research and Development), By Component (Cameras, Lighting Systems, Software, Accessories), By End-use (Healthcare, Manufacturing, Agriculture, Research Institutions), By Technology (Hyperspectral Imaging, Multispectral Imaging, Thermal Imaging), and By Regional (Nor...

    Share:
    Download PDF ×

    We do not share your information with anyone. However, we may send you emails based on your report interest from time to time. You may contact us at any time to opt-out.

    Near Infrared Imaging Market Infographic
    Purchase Options

    Market Analysis

    In-depth Analysis of Near Infrared Imaging Market Industry Landscape

    Near-infrared light is used to produce precise photographs of biological tissues in the rapidly developing Near Infrared Imaging Market. Technological advances, medical diagnostic applications, and non-invasive imaging technologies drive this sector's market. Technological advances drive near-infrared imaging market dynamics. This technique is used more in medical diagnostics and research because of improvements in picture quality, sensitivity, and real-time imaging. The adaptability of near-infrared imaging in medical diagnostics impacts market dynamics. Many medical professionals employ near-infrared imaging to detect cancer, vascular problems, brain function, and tissue oxygenation. Near-infrared imaging in cancer diagnosis drives market dynamics. Its real-time tumor vision during surgery aids tumor excision and minimizes tissue damage, making it useful in oncology. Near-infrared imaging's non-invasiveness drives market dynamics. The method permits imaging underneath living tissues without radiation or intrusive treatments. This makes non-invasive imaging systems popular among healthcare practitioners and patients. Market dynamics depend on regulatory compliance. Near-infrared imaging systems are safe and effective when medical device rules are followed. Product quality and safety are crucial to market competitiveness and dynamics as companies navigate these regulatory criteria. Near-infrared imaging system manufacturers and research institutes collaborate to affect market dynamics. Partnerships frequently result in clinical investigations, research, and imaging technology improvements. Research partnerships boost market development and define competition. Healthcare budgets and affordability affect market dynamics. Near-infrared imaging systems' cost-effectiveness drives product uptake. Healthcare budget limits and economic volatility affect purchase choices, altering market dynamics. NIR imaging is used due to the growing desire for less invasive surgery. Minimally invasive operations benefit from real-time tissue and vascular imaging without large incisions, affecting market dynamics. Neurological imaging uses near-infrared imaging, affecting market dynamics. Product development and market preferences are affected by this technology's use in brain function monitoring, cerebral oxygenation assessment, and neurological condition diagnosis. An important market development is the combination of near-infrared imaging with AI. AI algorithms improve picture processing, interpretation, and diagnosis, making the technology more effective. This integration changes medical diagnostic near-infrared imaging.

    Author
    Rahul Gotadki
    Assistant Manager

    He holds an experience of about 7+ years in Market Research and Business Consulting, working under the spectrum of Life Sciences and Healthcare domains. Rahul conceptualizes and implements a scalable business strategy and provides strategic leadership to the clients. His expertise lies in market estimation, competitive intelligence, pipeline analysis, customer assessment, etc. In addition to the above, his other responsibility includes strategic tracking of high growth markets & advising clients on the potential areas of focus they could direct their business initiatives

    Leave a Comment

    FAQs

    What is the expected market size of the Near Infrared Imaging Market by the year 2035?

    The Near Infrared Imaging Market is expected to be valued at 5.2 USD Billion by the year 2035.

    What is the projected CAGR for the Near Infrared Imaging Market from 2025 to 2035?

    The expected CAGR for the Near Infrared Imaging Market from 2025 to 2035 is 6.84%.

    Which region holds the largest market share in the Near Infrared Imaging Market by 2035?

    North America is projected to hold the largest market share in the Near Infrared Imaging Market, valued at 1.567 USD Billion by 2035.

    What was the market size of the Medical Diagnostics application in the Near Infrared Imaging Market for 2024?

    The market size for the Medical Diagnostics application was valued at 1.0 USD Billion in the year 2024.

    Who are the key players in the Near Infrared Imaging Market?

    Key players in the Near Infrared Imaging Market include companies like GE Healthcare, Siemens Healthcare, and Stryker.

    What is the expected market size for Agricultural Monitoring in the Near Infrared Imaging Market by 2035?

    The market size for Agricultural Monitoring is expected to reach 1.1 USD Billion by 2035.

    How much was the Industrial Inspection segment valued at in the Near Infrared Imaging Market for 2024?

    The Industrial Inspection segment was valued at 0.65 USD Billion in the year 2024.

    What significant growth is anticipated for the Asia Pacific region in the Near Infrared Imaging Market by 2035?

    The Asia Pacific region's market size is anticipated to grow to 1.414 USD Billion by 2035.

    What is the expected market size of the Research and Development application in the Near Infrared Imaging Market by 2035?

    The market size for Research and Development is expected to be 0.75 USD Billion by the year 2035.

    What are the expected growth prospects for the Middle East and Africa region in the Near Infrared Imaging Market by 2035?

    The Middle East and Africa region is projected to be valued at 0.513 USD Billion by 2035.

    Market Summary

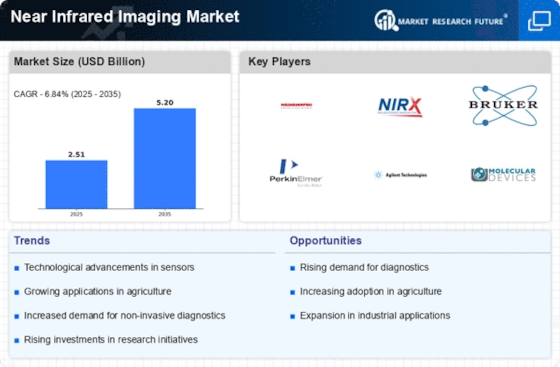
    As per MRFR analysis, the Near Infrared Imaging Market Size was estimated at 2.51 USD Billion in 2024. The Near Infrared Imaging industry is projected to grow from 2.682 USD Billion in 2025 to 5.197 USD Billion by 2035, exhibiting a compound annual growth rate (CAGR) of 6.84 during the forecast period 2025 - 2035.

    Key Market Trends & Highlights

    The Near Infrared Imaging Market is poised for substantial growth driven by technological advancements and increasing applications across various sectors.

    • Technological advancements are enhancing the capabilities of near infrared imaging systems, particularly in medical diagnostics.
    • North America remains the largest market, while Asia-Pacific is emerging as the fastest-growing region for near infrared imaging applications.
    • The medical diagnostics segment leads the market, whereas agricultural monitoring is rapidly gaining traction due to its innovative applications.
    • Key market drivers include the increasing adoption in industrial applications and the rising focus on environmental monitoring.

    Market Size & Forecast

    2024 Market Size 2.51 (USD Billion)
    2035 Market Size 5.197 (USD Billion)
    CAGR (2025 - 2035) 6.84%
    Largest Regional Market Share in 2024 North America

    Major Players

    <p>Hamamatsu Photonics K.K. (JP), NIRx Medical Technologies, LLC (US), Bruker Corporation (US), PerkinElmer, Inc. (US), Agilent Technologies, Inc. (US), Molecular Devices, LLC (US), Headwall Photonics, Inc. (US), OptoDiagnostics, Inc. (US), JASCO Corporation (JP)</p>

    Market Trends

    The Near Infrared Imaging Market is currently experiencing a notable evolution, driven by advancements in technology and increasing applications across various sectors. This imaging technique, which utilizes wavelengths just beyond the visible spectrum, is gaining traction in fields such as medical diagnostics, agriculture, and security. The ability to visualize internal structures without invasive procedures is particularly appealing in healthcare, where it enhances the accuracy of disease detection and monitoring. Furthermore, the agricultural sector benefits from this technology by enabling precise analysis of plant health and soil conditions, thereby optimizing yield and resource management. In addition to healthcare and agriculture, the Near Infrared Imaging Market is also expanding in the realm of security and surveillance. The capability to detect concealed objects and assess environmental conditions makes it a valuable tool for law enforcement and military applications. As awareness of the benefits of this imaging method grows, more industries are likely to adopt it, leading to a broader market presence. The ongoing research and development efforts are expected to further enhance the capabilities of near infrared imaging systems, potentially leading to innovative applications that have yet to be explored. This dynamic landscape suggests a promising future for the Near Infrared Imaging Market, characterized by continuous growth and diversification of applications.

    Technological Advancements

    Recent innovations in sensor technology and image processing algorithms are enhancing the capabilities of near infrared imaging systems. These advancements allow for improved image quality and faster processing times, making the technology more accessible and effective across various applications.

    Growing Demand in Healthcare

    The healthcare sector is increasingly adopting near infrared imaging for non-invasive diagnostics and monitoring. This trend is driven by the need for accurate and timely medical assessments, which are crucial for effective patient care and treatment planning.

    Expansion in Agricultural Applications

    The use of near infrared imaging in agriculture is on the rise, as it provides valuable insights into crop health and soil conditions. This trend supports sustainable farming practices by enabling farmers to make informed decisions regarding resource allocation and crop management.

    The Global Near Infrared Imaging Market is poised for growth as advancements in technology enhance its applications across various sectors, including medical diagnostics and agricultural monitoring.

    U.S. Department of Energy

    Near Infrared Imaging Market Market Drivers

    Advancements in Research and Development

    The Near Infrared Imaging Market is benefiting from continuous advancements in research and development. Innovations in sensor technology and imaging algorithms are enhancing the capabilities of near infrared imaging systems, making them more efficient and user-friendly. Research institutions and technology companies are investing heavily in developing new applications, particularly in fields such as biomedical research and food safety. For instance, the integration of artificial intelligence with near infrared imaging is opening new avenues for data analysis and interpretation. This trend is expected to drive market growth, with R&D investments projected to increase by approximately 15% over the next few years. As these advancements unfold, the near infrared imaging market is likely to see a surge in new applications and improved performance, further solidifying its position in various sectors.

    Rising Focus on Environmental Monitoring

    The Near Infrared Imaging Market is increasingly relevant in the context of environmental monitoring. With growing concerns about climate change and pollution, there is a heightened demand for technologies that can provide accurate and timely data on environmental conditions. Near infrared imaging is particularly effective in assessing vegetation health, soil moisture, and water quality. Recent studies indicate that the market for environmental monitoring applications is expected to grow significantly, with a projected increase of around 10% annually. This trend reflects a broader societal shift towards sustainability and the need for effective monitoring solutions. As regulatory frameworks become more stringent, the adoption of near infrared imaging for environmental applications is likely to gain momentum, positioning it as a critical tool for environmental scientists and policymakers.

    Emerging Applications in Medical Diagnostics

    The Near Infrared Imaging Market is poised for growth due to emerging applications in medical diagnostics. The ability of near infrared imaging to provide real-time, high-resolution images of biological tissues is revolutionizing the way medical professionals diagnose and monitor various conditions. This technology is particularly valuable in oncology, where it aids in tumor detection and characterization. Recent estimates indicate that the medical diagnostics segment is projected to grow at a compound annual growth rate of around 9% over the next several years. This growth is fueled by the increasing prevalence of chronic diseases and the demand for non-invasive diagnostic techniques. As healthcare providers seek innovative solutions to improve patient outcomes, the adoption of near infrared imaging in medical diagnostics is likely to gain traction, further enhancing its significance in the healthcare landscape.

    Increasing Adoption in Industrial Applications

    The Near Infrared Imaging Market is witnessing a notable increase in adoption across various industrial sectors. Industries such as manufacturing and quality control are increasingly utilizing near infrared imaging for non-destructive testing and material analysis. This technology allows for real-time monitoring of production processes, enhancing efficiency and reducing waste. According to recent data, the industrial segment is projected to grow at a compound annual growth rate of approximately 8% over the next five years. This growth is driven by the need for improved quality assurance and the ability to detect defects early in the production cycle. As industries continue to prioritize operational excellence, the demand for near infrared imaging solutions is likely to expand, further solidifying its role in the industrial landscape.

    Growing Demand in Food Safety and Quality Control

    The Near Infrared Imaging Market is experiencing a surge in demand driven by the food safety and quality control sectors. As consumers become more health-conscious and regulatory standards tighten, food manufacturers are increasingly adopting near infrared imaging technologies to ensure product quality and safety. This method allows for rapid, non-destructive testing of food products, enabling the detection of contaminants and the assessment of nutritional content. Recent market analyses suggest that the food safety segment is expected to grow at a rate of approximately 12% annually. This growth is indicative of the industry's commitment to maintaining high standards and the increasing reliance on advanced technologies to meet consumer expectations. As the food industry continues to evolve, the role of near infrared imaging in ensuring food safety is likely to expand.

    Market Segment Insights

    By Application: Medical Diagnostics (Largest) vs. Agricultural Monitoring (Fastest-Growing)

    <p>In the Near Infrared Imaging Market, the application segment is primarily dominated by Medical Diagnostics, leveraging advanced imaging technologies for non-invasive medical assessments. This segment holds the largest share as it meets the critical need for early disease detection and monitoring, thereby ensuring patient safety and effective treatment planning. Agricultural Monitoring, while smaller in comparison, is rapidly gaining traction. The application of near infrared imaging in crop health assessment and pest detection is increasingly being recognized, driving adoption in agritech innovations.</p>

    <p>Medical Diagnostics (Dominant) vs. Agricultural Monitoring (Emerging)</p>

    <p>Medical Diagnostics has emerged as the dominant application in the Near Infrared Imaging Market, driven by its essential role in facilitating accurate and timely health assessments. Its ability to provide detailed internal images without invasive procedures makes it indispensable in various medical fields, including oncology and cardiology. Conversely, Agricultural Monitoring is on the rise as an emerging application, supported by the increasing focus on precision agriculture. This segment utilizes near infrared imaging for evaluating plant health, moisture content, and identifying diseases, allowing farmers to optimize yields and mitigate risks. The adoption of this technology reflects a growing commitment to sustainability and efficiency in agricultural practices.</p>

    By Component: Cameras (Largest) vs. Lighting Systems (Fastest-Growing)

    <p>In the Near Infrared Imaging Market, the Component segment showcases a dynamic configuration, with Cameras holding the largest market share. This prevalence stems from their essential role in a variety of applications, including medical diagnostics and industrial inspections, where high-resolution imaging is vital. Meanwhile, Lighting Systems are gaining traction, reflecting a shift towards enhanced imaging quality under variable conditions, thus driving their increasing adoption in the sector.</p>

    <p>Cameras (Dominant) vs. Accessories (Emerging)</p>

    <p>Cameras in the Near Infrared Imaging Market are renowned for their precision and reliability, making them the dominant force within the Component segment. Their advanced technologies cater to specialized areas such as agriculture, surveillance, and scientific research, ensuring demand remains robust. Accessories, while considered emerging, are vital adjuncts that enhance the functionality of imaging systems. These include lenses, filters, and mounting equipment designed to optimize performance in specific settings. As the market evolves, the integration and development of innovative accessories are expected to support the capabilities of primary imaging components.</p>

    By End-use: Healthcare (Largest) vs. Agriculture (Fastest-Growing)

    <p>In the Near Infrared Imaging Market, the end-use segment is predominantly driven by the healthcare sector, which captures a significant share of the market. This is due to its extensive applications in medical diagnostics and imaging technologies. Manufacturing also plays a key role, using NIR imaging for quality control and process monitoring. The agriculture sector, while smaller, is rapidly gaining traction as precision agriculture techniques become mainstream, leveraging NIR for crop analysis and health assessment. Growth trends indicate that the healthcare segment will continue to dominate the market, largely due to advancements in medical imaging technologies and increased healthcare spending. Meanwhile, agriculture is emerging as the fastest-growing segment as farmers adopt NIR imaging for better crop management and yield optimization. Research institutions are also utilizing NIR for various experimental applications, albeit at a slower growth pace compared to agriculture.</p>

    <p>Healthcare (Dominant) vs. Manufacturing (Emerging)</p>

    <p>The healthcare sector remains the dominant player in the Near Infrared Imaging Market, characterized by its wide-ranging applications in diagnostics and treatment planning. NIR technology allows for non-invasive imaging, which is pivotal in early disease detection and real-time monitoring of patient conditions. Conversely, the manufacturing sector is deemed an emerging segment, leveraging NIR imaging for quality assurance and process improvements. While it does not yet match the healthcare sector's prevalence, its adoption is fueled by increasing automation and quality demands in production processes. Together, these segments reflect a dynamic landscape, where healthcare's dominance is complemented by manufacturing's growing integration of NIR for efficiency.</p>

    By Technology: Hyperspectral Imaging (Largest) vs. Thermal Imaging (Fastest-Growing)

    <p>The Near Infrared Imaging Market has seen significant segmentation, with hyperspectral imaging leading in market share due to its extensive application in environmental monitoring, agriculture, and biomedical fields. Multispectral imaging follows, capturing a specific number of spectral bands for image analysis, while thermal imaging is gaining ground as a powerful diagnostic tool. The diverse applications across various industries have contributed to these market dynamics, with hyperspectral imaging currently occupying the largest market share among the three technologies. Growth trends in this market reflect an increasing interest in non-invasive imaging technologies. Advances in sensor technology and analytical methods drive the acceptance of thermal imaging, which is rapidly expanding in the healthcare sector for its ability to detect temperature variations in body tissues. Multispectral imaging technology is also gaining traction as its capabilities are recognized in the agricultural and security industries, leading to overall growth in the Near Infrared Imaging Market as these technologies are integrated into more applications.</p>

    <p>Technology: Hyperspectral Imaging (Dominant) vs. Thermal Imaging (Emerging)</p>

    <p>Hyperspectral imaging stands out as the dominant technology in the Near Infrared Imaging Market due to its ability to capture a broad spectrum of light across many wavelengths. This capability allows for detailed material identification, making it invaluable in fields such as agriculture, surveillance, and environmental monitoring. On the other hand, thermal imaging represents an emerging trend characterized by its unique capacity to visualize temperature variations, making it vital in medical diagnostics and predictive maintenance. As the demand for quality healthcare increases, the adoption of thermal imaging devices is expected to rise rapidly, enabling better patient outcomes and operational efficiencies across industries.</p>

    Get more detailed insights about Near Infrared Imaging Market Research Report – Forecast till 2035

    Regional Insights

    The Near Infrared Imaging Market is poised for substantial growth, with significant regional contributions shaping its landscape. In 2024, North America held a majority share, valued at 0.737 USD Billion and projected to grow to 1.567 USD Billion by 2035, driven by advancements in healthcare technology and research initiatives.

    Europe followed closely, with a valuation of 0.615 USD Billion in 2024, expanding to 1.311 USD Billion, supported by increasing demand for non-invasive imaging techniques. The Asia Pacific region, valued at 0.665 USD Billion in 2024 and expected to reach 1.414 USD Billion, gained traction due to rapid adoption of innovative medical technologies and growing healthcare infrastructure.

    Meanwhile, South America, starting at 0.179 USD Billion and expanding to 0.395 USD Billion, showed potential for growth as healthcare access improves. The Middle East and Africa contributed a valuation of 0.315 USD Billion in 2024, anticipated to rise to 0.513 USD Billion, driven by investments in healthcare modernization. Collectively, these regions presented diverse growth opportunities within the Near Infrared Imaging Market, influenced by regional healthcare developments and technological advancements.

    Near Infrared Imaging Market Regional Insights

    Source: Primary Research, Secondary Research, MRFR Database and Analyst Review

    Key Players and Competitive Insights

    The Near Infrared Imaging Market is characterized by the presence of various players that bring innovative solutions and advanced technologies to the forefront of medical imaging. This market relies heavily on the development of effective and efficient imaging techniques that utilize near-infrared light to visualize biological tissues. Competition within this space is rife, with companies striving to differentiate their offerings through improved sensitivity, accuracy, and the potential for real-time imaging capabilities. The application of near-infrared imaging extends across multiple domains, including surgical navigation, oncology, and neurology, thereby driving a growing need for novel imaging systems and their respective enhancements.

    Market dynamics also include a focus on partnerships, research and development investments, and the exploration of new therapeutic applications that utilize this imaging technology, all contributing to a rapidly evolving landscape where innovation is key to gaining competitive advantage.

    OptiMedica holds a notable position in the Near Infrared Imaging Market due to its commitment to advancing intraoperative imaging solutions. The company specializes in developing technologies that enhance surgical procedures, particularly in ophthalmology. OptiMedica's imaging systems leverage near-infrared light to provide surgeons with critical information during operations, thereby increasing precision and improving patient outcomes.

    The strength of OptiMedica lies in its ability to integrate advanced imaging technology seamlessly within surgical workflows, positioning itself as a partner to healthcare professionals seeking to enhance their operational capabilities. Additionally, the firm benefits from strong relationships with hospitals and surgical centers, enabling widespread adoption of its solutions across multiple regions.

    Nokia's engagement in the Near Infrared Imaging Market is part of its broader strategy to diversify its technology offerings. With a focus on digital health solutions, Nokia has explored opportunities to integrate near-infrared imaging technology into its product portfolio. The company aims to enhance telemedicine and remote health monitoring through innovative imaging capabilities.

    Strengths for Nokia include its established reputation in technology and robust infrastructure that can support large-scale deployment of imaging solutions. Additionally, Nokia's pursuit of partnerships and collaborations with healthcare providers potentially positions it to leverage synergies that align with its existing telecommunications framework.

    By prioritizing innovative products that combine imaging with data analytics, Nokia is poised to make significant contributions within the global market, particularly as the demand for advanced imaging solutions continues to rise. This diversification strategy and technological advancements reinforce Nokia's role in shaping the future of the near-infrared imaging landscape on a global scale.

    Key Companies in the Near Infrared Imaging Market market include

    Industry Developments

    In order to incorporate machine learning into its near-infrared fluorescence (NIRF) imaging software and speed up picture processing while increasing diagnostic accuracy in medical imaging systems, GE Healthcare partnered strategically with an AI-focused company in September 2023. To address growing demand in the Asia-Pacific area and improve supply chain resilience, Philips Healthcare increased the output of its NIRF systems in August 2023 by expanding its manufacturing facility in Pune, India.

    Canon Medical Systems was able to bring its cutting-edge platform into a competitive market and strengthen its worldwide footprint in July 2023 after receiving regulatory permission in Europe for its most recent NIRF imaging technology. By merging with a specialized imaging software company in June 2023, Mindray Medical International significantly improved its NIRF capabilities and sped up the time to market for smart imaging products. A new NIR fluorescence imaging system from Olympus Corporation was introduced in March 2024, improving contrast and resolution to increase surgical accuracy.

    As part of a larger industry focus on intelligent intraoperative guiding, Stryker introduced an AI-enabled fluorescence imaging system in January 2024 that aims to enhance tumor identification during minimally invasive surgeries. Quest Medical Imaging BV launched their NIRQuest 700 imaging system, designed for cancer diagnosis and therapy monitoring, in June 2023. Consistent innovation across product lines and geographies is demonstrated by the March 2023 introduction of the NIR‑A1200 near-infrared camera by Hamamatsu Photonics for industrial and scientific customers and the April 2023 launch of the NIRQuest 5000 system for clinical and research laboratories by PerkinElmer.

    Future Outlook

    Near Infrared Imaging Market Future Outlook

    <p>The Near Infrared Imaging Market is projected to grow at a 6.84% CAGR from 2024 to 2035, driven by advancements in technology, increasing healthcare applications, and rising demand for non-invasive diagnostic tools.</p>

    New opportunities lie in:

    • <p>Development of portable NIR imaging devices for field applications.</p>
    • <p>Integration of AI algorithms for enhanced image analysis and diagnostics.</p>
    • <p>Expansion into agricultural monitoring for crop health assessment.</p>

    <p>By 2035, the Near Infrared Imaging Market is expected to achieve substantial growth and innovation.</p>

    Market Segmentation

    Near Infrared Imaging Market End-use Outlook

    • Healthcare
    • Manufacturing
    • Agriculture
    • Research Institutions

    Near Infrared Imaging Market Component Outlook

    • Cameras
    • Lighting Systems
    • Software
    • Accessories

    Near Infrared Imaging Market Technology Outlook

    • Hyperspectral Imaging
    • Multispectral Imaging
    • Thermal Imaging

    Near Infrared Imaging Market Application Outlook

    • Medical Diagnostics
    • Industrial Inspection
    • Agricultural Monitoring
    • Research and Development

    Report Scope

    MARKET SIZE 20242.51(USD Billion)
    MARKET SIZE 20252.682(USD Billion)
    MARKET SIZE 20355.197(USD Billion)
    COMPOUND ANNUAL GROWTH RATE (CAGR)6.84% (2024 - 2035)
    REPORT COVERAGERevenue Forecast, Competitive Landscape, Growth Factors, and Trends
    BASE YEAR2024
    Market Forecast Period2025 - 2035
    Historical Data2019 - 2024
    Market Forecast UnitsUSD Billion
    Key Companies ProfiledMarket analysis in progress
    Segments CoveredMarket segmentation analysis in progress
    Key Market OpportunitiesAdvancements in non-invasive medical diagnostics drive growth in the Near Infrared Imaging Market.
    Key Market DynamicsTechnological advancements in Near Infrared Imaging enhance applications across healthcare, agriculture, and industrial sectors.
    Countries CoveredNorth America, Europe, APAC, South America, MEA

    FAQs

    What is the expected market size of the Near Infrared Imaging Market by the year 2035?

    The Near Infrared Imaging Market is expected to be valued at 5.2 USD Billion by the year 2035.

    What is the projected CAGR for the Near Infrared Imaging Market from 2025 to 2035?

    The expected CAGR for the Near Infrared Imaging Market from 2025 to 2035 is 6.84%.

    Which region holds the largest market share in the Near Infrared Imaging Market by 2035?

    North America is projected to hold the largest market share in the Near Infrared Imaging Market, valued at 1.567 USD Billion by 2035.

    What was the market size of the Medical Diagnostics application in the Near Infrared Imaging Market for 2024?

    The market size for the Medical Diagnostics application was valued at 1.0 USD Billion in the year 2024.

    Who are the key players in the Near Infrared Imaging Market?

    Key players in the Near Infrared Imaging Market include companies like GE Healthcare, Siemens Healthcare, and Stryker.

    What is the expected market size for Agricultural Monitoring in the Near Infrared Imaging Market by 2035?

    The market size for Agricultural Monitoring is expected to reach 1.1 USD Billion by 2035.

    How much was the Industrial Inspection segment valued at in the Near Infrared Imaging Market for 2024?

    The Industrial Inspection segment was valued at 0.65 USD Billion in the year 2024.

    What significant growth is anticipated for the Asia Pacific region in the Near Infrared Imaging Market by 2035?

    The Asia Pacific region's market size is anticipated to grow to 1.414 USD Billion by 2035.

    What is the expected market size of the Research and Development application in the Near Infrared Imaging Market by 2035?

    The market size for Research and Development is expected to be 0.75 USD Billion by the year 2035.

    What are the expected growth prospects for the Middle East and Africa region in the Near Infrared Imaging Market by 2035?

    The Middle East and Africa region is projected to be valued at 0.513 USD Billion by 2035.

    1. FACTOR ANALYSIS
      1. \r\n\r\n\r\nValue chain Analysis
      2. \r\n\r\n\r\nPorter's
      3. Five Forces Analysis
      4. \r\n\r\n\r\nBargaining Power of Suppliers
      5. \r\n\r\n\r\nBargaining
      6. Power of Buyers
      7. \r\n\r\n\r\nThreat of New Entrants
      8. \r\n\r\n\r\nThreat
      9. of Substitutes
      10. \r\n\r\n\r\nIntensity of Rivalry
      11. \r\n\r\n\r\n\r\n\r\nCOVID-19
      12. Impact Analysis
      13. \r\n\r\n\r\nMarket Impact Analysis
      14. \r\n\r\n\r\nRegional
      15. Impact
      16. \r\n\r\n\r\nOpportunity and Threat Analysis
      17. \r\n\r\n\r\n\r\n\r\n\r\n\r\n
      18. \r\n
      19. \r\n\r\n\r\nNear
    2. Infrared Imaging Market, BY Application (USD Billion)
      1. \r\n\r\n\r\nMedical
      2. Diagnostics
      3. \r\n\r\n\r\nIndustrial Inspection
      4. \r\n\r\n\r\nAgricultural
      5. Monitoring
      6. \r\n\r\n\r\nResearch and Development
      7. \r\n\r\n\r\n\r\n\r\nNear
    3. Infrared Imaging Market, BY Component (USD Billion)
      1. \r\n\r\n\r\nCameras
      2. \r\n\r\n\r\nLighting
      3. Systems
      4. \r\n\r\n\r\nSoftware
      5. \r\n\r\n\r\nAccessories
      6. \r\n\r\n\r\n\r\n\r\nNear
    4. Infrared Imaging Market, BY End Use (USD Billion)
      1. \r\n\r\n\r\nHealthcare
      2. \r\n\r\n\r\nManufacturing
      3. \r\n\r\n\r\nAgriculture
      4. \r\n\r\n\r\nResearch
      5. Institutions
      6. \r\n\r\n\r\n\r\n\r\nNear Infrared
    5. Imaging Market, BY Technology (USD Billion)
      1. \r\n\r\n\r\nHyperspectral
      2. Imaging
      3. \r\n\r\n\r\nMultispectral Imaging
      4. \r\n\r\n\r\nThermal
      5. Imaging
      6. \r\n\r\n\r\n\r\n\r\nNear Infrared Imaging
    6. Market, BY Regional (USD Billion)
      1. \r\n\r\n\r\nNorth America
      2. \r\n\r\n\r\nUS
      3. \r\n\r\n\r\nCanada
      4. \r\n\r\n\r\n\r\n\r\nEurope
      5. \r\n\r\n\r\nGermany
      6. \r\n\r\n\r\nUK
      7. \r\n\r\n\r\nFrance
      8. \r\n\r\n\r\nRussia
      9. \r\n\r\n\r\nItaly
      10. \r\n\r\n\r\nSpain
      11. \r\n\r\n\r\nRest
      12. of Europe
      13. \r\n\r\n\r\n\r\n\r\nAPAC
      14. \r\n\r\n\r\nChina
      15. \r\n\r\n\r\nIndia
      16. \r\n\r\n\r\nJapan
      17. \r\n\r\n\r\nSouth
      18. Korea
      19. \r\n\r\n\r\nMalaysia
      20. \r\n\r\n\r\nThailand
      21. \r\n\r\n\r\nIndonesia
      22. \r\n\r\n\r\nRest
      23. of APAC
      24. \r\n\r\n\r\n\r\n\r\nSouth America
      25. \r\n\r\n\r\nBrazil
      26. \r\n\r\n\r\nMexico
      27. \r\n\r\n\r\nArgentina
      28. \r\n\r\n\r\nRest
      29. of South America
      30. \r\n\r\n\r\n\r\n\r\nMEA
      31. \r\n\r\n\r\nGCC
      32. Countries
      33. \r\n\r\n\r\nSouth Africa
      34. \r\n\r\n\r\nRest
      35. of MEA
      36. \r\n\r\n\r\n\r\n\r\n\r\n\r\n
      37. \r\n
      38. \r\n\r\n\r\nCompetitive
      39. Landscape
      40. \r\n\r\n\r\nOverview
      41. \r\n\r\n\r\nCompetitive
      42. Analysis
      43. \r\n\r\n\r\nMarket share Analysis
      44. \r\n\r\n\r\nMajor
      45. Growth Strategy in the Near Infrared Imaging Market
      46. \r\n\r\n\r\nCompetitive
      47. Benchmarking
      48. \r\n\r\n\r\nLeading Players in Terms of Number of Developments
      49. in the Near Infrared Imaging Market
      50. \r\n\r\n\r\nKey developments
      51. and growth strategies
      52. \r\n\r\n\r\nNew Product Launch/Service Deployment
      53. \r\n\r\n\r\nMerger
      54. & Acquisitions
      55. \r\n\r\n\r\nJoint Ventures
      56. \r\n\r\n\r\n\r\n\r\nMajor
      57. Players Financial Matrix
      58. \r\n\r\n\r\nSales and Operating Income
      59. \r\n\r\n\r\nMajor
      60. Players R&D Expenditure. 2023
      61. \r\n\r\n\r\n\r\n\r\n\r\n\r\nCompany
      62. Profiles
      63. \r\n\r\n\r\nHeadwall Photonics
      64. \r\n\r\n\r\nFinancial
      65. Overview
      66. \r\n\r\n\r\nProducts Offered
      67. \r\n\r\n\r\nKey
      68. Developments
      69. \r\n\r\n\r\nSWOT Analysis
      70. \r\n\r\n\r\nKey
      71. Strategies
      72. \r\n\r\n\r\n\r\n\r\nImricor Medical Systems
      73. \r\n\r\n\r\nFinancial
      74. Overview
      75. \r\n\r\n\r\nProducts Offered
      76. \r\n\r\n\r\nKey
      77. Developments
      78. \r\n\r\n\r\nSWOT Analysis
      79. \r\n\r\n\r\nKey
      80. Strategies
      81. \r\n\r\n\r\n\r\n\r\nThermo Fisher Scientific
      82. \r\n\r\n\r\nFinancial
      83. Overview
      84. \r\n\r\n\r\nProducts Offered
      85. \r\n\r\n\r\nKey
      86. Developments
      87. \r\n\r\n\r\nSWOT Analysis
      88. \r\n\r\n\r\nKey
      89. Strategies
      90. \r\n\r\n\r\n\r\n\r\nPhilips
      91. \r\n\r\n\r\nFinancial
      92. Overview
      93. \r\n\r\n\r\nProducts Offered
      94. \r\n\r\n\r\nKey
      95. Developments
      96. \r\n\r\n\r\nSWOT Analysis
      97. \r\n\r\n\r\nKey
      98. Strategies
      99. \r\n\r\n\r\n\r\n\r\nTeledyne Technologies
      100. \r\n\r\n\r\nFinancial
      101. Overview
      102. \r\n\r\n\r\nProducts Offered
      103. \r\n\r\n\r\nKey
      104. Developments
      105. \r\n\r\n\r\nSWOT Analysis
      106. \r\n\r\n\r\nKey
      107. Strategies
      108. \r\n\r\n\r\n\r\n\r\nHamamatsu Photonics
      109. \r\n\r\n\r\nFinancial
      110. Overview
      111. \r\n\r\n\r\nProducts Offered
      112. \r\n\r\n\r\nKey
      113. Developments
      114. \r\n\r\n\r\nSWOT Analysis
      115. \r\n\r\n\r\nKey
      116. Strategies
      117. \r\n\r\n\r\n\r\n\r\nSakura Finetek
      118. \r\n\r\n\r\nFinancial
      119. Overview
      120. \r\n\r\n\r\nProducts Offered
      121. \r\n\r\n\r\nKey
      122. Developments
      123. \r\n\r\n\r\nSWOT Analysis
      124. \r\n\r\n\r\nKey
      125. Strategies
      126. \r\n\r\n\r\n\r\n\r\nKOHERD
      127. \r\n\r\n\r\nFinancial
      128. Overview
      129. \r\n\r\n\r\nProducts Offered
      130. \r\n\r\n\r\nKey
      131. Developments
      132. \r\n\r\n\r\nSWOT Analysis
      133. \r\n\r\n\r\nKey
      134. Strategies
      135. \r\n\r\n\r\n\r\n\r\nBoston Scientific
      136. \r\n\r\n\r\nFinancial
      137. Overview
      138. \r\n\r\n\r\nProducts Offered
      139. \r\n\r\n\r\nKey
      140. Developments
      141. \r\n\r\n\r\nSWOT Analysis
      142. \r\n\r\n\r\nKey
      143. Strategies
      144. \r\n\r\n\r\n\r\n\r\nMedtronic
      145. \r\n\r\n\r\nFinancial
      146. Overview
      147. \r\n\r\n\r\nProducts Offered
      148. \r\n\r\n\r\nKey
      149. Developments
      150. \r\n\r\n\r\nSWOT Analysis
      151. \r\n\r\n\r\nKey
      152. Strategies
      153. \r\n\r\n\r\n\r\n\r\nZeiss
      154. \r\n\r\n\r\nFinancial
      155. Overview
      156. \r\n\r\n\r\nProducts Offered
      157. \r\n\r\n\r\nKey
      158. Developments
      159. \r\n\r\n\r\nSWOT Analysis
      160. \r\n\r\n\r\nKey
      161. Strategies
      162. \r\n\r\n\r\n\r\n\r\nOpto Diagnostics
      163. \r\n\r\n\r\nFinancial
      164. Overview
      165. \r\n\r\n\r\nProducts Offered
      166. \r\n\r\n\r\nKey
      167. Developments
      168. \r\n\r\n\r\nSWOT Analysis
      169. \r\n\r\n\r\nKey
      170. Strategies
      171. \r\n\r\n\r\n\r\n\r\nPerkinElmer
      172. \r\n\r\n\r\nFinancial
      173. Overview
      174. \r\n\r\n\r\nProducts Offered
      175. \r\n\r\n\r\nKey
      176. Developments
      177. \r\n\r\n\r\nSWOT Analysis
      178. \r\n\r\n\r\nKey
      179. Strategies
      180. \r\n\r\n\r\n\r\n\r\nNIR Technologies
      181. \r\n\r\n\r\nFinancial
      182. Overview
      183. \r\n\r\n\r\nProducts Offered
      184. \r\n\r\n\r\nKey
      185. Developments
      186. \r\n\r\n\r\nSWOT Analysis
      187. \r\n\r\n\r\nKey
      188. Strategies
      189. \r\n\r\n\r\n\r\n\r\nSiemens Healthineers
      190. \r\n\r\n\r\nFinancial
      191. Overview
      192. \r\n\r\n\r\nProducts Offered
      193. \r\n\r\n\r\nKey
      194. Developments
      195. \r\n\r\n\r\nSWOT Analysis
      196. \r\n\r\n\r\nKey
      197. Strategies
      198. \r\n\r\n\r\n\r\n\r\n\r\n\r\nAppendix
      199. \r\n\r\n\r\nReferences
      200. \r\n\r\n\r\nRelated
      201. Reports
      202. \r\n\r\n\r\n\r\n\r\nLIST Of tables
      203. \r\n
      204. \r\n\r\n\r\nLIST
    7. OF ASSUMPTIONS
      1. \r\n\r\n\r\nNorth America Near Infrared Imaging Market
      2. SIZE ESTIMATES & FORECAST, BY APPLICATION, 2019-2035 (USD Billions)
      3. \r\n\r\n\r\nNorth
    8. America Near Infrared Imaging Market SIZE ESTIMATES & FORECAST, BY COMPONENT,
      1. \r\n\r\n\r\nNorth America Near Infrared
    9. Imaging Market SIZE ESTIMATES & FORECAST, BY END USE, 2019-2035 (USD Billions)
      1. \r\n\r\n\r\nNorth
    10. America Near Infrared Imaging Market SIZE ESTIMATES & FORECAST, BY TECHNOLOGY,
      1. \r\n\r\n\r\nNorth America Near Infrared
    11. Imaging Market SIZE ESTIMATES & FORECAST, BY REGIONAL, 2019-2035 (USD Billions)
      1. \r\n\r\n\r\nUS
    12. Near Infrared Imaging Market SIZE ESTIMATES & FORECAST, BY APPLICATION, 2019-2035
      1. (USD Billions)
      2. \r\n\r\n\r\nUS Near Infrared Imaging Market SIZE ESTIMATES
      3. & FORECAST, BY COMPONENT, 2019-2035 (USD Billions)
      4. \r\n\r\n\r\nUS
    13. Near Infrared Imaging Market SIZE ESTIMATES & FORECAST, BY END USE, 2019-2035
      1. (USD Billions)
      2. \r\n\r\n\r\nUS Near Infrared Imaging Market SIZE ESTIMATES
      3. & FORECAST, BY TECHNOLOGY, 2019-2035 (USD Billions)
      4. \r\n\r\n\r\nUS
    14. Near Infrared Imaging Market SIZE ESTIMATES & FORECAST, BY REGIONAL, 2019-2035
      1. (USD Billions)
      2. \r\n\r\n\r\nCanada Near Infrared Imaging Market SIZE
      3. ESTIMATES & FORECAST, BY APPLICATION, 2019-2035 (USD Billions)
      4. \r\n\r\n\r\nCanada
    15. Near Infrared Imaging Market SIZE ESTIMATES & FORECAST, BY COMPONENT, 2019-2035
      1. (USD Billions)
      2. \r\n\r\n\r\nCanada Near Infrared Imaging Market SIZE
      3. ESTIMATES & FORECAST, BY END USE, 2019-2035 (USD Billions)
      4. \r\n\r\n\r\nCanada
    16. Near Infrared Imaging Market SIZE ESTIMATES & FORECAST, BY TECHNOLOGY, 2019-2035
      1. (USD Billions)
      2. \r\n\r\n\r\nCanada Near Infrared Imaging Market SIZE
      3. ESTIMATES & FORECAST, BY REGIONAL, 2019-2035 (USD Billions)
      4. \r\n\r\n\r\nEurope
    17. Near Infrared Imaging Market SIZE ESTIMATES & FORECAST, BY APPLICATION, 2019-2035
      1. (USD Billions)
      2. \r\n\r\n\r\nEurope Near Infrared Imaging Market SIZE
      3. ESTIMATES & FORECAST, BY COMPONENT, 2019-2035 (USD Billions)
      4. \r\n\r\n\r\nEurope
    18. Near Infrared Imaging Market SIZE ESTIMATES & FORECAST, BY END USE, 2019-2035
      1. (USD Billions)
      2. \r\n\r\n\r\nEurope Near Infrared Imaging Market SIZE
      3. ESTIMATES & FORECAST, BY TECHNOLOGY, 2019-2035 (USD Billions)
      4. \r\n\r\n\r\nEurope
    19. Near Infrared Imaging Market SIZE ESTIMATES & FORECAST, BY REGIONAL, 2019-2035
      1. (USD Billions)
      2. \r\n\r\n\r\nGermany Near Infrared Imaging Market SIZE
      3. ESTIMATES & FORECAST, BY APPLICATION, 2019-2035 (USD Billions)
      4. \r\n\r\n\r\nGermany
    20. Near Infrared Imaging Market SIZE ESTIMATES & FORECAST, BY COMPONENT, 2019-2035
      1. (USD Billions)
      2. \r\n\r\n\r\nGermany Near Infrared Imaging Market SIZE
      3. ESTIMATES & FORECAST, BY END USE, 2019-2035 (USD Billions)
      4. \r\n\r\n\r\nGermany
    21. Near Infrared Imaging Market SIZE ESTIMATES & FORECAST, BY TECHNOLOGY, 2019-2035
      1. (USD Billions)
      2. \r\n\r\n\r\nGermany Near Infrared Imaging Market SIZE
      3. ESTIMATES & FORECAST, BY REGIONAL, 2019-2035 (USD Billions)
      4. \r\n\r\n\r\nUK
    22. Near Infrared Imaging Market SIZE ESTIMATES & FORECAST, BY APPLICATION, 2019-2035
      1. (USD Billions)
      2. \r\n\r\n\r\nUK Near Infrared Imaging Market SIZE ESTIMATES
      3. & FORECAST, BY COMPONENT, 2019-2035 (USD Billions)
      4. \r\n\r\n\r\nUK
    23. Near Infrared Imaging Market SIZE ESTIMATES & FORECAST, BY END USE, 2019-2035
      1. (USD Billions)
      2. \r\n\r\n\r\nUK Near Infrared Imaging Market SIZE ESTIMATES
      3. & FORECAST, BY TECHNOLOGY, 2019-2035 (USD Billions)
      4. \r\n\r\n\r\nUK
    24. Near Infrared Imaging Market SIZE ESTIMATES & FORECAST, BY REGIONAL, 2019-2035
      1. (USD Billions)
      2. \r\n\r\n\r\nFrance Near Infrared Imaging Market SIZE
      3. ESTIMATES & FORECAST, BY APPLICATION, 2019-2035 (USD Billions)
      4. \r\n\r\n\r\nFrance
    25. Near Infrared Imaging Market SIZE ESTIMATES & FORECAST, BY COMPONENT, 2019-2035
      1. (USD Billions)
      2. \r\n\r\n\r\nFrance Near Infrared Imaging Market SIZE
      3. ESTIMATES & FORECAST, BY END USE, 2019-2035 (USD Billions)
      4. \r\n\r\n\r\nFrance
    26. Near Infrared Imaging Market SIZE ESTIMATES & FORECAST, BY TECHNOLOGY, 2019-2035
      1. (USD Billions)
      2. \r\n\r\n\r\nFrance Near Infrared Imaging Market SIZE
      3. ESTIMATES & FORECAST, BY REGIONAL, 2019-2035 (USD Billions)
      4. \r\n\r\n\r\nRussia
    27. Near Infrared Imaging Market SIZE ESTIMATES & FORECAST, BY APPLICATION, 2019-2035
      1. (USD Billions)
      2. \r\n\r\n\r\nRussia Near Infrared Imaging Market SIZE
      3. ESTIMATES & FORECAST, BY COMPONENT, 2019-2035 (USD Billions)
      4. \r\n\r\n\r\nRussia
    28. Near Infrared Imaging Market SIZE ESTIMATES & FORECAST, BY END USE, 2019-2035
      1. (USD Billions)
      2. \r\n\r\n\r\nRussia Near Infrared Imaging Market SIZE
      3. ESTIMATES & FORECAST, BY TECHNOLOGY, 2019-2035 (USD Billions)
      4. \r\n\r\n\r\nRussia
    29. Near Infrared Imaging Market SIZE ESTIMATES & FORECAST, BY REGIONAL, 2019-2035
      1. (USD Billions)
      2. \r\n\r\n\r\nItaly Near Infrared Imaging Market SIZE
      3. ESTIMATES & FORECAST, BY APPLICATION, 2019-2035 (USD Billions)
      4. \r\n\r\n\r\nItaly
    30. Near Infrared Imaging Market SIZE ESTIMATES & FORECAST, BY COMPONENT, 2019-2035
      1. (USD Billions)
      2. \r\n\r\n\r\nItaly Near Infrared Imaging Market SIZE
      3. ESTIMATES & FORECAST, BY END USE, 2019-2035 (USD Billions)
      4. \r\n\r\n\r\nItaly
    31. Near Infrared Imaging Market SIZE ESTIMATES & FORECAST, BY TECHNOLOGY, 2019-2035
      1. (USD Billions)
      2. \r\n\r\n\r\nItaly Near Infrared Imaging Market SIZE
      3. ESTIMATES & FORECAST, BY REGIONAL, 2019-2035 (USD Billions)
      4. \r\n\r\n\r\nSpain
    32. Near Infrared Imaging Market SIZE ESTIMATES & FORECAST, BY APPLICATION, 2019-2035
      1. (USD Billions)
      2. \r\n\r\n\r\nSpain Near Infrared Imaging Market SIZE
      3. ESTIMATES & FORECAST, BY COMPONENT, 2019-2035 (USD Billions)
      4. \r\n\r\n\r\nSpain
    33. Near Infrared Imaging Market SIZE ESTIMATES & FORECAST, BY END USE, 2019-2035
      1. (USD Billions)
      2. \r\n\r\n\r\nSpain Near Infrared Imaging Market SIZE
      3. ESTIMATES & FORECAST, BY TECHNOLOGY, 2019-2035 (USD Billions)
      4. \r\n\r\n\r\nSpain
    34. Near Infrared Imaging Market SIZE ESTIMATES & FORECAST, BY REGIONAL, 2019-2035
      1. (USD Billions)
      2. \r\n\r\n\r\nRest of Europe Near Infrared Imaging Market
      3. SIZE ESTIMATES & FORECAST, BY APPLICATION, 2019-2035 (USD Billions)
      4. \r\n\r\n\r\nRest
    35. of Europe Near Infrared Imaging Market SIZE ESTIMATES & FORECAST, BY COMPONENT,
      1. \r\n\r\n\r\nRest of Europe Near Infrared
    36. Imaging Market SIZE ESTIMATES & FORECAST, BY END USE, 2019-2035 (USD Billions)
      1. \r\n\r\n\r\nRest
    37. of Europe Near Infrared Imaging Market SIZE ESTIMATES & FORECAST, BY TECHNOLOGY,
      1. \r\n\r\n\r\nRest of Europe Near Infrared
    38. Imaging Market SIZE ESTIMATES & FORECAST, BY REGIONAL, 2019-2035 (USD Billions)
      1. \r\n\r\n\r\nAPAC
    39. Near Infrared Imaging Market SIZE ESTIMATES & FORECAST, BY APPLICATION, 2019-2035
      1. (USD Billions)
      2. \r\n\r\n\r\nAPAC Near Infrared Imaging Market SIZE
      3. ESTIMATES & FORECAST, BY COMPONENT, 2019-2035 (USD Billions)
      4. \r\n\r\n\r\nAPAC
    40. Near Infrared Imaging Market SIZE ESTIMATES & FORECAST, BY END USE, 2019-2035
      1. (USD Billions)
      2. \r\n\r\n\r\nAPAC Near Infrared Imaging Market SIZE
      3. ESTIMATES & FORECAST, BY TECHNOLOGY, 2019-2035 (USD Billions)
      4. \r\n\r\n\r\nAPAC
    41. Near Infrared Imaging Market SIZE ESTIMATES & FORECAST, BY REGIONAL, 2019-2035
      1. (USD Billions)
      2. \r\n\r\n\r\nChina Near Infrared Imaging Market SIZE
      3. ESTIMATES & FORECAST, BY APPLICATION, 2019-2035 (USD Billions)
      4. \r\n\r\n\r\nChina
    42. Near Infrared Imaging Market SIZE ESTIMATES & FORECAST, BY COMPONENT, 2019-2035
      1. (USD Billions)
      2. \r\n\r\n\r\nChina Near Infrared Imaging Market SIZE
      3. ESTIMATES & FORECAST, BY END USE, 2019-2035 (USD Billions)
      4. \r\n\r\n\r\nChina
    43. Near Infrared Imaging Market SIZE ESTIMATES & FORECAST, BY TECHNOLOGY, 2019-2035
      1. (USD Billions)
      2. \r\n\r\n\r\nChina Near Infrared Imaging Market SIZE
      3. ESTIMATES & FORECAST, BY REGIONAL, 2019-2035 (USD Billions)
      4. \r\n\r\n\r\nIndia
    44. Near Infrared Imaging Market SIZE ESTIMATES & FORECAST, BY APPLICATION, 2019-2035
      1. (USD Billions)
      2. \r\n\r\n\r\nIndia Near Infrared Imaging Market SIZE
      3. ESTIMATES & FORECAST, BY COMPONENT, 2019-2035 (USD Billions)
      4. \r\n\r\n\r\nIndia
    45. Near Infrared Imaging Market SIZE ESTIMATES & FORECAST, BY END USE, 2019-2035
      1. (USD Billions)
      2. \r\n\r\n\r\nIndia Near Infrared Imaging Market SIZE
      3. ESTIMATES & FORECAST, BY TECHNOLOGY, 2019-2035 (USD Billions)
      4. \r\n\r\n\r\nIndia
    46. Near Infrared Imaging Market SIZE ESTIMATES & FORECAST, BY REGIONAL, 2019-2035
      1. (USD Billions)
      2. \r\n\r\n\r\nJapan Near Infrared Imaging Market SIZE
      3. ESTIMATES & FORECAST, BY APPLICATION, 2019-2035 (USD Billions)
      4. \r\n\r\n\r\nJapan
    47. Near Infrared Imaging Market SIZE ESTIMATES & FORECAST, BY COMPONENT, 2019-2035
      1. (USD Billions)
      2. \r\n\r\n\r\nJapan Near Infrared Imaging Market SIZE
      3. ESTIMATES & FORECAST, BY END USE, 2019-2035 (USD Billions)
      4. \r\n\r\n\r\nJapan
    48. Near Infrared Imaging Market SIZE ESTIMATES & FORECAST, BY TECHNOLOGY, 2019-2035
      1. (USD Billions)
      2. \r\n\r\n\r\nJapan Near Infrared Imaging Market SIZE
      3. ESTIMATES & FORECAST, BY REGIONAL, 2019-2035 (USD Billions)
      4. \r\n\r\n\r\nSouth
    49. Korea Near Infrared Imaging Market SIZE ESTIMATES & FORECAST, BY APPLICATION,
      1. \r\n\r\n\r\nSouth Korea Near Infrared Imaging
    50. Market SIZE ESTIMATES & FORECAST, BY COMPONENT, 2019-2035 (USD Billions)
      1. \r\n\r\n\r\nSouth
    51. Korea Near Infrared Imaging Market SIZE ESTIMATES & FORECAST, BY END USE, 2019-2035
      1. (USD Billions)
      2. \r\n\r\n\r\nSouth Korea Near Infrared Imaging Market
      3. SIZE ESTIMATES & FORECAST, BY TECHNOLOGY, 2019-2035 (USD Billions)
      4. \r\n\r\n\r\nSouth
    52. Korea Near Infrared Imaging Market SIZE ESTIMATES & FORECAST, BY REGIONAL, 2019-2035
      1. (USD Billions)
      2. \r\n\r\n\r\nMalaysia Near Infrared Imaging Market
      3. SIZE ESTIMATES & FORECAST, BY APPLICATION, 2019-2035 (USD Billions)
      4. \r\n\r\n\r\nMalaysia
    53. Near Infrared Imaging Market SIZE ESTIMATES & FORECAST, BY COMPONENT, 2019-2035
      1. (USD Billions)
      2. \r\n\r\n\r\nMalaysia Near Infrared Imaging Market
      3. SIZE ESTIMATES & FORECAST, BY END USE, 2019-2035 (USD Billions)
      4. \r\n\r\n\r\nMalaysia
    54. Near Infrared Imaging Market SIZE ESTIMATES & FORECAST, BY TECHNOLOGY, 2019-2035
      1. (USD Billions)
      2. \r\n\r\n\r\nMalaysia Near Infrared Imaging Market
      3. SIZE ESTIMATES & FORECAST, BY REGIONAL, 2019-2035 (USD Billions)
      4. \r\n\r\n\r\nThailand
    55. Near Infrared Imaging Market SIZE ESTIMATES & FORECAST, BY APPLICATION, 2019-2035
      1. (USD Billions)
      2. \r\n\r\n\r\nThailand Near Infrared Imaging Market
      3. SIZE ESTIMATES & FORECAST, BY COMPONENT, 2019-2035 (USD Billions)
      4. \r\n\r\n\r\nThailand
    56. Near Infrared Imaging Market SIZE ESTIMATES & FORECAST, BY END USE, 2019-2035
      1. (USD Billions)
      2. \r\n\r\n\r\nThailand Near Infrared Imaging Market
      3. SIZE ESTIMATES & FORECAST, BY TECHNOLOGY, 2019-2035 (USD Billions)
      4. \r\n\r\n\r\nThailand
    57. Near Infrared Imaging Market SIZE ESTIMATES & FORECAST, BY REGIONAL, 2019-2035
      1. (USD Billions)
      2. \r\n\r\n\r\nIndonesia Near Infrared Imaging Market
      3. SIZE ESTIMATES & FORECAST, BY APPLICATION, 2019-2035 (USD Billions)
      4. \r\n\r\n\r\nIndonesia
    58. Near Infrared Imaging Market SIZE ESTIMATES & FORECAST, BY COMPONENT, 2019-2035
      1. (USD Billions)
      2. \r\n\r\n\r\nIndonesia Near Infrared Imaging Market
      3. SIZE ESTIMATES & FORECAST, BY END USE, 2019-2035 (USD Billions)
      4. \r\n\r\n\r\nIndonesia
    59. Near Infrared Imaging Market SIZE ESTIMATES & FORECAST, BY TECHNOLOGY, 2019-2035
      1. (USD Billions)
      2. \r\n\r\n\r\nIndonesia Near Infrared Imaging Market
      3. SIZE ESTIMATES & FORECAST, BY REGIONAL, 2019-2035 (USD Billions)
      4. \r\n\r\n\r\nRest
    60. of APAC Near Infrared Imaging Market SIZE ESTIMATES & FORECAST, BY APPLICATION,
      1. \r\n\r\n\r\nRest of APAC Near Infrared Imaging
    61. Market SIZE ESTIMATES & FORECAST, BY COMPONENT, 2019-2035 (USD Billions)
      1. \r\n\r\n\r\nRest
    62. of APAC Near Infrared Imaging Market SIZE ESTIMATES & FORECAST, BY END USE,
      1. \r\n\r\n\r\nRest of APAC Near Infrared Imaging
    63. Market SIZE ESTIMATES & FORECAST, BY TECHNOLOGY, 2019-2035 (USD Billions)
      1. \r\n\r\n\r\nRest
    64. of APAC Near Infrared Imaging Market SIZE ESTIMATES & FORECAST, BY REGIONAL,
      1. \r\n\r\n\r\nSouth America Near Infrared
    65. Imaging Market SIZE ESTIMATES & FORECAST, BY APPLICATION, 2019-2035 (USD Billions)
      1. \r\n\r\n\r\nSouth
    66. America Near Infrared Imaging Market SIZE ESTIMATES & FORECAST, BY COMPONENT,
      1. \r\n\r\n\r\nSouth America Near Infrared
    67. Imaging Market SIZE ESTIMATES & FORECAST, BY END USE, 2019-2035 (USD Billions)
      1. \r\n\r\n\r\nSouth
    68. America Near Infrared Imaging Market SIZE ESTIMATES & FORECAST, BY TECHNOLOGY,
      1. \r\n\r\n\r\nSouth America Near Infrared
    69. Imaging Market SIZE ESTIMATES & FORECAST, BY REGIONAL, 2019-2035 (USD Billions)
      1. \r\n\r\n\r\nBrazil
    70. Near Infrared Imaging Market SIZE ESTIMATES & FORECAST, BY APPLICATION, 2019-2035
      1. (USD Billions)
      2. \r\n\r\n\r\nBrazil Near Infrared Imaging Market SIZE
      3. ESTIMATES & FORECAST, BY COMPONENT, 2019-2035 (USD Billions)
      4. \r\n\r\n\r\nBrazil
    71. Near Infrared Imaging Market SIZE ESTIMATES & FORECAST, BY END USE, 2019-2035
      1. (USD Billions)
      2. \r\n\r\n\r\nBrazil Near Infrared Imaging Market SIZE
      3. ESTIMATES & FORECAST, BY TECHNOLOGY, 2019-2035 (USD Billions)
      4. \r\n\r\n\r\nBrazil
    72. Near Infrared Imaging Market SIZE ESTIMATES & FORECAST, BY REGIONAL, 2019-2035
      1. (USD Billions)
      2. \r\n\r\n\r\nMexico Near Infrared Imaging Market SIZE
      3. ESTIMATES & FORECAST, BY APPLICATION, 2019-2035 (USD Billions)
      4. \r\n\r\n\r\nMexico
    73. Near Infrared Imaging Market SIZE ESTIMATES & FORECAST, BY COMPONENT, 2019-2035
      1. (USD Billions)
      2. \r\n\r\n\r\nMexico Near Infrared Imaging Market SIZE
      3. ESTIMATES & FORECAST, BY END USE, 2019-2035 (USD Billions)
      4. \r\n\r\n\r\nMexico
    74. Near Infrared Imaging Market SIZE ESTIMATES & FORECAST, BY TECHNOLOGY, 2019-2035
      1. (USD Billions)
      2. \r\n\r\n\r\nMexico Near Infrared Imaging Market SIZE
      3. ESTIMATES & FORECAST, BY REGIONAL, 2019-2035 (USD Billions)
      4. \r\n\r\n\r\nArgentina
    75. Near Infrared Imaging Market SIZE ESTIMATES & FORECAST, BY APPLICATION, 2019-2035
      1. (USD Billions)
      2. \r\n\r\n\r\nArgentina Near Infrared Imaging Market
      3. SIZE ESTIMATES & FORECAST, BY COMPONENT, 2019-2035 (USD Billions)
      4. \r\n\r\n\r\nArgentina
    76. Near Infrared Imaging Market SIZE ESTIMATES & FORECAST, BY END USE, 2019-2035
      1. (USD Billions)
      2. \r\n\r\n\r\nArgentina Near Infrared Imaging Market
      3. SIZE ESTIMATES & FORECAST, BY TECHNOLOGY, 2019-2035 (USD Billions)
      4. \r\n\r\n\r\nArgentina
    77. Near Infrared Imaging Market SIZE ESTIMATES & FORECAST, BY REGIONAL, 2019-2035
      1. (USD Billions)
      2. \r\n\r\n\r\nRest of South America Near Infrared Imaging
    78. Market SIZE ESTIMATES & FORECAST, BY APPLICATION, 2019-2035 (USD Billions)
      1. \r\n\r\n\r\nRest
      2. of South America Near Infrared Imaging Market SIZE ESTIMATES & FORECAST, BY
      3. COMPONENT, 2019-2035 (USD Billions)
      4. \r\n\r\n\r\nRest of South America
    79. Near Infrared Imaging Market SIZE ESTIMATES & FORECAST, BY END USE, 2019-2035
      1. (USD Billions)
      2. \r\n\r\n\r\nRest of South America Near Infrared Imaging
    80. Market SIZE ESTIMATES & FORECAST, BY TECHNOLOGY, 2019-2035 (USD Billions)
      1. \r\n\r\n\r\nRest
      2. of South America Near Infrared Imaging Market SIZE ESTIMATES & FORECAST, BY
      3. REGIONAL, 2019-2035 (USD Billions)
      4. \r\n\r\n\r\nMEA Near Infrared
    81. Imaging Market SIZE ESTIMATES & FORECAST, BY APPLICATION, 2019-2035 (USD Billions)
      1. \r\n\r\n\r\nMEA
    82. Near Infrared Imaging Market SIZE ESTIMATES & FORECAST, BY COMPONENT, 2019-2035
      1. (USD Billions)
      2. \r\n\r\n\r\nMEA Near Infrared Imaging Market SIZE
      3. ESTIMATES & FORECAST, BY END USE, 2019-2035 (USD Billions)
      4. \r\n\r\n\r\nMEA
    83. Near Infrared Imaging Market SIZE ESTIMATES & FORECAST, BY TECHNOLOGY, 2019-2035
      1. (USD Billions)
      2. \r\n\r\n\r\nMEA Near Infrared Imaging Market SIZE
      3. ESTIMATES & FORECAST, BY REGIONAL, 2019-2035 (USD Billions)
      4. \r\n\r\n\r\nGCC
    84. Countries Near Infrared Imaging Market SIZE ESTIMATES & FORECAST, BY APPLICATION,
      1. \r\n\r\n\r\nGCC Countries Near Infrared
    85. Imaging Market SIZE ESTIMATES & FORECAST, BY COMPONENT, 2019-2035 (USD Billions)
      1. \r\n\r\n\r\nGCC
    86. Countries Near Infrared Imaging Market SIZE ESTIMATES & FORECAST, BY END USE,
      1. \r\n\r\n\r\nGCC Countries Near Infrared
    87. Imaging Market SIZE ESTIMATES & FORECAST, BY TECHNOLOGY, 2019-2035 (USD Billions)
      1. \r\n\r\n\r\nGCC
    88. Countries Near Infrared Imaging Market SIZE ESTIMATES & FORECAST, BY REGIONAL,
      1. \r\n\r\n\r\nSouth Africa Near Infrared Imaging
    89. Market SIZE ESTIMATES & FORECAST, BY APPLICATION, 2019-2035 (USD Billions)
      1. \r\n\r\n\r\nSouth
    90. Africa Near Infrared Imaging Market SIZE ESTIMATES & FORECAST, BY COMPONENT,
      1. \r\n\r\n\r\nSouth Africa Near Infrared Imaging
    91. Market SIZE ESTIMATES & FORECAST, BY END USE, 2019-2035 (USD Billions)
      1. \r\n\r\n\r\nSouth
    92. Africa Near Infrared Imaging Market SIZE ESTIMATES & FORECAST, BY TECHNOLOGY,
      1. \r\n\r\n\r\nSouth Africa Near Infrared Imaging
    93. Market SIZE ESTIMATES & FORECAST, BY REGIONAL, 2019-2035 (USD Billions)
      1. \r\n\r\n\r\nRest
    94. of MEA Near Infrared Imaging Market SIZE ESTIMATES & FORECAST, BY APPLICATION,
      1. \r\n\r\n\r\nRest of MEA Near Infrared Imaging
    95. Market SIZE ESTIMATES & FORECAST, BY COMPONENT, 2019-2035 (USD Billions)
      1. \r\n\r\n\r\nRest
    96. of MEA Near Infrared Imaging Market SIZE ESTIMATES & FORECAST, BY END USE, 2019-2035
      1. (USD Billions)
      2. \r\n\r\n\r\nRest of MEA Near Infrared Imaging Market
      3. SIZE ESTIMATES & FORECAST, BY TECHNOLOGY, 2019-2035 (USD Billions)
      4. \r\n\r\n\r\nRest
    97. of MEA Near Infrared Imaging Market SIZE ESTIMATES & FORECAST, BY REGIONAL,
      1. \r\n\r\n\r\nPRODUCT LAUNCH/PRODUCT DEVELOPMENT/APPROVAL
      2. \r\n\r\n\r\nACQUISITION/PARTNERSHIP
      3. \r\n\r\n\r\n
      4. \r\n
      5. \r\n
      6. \r\n
      7. \r\n
      8. \r\n
      9. \r\n
      10. \r\n
      11. \r\n
      12. \r\n
      13. \r\n
      14. \r\n
      15. \r\n
      16. \r\n
      17. \r\n
      18. \r\n
      19. \r\n
      20. \r\n
      21. \r\n
      22. \r\n
      23. \r\n
      24. \r\n
      25. \r\n
      26. \r\n
      27. \r\n
      28. \r\n
      29. \r\n
      30. \r\n
      31. \r\n
      32. \r\nLIST
      33. Of figures
      34. \r\n
      35. \r\n\r\n\r\nMARKET SYNOPSIS
      36. \r\n\r\n\r\nNORTH
    98. AMERICA NEAR INFRARED IMAGING MARKET ANALYSIS
      1. \r\n\r\n\r\nUS NEAR
      2. INFRARED IMAGING MARKET ANALYSIS BY APPLICATION
      3. \r\n\r\n\r\nUS NEAR
      4. INFRARED IMAGING MARKET ANALYSIS BY COMPONENT
      5. \r\n\r\n\r\nUS NEAR
      6. INFRARED IMAGING MARKET ANALYSIS BY END USE
      7. \r\n\r\n\r\nUS NEAR INFRARED
      8. IMAGING MARKET ANALYSIS BY TECHNOLOGY
      9. \r\n\r\n\r\nUS NEAR INFRARED
      10. IMAGING MARKET ANALYSIS BY REGIONAL
      11. \r\n\r\n\r\nCANADA NEAR INFRARED
      12. IMAGING MARKET ANALYSIS BY APPLICATION
      13. \r\n\r\n\r\nCANADA NEAR INFRARED
      14. IMAGING MARKET ANALYSIS BY COMPONENT
      15. \r\n\r\n\r\nCANADA NEAR INFRARED
      16. IMAGING MARKET ANALYSIS BY END USE
      17. \r\n\r\n\r\nCANADA NEAR INFRARED
      18. IMAGING MARKET ANALYSIS BY TECHNOLOGY
      19. \r\n\r\n\r\nCANADA NEAR INFRARED
      20. IMAGING MARKET ANALYSIS BY REGIONAL
      21. \r\n\r\n\r\nEUROPE NEAR INFRARED
    99. IMAGING MARKET ANALYSIS
      1. \r\n\r\n\r\nGERMANY NEAR INFRARED IMAGING
      2. MARKET ANALYSIS BY APPLICATION
      3. \r\n\r\n\r\nGERMANY NEAR INFRARED
      4. IMAGING MARKET ANALYSIS BY COMPONENT
      5. \r\n\r\n\r\nGERMANY NEAR INFRARED
      6. IMAGING MARKET ANALYSIS BY END USE
      7. \r\n\r\n\r\nGERMANY NEAR INFRARED
      8. IMAGING MARKET ANALYSIS BY TECHNOLOGY
      9. \r\n\r\n\r\nGERMANY NEAR INFRARED
      10. IMAGING MARKET ANALYSIS BY REGIONAL
      11. \r\n\r\n\r\nUK NEAR INFRARED
      12. IMAGING MARKET ANALYSIS BY APPLICATION
      13. \r\n\r\n\r\nUK NEAR INFRARED
      14. IMAGING MARKET ANALYSIS BY COMPONENT
      15. \r\n\r\n\r\nUK NEAR INFRARED
      16. IMAGING MARKET ANALYSIS BY END USE
      17. \r\n\r\n\r\nUK NEAR INFRARED IMAGING
      18. MARKET ANALYSIS BY TECHNOLOGY
      19. \r\n\r\n\r\nUK NEAR INFRARED IMAGING
      20. MARKET ANALYSIS BY REGIONAL
      21. \r\n\r\n\r\nFRANCE NEAR INFRARED IMAGING
      22. MARKET ANALYSIS BY APPLICATION
      23. \r\n\r\n\r\nFRANCE NEAR INFRARED IMAGING
      24. MARKET ANALYSIS BY COMPONENT
      25. \r\n\r\n\r\nFRANCE NEAR INFRARED IMAGING
      26. MARKET ANALYSIS BY END USE
      27. \r\n\r\n\r\nFRANCE NEAR INFRARED IMAGING
      28. MARKET ANALYSIS BY TECHNOLOGY
      29. \r\n\r\n\r\nFRANCE NEAR INFRARED IMAGING
      30. MARKET ANALYSIS BY REGIONAL
      31. \r\n\r\n\r\nRUSSIA NEAR INFRARED IMAGING
      32. MARKET ANALYSIS BY APPLICATION
      33. \r\n\r\n\r\nRUSSIA NEAR INFRARED IMAGING
      34. MARKET ANALYSIS BY COMPONENT
      35. \r\n\r\n\r\nRUSSIA NEAR INFRARED IMAGING
      36. MARKET ANALYSIS BY END USE
      37. \r\n\r\n\r\nRUSSIA NEAR INFRARED IMAGING
      38. MARKET ANALYSIS BY TECHNOLOGY
      39. \r\n\r\n\r\nRUSSIA NEAR INFRARED IMAGING
      40. MARKET ANALYSIS BY REGIONAL
      41. \r\n\r\n\r\nITALY NEAR INFRARED IMAGING
      42. MARKET ANALYSIS BY APPLICATION
      43. \r\n\r\n\r\nITALY NEAR INFRARED IMAGING
      44. MARKET ANALYSIS BY COMPONENT
      45. \r\n\r\n\r\nITALY NEAR INFRARED IMAGING
      46. MARKET ANALYSIS BY END USE
      47. \r\n\r\n\r\nITALY NEAR INFRARED IMAGING
      48. MARKET ANALYSIS BY TECHNOLOGY
      49. \r\n\r\n\r\nITALY NEAR INFRARED IMAGING
      50. MARKET ANALYSIS BY REGIONAL
      51. \r\n\r\n\r\nSPAIN NEAR INFRARED IMAGING
      52. MARKET ANALYSIS BY APPLICATION
      53. \r\n\r\n\r\nSPAIN NEAR INFRARED IMAGING
      54. MARKET ANALYSIS BY COMPONENT
      55. \r\n\r\n\r\nSPAIN NEAR INFRARED IMAGING
      56. MARKET ANALYSIS BY END USE
      57. \r\n\r\n\r\nSPAIN NEAR INFRARED IMAGING
      58. MARKET ANALYSIS BY TECHNOLOGY
      59. \r\n\r\n\r\nSPAIN NEAR INFRARED IMAGING
      60. MARKET ANALYSIS BY REGIONAL
      61. \r\n\r\n\r\nREST OF EUROPE NEAR INFRARED
      62. IMAGING MARKET ANALYSIS BY APPLICATION
      63. \r\n\r\n\r\nREST OF EUROPE
      64. NEAR INFRARED IMAGING MARKET ANALYSIS BY COMPONENT
      65. \r\n\r\n\r\nREST
      66. OF EUROPE NEAR INFRARED IMAGING MARKET ANALYSIS BY END USE
      67. \r\n\r\n\r\nREST
      68. OF EUROPE NEAR INFRARED IMAGING MARKET ANALYSIS BY TECHNOLOGY
      69. \r\n\r\n\r\nREST
      70. OF EUROPE NEAR INFRARED IMAGING MARKET ANALYSIS BY REGIONAL
      71. \r\n\r\n\r\nAPAC
    100. NEAR INFRARED IMAGING MARKET ANALYSIS
      1. \r\n\r\n\r\nCHINA NEAR INFRARED
      2. IMAGING MARKET ANALYSIS BY APPLICATION
      3. \r\n\r\n\r\nCHINA NEAR INFRARED
      4. IMAGING MARKET ANALYSIS BY COMPONENT
      5. \r\n\r\n\r\nCHINA NEAR INFRARED
      6. IMAGING MARKET ANALYSIS BY END USE
      7. \r\n\r\n\r\nCHINA NEAR INFRARED
      8. IMAGING MARKET ANALYSIS BY TECHNOLOGY
      9. \r\n\r\n\r\nCHINA NEAR INFRARED
      10. IMAGING MARKET ANALYSIS BY REGIONAL
      11. \r\n\r\n\r\nINDIA NEAR INFRARED
      12. IMAGING MARKET ANALYSIS BY APPLICATION
      13. \r\n\r\n\r\nINDIA NEAR INFRARED
      14. IMAGING MARKET ANALYSIS BY COMPONENT
      15. \r\n\r\n\r\nINDIA NEAR INFRARED
      16. IMAGING MARKET ANALYSIS BY END USE
      17. \r\n\r\n\r\nINDIA NEAR INFRARED
      18. IMAGING MARKET ANALYSIS BY TECHNOLOGY
      19. \r\n\r\n\r\nINDIA NEAR INFRARED
      20. IMAGING MARKET ANALYSIS BY REGIONAL
      21. \r\n\r\n\r\nJAPAN NEAR INFRARED
      22. IMAGING MARKET ANALYSIS BY APPLICATION
      23. \r\n\r\n\r\nJAPAN NEAR INFRARED
      24. IMAGING MARKET ANALYSIS BY COMPONENT
      25. \r\n\r\n\r\nJAPAN NEAR INFRARED
      26. IMAGING MARKET ANALYSIS BY END USE
      27. \r\n\r\n\r\nJAPAN NEAR INFRARED
      28. IMAGING MARKET ANALYSIS BY TECHNOLOGY
      29. \r\n\r\n\r\nJAPAN NEAR INFRARED
      30. IMAGING MARKET ANALYSIS BY REGIONAL
      31. \r\n\r\n\r\nSOUTH KOREA NEAR
      32. INFRARED IMAGING MARKET ANALYSIS BY APPLICATION
      33. \r\n\r\n\r\nSOUTH
      34. KOREA NEAR INFRARED IMAGING MARKET ANALYSIS BY COMPONENT
      35. \r\n\r\n\r\nSOUTH
      36. KOREA NEAR INFRARED IMAGING MARKET ANALYSIS BY END USE
      37. \r\n\r\n\r\nSOUTH
      38. KOREA NEAR INFRARED IMAGING MARKET ANALYSIS BY TECHNOLOGY
      39. \r\n\r\n\r\nSOUTH
      40. KOREA NEAR INFRARED IMAGING MARKET ANALYSIS BY REGIONAL
      41. \r\n\r\n\r\nMALAYSIA
      42. NEAR INFRARED IMAGING MARKET ANALYSIS BY APPLICATION
      43. \r\n\r\n\r\nMALAYSIA
      44. NEAR INFRARED IMAGING MARKET ANALYSIS BY COMPONENT
      45. \r\n\r\n\r\nMALAYSIA
      46. NEAR INFRARED IMAGING MARKET ANALYSIS BY END USE
      47. \r\n\r\n\r\nMALAYSIA
      48. NEAR INFRARED IMAGING MARKET ANALYSIS BY TECHNOLOGY
      49. \r\n\r\n\r\nMALAYSIA
      50. NEAR INFRARED IMAGING MARKET ANALYSIS BY REGIONAL
      51. \r\n\r\n\r\nTHAILAND
      52. NEAR INFRARED IMAGING MARKET ANALYSIS BY APPLICATION
      53. \r\n\r\n\r\nTHAILAND
      54. NEAR INFRARED IMAGING MARKET ANALYSIS BY COMPONENT
      55. \r\n\r\n\r\nTHAILAND
      56. NEAR INFRARED IMAGING MARKET ANALYSIS BY END USE
      57. \r\n\r\n\r\nTHAILAND
      58. NEAR INFRARED IMAGING MARKET ANALYSIS BY TECHNOLOGY
      59. \r\n\r\n\r\nTHAILAND
      60. NEAR INFRARED IMAGING MARKET ANALYSIS BY REGIONAL
      61. \r\n\r\n\r\nINDONESIA
      62. NEAR INFRARED IMAGING MARKET ANALYSIS BY APPLICATION
      63. \r\n\r\n\r\nINDONESIA
      64. NEAR INFRARED IMAGING MARKET ANALYSIS BY COMPONENT
      65. \r\n\r\n\r\nINDONESIA
      66. NEAR INFRARED IMAGING MARKET ANALYSIS BY END USE
      67. \r\n\r\n\r\nINDONESIA
      68. NEAR INFRARED IMAGING MARKET ANALYSIS BY TECHNOLOGY
      69. \r\n\r\n\r\nINDONESIA
      70. NEAR INFRARED IMAGING MARKET ANALYSIS BY REGIONAL
      71. \r\n\r\n\r\nREST
      72. OF APAC NEAR INFRARED IMAGING MARKET ANALYSIS BY APPLICATION
      73. \r\n\r\n\r\nREST
      74. OF APAC NEAR INFRARED IMAGING MARKET ANALYSIS BY COMPONENT
      75. \r\n\r\n\r\nREST
      76. OF APAC NEAR INFRARED IMAGING MARKET ANALYSIS BY END USE
      77. \r\n\r\n\r\nREST
      78. OF APAC NEAR INFRARED IMAGING MARKET ANALYSIS BY TECHNOLOGY
      79. \r\n\r\n\r\nREST
      80. OF APAC NEAR INFRARED IMAGING MARKET ANALYSIS BY REGIONAL
      81. \r\n\r\n\r\nSOUTH
    101. AMERICA NEAR INFRARED IMAGING MARKET ANALYSIS
      1. \r\n\r\n\r\nBRAZIL
      2. NEAR INFRARED IMAGING MARKET ANALYSIS BY APPLICATION
      3. \r\n\r\n\r\nBRAZIL
      4. NEAR INFRARED IMAGING MARKET ANALYSIS BY COMPONENT
      5. \r\n\r\n\r\nBRAZIL
      6. NEAR INFRARED IMAGING MARKET ANALYSIS BY END USE
      7. \r\n\r\n\r\nBRAZIL
      8. NEAR INFRARED IMAGING MARKET ANALYSIS BY TECHNOLOGY
      9. \r\n\r\n\r\nBRAZIL
      10. NEAR INFRARED IMAGING MARKET ANALYSIS BY REGIONAL
      11. \r\n\r\n\r\nMEXICO
      12. NEAR INFRARED IMAGING MARKET ANALYSIS BY APPLICATION
      13. \r\n\r\n\r\nMEXICO
      14. NEAR INFRARED IMAGING MARKET ANALYSIS BY COMPONENT
      15. \r\n\r\n\r\nMEXICO
      16. NEAR INFRARED IMAGING MARKET ANALYSIS BY END USE
      17. \r\n\r\n\r\nMEXICO
      18. NEAR INFRARED IMAGING MARKET ANALYSIS BY TECHNOLOGY
      19. \r\n\r\n\r\nMEXICO
      20. NEAR INFRARED IMAGING MARKET ANALYSIS BY REGIONAL
      21. \r\n\r\n\r\nARGENTINA
      22. NEAR INFRARED IMAGING MARKET ANALYSIS BY APPLICATION
      23. \r\n\r\n\r\nARGENTINA
      24. NEAR INFRARED IMAGING MARKET ANALYSIS BY COMPONENT
      25. \r\n\r\n\r\nARGENTINA
      26. NEAR INFRARED IMAGING MARKET ANALYSIS BY END USE
      27. \r\n\r\n\r\nARGENTINA
      28. NEAR INFRARED IMAGING MARKET ANALYSIS BY TECHNOLOGY
      29. \r\n\r\n\r\nARGENTINA
      30. NEAR INFRARED IMAGING MARKET ANALYSIS BY REGIONAL
      31. \r\n\r\n\r\nREST
      32. OF SOUTH AMERICA NEAR INFRARED IMAGING MARKET ANALYSIS BY APPLICATION
      33. \r\n\r\n\r\nREST
      34. OF SOUTH AMERICA NEAR INFRARED IMAGING MARKET ANALYSIS BY COMPONENT
      35. \r\n\r\n\r\nREST
      36. OF SOUTH AMERICA NEAR INFRARED IMAGING MARKET ANALYSIS BY END USE
      37. \r\n\r\n\r\nREST
      38. OF SOUTH AMERICA NEAR INFRARED IMAGING MARKET ANALYSIS BY TECHNOLOGY
      39. \r\n\r\n\r\nREST
      40. OF SOUTH AMERICA NEAR INFRARED IMAGING MARKET ANALYSIS BY REGIONAL
      41. \r\n\r\n\r\nMEA
    102. NEAR INFRARED IMAGING MARKET ANALYSIS
      1. \r\n\r\n\r\nGCC COUNTRIES NEAR
      2. INFRARED IMAGING MARKET ANALYSIS BY APPLICATION
      3. \r\n\r\n\r\nGCC COUNTRIES
      4. NEAR INFRARED IMAGING MARKET ANALYSIS BY COMPONENT
      5. \r\n\r\n\r\nGCC
      6. COUNTRIES NEAR INFRARED IMAGING MARKET ANALYSIS BY END USE
      7. \r\n\r\n\r\nGCC
      8. COUNTRIES NEAR INFRARED IMAGING MARKET ANALYSIS BY TECHNOLOGY
      9. \r\n\r\n\r\nGCC
      10. COUNTRIES NEAR INFRARED IMAGING MARKET ANALYSIS BY REGIONAL
      11. \r\n\r\n\r\nSOUTH
      12. AFRICA NEAR INFRARED IMAGING MARKET ANALYSIS BY APPLICATION
      13. \r\n\r\n\r\nSOUTH
      14. AFRICA NEAR INFRARED IMAGING MARKET ANALYSIS BY COMPONENT
      15. \r\n\r\n\r\nSOUTH
      16. AFRICA NEAR INFRARED IMAGING MARKET ANALYSIS BY END USE
      17. \r\n\r\n\r\nSOUTH
      18. AFRICA NEAR INFRARED IMAGING MARKET ANALYSIS BY TECHNOLOGY
      19. \r\n\r\n\r\nSOUTH
      20. AFRICA NEAR INFRARED IMAGING MARKET ANALYSIS BY REGIONAL
      21. \r\n\r\n\r\nREST
      22. OF MEA NEAR INFRARED IMAGING MARKET ANALYSIS BY APPLICATION
      23. \r\n\r\n\r\nREST
      24. OF MEA NEAR INFRARED IMAGING MARKET ANALYSIS BY COMPONENT
      25. \r\n\r\n\r\nREST
      26. OF MEA NEAR INFRARED IMAGING MARKET ANALYSIS BY END USE
      27. \r\n\r\n\r\nREST
      28. OF MEA NEAR INFRARED IMAGING MARKET ANALYSIS BY TECHNOLOGY
      29. \r\n\r\n\r\nREST
      30. OF MEA NEAR INFRARED IMAGING MARKET ANALYSIS BY REGIONAL
      31. \r\n\r\n\r\nKEY
    103. BUYING CRITERIA OF NEAR INFRARED IMAGING MARKET
      1. \r\n\r\n\r\nRESEARCH
      2. PROCESS OF MRFR
      3. \r\n\r\n\r\nDRO ANALYSIS OF NEAR INFRARED IMAGING
      4. MARKET
      5. \r\n\r\n\r\nDRIVERS IMPACT ANALYSIS: NEAR INFRARED IMAGING
      6. MARKET
      7. \r\n\r\n\r\nRESTRAINTS IMPACT ANALYSIS: NEAR INFRARED IMAGING
      8. MARKET
      9. \r\n\r\n\r\nSUPPLY / VALUE CHAIN: NEAR INFRARED IMAGING MARKET
      10. \r\n\r\n\r\nNEAR
    104. INFRARED IMAGING MARKET, BY APPLICATION, 2025 (% SHARE)
      1. \r\n\r\n\r\nNEAR
    105. INFRARED IMAGING MARKET, BY APPLICATION, 2019 TO 2035 (USD Billions)
      1. \r\n\r\n\r\nNEAR
    106. INFRARED IMAGING MARKET, BY COMPONENT, 2025 (% SHARE)
      1. \r\n\r\n\r\nNEAR
    107. INFRARED IMAGING MARKET, BY COMPONENT, 2019 TO 2035 (USD Billions)
      1. \r\n\r\n\r\nNEAR
    108. INFRARED IMAGING MARKET, BY END USE, 2025 (% SHARE)
      1. \r\n\r\n\r\nNEAR
    109. INFRARED IMAGING MARKET, BY END USE, 2019 TO 2035 (USD Billions)
      1. \r\n\r\n\r\nNEAR
    110. INFRARED IMAGING MARKET, BY TECHNOLOGY, 2025 (% SHARE)
      1. \r\n\r\n\r\nNEAR
    111. INFRARED IMAGING MARKET, BY TECHNOLOGY, 2019 TO 2035 (USD Billions)
      1. \r\n\r\n\r\nNEAR
    112. INFRARED IMAGING MARKET, BY REGIONAL, 2025 (% SHARE)
      1. \r\n\r\n\r\nNEAR
    113. INFRARED IMAGING MARKET, BY REGIONAL, 2019 TO 2035 (USD Billions)
      1. \r\n\r\n\r\nBENCHMARKING
      2. OF MAJOR COMPETITORS
      3. \r\n\r\n\r\n

    Near Infrared Imaging Market Segmentation


    • Near Infrared Imaging Market By Application (USD Billion, 2019-2035)

      • Medical Diagnostics
      • Industrial Inspection
      • Agricultural Monitoring
      • Research and Development


    • Near Infrared Imaging Market By Component (USD Billion, 2019-2035)

      • Cameras
      • Lighting Systems
      • Software
      • Accessories


    • Near Infrared Imaging Market By End Use (USD Billion, 2019-2035)

      • Healthcare
      • Manufacturing
      • Agriculture
      • Research Institutions


    • Near Infrared Imaging Market By Technology (USD Billion, 2019-2035)

      • Hyperspectral Imaging
      • Multispectral Imaging
      • Thermal Imaging


    • Near Infrared Imaging Market By Regional (USD Billion, 2019-2035)

      • North America
      • Europe
      • South America
      • Asia Pacific
      • Middle East and Africa


    Near Infrared Imaging Market Regional Outlook (USD Billion, 2019-2035)


    • North America Outlook (USD Billion, 2019-2035)

      • North America Near Infrared Imaging Market by Application Type

        • Medical Diagnostics
        • Industrial Inspection
        • Agricultural Monitoring
        • Research and Development
      • North America Near Infrared Imaging Market by Component Type

        • Cameras
        • Lighting Systems
        • Software
        • Accessories
      • North America Near Infrared Imaging Market by End Use Type

        • Healthcare
        • Manufacturing
        • Agriculture
        • Research Institutions
      • North America Near Infrared Imaging Market by Technology Type

        • Hyperspectral Imaging
        • Multispectral Imaging
        • Thermal Imaging
      • North America Near Infrared Imaging Market by Regional Type

        • US
        • Canada
      • US Outlook (USD Billion, 2019-2035)
      • US Near Infrared Imaging Market by Application Type

        • Medical Diagnostics
        • Industrial Inspection
        • Agricultural Monitoring
        • Research and Development
      • US Near Infrared Imaging Market by Component Type

        • Cameras
        • Lighting Systems
        • Software
        • Accessories
      • US Near Infrared Imaging Market by End Use Type

        • Healthcare
        • Manufacturing
        • Agriculture
        • Research Institutions
      • US Near Infrared Imaging Market by Technology Type

        • Hyperspectral Imaging
        • Multispectral Imaging
        • Thermal Imaging
      • CANADA Outlook (USD Billion, 2019-2035)
      • CANADA Near Infrared Imaging Market by Application Type

        • Medical Diagnostics
        • Industrial Inspection
        • Agricultural Monitoring
        • Research and Development
      • CANADA Near Infrared Imaging Market by Component Type

        • Cameras
        • Lighting Systems
        • Software
        • Accessories
      • CANADA Near Infrared Imaging Market by End Use Type

        • Healthcare
        • Manufacturing
        • Agriculture
        • Research Institutions
      • CANADA Near Infrared Imaging Market by Technology Type

        • Hyperspectral Imaging
        • Multispectral Imaging
        • Thermal Imaging
    • Europe Outlook (USD Billion, 2019-2035)

      • Europe Near Infrared Imaging Market by Application Type

        • Medical Diagnostics
        • Industrial Inspection
        • Agricultural Monitoring
        • Research and Development
      • Europe Near Infrared Imaging Market by Component Type

        • Cameras
        • Lighting Systems
        • Software
        • Accessories
      • Europe Near Infrared Imaging Market by End Use Type

        • Healthcare
        • Manufacturing
        • Agriculture
        • Research Institutions
      • Europe Near Infrared Imaging Market by Technology Type

        • Hyperspectral Imaging
        • Multispectral Imaging
        • Thermal Imaging
      • Europe Near Infrared Imaging Market by Regional Type

        • Germany
        • UK
        • France
        • Russia
        • Italy
        • Spain
        • Rest of Europe
      • GERMANY Outlook (USD Billion, 2019-2035)
      • GERMANY Near Infrared Imaging Market by Application Type

        • Medical Diagnostics
        • Industrial Inspection
        • Agricultural Monitoring
        • Research and Development
      • GERMANY Near Infrared Imaging Market by Component Type

        • Cameras
        • Lighting Systems
        • Software
        • Accessories
      • GERMANY Near Infrared Imaging Market by End Use Type

        • Healthcare
        • Manufacturing
        • Agriculture
        • Research Institutions
      • GERMANY Near Infrared Imaging Market by Technology Type

        • Hyperspectral Imaging
        • Multispectral Imaging
        • Thermal Imaging
      • UK Outlook (USD Billion, 2019-2035)
      • UK Near Infrared Imaging Market by Application Type

        • Medical Diagnostics
        • Industrial Inspection
        • Agricultural Monitoring
        • Research and Development
      • UK Near Infrared Imaging Market by Component Type

        • Cameras
        • Lighting Systems
        • Software
        • Accessories
      • UK Near Infrared Imaging Market by End Use Type

        • Healthcare
        • Manufacturing
        • Agriculture
        • Research Institutions
      • UK Near Infrared Imaging Market by Technology Type

        • Hyperspectral Imaging
        • Multispectral Imaging
        • Thermal Imaging
      • FRANCE Outlook (USD Billion, 2019-2035)
      • FRANCE Near Infrared Imaging Market by Application Type

        • Medical Diagnostics
        • Industrial Inspection
        • Agricultural Monitoring
        • Research and Development
      • FRANCE Near Infrared Imaging Market by Component Type

        • Cameras
        • Lighting Systems
        • Software
        • Accessories
      • FRANCE Near Infrared Imaging Market by End Use Type

        • Healthcare
        • Manufacturing
        • Agriculture
        • Research Institutions
      • FRANCE Near Infrared Imaging Market by Technology Type

        • Hyperspectral Imaging
        • Multispectral Imaging
        • Thermal Imaging
      • RUSSIA Outlook (USD Billion, 2019-2035)
      • RUSSIA Near Infrared Imaging Market by Application Type

        • Medical Diagnostics
        • Industrial Inspection
        • Agricultural Monitoring
        • Research and Development
      • RUSSIA Near Infrared Imaging Market by Component Type

        • Cameras
        • Lighting Systems
        • Software
        • Accessories
      • RUSSIA Near Infrared Imaging Market by End Use Type

        • Healthcare
        • Manufacturing
        • Agriculture
        • Research Institutions
      • RUSSIA Near Infrared Imaging Market by Technology Type

        • Hyperspectral Imaging
        • Multispectral Imaging
        • Thermal Imaging
      • ITALY Outlook (USD Billion, 2019-2035)
      • ITALY Near Infrared Imaging Market by Application Type

        • Medical Diagnostics
        • Industrial Inspection
        • Agricultural Monitoring
        • Research and Development
      • ITALY Near Infrared Imaging Market by Component Type

        • Cameras
        • Lighting Systems
        • Software
        • Accessories
      • ITALY Near Infrared Imaging Market by End Use Type

        • Healthcare
        • Manufacturing
        • Agriculture
        • Research Institutions
      • ITALY Near Infrared Imaging Market by Technology Type

        • Hyperspectral Imaging
        • Multispectral Imaging
        • Thermal Imaging
      • SPAIN Outlook (USD Billion, 2019-2035)
      • SPAIN Near Infrared Imaging Market by Application Type

        • Medical Diagnostics
        • Industrial Inspection
        • Agricultural Monitoring
        • Research and Development
      • SPAIN Near Infrared Imaging Market by Component Type

        • Cameras
        • Lighting Systems
        • Software
        • Accessories
      • SPAIN Near Infrared Imaging Market by End Use Type

        • Healthcare
        • Manufacturing
        • Agriculture
        • Research Institutions
      • SPAIN Near Infrared Imaging Market by Technology Type

        • Hyperspectral Imaging
        • Multispectral Imaging
        • Thermal Imaging
      • REST OF EUROPE Outlook (USD Billion, 2019-2035)
      • REST OF EUROPE Near Infrared Imaging Market by Application Type

        • Medical Diagnostics
        • Industrial Inspection
        • Agricultural Monitoring
        • Research and Development
      • REST OF EUROPE Near Infrared Imaging Market by Component Type

        • Cameras
        • Lighting Systems
        • Software
        • Accessories
      • REST OF EUROPE Near Infrared Imaging Market by End Use Type

        • Healthcare
        • Manufacturing
        • Agriculture
        • Research Institutions
      • REST OF EUROPE Near Infrared Imaging Market by Technology Type

        • Hyperspectral Imaging
        • Multispectral Imaging
        • Thermal Imaging
    • APAC Outlook (USD Billion, 2019-2035)

      • APAC Near Infrared Imaging Market by Application Type

        • Medical Diagnostics
        • Industrial Inspection
        • Agricultural Monitoring
        • Research and Development
      • APAC Near Infrared Imaging Market by Component Type

        • Cameras
        • Lighting Systems
        • Software
        • Accessories
      • APAC Near Infrared Imaging Market by End Use Type

        • Healthcare
        • Manufacturing
        • Agriculture
        • Research Institutions
      • APAC Near Infrared Imaging Market by Technology Type

        • Hyperspectral Imaging
        • Multispectral Imaging
        • Thermal Imaging
      • APAC Near Infrared Imaging Market by Regional Type

        • China
        • India
        • Japan
        • South Korea
        • Malaysia
        • Thailand
        • Indonesia
        • Rest of APAC
      • CHINA Outlook (USD Billion, 2019-2035)
      • CHINA Near Infrared Imaging Market by Application Type

        • Medical Diagnostics
        • Industrial Inspection
        • Agricultural Monitoring
        • Research and Development
      • CHINA Near Infrared Imaging Market by Component Type

        • Cameras
        • Lighting Systems
        • Software
        • Accessories
      • CHINA Near Infrared Imaging Market by End Use Type

        • Healthcare
        • Manufacturing
        • Agriculture
        • Research Institutions
      • CHINA Near Infrared Imaging Market by Technology Type

        • Hyperspectral Imaging
        • Multispectral Imaging
        • Thermal Imaging
      • INDIA Outlook (USD Billion, 2019-2035)
      • INDIA Near Infrared Imaging Market by Application Type

        • Medical Diagnostics
        • Industrial Inspection
        • Agricultural Monitoring
        • Research and Development
      • INDIA Near Infrared Imaging Market by Component Type

        • Cameras
        • Lighting Systems
        • Software
        • Accessories
      • INDIA Near Infrared Imaging Market by End Use Type

        • Healthcare
        • Manufacturing
        • Agriculture
        • Research Institutions
      • INDIA Near Infrared Imaging Market by Technology Type

        • Hyperspectral Imaging
        • Multispectral Imaging
        • Thermal Imaging
      • JAPAN Outlook (USD Billion, 2019-2035)
      • JAPAN Near Infrared Imaging Market by Application Type

        • Medical Diagnostics
        • Industrial Inspection
        • Agricultural Monitoring
        • Research and Development
      • JAPAN Near Infrared Imaging Market by Component Type

        • Cameras
        • Lighting Systems
        • Software
        • Accessories
      • JAPAN Near Infrared Imaging Market by End Use Type

        • Healthcare
        • Manufacturing
        • Agriculture
        • Research Institutions
      • JAPAN Near Infrared Imaging Market by Technology Type

        • Hyperspectral Imaging
        • Multispectral Imaging
        • Thermal Imaging
      • SOUTH KOREA Outlook (USD Billion, 2019-2035)
      • SOUTH KOREA Near Infrared Imaging Market by Application Type

        • Medical Diagnostics
        • Industrial Inspection
        • Agricultural Monitoring
        • Research and Development
      • SOUTH KOREA Near Infrared Imaging Market by Component Type

        • Cameras
        • Lighting Systems
        • Software
        • Accessories
      • SOUTH KOREA Near Infrared Imaging Market by End Use Type

        • Healthcare
        • Manufacturing
        • Agriculture
        • Research Institutions
      • SOUTH KOREA Near Infrared Imaging Market by Technology Type

        • Hyperspectral Imaging
        • Multispectral Imaging
        • Thermal Imaging
      • MALAYSIA Outlook (USD Billion, 2019-2035)
      • MALAYSIA Near Infrared Imaging Market by Application Type

        • Medical Diagnostics
        • Industrial Inspection
        • Agricultural Monitoring
        • Research and Development
      • MALAYSIA Near Infrared Imaging Market by Component Type

        • Cameras
        • Lighting Systems
        • Software
        • Accessories
      • MALAYSIA Near Infrared Imaging Market by End Use Type

        • Healthcare
        • Manufacturing
        • Agriculture
        • Research Institutions
      • MALAYSIA Near Infrared Imaging Market by Technology Type

        • Hyperspectral Imaging
        • Multispectral Imaging
        • Thermal Imaging
      • THAILAND Outlook (USD Billion, 2019-2035)
      • THAILAND Near Infrared Imaging Market by Application Type

        • Medical Diagnostics
        • Industrial Inspection
        • Agricultural Monitoring
        • Research and Development
      • THAILAND Near Infrared Imaging Market by Component Type

        • Cameras
        • Lighting Systems
        • Software
        • Accessories
      • THAILAND Near Infrared Imaging Market by End Use Type

        • Healthcare
        • Manufacturing
        • Agriculture
        • Research Institutions
      • THAILAND Near Infrared Imaging Market by Technology Type

        • Hyperspectral Imaging
        • Multispectral Imaging
        • Thermal Imaging
      • INDONESIA Outlook (USD Billion, 2019-2035)
      • INDONESIA Near Infrared Imaging Market by Application Type

        • Medical Diagnostics
        • Industrial Inspection
        • Agricultural Monitoring
        • Research and Development
      • INDONESIA Near Infrared Imaging Market by Component Type

        • Cameras
        • Lighting Systems
        • Software
        • Accessories
      • INDONESIA Near Infrared Imaging Market by End Use Type

        • Healthcare
        • Manufacturing
        • Agriculture
        • Research Institutions
      • INDONESIA Near Infrared Imaging Market by Technology Type

        • Hyperspectral Imaging
        • Multispectral Imaging
        • Thermal Imaging
      • REST OF APAC Outlook (USD Billion, 2019-2035)
      • REST OF APAC Near Infrared Imaging Market by Application Type

        • Medical Diagnostics
        • Industrial Inspection
        • Agricultural Monitoring
        • Research and Development
      • REST OF APAC Near Infrared Imaging Market by Component Type

        • Cameras
        • Lighting Systems
        • Software
        • Accessories
      • REST OF APAC Near Infrared Imaging Market by End Use Type

        • Healthcare
        • Manufacturing
        • Agriculture
        • Research Institutions
      • REST OF APAC Near Infrared Imaging Market by Technology Type

        • Hyperspectral Imaging
        • Multispectral Imaging
        • Thermal Imaging
    • South America Outlook (USD Billion, 2019-2035)

      • South America Near Infrared Imaging Market by Application Type

        • Medical Diagnostics
        • Industrial Inspection
        • Agricultural Monitoring
        • Research and Development
      • South America Near Infrared Imaging Market by Component Type

        • Cameras
        • Lighting Systems
        • Software
        • Accessories
      • South America Near Infrared Imaging Market by End Use Type

        • Healthcare
        • Manufacturing
        • Agriculture
        • Research Institutions
      • South America Near Infrared Imaging Market by Technology Type

        • Hyperspectral Imaging
        • Multispectral Imaging
        • Thermal Imaging
      • South America Near Infrared Imaging Market by Regional Type

        • Brazil
        • Mexico
        • Argentina
        • Rest of South America
      • BRAZIL Outlook (USD Billion, 2019-2035)
      • BRAZIL Near Infrared Imaging Market by Application Type

        • Medical Diagnostics
        • Industrial Inspection
        • Agricultural Monitoring
        • Research and Development
      • BRAZIL Near Infrared Imaging Market by Component Type

        • Cameras
        • Lighting Systems
        • Software
        • Accessories
      • BRAZIL Near Infrared Imaging Market by End Use Type

        • Healthcare
        • Manufacturing
        • Agriculture
        • Research Institutions
      • BRAZIL Near Infrared Imaging Market by Technology Type

        • Hyperspectral Imaging
        • Multispectral Imaging
        • Thermal Imaging
      • MEXICO Outlook (USD Billion, 2019-2035)
      • MEXICO Near Infrared Imaging Market by Application Type

        • Medical Diagnostics
        • Industrial Inspection
        • Agricultural Monitoring
        • Research and Development
      • MEXICO Near Infrared Imaging Market by Component Type

        • Cameras
        • Lighting Systems
        • Software
        • Accessories
      • MEXICO Near Infrared Imaging Market by End Use Type

        • Healthcare
        • Manufacturing
        • Agriculture
        • Research Institutions
      • MEXICO Near Infrared Imaging Market by Technology Type

        • Hyperspectral Imaging
        • Multispectral Imaging
        • Thermal Imaging
      • ARGENTINA Outlook (USD Billion, 2019-2035)
      • ARGENTINA Near Infrared Imaging Market by Application Type

        • Medical Diagnostics
        • Industrial Inspection
        • Agricultural Monitoring
        • Research and Development
      • ARGENTINA Near Infrared Imaging Market by Component Type

        • Cameras
        • Lighting Systems
        • Software
        • Accessories
      • ARGENTINA Near Infrared Imaging Market by End Use Type

        • Healthcare
        • Manufacturing
        • Agriculture
        • Research Institutions
      • ARGENTINA Near Infrared Imaging Market by Technology Type

        • Hyperspectral Imaging
        • Multispectral Imaging
        • Thermal Imaging
      • REST OF SOUTH AMERICA Outlook (USD Billion, 2019-2035)
      • REST OF SOUTH AMERICA Near Infrared Imaging Market by Application Type

        • Medical Diagnostics
        • Industrial Inspection
        • Agricultural Monitoring
        • Research and Development
      • REST OF SOUTH AMERICA Near Infrared Imaging Market by Component Type

        • Cameras
        • Lighting Systems
        • Software
        • Accessories
      • REST OF SOUTH AMERICA Near Infrared Imaging Market by End Use Type

        • Healthcare
        • Manufacturing
        • Agriculture
        • Research Institutions
      • REST OF SOUTH AMERICA Near Infrared Imaging Market by Technology Type

        • Hyperspectral Imaging
        • Multispectral Imaging
        • Thermal Imaging
    • MEA Outlook (USD Billion, 2019-2035)

      • MEA Near Infrared Imaging Market by Application Type

        • Medical Diagnostics
        • Industrial Inspection
        • Agricultural Monitoring
        • Research and Development
      • MEA Near Infrared Imaging Market by Component Type

        • Cameras
        • Lighting Systems
        • Software
        • Accessories
      • MEA Near Infrared Imaging Market by End Use Type

        • Healthcare
        • Manufacturing
        • Agriculture
        • Research Institutions
      • MEA Near Infrared Imaging Market by Technology Type

        • Hyperspectral Imaging
        • Multispectral Imaging
        • Thermal Imaging
      • MEA Near Infrared Imaging Market by Regional Type

        • GCC Countries
        • South Africa
        • Rest of MEA
      • GCC COUNTRIES Outlook (USD Billion, 2019-2035)
      • GCC COUNTRIES Near Infrared Imaging Market by Application Type

        • Medical Diagnostics
        • Industrial Inspection
        • Agricultural Monitoring
        • Research and Development
      • GCC COUNTRIES Near Infrared Imaging Market by Component Type

        • Cameras
        • Lighting Systems
        • Software
        • Accessories
      • GCC COUNTRIES Near Infrared Imaging Market by End Use Type

        • Healthcare
        • Manufacturing
        • Agriculture
        • Research Institutions
      • GCC COUNTRIES Near Infrared Imaging Market by Technology Type

        • Hyperspectral Imaging
        • Multispectral Imaging
        • Thermal Imaging
      • SOUTH AFRICA Outlook (USD Billion, 2019-2035)
      • SOUTH AFRICA Near Infrared Imaging Market by Application Type

        • Medical Diagnostics
        • Industrial Inspection
        • Agricultural Monitoring
        • Research and Development
      • SOUTH AFRICA Near Infrared Imaging Market by Component Type

        • Cameras
        • Lighting Systems
        • Software
        • Accessories
      • SOUTH AFRICA Near Infrared Imaging Market by End Use Type

        • Healthcare
        • Manufacturing
        • Agriculture
        • Research Institutions
      • SOUTH AFRICA Near Infrared Imaging Market by Technology Type

        • Hyperspectral Imaging
        • Multispectral Imaging
        • Thermal Imaging
      • REST OF MEA Outlook (USD Billion, 2019-2035)
      • REST OF MEA Near Infrared Imaging Market by Application Type

        • Medical Diagnostics
        • Industrial Inspection
        • Agricultural Monitoring
        • Research and Development
      • REST OF MEA Near Infrared Imaging Market by Component Type

        • Cameras
        • Lighting Systems
        • Software
        • Accessories
      • REST OF MEA Near Infrared Imaging Market by End Use Type

        • Healthcare
        • Manufacturing
        • Agriculture
        • Research Institutions
      • REST OF MEA Near Infrared Imaging Market by Technology Type

        • Hyperspectral Imaging
        • Multispectral Imaging
        • Thermal Imaging


    Infographic

    Free Sample Request

    Kindly complete the form below to receive a free sample of this Report

    Get Free Sample

    Customer Strories

    “I am very pleased with how market segments have been defined in a relevant way for my purposes (such as "Portable Freezers & refrigerators" and "last-mile"). In general the report is well structured. Thanks very much for your efforts.”

    Victoria Milne

    Founder
    Case Study
    Chemicals and Materials

    Compare Licence

    ×
    Features License Type
    Single User Multiuser License Enterprise User
    Price $4,950 $5,950 $7,250
    Maximum User Access Limit 1 User Upto 10 Users Unrestricted Access Throughout the Organization
    Free Customization
    Direct Access to Analyst
    Deliverable Format
    Platform Access
    Discount on Next Purchase 10% 15% 15%
    Printable Versions