• Cat-intel
  • MedIntelliX
  • Resources
  • About Us
  • Request Free Sample ×

    Kindly complete the form below to receive a free sample of this Report

    Leading companies partner with us for data-driven Insights

    clients tt-cursor

    Mobile Mapping Market

    ID: MRFR/ICT/4292-CR
    186 Pages
    Aarti Dhapte
    November 2020

    Mobile Mapping Market Research Report Information By Component (Hardware, Software and Services), Solution (Location-Based, Indoor Mapping, Asset Management and 3D Mapping), Application (Land Surveys and Aerial Surveys), End-User (Real Estate & Construction, IT & Telecom and Others) And By Region (North America, Europe, Asia-Pacific, And Rest Of The World) –Market Forecast Till 2032.

    Share:
    Download PDF ×

    We do not share your information with anyone. However, we may send you emails based on your report interest from time to time. You may contact us at any time to opt-out.

    Mobile Mapping Market Research Report - Global Forecast till 2032 Infographic
    Purchase Options
    $ 4,950.0
    $ 5,950.0
    $ 7,250.0
    Table of Contents

    Mobile Mapping Market Summary

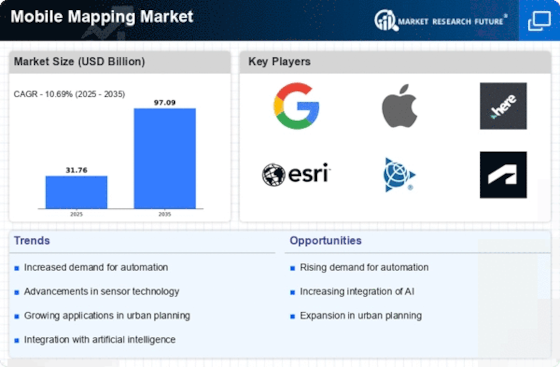
    The Global Mobile Mapping Market is projected to grow from 31.8 USD Billion in 2024 to 97.1 USD Billion by 2035, reflecting a robust growth trajectory.

    Key Market Trends & Highlights

    Mobile Mapping Key Trends and Highlights

    • The market is expected to experience a compound annual growth rate (CAGR) of 10.69 percent from 2025 to 2035.
    • By 2035, the market valuation is anticipated to reach 97.1 USD Billion, indicating strong demand for mobile mapping solutions.
    • In 2024, the market is valued at 31.8 USD Billion, showcasing a solid foundation for future growth.
    • Growing adoption of mobile mapping technology due to increasing demand for accurate geospatial data is a major market driver.

    Market Size & Forecast

    2024 Market Size 31.8 (USD Billion)
    2035 Market Size 97.1 (USD Billion)
    CAGR (2025-2035) 10.69%

    Major Players

    Leica Geosystems, Drivewyze Inc, Trimble Inc, Google, Mitsubishi Electric Corporation, Pasco Corporation, The Sanborn Map Company Inc., Huron Geomatics Inc, Topcon Corporation, 3D Laser Mapping, Apple Inc, NavVis, Telefonaktiebolaget LM Ericsson, NGC Aerospace Ltd, FARCO Technologies Inc, Microsoft Corporation, Hexagon AB, TomTom International BV, IGI GmbH

    Mobile Mapping Market Trends

    Growing use of AI is driving the market growth

    Market CAGR for mobile mapping is being driven by the rising use of Artificial Intelligence (AI). The navigation systems now utilized internationally are projected to change when augmented reality and mobile mapping technologies are integrated. The increased use of smartphones has given augmented reality technologies new areas of use. Users may examine information about an area in front of their mobile devices thanks to integrating data obtained through mobile mapping systems with augmented reality, letting them access the location specifics, like the street's name and other essential information. 

    Integrating geographical data obtained by mobile devices with this technology is being used to apply mobile augmented reality to navigation systems. Users of mobile AR navigation systems may view virtual worlds on their devices while navigating. These solutions give users more information about the items in their immediate surroundings, such as structures, telephone or electric poles, trees, signs, landmarks, and roadside furniture. Using information obtained from mobile mapping systems, AR also provides details such as measurements, sizes, and properties of the object existing in the users' surroundings.

    Additionally, augmented reality solutions may be applied to developing location intelligence, introducing high-resolution maps for autonomous vehicles, and producing live maps that alter themselves in response to changing environmental circumstances. Using mobile-mapped geographical data, augmented reality may also be used to construct exact 3D maps of locations and surroundings. Shortly, it is anticipated that developments in augmented reality and its integration with data produced by mobile mapping systems will change mapping and navigation systems. Mobile mapping technology has undergone a full transformation due to recent advancements in UAV technology and steep price declines for these vehicles.

    The primary uses of mobile mapping systems using UAVs are environmental detection and disaster monitoring. UAVs are the best option for data gathering in disaster-affected areas since they provide quick spatial information-collecting capabilities at a far lower cost than manned aerial mapping methods. In urban planning, 3D building modeling, archaeological documentation, pipeline inspection, environmental monitoring, infrastructure inventory and monitoring, landslide hazard assessment, open-pit mining, and indoor mapping, UAV-based modeling offers sizable advantages over conventional mapping techniques. The price of UAV mobile mapping systems has also decreased thanks to technological advancements, including low-cost, high-resolution digital cameras, laser scanners, and navigation systems.

    Thus, driving the Mobile Mapping market revenue.

    The Global Mobile Mapping Market is poised for robust growth, driven by advancements in technology and increasing demand for geospatial data across various sectors.

    U.S. Geological Survey

    Mobile Mapping Market Drivers

    Technological Advancements

    The Global Mobile Mapping Market Industry is experiencing rapid growth due to advancements in technology. Innovations in LiDAR, GPS, and imaging systems enhance the accuracy and efficiency of mapping processes. For instance, the integration of artificial intelligence in data processing allows for faster analysis and improved decision-making. As a result, the market is projected to reach 31.8 USD Billion in 2024, with a significant increase anticipated as technology continues to evolve. This trend suggests that companies investing in cutting-edge mobile mapping solutions are likely to gain a competitive edge, thereby driving market expansion.

    Market Segment Insights

    Mobile Mapping Component Insights

    The Mobile Mapping market segmentation, based on type, includes hardware, software and services. The hardware segment dominated the market, accounting for 45% of market revenue. Hardware elements installed on an aerial vehicle or a car are used to construct mobile mapping systems. On helicopters and backpacks, modern mobile mapping systems may also be attached. These hardware elements gather precise geographical data for various applications, including highway surveys, city modeling, and utility, environmental, and mapping projects.

    Mobile Mapping Solution Insights

    The Mobile Mapping market segmentation based on solutions includes location-based, indoor, asset management and 3D mapping. The location-based segment dominated the market. The location-based services include monitoring, tracking, navigation, and surveillance for mobile assets, including transport trucks and individual cars. It benefits the corporate and consumer industries by offering convenience, direction, security, and entertainment. If location-based services are integrated, mobile phones may utilize network-based technologies or inbuilt satellite receivers. Numerous industrial sectors employ location-based services, including government, transportation, healthcare, and education.

    Mobile Mapping Application Insights

    The Mobile Mapping market segmentation based on application includes land survey and aerial survey. The land surveys segment dominated the market. When doing a land survey, information is obtained using mobile mapping equipment, and it is then analyzed to identify the relative locations of existing points on the earth's surface. Certain agencies conduct surveys using various mapping tools and methods to find property lines, roads, buildings, watercourses, easements, and other ground features. Inertial navigation, cameras, GPS, and high-resolution lidar are all utilized in land surveying.

    Mobile Mapping End User Insights

    Based on End Users, the Mobile Mapping market segmentation includes real estate & construction, IT & telecom and others. The real estate & construction category generated the most income. Geospatial technologies are linked with tools like building information modeling (BIM) and virtual design and construction (VDC) to acquire and analyze infrastructure-related data for planning, constructing, maintaining, and renovating purposes. Airborne devices are fitted with lidar scanners to give customers a thorough and precise three-dimensional mapping of the targeted regions, such as lands and buildings.

    Figure 2: Mobile Mapping Market, by End User, 2022 & 2032 (USD Billion)

    Source: Secondary Research, Primary Research, Market Research Future Database and Analyst Review

    Get more detailed insights about Mobile Mapping Market Research Report - Global Forecast till 2032

    Regional Insights

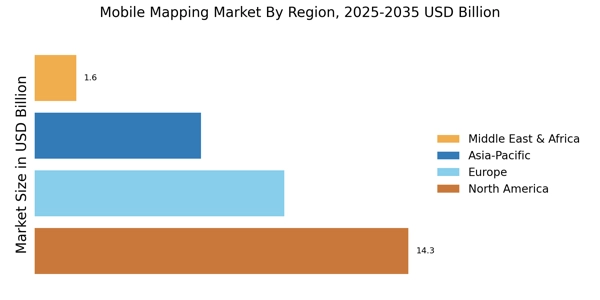
    By region, the study provides market insights into North America, Europe, Asia-Pacific and the Rest of the World. The North American Mobile Mapping market will dominate; the expansion in this area is also driven by the rising use of smartphones with Positioning Systems (GPS) in the US, Mexico, and Canada. Rapid developments in 3D mobile mapping software, image processing, and data processing in the North American area also contribute to expanding the regional market.

    Further, the major countries studied in the market report are The US, Canada, German, France, Spain, China, Japan, India, Australia, UK, Italy, South Korea, and Brazil.

    Figure 3: MOBILE MAPPING MARKET SHARE BY REGION 2022 (USD Billion)

    MOBILE MAPPING MARKET SHARE BY REGION

    Source: Secondary Research, Primary Research, Market Research Future Database and Analyst Review

    Europe has the second-largest market share for Mobile Mapping. The market expansion in the European area has been helped by using mobile mapping technology for various applications, including automated detection of traffic signals, road signs, pedestrian trails, and asset monitoring and management. Furthermore, the German Mobile Mapping market dominated, while the UK Mobile Mapping market grew fastest in Europe.

    From 2023 to 2032, the Asia-Pacific Mobile Mapping Market will develop at the quickest CAGR. Mobile mapping technology has seen strong demand in the Asia-Pacific region for use in smart highway systems, transportation systems, and land vehicle navigation. Additionally, the number of mobile mapping applications for location-based services has rapidly increased across the Asia-Pacific region. Furthermore, China's Mobile Mapping market had the highest market share, while India's Mobile Mapping market was the fastest expanding in the Asia-Pacific region.

    Key Players and Competitive Insights

    Leading market companies are extensively spending R&D on increasing their product lines, which will help the Mobile Mapping market grow even more. Important market developments include new product releases, contractual agreements, acquisitions and mergers, greater investments, and collaboration with other organizations. The Mobile Mapping industry must produce cost-effective merchandise to flourish and thrive in a more competitive and increasing market climate.

    Manufacturing locally to reduce operating costs is an effective business strategy manufacturers use in the worldwide Mobile Mapping industry to serve clients and expand the market sector. The Mobile Mapping industry has provided some of the most important benefits recently. Major players in the Mobile Mapping market, including Leica Geosystems, Drivewyze Inc and others, are attempting to increase market demand by investing in research and development operations.

    Leica Geosystems, which is situated in eastern Switzerland, produces products and systems for surveying and geographic measurement (geomatics). With the help of its products, users may represent existing buildings and terrains in computer-based systems with great accuracy—often under 1 cm. These technologies include GPS satellite navigation and laser rangefinders. In May 2022, Leica Geosystems introduced the Leica Pegasus TRK to its lineup of mobile mapping equipment. The Leica Pegasus TRK product uses dynamic laser scanning technology to quickly and accurately capture, measure, and visualize objects.

    The pioneer in connected truck services, Drivewyze Inc., is redefining efficiency and safety in transportation. With cutting-edge trucking services like Drivewyze PreClear shortcut, Drivewyze Safety Notifications, the Drivewyze Weigh Station Activity Report, and Drivewyze Insights, they support commercial drivers and fleets. Drivewyze services are provided via smartphones and tablets and built right into the ELDs and in-cab gadgets that carriers choose, like Omnitracs, PeopleNet, Transflo, Geotab, and others. In September 2022, In partnership with INRIX, a supplier of transportation analytics and connected car services, and the Pennsylvania Turnpike Commission, Drivewyze introduced real-time, in-cab traffic alerts.

    Key Companies in the Mobile Mapping Market market include

    Industry Developments

    • Q2 2024: Hexagon launches Leica Pegasus TRK100 mobile mapping solution Hexagon AB announced the launch of the Leica Pegasus TRK100, a new mobile mapping system designed for capturing geospatial data with enhanced efficiency and accuracy. The product is aimed at professionals in surveying, construction, and asset management.
    • Q1 2024: Trimble Introduces New Mobile Mapping System for Transportation Infrastructure Trimble unveiled a new mobile mapping system specifically designed for transportation infrastructure projects, offering improved data collection capabilities for road and rail asset management.
    • Q2 2024: Topcon Launches Next-Generation Mobile Mapping Platform Topcon Corporation announced the release of its next-generation mobile mapping platform, featuring advanced LiDAR and imaging technologies for enhanced geospatial data acquisition.
    • Q2 2024: Cyclomedia Expands Mobile Mapping Operations with New Facility in North America Cyclomedia Technology B.V. opened a new facility in North America to support its expanding mobile mapping operations and meet growing demand for high-resolution geospatial data services.
    • Q1 2024: Javad GNSS Announces Strategic Partnership with Geosystems for Mobile Mapping Solutions Javad GNSS Inc. entered into a strategic partnership with Geosystems to jointly develop and market advanced mobile mapping solutions targeting infrastructure and urban planning sectors.
    • Q2 2024: OpTech LLC Secures Major Contract for Mobile Mapping of State Highways OpTech LLC was awarded a significant contract to provide mobile mapping services for state highway infrastructure, focusing on asset inventory and condition assessment.
    • Q1 2024: Mitsubishi Corporation Invests in Mobile Mapping Startup for Smart City Applications Mitsubishi Corporation announced an investment in a mobile mapping startup to accelerate the development of smart city solutions leveraging advanced geospatial technologies.
    • Q2 2024: EveryScape Inc. Launches AI-Powered Mobile Mapping Platform EveryScape Inc. introduced a new AI-powered mobile mapping platform designed to automate geospatial data processing and improve mapping accuracy for urban environments.
    • Q1 2025: Hexagon AB Acquires Geospatial Startup to Enhance Mobile Mapping Capabilities Hexagon AB completed the acquisition of a geospatial technology startup to strengthen its mobile mapping product portfolio and accelerate innovation in 3D mapping solutions.
    • Q2 2025: Trimble Wins Contract for Mobile Mapping of National Rail Network Trimble Inc. secured a contract to provide mobile mapping services for a national rail network, supporting infrastructure monitoring and digital asset management.
    • Q1 2025: Topcon Corporation Appoints New Head of Mobile Mapping Division Topcon Corporation announced the appointment of a new executive to lead its mobile mapping division, aiming to drive growth and innovation in geospatial technologies.
    • Q2 2025: Cyclomedia Technology B.V. Partners with Municipalities for Urban Mobile Mapping Projects Cyclomedia Technology B.V. entered into partnerships with several municipalities to deliver urban mobile mapping projects focused on infrastructure planning and asset management.

    Future Outlook

    Mobile Mapping Market Future Outlook

    The Mobile Mapping Market is projected to grow at a 10.69% CAGR from 2024 to 2035, driven by advancements in technology, increasing demand for geospatial data, and urbanization.

    New opportunities lie in:

    • Develop AI-driven analytics tools for enhanced data interpretation.
    • Expand mobile mapping services to emerging markets with infrastructure needs.
    • Integrate mobile mapping with IoT for real-time data collection and analysis.

    By 2035, the Mobile Mapping Market is expected to be a pivotal component of geospatial technology, reflecting robust growth and innovation.

    Market Segmentation

    Mobile Mapping End-User Outlook

    • Real Estate & Construction
    • IT & Telecom
    • Others

    Mobile Mapping Regional Outlook

    • US
    • Canada

    Mobile Mapping Solution Outlook

    • Location-Based
    • Indoor Mapping
    • Asset Management
    • 3D Mapping

    Mobile Mapping Component Outlook

    • Hardware
    • Software
    • Services

    Mobile Mapping Application Outlook

    • Land Surveys
    • Aerial Surveys

    Report Scope

    Report Attribute/Metric Details
    Market Size 2023 USD 28.29 Billion
    Market Size 2024 USD 31.76 Billion
    Market Size 2032 USD 71.58 Billion
    Compound Annual Growth Rate (CAGR) 10.69% (2024-2032)
    Base Year 2023
    Market Forecast Period 2024-2032
    Historical Data 2018- 2022
    Market Forecast Units Value (USD Billion)
    Report Coverage Revenue Forecast, Market Competitive Landscape, Growth Factors, and Trends
    Segments Covered Type, End User, and Region
    Geographies Covered North America, Europe, Asia Pacific, and the Rest of the World
    Countries Covered The US, Canada, German, France, UK, Italy, Spain, China, Japan, India, Australia, South Korea, and Brazil
    Key Companies Profiled  Trimble Inc, Mitsubishi Electric Corporation, Google, Pasco Corporation, The Sanborn Map Company Inc., Huron Geomatics Inc, Topcon Corporation, 3D Laser Mapping, Apple Inc., NavVis, Telefonaktiebolaget LM Ericsson, NGC Aerospace Ltd, FARCO Technologies Inc, Microsoft Corporation, Hexagon AB, TomTom International BV, IGI GmbH, Hyper-Tech, and Gexcel.
    Key Market Opportunities Growing use of AI
    Key Market Dynamics Technology advancement

    Market Highlights

    Author
    Aarti Dhapte
    Team Lead - Research

    She holds an experience of about 6+ years in Market Research and Business Consulting, working under the spectrum of Information Communication Technology, Telecommunications and Semiconductor domains. Aarti conceptualizes and implements a scalable business strategy and provides strategic leadership to the clients. Her expertise lies in market estimation, competitive intelligence, pipeline analysis, customer assessment, etc.

    Leave a Comment

    FAQs

    How much is the Mobile Mapping market?

    The Mobile Mapping market size was valued at USD 28.29 Billion in 2023.

    What is the growth rate of the Mobile Mapping market?

    The market is projected to grow at a CAGR of 10.69% during the forecast period, 2024-2032.

    Which region held the largest market share in the Mobile Mapping market?

    North America had the largest share in the market

    Who are the key players in the Mobile Mapping market?

    The key players in the market are General Mills Inc., Amway, Conagra Brands Inc., Cargill Incorporated, Abbott Laboratories, Kraft Foods Group Inc., The Coca-Cola Company.

    Which type led the Mobile Mapping market?

    The beverage category dominated the market in 2022.

    Which End User had the largest market share in the Mobile Mapping market?

    The store based had the largest share in the market.

    1. '1 EXECUTIVE SUMMARY
      1. GLOBAL MOBILE
    2. MAPPING MARKET, BY COMPONENT 21
      1. GLOBAL MOBILE MAPPING MARKET, BY SOLUTION 22
      2. GLOBAL MOBILE
    3. MAPPING MARKET, BY APPLICATION 23
      1. GLOBAL MOBILE MAPPING MARKET, BY USER TYPE 24
      2. GLOBAL MOBILE
    4. MAPPING MARKET, BY END USER 25
      1. GLOBAL MOBILE MAPPING MARKET, BY REGION 26
    5. MARKET INTRODUCTION
      1. DEFINITION
    6. SCOPE OF THE STUDY 27
      1. RESEARCH OBJECTIVE 27
      2. MARKET STRUCTURE 28
    7. RESEARCH METHODOLOGY
      1. RESEARCH PROCESS 29
      2. PRIMARY RESEARCH 30
      3. SECONDARY RESEARCH 31
      4. MARKET SIZE ESTIMATION 32
      5. FORECAST MODEL
    8. MARKET DYNAMICS
      1. INTRODUCTION 35
      2. DRIVERS 36
        1. INCREASING AWARENESS REGARDING INVENTORY AND
    9. ASSET MANAGEMENT 36
      1. INCREASING PENETRATION OF MOBILE MAPPING DEVICES AND INFRASTRUCTURAL
    10. DEVELOPMENT OF TELECOMMUNICATION NETWORKS 36
      1. RESTRAINT 37
        1. SYSTEM LIMITATIONS 37
      2. OPPORTUNITY 37
        1. INTEGRATION
    11. OF MOBILE MAPPING SYSTEMS WITH WEARABLE DEVICES 37
      1. CHALLENGE 38
        1. CONCERNS RELATED TO LOCATION ACCURACY AND DATA
    12. QUALITY 38
    13. MARKET TRENDS 38
    14. AUGMENTED REALITY IN MOBILE MAPPING 38
      1. USE OF UNMANNED AERIAL VEHICLES (UAV) FOR MOBILE
    15. MAPPING 38
    16. THE IMPACT OF COVID-19 39
      1. OFFERINGS BY IT ENTERPRISES 39
        1. IMPACT ON SUPPLY CHAINS 39
        2. IMPACT ON DEMAND
    17. OF INDOOR MAPPING 39
    18. MARKET FACTOR ANALYSIS
      1. SUPPLY CHAIN ANALYTICS 40
        1. RAW MATERIAL SUPPLIERS
    19. MOBILE MAPPING COMPONENT PROVIDERS 40
      1. SOFTWARE DEVELOPERS 41
        1. END USERS 41
      2. PORTER’S
    20. FIVE FORCES MODEL 41
      1. THREAT OF NEW ENTRANTS 42
        1. BARGAINING POWER OF SUPPLIERS 42
        2. BARGAINING
    21. POWER OF BUYERS 42
      1. THREAT OF SUBSTITUTES 42
        1. INTENSITY OF RIVALRY 42
    22. GLOBAL MOBILE MAPPING MARKET,
    23. BY COMPONENT
    24. OVERVIEW 43
    25. GLOBAL MOBILE MAPPING MARKET, BY COMPONENT, 2020–2027 (USD MILLION) 43
      1. HARDWARE
    26. GLOBAL MOBILE MAPPING MARKET, BY HARDWARE, 2020–2027 (USD MILLION) 44
      1. CAMERAS
    27. SENSORS 45
    28. LASER SCANNERS 45
      1. OTHERS (POSITIONING DEVICES, STORAGE DEVICES) 45
        1. SOFTWARE
    29. SERVICES 46
    30. GLOBAL MOBILE MAPPING MARKET, BY SERVICES, 2020–2027 (USD MILLION) 46
      1. PROFESSIONAL
    31. MANAGED 46
    32. GLOBAL MOBILE MAPPING MARKET, BY SOLUTION
      1. OVERVIEW 47
        1. GLOBAL MOBILE MAPPING MARKET, BY SOLUTION,
    33. –2027 (USD MILLION) 47
      1. LOCATION BASED 48
        1. INDOOR MAPPING 48
        2. ASSET MANAGEMENT 48
        3. 3D MAPPING 48
        4. OTHERS (DISASTER
    34. RESPONSE SOLUTION, AND CRIME SCENE ANALYSIS) 48
    35. GLOBAL MOBILE MAPPING MARKET, BY APPLICATION
      1. OVERVIEW 49
        1. GLOBAL MOBILE
    36. MAPPING MARKET, BY APPLICATION, 2020–2027 (USD MILLION) 49
      1. LAND SURVEYS 50
        1. AERIAL SURVEYS
    37. BRIDGE PLANNING 50
      1. OTHERS 50
    38. GLOBAL MOBILE MAPPING MARKET, BY USER TYPE
      1. OVERVIEW 51
        1. GLOBAL MOBILE
    39. MAPPING MARKET, BY USER TYPE, 2020–2027 (USD MILLION) 51
      1. INDIVIDUALS 52
      2. ENTERPRISES
    40. GLOBAL MOBILE MAPPING MARKET, BY END-USER
      1. OVERVIEW 53
        1. GLOBAL MOBILE MAPPING MARKET, BY END-USER,
    41. –2027 (USD MILLION) 54
      1. REAL ESTATE & CONSTRUCTION 54
        1. AVIATION &
    42. AEROSPACE 54
    43. MINING 55
    44. IT & TELECOM 55
      1. MANUFACTURING 55
        1. AGRICULTURE 55
        2. ENERGY & POWER 55
        3. MARINE TRANSPORT 56
        4. HEALTHCARE
    45. MEDIA & ENTERTAINMENT 56
      1. OTHERS 56
    46. GLOBAL MOBILE MAPPING MARKET, BY REGION
      1. OVERVIEW 57
        1. GLOBAL MOBILE
    47. MAPPING MARKET, BY REGION, 2020–2027 (USD MILLION) 58
      1. NORTH AMERICA 59
        1. NORTH AMERICA:
    48. MOBILE MAPPING MARKET, BY COUNTRY, 2020–2027 (USD MILLION) 59
      1. NORTH AMERICA:
    49. MOBILE MAPPING MARKET, BY COMPONENT, 2020–2027 (USD MILLION) 60
      1. NORTH AMERICA
    50. MOBILE MAPPING MARKET, BY HARDWARE, 2020–2027 (USD MILLION) 61
      1. NORTH AMERICA
    51. MOBILE MAPPING MARKET, BY SERVICE, 2020–2027 (USD MILLION) 62
      1. NORTH AMERICA
    52. MOBILE MAPPING MARKET, BY SOLUTION, 2020–2027 (USD MILLION) 63
      1. NORTH AMERICA
    53. MOBILE MAPPING MARKET, BY APPLICATION, 2020–2027 (USD MILLION) 64
      1. NORTH AMERICA
    54. MOBILE MAPPING MARKET, BY USER TYPE, 2020–2027 (USD MILLION) 65
      1. NORTH AMERICA
    55. MOBILE MAPPING MARKET, BY END-USER, 2020–2027 (USD MILLION) 66
      1. US 67
        1. CANADA
    56. MEXICO 73
    57. EUROPE 76
    58. EUROPE: MOBILE MAPPING MARKET, BY COUNTRY, 2020–2027 (USD MILLION) 76
      1. EUROPE:
    59. MOBILE MAPPING MARKET, BY COMPONENT, 2020–2027 (USD MILLION) 77
      1. EUROPE:
    60. MOBILE MAPPING MARKET, BY HARDWARE, 2020–2027 (USD MILLION) 78
      1. EUROPE: MOBILE
    61. MAPPING MARKET, BY SERVICE, 2020–2027 (USD MILLION) 79
      1. EUROPE MOBILE MAPPING
    62. MARKET, BY SOLUTION, 2020–2027 (USD MILLION) 80
      1. EUROPE MOBILE MAPPING MARKET, BY APPLICATION,
    63. –2027 (USD MILLION) 81
      1. EUROPE MOBILE MAPPING MARKET, BY USER TYPE, 2020–2027
    64. (USD MILLION) 82
    65. EUROPE MOBILE MAPPING MARKET, BY END-USER, 2020–2027 (USD MILLION) 83
      1. UK 84
        1. GERMANY
    66. FRANCE 90
    67. THE NETHERLANDS 93
      1. SPAIN 96
        1. ITALY 99
        2. REST OF EUROPE 102
      2. ASIA-PACIFIC 105
        1. ASIA-PACIFIC:
    68. MOBILE MAPPING MARKET, BY COUNTRY, 2020–2027 (USD MILLION) 105
      1. ASIA-PACIFIC:
    69. MOBILE MAPPING MARKET, BY COMPONENT, 2020–2027 (USD MILLION) 106
      1. ASIA-PACIFIC:
    70. MOBILE MAPPING MARKET, BY HARDWARE, 2020–2027 (USD MILLION) 107
      1. ASIA-PACIFIC:
    71. MOBILE MAPPING MARKET, BY SERVICE, 2020–2027 (USD MILLION) 108
      1. ASIA-PACIFIC MOBILE
    72. MAPPING MARKET, BY SOLUTION, 2020–2027 (USD MILLION) 109
      1. ASIA-PACIFIC MOBILE MAPPING
    73. MARKET, BY APPLICATION, 2020–2027 (USD MILLION) 110
      1. ASIA-PACIFIC MOBILE MAPPING
    74. MARKET, BY USER TYPE, 2020–2027 (USD MILLION) 111
      1. ASIA-PACIFIC MOBILE MAPPING
    75. MARKET, BY END-USER, 2020–2027 (USD MILLION) 112
      1. CHINA 113
        1. JAPAN 116
        2. INDIA 119
        3. REST OF ASIA-PACIFIC 122
      2. REST OF THE WORLD
    76. REST OF THE WORLD: MOBILE MAPPING MARKET, BY COUNTRY, 2020–2027 (USD MILLION)
    77. REST OF THE WORLD: MOBILE MAPPING MARKET, BY COMPONENT, 2020–2027 (USD MILLION)
    78. REST OF THE WORLD: MOBILE MAPPING MARKET, BY HARDWARE, 2020–2027 (USD MILLION)
    79. REST OF THE WORLD: MOBILE MAPPING MARKET, BY SERVICE, 2020–2027 (USD MILLION)
    80. REST OF THE WORLD MOBILE MAPPING MARKET, BY SOLUTION, 2020–2027 (USD MILLION)
    81. REST OF THE WORLD MOBILE MAPPING MARKET, BY APPLICATION, 2020–2027 (USD MILLION)
    82. REST OF THE WORLD MOBILE MAPPING MARKET, BY USER TYPE, 2020–2027 (USD MILLION)
    83. REST OF THE WORLD MOBILE MAPPING MARKET, BY END-USER, 2020–2027 (USD MILLION)
    84. THE MIDDLE EAST & AFRICA 133
      1. SOUTH AMERICA 136
    85. COMPETITIVE LANDSCAPE
      1. COMPETITIVE OVERVIEW 139
        1. VENDOR SHARE
    86. ANALYSIS 139
    87. COMPETITOR DASHBOARD 141
      1. COMPETITOR DASHBOARD 142
      2. KEY DEVELOPMENTS & GROWTH STRATEGIES 143
        1. PRODUCT
    88. DEVELOPMENT 143
    89. MERGERS, ACQUISITIONS, AND PARTNERSHIPS 144
    90. COMPANY PROFILES
      1. TRIMBLE INC. 146
        1. COMPANY OVERVIEW 146
        2. FINANCIAL OVERVIEW 147
        3. PRODUCTS/SOLUTIONS/SERVICES
    91. OFFERED 147
    92. KEY DEVELOPMENTS 148
      1. SWOT ANALYSIS 148
        1. KEY STRATEGIES 149
      2. HEXAGON AB 150
        1. COMPANY
    93. OVERVIEW 150
    94. FINANCIAL OVERVIEW 150
      1. PRODUCTS/SOLUTIONS/SERVICES OFFERED 151
        1. KEY DEVELOPMENTS 151
        2. SWOT ANALYSIS
    95. KEY STRATEGIES 152
      1. GOOGLE INC. 153
        1. COMPANY OVERVIEW 153
        2. FINANCIAL OVERVIEW 153
        3. PRODUCTS/SOLUTIONS/SERVICES
    96. OFFERED 154
    97. KEY DEVELOPMENTS 154
      1. SWOT ANALYSIS 154
        1. KEY STRATEGIES 155
      2. APPLE INC. 156
        1. COMPANY
    98. OVERVIEW 156
    99. FINANCIAL OVERVIEW 156
      1. PRODUCTS/SOLUTIONS/SERVICES OFFERED 157
        1. KEY DEVELOPMENTS 157
        2. SWOT ANALYSIS
    100. KEY STRATEGIES 158
      1. MITSUBISHI ELECTRIC CORPORATION 159
        1. COMPANY OVERVIEW 159
        2. FINANCIAL OVERVIEW 159
        3. PRODUCTS/SOLUTIONS/SERVICES
    101. OFFERED 160
    102. KEY DEVELOPMENTS 160
      1. SWOT ANALYSIS 160
        1. KEY STRATEGIES 161
      2. MICROSOFT CORPORATION 162
        1. COMPANY
    103. OVERVIEW 162
    104. FINANCIAL OVERVIEW 162
      1. PRODUCTS/SOLUTIONS/SERVICES OFFERED 163
        1. KEY DEVELOPMENTS 163
        2. SWOT ANALYSIS
    105. KEY STRATEGIES 164
      1. TELEFONAKTIEBOLAGET LM ERICSSON 165
        1. COMPANY OVERVIEW 165
        2. FINANCIAL OVERVIEW 165
        3. PRODUCTS/SOLUTIONS/SERVICES
    106. OFFERED 166
    107. KEY DEVELOPMENTS 166
      1. SWOT ANALYSIS 166
        1. KEY STRATEGIES 166
      2. TOPCON CORPORATION 167
        1. COMPANY
    108. OVERVIEW 167
    109. FINANCIAL OVERVIEW 167
      1. PRODUCTS/SOLUTIONS/SERVICES OFFERED 168
        1. KEY DEVELOPMENTS 168
        2. SWOT ANALYSIS
    110. KEY STRATEGIES 168
      1. TOMTOM INTERNATIONAL BV 169
        1. COMPANY OVERVIEW 169
        2. FINANCIAL OVERVIEW 169
        3. PRODUCTS/SOLUTIONS/SERVICES
    111. OFFERED 170
    112. KEY DEVELOPMENTS 170
      1. SWOT ANALYSIS 170
        1. KEY STRATEGIES 171
      2. FARCO TECHNOLOGIES 172
        1. COMPANY
    113. OVERVIEW 172
    114. FINANCIAL OVERVIEW 172
      1. PRODUCTS/SOLUTIONS/SERVICES OFFERED 173
        1. KEY DEVELOPMENTS 173
        2. SWOT ANALYSIS
    115. KEY STRATEGIES 173
      1. PASCO CORPORATION 174
        1. COMPANY OVERVIEW 174
        2. FINANCIAL OVERVIEW 174
        3. PRODUCTS/SOLUTIONS/SERVICES
    116. OFFERED 174
    117. KEY DEVELOPMENTS 174
      1. KEY STRATEGIES 174
      2. HURON GEOMATICS INC. 175
        1. COMPANY OVERVIEW 175
        2. FINANCIAL
    118. OVERVIEW 175
    119. PRODUCTS/SOLUTIONS/SERVICES OFFERED 175
      1. KEY DEVELOPMENTS 175
        1. KEY STRATEGIES 175
      2. IGI MBH 176
        1. COMPANY
    120. OVERVIEW 176
    121. FINANCIAL OVERVIEW 176
      1. PRODUCTS/SOLUTIONS/SERVICES OFFERED 176
        1. KEY DEVELOPMENTS 176
        2. KEY STRATEGIES
    122. HYPER TECH 177
    123. COMPANY OVERVIEW 177
      1. FINANCIAL OVERVIEW 177
        1. PRODUCTS/SOLUTIONS/SERVICES OFFERED 177
        2. KEY DEVELOPMENTS
    124. GEXCEL SRL 178
    125. COMPANY OVERVIEW 178
      1. FINANCIAL OVERVIEW 178
        1. PRODUCTS/SOLUTIONS/SERVICES OFFERED 178
        2. KEY DEVELOPMENTS
    126. KEY STRATEGIES 179
      1. THE SANBORN MAP COMPANY INC. 180
        1. COMPANY OVERVIEW 180
        2. FINANCIAL OVERVIEW 180
        3. PRODUCTS/SOLUTIONS/SERVICES
    127. OFFERED 180
    128. KEY DEVELOPMENTS 180
      1. KEY STRATEGIES 181
      2. 3D LASER MAPPING (GEOSLAM) 182
        1. COMPANY OVERVIEW
    129. FINANCIAL OVERVIEW 182
      1. PRODUCTS/SOLUTIONS/SERVICES OFFERED 182
        1. KEY DEVELOPMENTS 182
        2. KEY STRATEGIES
    130. NAVVIS 183
    131. COMPANY OVERVIEW 183
      1. FINANCIAL OVERVIEW 183
        1. PRODUCTS/SOLUTIONS/SERVICES OFFERED 183
        2. KEY DEVELOPMENTS
    132. KEY STRATEGIES 184
      1. NGC AEROSPACE LTD 185
        1. COMPANY OVERVIEW 185
        2. FINANCIAL OVERVIEW 185
        3. PRODUCTS/SOLUTIONS/SERVICES
    133. OFFERED 185
    134. KEY DEVELOPMENTS 185
      1. KEY STRATEGIES 185
    135. LIST OF TABLES
    136. MOBILE MAPPING MARKET, BY COMPONENT, 2020–2027 (USD MILLION) 43

    Mobile Mapping Market Segmentation

    Mobile Mapping Component Outlook (USD Billion, 2018-2032)

    • Hardware
    • Software
    • Services

    Mobile Mapping Solution Outlook (USD Billion, 2018-2032)

    • Location-Based
    • Indoor Mapping
    • Asset Management
    • 3D Mapping

    Mobile Mapping Application Outlook (USD Billion, 2018-2032)

    • Land Surveys
    • Aerial Surveys

    Mobile Mapping End-User Outlook (USD Billion, 2018-2032)

    • Real Estate & Construction
    • IT & Telecom
    • Others

    Mobile Mapping Regional Outlook (USD Billion, 2018-2032)

    • North America Outlook (USD Billion, 2018-2032)

      • North America Mobile Mapping by Component
        • Hardware
        • Software
        • Services
      • North America Mobile Mapping by Solution
        • Location-Based
        • Indoor Mapping
        • Asset Management
        • 3D Mapping
      • North America Mobile Mapping by Application
        • Land Surveys
        • Aerial Surveys
      • North America Mobile Mapping by End-User
        • Real Estate & Construction
        • IT & Telecom
        • Others
      • US Outlook (USD Billion, 2018-2032)

      • US Mobile Mapping by Component
        • Hardware
        • Software
        • Services
      • US Mobile Mapping by Solution
        • Location-Based
        • Indoor Mapping
        • Asset Management
        • 3D Mapping
      • US Mobile Mapping by Application
        • Land Surveys
        • Aerial Surveys
      • US Mobile Mapping by End-User
        • Real Estate & Construction
        • IT & Telecom
        • Others
      • CANADA Outlook (USD Billion, 2018-2032)

      • CANADA Mobile Mapping by Component
        • Hardware
        • Software
        • Services
      • CANADA Mobile Mapping by Solution
        • Location-Based
        • Indoor Mapping
        • Asset Management
        • 3D Mapping
      • CANADA Mobile Mapping by Application
        • Land Surveys
        • Aerial Surveys
      • CANADA Mobile Mapping by End-User
        • Real Estate & Construction
        • IT & Telecom
        • Others
    • Europe Outlook (USD Billion, 2018-2032)

      • Europe Mobile Mapping by Component
        • Hardware
        • Software
        • Services
      • Europe Mobile Mapping by Solution
        • Location-Based
        • Indoor Mapping
        • Asset Management
        • 3D Mapping
      • Europe Mobile Mapping by Application
        • Land Surveys
        • Aerial Surveys
      • Europe Mobile Mapping by End-User
        • Real Estate & Construction
        • IT & Telecom
        • Others
      • Germany Outlook (USD Billion, 2018-2032)

      • Germany Mobile Mapping by Component
        • Hardware
        • Software
        • Services
      • Germany Mobile Mapping by Solution
        • Location-Based
        • Indoor Mapping
        • Asset Management
        • 3D Mapping
      • Germany Mobile Mapping by Application
        • Land Surveys
        • Aerial Surveys
      • Germany Mobile Mapping by End-User
        • Real Estate & Construction
        • IT & Telecom
        • Others
      • France Outlook (USD Billion, 2018-2032)

      • France Mobile Mapping by Component
        • Hardware
        • Software
        • Services
      • France Mobile Mapping by Solution
        • Location-Based
        • Indoor Mapping
        • Asset Management
        • 3D Mapping
      • France Mobile Mapping by Application
        • Land Surveys
        • Aerial Surveys
      • France Mobile Mapping by End-User
        • Real Estate & Construction
        • IT & Telecom
        • Others
      • UK Outlook (USD Billion, 2018-2032)

      • UK Mobile Mapping by Component
        • Hardware
        • Software
        • Services
      • UK Mobile Mapping by Solution
        • Location-Based
        • Indoor Mapping
        • Asset Management
        • 3D Mapping
      • UK Mobile Mapping by Application
        • Land Surveys
        • Aerial Surveys
      • UK Mobile Mapping by End-User
        • Real Estate & Construction
        • IT & Telecom
        • Others
      • ITALY Outlook (USD Billion, 2018-2032)

      • ITALY Mobile Mapping by Component
        • Hardware
        • Software
        • Services
      • ITALY Mobile Mapping by Solution
        • Location-Based
        • Indoor Mapping
        • Asset Management
        • 3D Mapping
      • ITALY Mobile Mapping by Application
        • Land Surveys
        • Aerial Surveys
      • ITALY Mobile Mapping by End-User
        • Real Estate & Construction
        • IT & Telecom
        • Others
      • SPAIN Outlook (USD Billion, 2018-2032)

      • Spain Mobile Mapping by Component
        • Hardware
        • Software
        • Services
      • Spain Mobile Mapping by Solution
        • Location-Based
        • Indoor Mapping
        • Asset Management
        • 3D Mapping
      • Spain Mobile Mapping by Application
        • Land Surveys
        • Aerial Surveys
      • Spain Mobile Mapping by End-User
        • Real Estate & Construction
        • IT & Telecom
        • Others
      • Rest Of Europe Outlook (USD Billion, 2018-2032)

      • Rest Of Europe Mobile Mapping by Component
        • Hardware
        • Software
        • Services
      • Rest Of Europe Mobile Mapping by Solution
        • Location-Based
        • Indoor Mapping
        • Asset Management
        • 3D Mapping
      • Rest Of Europe Mobile Mapping by Application
        • Land Surveys
        • Aerial Surveys
      • Rest Of Europe Mobile Mapping by End-User
        • Real Estate & Construction
        • IT & Telecom
        • Others
    • Asia-Pacific Outlook (USD Billion, 2018-2032)

      • Asia-Pacific Mobile Mapping by Component
        • Hardware
        • Software
        • Services
      • Asia-Pacific Mobile Mapping by Solution
        • Location-Based
        • Indoor Mapping
        • Asset Management
        • 3D Mapping
      • Asia-Pacific Mobile Mapping by Application
        • Land Surveys
        • Aerial Surveys
      • Asia-Pacific Mobile Mapping by End-User
        • Real Estate & Construction
        • IT & Telecom
        • Others
      • China Outlook (USD Billion, 2018-2032)

      • China Mobile Mapping by Component
        • Hardware
        • Software
        • Services
      • China Mobile Mapping by Solution
        • Location-Based
        • Indoor Mapping
        • Asset Management
        • 3D Mapping
      • China Mobile Mapping by Application
        • Land Surveys
        • Aerial Surveys
      • China Mobile Mapping by End-User
        • Real Estate & Construction
        • IT & Telecom
        • Others
      • Japan Outlook (USD Billion, 2018-2032)

      • Japan Mobile Mapping by Component
        • Hardware
        • Software
        • Services
      • Japan Mobile Mapping by Solution
        • Location-Based
        • Indoor Mapping
        • Asset Management
        • 3D Mapping
      • Japan Mobile Mapping by Application
        • Land Surveys
        • Aerial Surveys
      • Japan Mobile Mapping by End-User
        • Real Estate & Construction
        • IT & Telecom
        • Others
      • India Outlook (USD Billion, 2018-2032)

      • India Mobile Mapping by Component
        • Hardware
        • Software
        • Services
      • India Mobile Mapping by Solution
        • Location-Based
        • Indoor Mapping
        • Asset Management
        • 3D Mapping
      • India Mobile Mapping by Application
        • Land Surveys
        • Aerial Surveys
      • India Mobile Mapping by End-User
        • Real Estate & Construction
        • IT & Telecom
        • Others
      • Australia Outlook (USD Billion, 2018-2032)

      • Australia Mobile Mapping by Component
        • Hardware
        • Software
        • Services
      • Australia Mobile Mapping by Solution
        • Location-Based
        • Indoor Mapping
        • Asset Management
        • 3D Mapping
      • Australia Mobile Mapping by Application
        • Land Surveys
        • Aerial Surveys
      • Australia Mobile Mapping by End-User
        • Real Estate & Construction
        • IT & Telecom
        • Others
      • Rest of Asia-Pacific Outlook (USD Billion, 2018-2032)

      • Rest of Asia-Pacific Mobile Mapping by Component
        • Hardware
        • Software
        • Services
      • Rest of Asia-Pacific Mobile Mapping by Solution
        • Location-Based
        • Indoor Mapping
        • Asset Management
        • 3D Mapping
      • Rest of Asia-Pacific Mobile Mapping by Application
        • Land Surveys
        • Aerial Surveys
      • Rest of Asia-Pacific Mobile Mapping by End-User
        • Real Estate & Construction
        • IT & Telecom
        • Others
    • Rest of the World Outlook (USD Billion, 2018-2032)

      • Rest of the World Mobile Mapping by Component
        • Hardware
        • Software
        • Services
      • Rest of the World Mobile Mapping by Solution
        • Location-Based
        • Indoor Mapping
        • Asset Management
        • 3D Mapping
      • Rest of the World Mobile Mapping by Application
        • Land Surveys
        • Aerial Surveys
      • Rest of the World Mobile Mapping by End-User
        • Real Estate & Construction
        • IT & Telecom
        • Others
      • Middle East Outlook (USD Billion, 2018-2032)

      • Middle East Mobile Mapping by Component
        • Hardware
        • Software
        • Services
      • Middle East Mobile Mapping by Solution
        • Location-Based
        • Indoor Mapping
        • Asset Management
        • 3D Mapping
      • Middle East Mobile Mapping by Application
        • Land Surveys
        • Aerial Surveys
      • Middle East Mobile Mapping by End-User
        • Real Estate & Construction
        • IT & Telecom
        • Others
      • Africa Outlook (USD Billion, 2018-2032)

      • Africa Mobile Mapping by Component
        • Hardware
        • Software
        • Services
      • Africa Mobile Mapping by Solution
        • Location-Based
        • Indoor Mapping
        • Asset Management
        • 3D Mapping
      • Africa Mobile Mapping by Application
        • Land Surveys
        • Aerial Surveys
      • Africa Mobile Mapping by End-User
        • Real Estate & Construction
        • IT & Telecom
        • Others
      • Latin America Outlook (USD Billion, 2018-2032)

      • Latin America Mobile Mapping by Component
        • Hardware
        • Software
        • Services
      • Latin America Mobile Mapping by Solution
        • Location-Based
        • Indoor Mapping
        • Asset Management
        • 3D Mapping
      • Latin America Mobile Mapping by Application
        • Land Surveys
        • Aerial Surveys
      • Latin America Mobile Mapping by End-User
        • Real Estate & Construction
        • IT & Telecom
        • Others
    Mobile Mapping Market Research Report - Global Forecast till 2032 Infographic
    Free Sample Request

    Kindly complete the form below to receive a free sample of this Report

    Customer Strories

    “I am very pleased with how market segments have been defined in a relevant way for my purposes (such as "Portable Freezers & refrigerators" and "last-mile"). In general the report is well structured. Thanks very much for your efforts.”

    Victoria Milne Founder
    Case Study

    Chemicals and Materials