• Cat-intel
  • MedIntelliX
  • Resources
  • About Us
  • Hero Background
    English
    Chinese
    French
    Japanese
    Korean
    German
    Spanish

    Mobile Application Testing Services Market Share

    ID: MRFR/ICT/7143-CR
    92 Pages
    Aarti Dhapte
    November 2019

    Mobile Application Testing Services Market Research Report Information by Type (Manual and Automation), By Industry (BFSI, IT & Telecom, Retail, Media and others) and by Region (North America, Asia-Pacific, Europe and Rest of the World) - Forecast till 2035

    Share:
    Download PDF ×

    We do not share your information with anyone. However, we may send you emails based on your report interest from time to time. You may contact us at any time to opt-out.

    Mobile Application Testing Services Market Infographic
    $ 4,950.0
    $ 5,950.0
    $ 7,250.0

    Market Share

    Mobile Application Testing Services Market Share Analysis

    The global mobile application testing services market is undergoing a transformative shift, driven by the dynamic landscape of mobile technology and the increasing demand for seamless, high-quality mobile applications. This market has been segmented based on types of testing services and industry applications, offering valuable insights into the prevailing trends and growth opportunities. In terms of testing services, manual testing holds a dominant position, accounting for the largest market share of 51.1% in 2018, with a market value of USD 1,632.85 million. The manual testing segment is projected to register a substantial Compound Annual Growth Rate (CAGR) of 18.5% during the forecast period.

    This indicates a sustained preference for manual testing services in the mobile application domain, highlighting the nuanced and complex nature of testing requirements. Manual testing services involve human testers carefully evaluating mobile applications to identify issues, assess user experience, and ensure overall functionality. While automated testing has gained prominence, manual testing remains crucial for scenarios that require a human touch, such as subjective evaluations of user interfaces and real-world user interactions. The continued significance of manual testing reflects the evolving challenges in ensuring flawless mobile application performance. In terms of industry applications, the Information Technology (IT) and telecommunications segment emerges as a key player, accounting for the largest market share of 30.7% in 2018, with a market value of USD 980.93 million.

    This segment is projected to maintain a robust CAGR of 20.2% during the forecast period. The dominance of the IT and telecom sector underscores the critical role of mobile applications in these industries. The IT and telecom segment leverages mobile applications for various purposes, including communication, data management, and customer engagement. With the increasing reliance on mobile solutions within these industries, the demand for effective testing services to ensure application quality and reliability is on the rise. This trend is likely to drive sustained growth in the mobile application testing services market within the IT and telecom sector.

    The overarching growth of the global mobile application testing services market can be attributed to the escalating ownership of smartphones worldwide. As of April 2019, the Global System for Mobile Communications Association (GSMA) estimated a staggering 5 billion mobile phone users globally. This increasing smartphone penetration has resulted in a surge in mobile application downloads and extended usage, creating a pressing need for robust testing services. Furthermore, the rise of the Bring Your Own Device (BYOD) trend among enterprises is contributing to the increased demand for smartphones and mobile applications across the commercial sector.

    Businesses are increasingly relying on mobile applications for various functions, from internal communication to customer-facing applications. The critical role of mobile applications in business operations is propelling the need for comprehensive testing services to ensure optimal performance. The global mobile application testing services market is poised for substantial growth, with a projected CAGR of 20.3% during the forecast period from 2019 to 2026. In 2018, North America led the market with a significant 38.0% share, followed by Asia-Pacific with 26.0% and Europe with 25.4%. The North American market's dominance is attributed to its well-established infrastructure, early adoption of mobile application testing services, and high technical expertise. Europe, too, presents a promising market due to increasing smartphone ownership, with companies outsourcing testing services to countries with technical expertise. These insights highlight the diverse factors contributing to the growth and evolution of the global mobile application testing services market, positioning it as a key player in the technology landscape.

    Market Summary

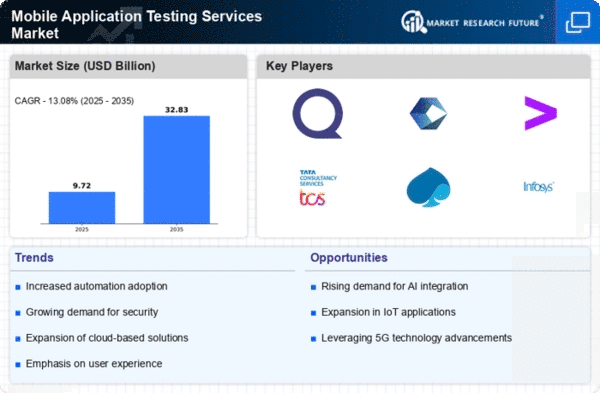
    As per Market Research Future Analysis, the Mobile Application Testing Services Market is projected to grow from USD 6.215 billion in 2022 to USD 18.765 billion by 2032, at a CAGR of 13.1% during the forecast period. This market encompasses both automated and manual testing techniques aimed at enhancing mobile application performance, efficiency, and reliability. Key drivers include the increasing smartphone ownership and the cost-effectiveness of automated testing. The market is segmented into manual and automation testing, with significant growth expected in the Asia-Pacific region, particularly in India, which is projected to register a CAGR of 27.1%. North America currently holds the largest market share, driven by high technical expertise and early technology adoption.

    Key Market Trends & Highlights

    The market is witnessing rapid growth driven by technological advancements and increasing mobile app usage.

    • Mobile Application Testing Services Market is expected to reach USD 18.765 billion by 2032.
    • Asia-Pacific is projected to register the highest CAGR of 24.2% during the forecast period.
    • North America accounted for around 38% market share in 2018, with a CAGR of 19.1% expected.
    • India is anticipated to grow at a CAGR of 27.1% due to a large number of service providers.

    Market Size & Forecast

    2022 Market Size USD 6.215 Billion
    2032 Market Size USD 18.765 Billion
    CAGR 13.1%
    Largest Regional Market Share in 2018 North America.

    Major Players

    Key players include Testlio Inc, QA InfoTech, ThinkSys Inc, Qualitest, TestingXperts, ZYMR INC, Capgemini, a1qa, Indium Software Inc, Global App Testing, and Accenture Plc.

    Market Trends

    The increasing complexity of mobile applications necessitates a robust testing framework to ensure functionality, security, and user experience, as highlighted by the growing emphasis on quality assurance in the digital landscape.

    U.S. Department of Commerce

    Mobile Application Testing Services Market Market Drivers

    Market Growth Projections

    The Global Mobile Application Testing Services Market Industry is poised for substantial growth, with projections indicating a revenue increase from 8.58 USD Billion in 2024 to 27.1 USD Billion by 2035. This growth trajectory suggests a compound annual growth rate of 11.04% from 2025 to 2035, reflecting the increasing reliance on mobile applications across various sectors. The market dynamics are influenced by several factors, including the rising demand for quality assurance, the adoption of Agile methodologies, and the emergence of IoT devices. As organizations continue to prioritize mobile application performance and security, the market is likely to experience robust expansion.

    Rising Demand for Quality Assurance

    The demand for quality assurance in mobile applications is intensifying, driving growth in the Global Mobile Application Testing Services Market Industry. Users expect seamless functionality and high performance from applications, leading to a zero-tolerance policy for bugs and glitches. Organizations are compelled to adopt comprehensive testing strategies to meet these expectations, which include automated testing, performance testing, and security assessments. This focus on quality assurance is likely to contribute to the market's expansion, with a projected compound annual growth rate of 11.04% from 2025 to 2035. As businesses prioritize user satisfaction, the need for specialized testing services becomes increasingly critical.

    Increasing Mobile Device Penetration

    The proliferation of mobile devices globally is a primary driver for the Global Mobile Application Testing Services Market Industry. As of 2024, the number of mobile phone users is projected to reach approximately 5.5 billion, indicating a substantial market for mobile applications. This surge in mobile device usage necessitates rigorous testing services to ensure optimal performance across diverse devices and operating systems. Consequently, companies are increasingly investing in mobile application testing to enhance user experience and maintain competitive advantage. The anticipated growth in the market is reflected in the projected revenue of 8.58 USD Billion in 2024, with expectations to reach 27.1 USD Billion by 2035.

    Emergence of IoT and Connected Devices

    The rise of the Internet of Things (IoT) and connected devices is reshaping the landscape of the Global Mobile Application Testing Services Market Industry. As more devices become interconnected, the complexity of mobile applications increases, necessitating comprehensive testing to ensure compatibility and performance across various platforms. This trend is particularly relevant as industries such as healthcare, automotive, and smart homes increasingly rely on mobile applications for functionality. The growing interconnectedness of devices is expected to drive demand for specialized testing services that can address the unique challenges posed by IoT applications, thereby contributing to the overall market growth.

    Growing Focus on Security and Compliance

    As mobile applications become more integral to business operations, the focus on security and compliance is intensifying within the Global Mobile Application Testing Services Market Industry. Organizations are increasingly aware of the risks associated with data breaches and regulatory compliance, prompting them to invest in robust testing services that address security vulnerabilities. This heightened emphasis on security is likely to drive demand for specialized testing solutions, including penetration testing and vulnerability assessments. As businesses navigate the complexities of regulatory requirements, the need for comprehensive security testing services is expected to grow, further propelling the market forward.

    Adoption of Agile and DevOps Methodologies

    The integration of Agile and DevOps methodologies within software development processes is significantly influencing the Global Mobile Application Testing Services Market Industry. These methodologies promote continuous integration and continuous delivery, which necessitate frequent testing cycles to ensure that applications meet quality standards throughout development. As organizations embrace these practices, the demand for efficient and effective testing services rises. This trend is expected to bolster the market, as companies seek to streamline their development processes while maintaining high-quality outputs. The ongoing shift towards Agile and DevOps is likely to be a key factor in the market's growth trajectory in the coming years.

    Market Segment Insights

    Regional Insights

    Key Companies in the Mobile Application Testing Services Market market include

    Industry Developments

    Future Outlook

    Mobile Application Testing Services Market Future Outlook

    The Mobile Application Testing Services Market is projected to grow at 11.04% CAGR from 2024 to 2035, driven by increasing mobile app usage, technological advancements, and the demand for enhanced user experiences.

    New opportunities lie in:

    • Develop AI-driven testing tools to enhance efficiency and accuracy in mobile app testing.
    • Expand services to include IoT and wearable device testing, addressing emerging market needs.
    • Create partnerships with app developers for integrated testing solutions, fostering innovation and collaboration.

    By 2035, the Mobile Application Testing Services Market is expected to be robust, reflecting substantial growth and innovation.

    Market Segmentation

    Report Overview

    Market Segmentation

    Report Scope

    Report Attribute/Metric Details
      Market Size USD 6.215 Billion (2022) USD 18.765 Billion (2032)
      CAGR   13.1% (2022-2032)
      Base Year   2021
      Forecast Period   2022-2032
      Historical Data   2021
      Forecast Units   Value (USD Billion)
      Report Coverage   Revenue Forecast, Competitive Landscape, Growth Factors, and Trends
      Segments Covered   by Type, By Industry
      Geographies Covered   North America, Europe, Asia-Pacific, and Rest of the World (RoW)
      Key Vendors   Testlio Inc, QA InfoTech, Capgemini, ThinkSys Inc, Qualitest, TestingXperts, ZYMR, INC, a1qa software testing company, Indium Software Inc, Global App Testing, and Accenture Plc.
      Key Market Opportunities   The rising need for automated testing tools to speed up testing process in countries such as South-Korea, Indonesia, and Malaysia is also expected to boost the market growth in Asia-Pacific.
      Key Market Drivers   The increasing ownership of smartphones and low operational costs and high quality associated with automated application testing are the primary factors driving the growth of the global mobile application testing services market.

    Market Highlights

    Author

    Aarti Dhapte
    Team Lead - Research

    She holds an experience of about 6+ years in market research and business consulting, working under the spectrum of information communication technology, telecommunications and semiconductor domains. aarti conceptualizes and implements a scalable business strategy and provides strategic leadership to the clients. her expertise lies in market estimation, competitive intelligence, pipeline analysis, customer assessment, etc.

    Leave a Comment

    Latest Comments

    John Doe
    john@example.com

    This is a great article! Really helped me understand the topic better.

    Posted on July 23, 2025, 10:15 AM
    Jane Smith
    jane@domain.com

    Thanks for sharing this. I’ve bookmarked it for later reference.

    Posted on July 22, 2025, 7:45 PM

    FAQs

    What is the projected CAGR of the global mobile app testing services market?

    The global mobile application testing services market is slated to expand at a substantial CAGR of 13.1% over the review period (2022 to 2032).

    What is the estimated market valuation of the global mobile app testing market?

    The global mobile application testing services market acquired a market value of about USD 6.215 billion in 2022 and is slated to generate revenue of up to USD 18.765Billion by 2032

    Who are the key players in the global mobile application testing services market?

    QA InfoTech, Testlio Inc, Capgemini, ThinkSys Inc, a1qa software testing company, Qualitest, TestingXperts, ZYMR, INC, Global App Testing, Indium Software Inc, and Accenture Plc.

    Which regions have been analyzed in global mobile app testing services market report?

    The regional analysis of the global mobile application testing services market has been conducted in five major regions, namely, North America, Asia Pacific, Europe, Latin America, and the Middle East and Africa.

    What is the segmentation of the global mobile application testing services market?

    The segmentation of the global mobile application testing services market is done on the basis of type, and industry.

    1. Executive Summary
      1. Market Attractiveness Analysis
        1. Global Mobile Application Testing Services Market, By Type
        2. Global Mobile Application Testing Services Market, By Industry
      2. Global Mobile Application Testing Services Market, By Region
    2. Market Introduction
      1. Definition
      2. Scope of the Study
      3. Market Structure
    3. Research Methodology
      1. Research Process
      2. Primary Research
      3. Secondary Research
      4. Market Size Estimation
      5. Forecast Vertical
      6. List Of Assumptions
    4. Market Insights
    5. Market Dynamics
      1. Introduction
      2. Drivers
        1. Increasing Ownership Of Smartphone
        2. Low Operational Costs And High Quality Associated With Automated Application Testing
        3. Drivers Impact Analysis
      3. Restraints
        1. Lack Of Technical Expertise
        2. Restraints Impact Analysis
      4. Opportunity
        1. Increasing Adoption Of Cloud-Based Mobile Application Testing
    6. Market Factor Analysis
      1. Porter’s Five Forces Model
        1. Threat Of New Entrants
        2. Bargaining Power Of Suppliers
        3. Bargaining Power Of Buyers
        4. Threat Of Substitutes
        5. Intensity Of Rivalry
    7. Global Mobile Application Testing Services Market, By Type
      1. Overview
      2. Manual
      3. Automation
    8. Global Mobile Application Testing Services Market, By Industry
      1. Overview
      2. BFSI
      3. IT & Telecom
      4. Retail
      5. Media
      6. Others
    9. Global Mobile Application Testing Services Market, By Region
      1. Overview
      2. North America
        1. U.S.
        2. Canada
        3. Mexico
      3. Europe
        1. UK
        2. Germany
        3. France
        4. Rest Of Europe
      4. Asia Pacific
        1. China
        2. Japan
        3. India
        4. Rest Of Asia-Pacific
      5. Rest Of The World
        1. South America
    10. Competitive Landscape
      1. Key Player Market Share Analysis, 2020 (%)
    11. Company Profiles
      1. Testlio Inc
        1. Company Overview
        2. Products/Services/Solutions Offered
        3. Key Developments
        4. SWOT Analysis
        5. Key Strategies
      2. QA InfoTech
        1. Company Overview
        2. Products/Services/Solutions Offered
        3. Key Developments
        4. SWOT Analysis
        5. Key Strategies
      3. Capgemini
        1. Company Overview
        2. Financial Overview
        3. Products/Services/Solutions Offered
        4. Key Developments
        5. SWOT Analysis
        6. Key Strategies
      4. ThinkSys Inc
        1. Company Overview
        2. Products/Services/Solutions Offered
        3. Key Developments
        4. SWOT Analysis
        5. Key Strategies
      5. Qualitest
        1. Company Overview
        2. Products/Services/Solutions Offered
        3. Key Developments
        4. SWOT Analysis
        5. Key Strategies
      6. TestingXperts
        1. Company Overview
        2. Products/Services/Solutions Offered
        3. Key Developments
        4. SWOT Analysis
        5. Key Strategies
      7. ZYMR, INC
        1. Company Overview
        2. Products/Services/Solutions Offered
        3. Key Developments
        4. SWOT Analysis
        5. Key Strategies
      8. A1qa Software Testing Company
        1. Company Overview
        2. Products/Services/Solutions Offered
        3. Key Developments
        4. SWOT Analysis
        5. Key Strategies
      9. Indium Software Inc
        1. Company Overview
        2. Products/Services/Solutions Offered
        3. Key Developments
        4. SWOT Analysis
        5. Key Strategies
      10. Global App Testing
        1. Company Overview
        2. Products/Services/Solutions Offered
        3. Key Developments
        4. SWOT Analysis
        5. Key Strategies
      11. Accenture Plc
        1. Company Overview
        2. Financial Overview
        3. Products/Services/Solutions Offered
        4. Key Developments
        5. SWOT Analysis
        6. Key Strategies
    12. Appendix
      1. References
    13. List of Tables and Figures
      1. 13 List Of Tables
      2. TABLE 1 LIST OF ASSUMPTIONS
      3. TABLE 2 GLOBAL MOBILE APPLICATION TESTING SERVICES MARKET, BY TYPE, 2020–2027 (USD MILLION)
      4. TABLE 3 GLOBAL MOBILE APPLICATION TESTING SERVICES MARKET, BY TYPE, 2020–2027 (USD MILLION)
      5. TABLE 4 GLOBAL MOBILE APPLICATION TESTING SERVICES MARKET, BY INDUSTRY, 2020–2027 (USD MILLION)
      6. TABLE 5 GLOBAL MOBILE APPLICATION TESTING SERVICES MARKET, BY INDUSTRY, 2020–2027 (USD MILLION)
      7. TABLE 6 GLOBAL MOBILE APPLICATION TESTING SERVICES MARKET, BY REGION, 2020–2027 (USD MILLION)
      8. TABLE 7 GLOBAL MOBILE APPLICATION TESTING SERVICES MARKET, BY REGION, 2020–2027 (USD MILLION)
      9. TABLE 8 NORTH AMERICA: MOBILE APPLICATION TESTING SERVICES MARKET, BY COUNTRY, 2020–2027 (USD MILLION)
      10. TABLE 9 NORTH AMERICA: MOBILE APPLICATION TESTING SERVICES MARKET, BY COUNTRY, 2020–2027 (USD MILLION)
      11. TABLE 10 NORTH AMERICA: MOBILE APPLICATION TESTING SERVICES MARKET, BY INDUSTRY, 2020–2027 (USD MILLION)
      12. TABLE 11 NORTH AMERICA: MOBILE APPLICATION TESTING SERVICES MARKET, BY INDUSTRY, 2020–2027 (USD MILLION)
      13. TABLE 12 NORTH AMERICA: MOBILE APPLICATION TESTING SERVICES MARKET, BY INDUSTRY, 2020–2027 (USD MILLION)
      14. TABLE 13 NORTH AMERICA: MOBILE APPLICATION TESTING SERVICES MARKET, BY INDUSTRY, 2020–2027 (USD MILLION)
      15. TABLE 14 US: MOBILE APPLICATION TESTING SERVICES MARKET, BY TYPE, 2020–2027(USD MILLION)
      16. TABLE 15 US: MOBILE APPLICATION TESTING SERVICES MARKET, BY TYPE, 2020–2027 (USD MILLION)
      17. TABLE 16 US: MOBILE APPLICATION TESTING SERVICES MARKET, BY INDUSTRY, 2020–2027 (USD MILLION)
      18. TABLE 17 US: MOBILE APPLICATION TESTING SERVICES MARKET, BY INDUSTRY, 2020–2027 (USD MILLION)
      19. TABLE 18 CANADA: MOBILE APPLICATION TESTING SERVICES MARKET, BY TYPE, 2020–2027 (USD MILLION)
      20. TABLE 19 CANADA: MOBILE APPLICATION TESTING SERVICES MARKET, BY TYPE, 2020–2027 (USD MILLION)
      21. TABLE 20 CANADA: MOBILE APPLICATION TESTING SERVICES MARKET, BY INDUSTRY, 2020–2027 (USD MILLION)
      22. TABLE 21 CANADA: MOBILE APPLICATION TESTING SERVICES MARKET, BY INDUSTRY, 2020–2027 (USD MILLION)
      23. TABLE 22 MEXICO: MOBILE APPLICATION TESTING SERVICES MARKET, BY TYPE, 2020–2027 (USD MILLION)
      24. TABLE 23 MEXICO: MOBILE APPLICATION TESTING SERVICES MARKET, BY TYPE, 2020–2027 (USD MILLION)
      25. TABLE 24 MEXICO: MOBILE APPLICATION TESTING SERVICES MARKET, BY INDUSTRY, 2020–2027 (USD MILLION)
      26. TABLE 25 MEXICO: MOBILE APPLICATION TESTING SERVICES MARKET, BY INDUSTRY, 2020–2027 (USD MILLION)
      27. TABLE 26 EUROPE: MOBILE APPLICATION TESTING SERVICES MARKET, BY COUNTRY, 2020–2027 (USD MILLION)
      28. TABLE 27 EUROPE: MOBILE APPLICATION TESTING SERVICES MARKET, BY COUNTRY, 2020–2027 (USD MILLION)
      29. TABLE 28 EUROPE: MOBILE APPLICATION TESTING SERVICES MARKET, BY TYPE, 2020–2027 (USD MILLION)
      30. TABLE 29 EUROPE: MOBILE APPLICATION TESTING SERVICES MARKET, BY TYPE, 2020–2027 (USD MILLION)
      31. TABLE 30 EUROPE: MOBILE APPLICATION TESTING SERVICES MARKET, BY INDUSTRY, 2020–2027 (USD MILLION)
      32. TABLE 31 EUROPE: MOBILE APPLICATION TESTING SERVICES MARKET, BY INDUSTRY, 2020–2027 (USD MILLION)
      33. TABLE 32 U.K.: MOBILE APPLICATION TESTING SERVICES MARKET, BY TYPE, 2020–2027 (USD MILLION)
      34. TABLE 33 U.K.: MOBILE APPLICATION TESTING SERVICES MARKET, BY TYPE, 2020–2027 (USD MILLION)
      35. TABLE 34 U.K.: MOBILE APPLICATION TESTING SERVICES MARKET, BY INDUSTRY, 2020–2027 (USD MILLION)
      36. TABLE 35 U.K.: MOBILE APPLICATION TESTING SERVICES MARKET, BY INDUSTRY, 2020–2027 (USD MILLION)
      37. TABLE 36 GERMANY: MOBILE APPLICATION TESTING SERVICES MARKET, BY TYPE, 2020–2027 (USD MILLION)
      38. TABLE 37 GERMANY: MOBILE APPLICATION TESTING SERVICES MARKET, BY TYPE, 2020–2027 (USD MILLION)
      39. TABLE 38 GERMANY: MOBILE APPLICATION TESTING SERVICES MARKET, BY INDUSTRY, 2020–2027 (USD MILLION)
      40. TABLE 39 GERMANY: MOBILE APPLICATION TESTING SERVICES MARKET, BY INDUSTRY, 2020–2027 (USD MILLION)
      41. TABLE 40 FRANCE: MOBILE APPLICATION TESTING SERVICES MARKET, BY TYPE, 2020–2027 (USD MILLION)
      42. TABLE 41 FRANCE: MOBILE APPLICATION TESTING SERVICES MARKET, BY TYPE, 2020–2027 (USD MILLION)
      43. TABLE 42 FRANCE: MOBILE APPLICATION TESTING SERVICES MARKET, BY INDUSTRY, 2020–2027 (USD MILLION)
      44. TABLE 43 FRANCE: MOBILE APPLICATION TESTING SERVICES MARKET, BY INDUSTRY, 20120204–2027 (USD MILLION)
      45. TABLE 44 REST OF EUROPE: MOBILE APPLICATION TESTING SERVICES MARKET, BY TYPE, 2020–2027 (USD MILLION)
      46. TABLE 45 REST OF EUROPE: MOBILE APPLICATION TESTING SERVICES MARKET, BY TYPE, 2020–2027 (USD MILLION)
      47. TABLE 46 REST OF EUROPE: MOBILE APPLICATION TESTING SERVICES MARKET, BY INDUSTRY, 2020–2027 (USD MILLION)
      48. TABLE 47 REST OF EUROPE: MOBILE APPLICATION TESTING SERVICES MARKET, BY INDUSTRY, 2020–2027 (USD MILLION)
      49. TABLE 48 ASIA PACIFIC: MOBILE APPLICATION TESTING SERVICES MARKET, BY COUNTRY, 2020–2027 (USD MILLION)
      50. TABLE 49 ASIA PACIFIC: MOBILE APPLICATION TESTING SERVICES MARKET, BY COUNTRY, 2020–2027 (USD MILLION)
      51. TABLE 50 ASIA-PACIFIC: MOBILE APPLICATION TESTING SERVICES MARKET, BY TYPE, 2020–2027 (USD MILLION)
      52. TABLE 51 ASIA-PACIFIC: MOBILE APPLICATION TESTING SERVICES MARKET, BY TYPE, 2020–2027 (USD MILLION)
      53. TABLE 52 ASIA-PACIFIC: MOBILE APPLICATION TESTING SERVICES MARKET, BY INDUSTRY, 2020–2027 (USD MILLION)
      54. TABLE 53 ASIA-PACIFIC: MOBILE APPLICATION TESTING SERVICES MARKET, BY INDUSTRY, 2020–2027 (USD MILLION)
      55. TABLE 54 CHINA: MOBILE APPLICATION TESTING SERVICES MARKET, BY TYPE, 2020–2027 (USD MILLION)
      56. TABLE 55 CHINA: MOBILE APPLICATION TESTING SERVICES MARKET, BY TYPE, 2020–2027 (USD MILLION)
      57. TABLE 56 CHINA: MOBILE APPLICATION TESTING SERVICES MARKET, BY INDUSTRY, 2020–2027 (USD MILLION)
      58. TABLE 57 CHINA: MOBILE APPLICATION TESTING SERVICES MARKET, BY INDUSTRY, 2020–2027 (USD MILLION)
      59. TABLE 58 JAPAN: MOBILE APPLICATION TESTING SERVICES MARKET, BY TYPE, 2020–2027 (USD MILLION)
      60. TABLE 59 JAPAN: MOBILE APPLICATION TESTING SERVICES MARKET, BY TYPE, 2020–2027 (USD MILLION)
      61. TABLE 60 JAPAN: MOBILE APPLICATION TESTING SERVICES MARKET, BY INDUSTRY, 2020–2027 (USD MILLION)
      62. TABLE 61 JAPAN: MOBILE APPLICATION TESTING SERVICES MARKET, BY INDUSTRY, 2020–2027 (USD MILLION)
      63. TABLE 62 INDIA: MOBILE APPLICATION TESTING SERVICES MARKET, BY TYPE, 2020–2027 (USD MILLION)
      64. TABLE 63 INDIA: MOBILE APPLICATION TESTING SERVICES MARKET, BY TYPE, 2020–2027 (USD MILLION)
      65. TABLE 64 INDIA: MOBILE APPLICATION TESTING SERVICES MARKET, BY INDUSTRY, 2020–2027 (USD MILLION)
      66. TABLE 65 INDIA: MOBILE APPLICATION TESTING SERVICES MARKET, BY INDUSTRY, 2020–2027 (USD MILLION)
      67. TABLE 66 REST OF ASIA-PACIFIC: MOBILE APPLICATION TESTING SERVICES MARKET, BY TYPE, 2020–2027 (USD MILLION)
      68. TABLE 67 REST OF ASIA-PACIFIC: MOBILE APPLICATION TESTING SERVICES MARKET, BY TYPE, 2020–2027 (USD MILLION)
      69. TABLE 68 REST OF ASIA-PACIFIC: MOBILE APPLICATION TESTING SERVICES MARKET, BY INDUSTRY, 2020–2027 (USD MILLION)
      70. TABLE 69 REST OF ASIA-PACIFIC: MOBILE APPLICATION TESTING SERVICES MARKET, BY INDUSTRY, 2020–2027 (USD MILLION)
      71. TABLE 70 REST OF THEWORLD: MOBILE APPLICATION TESTING SERVICES MARKET, BY REGION, 2020– 20220 (USD MILLION)
      72. TABLE 71 REST OF THEWORLD: MOBILE APPLICATION TESTING SERVICES MARKET, BY REGION, 2020– 2027 (USD MILLION)
      73. TABLE 72 REST OF THE WORLD: MOBILE APPLICATION TESTING SERVICES MARKET, BY TYPE, 2020–2027 (USD MILLION)
      74. TABLE 73 REST OF THE WORLD: MOBILE APPLICATION TESTING SERVICES MARKET, BY TYPE, 2020–2027 (USD MILLION)
      75. TABLE 74 REST OF THE WORLD: MOBILE APPLICATION TESTING SERVICES MARKET SHARE, BY INDUSTRY, 2020–2027 (USD MILLION)
      76. TABLE 75 REST OF THE WORLD: MOBILE APPLICATION TESTING SERVICES MARKET, BY INDUSTRY, 2020–2027 (USD MILLION)
      77. TABLE 76 REST OF THE WORLD: MOBILE APPLICATION TESTING SERVICES MARKET, BY INDUSTRY, 2020–2027 (USD MILLION)
      78. TABLE 77 MIDDLE EAST AND AFRICA: MOBILE APPLICATION TESTING SERVICES MARKET, BY TYPE, 2020– 2027 (USD MILLION)
      79. TABLE 78 MIDDLE EAST AND AFRICA: MOBILE APPLICATION TESTING SERVICES MARKET, BY TYPE, 2020– 2027 (USD MILLION)
      80. TABLE 79 MIDDLE EAST AND AFRICA: MOBILE APPLICATION TESTING SERVICES MARKET, BY INDUSTRY, 2020– 2027 (USD MILLION)
      81. TABLE 80 MIDDLE EAST AND AFRICA: MOBILE APPLICATION TESTING SERVICES MARKET, BY INDUSTRY, 2020– 2027 (USD MILLION)
      82. TABLE 81 SOUTH AMERICA: MOBILE APPLICATION TESTING SERVICES MARKET, BY TYPE, 2020–2027 (USD MILLION)
      83. TABLE 82 SOUTH AMERICA: MOBILE APPLICATION TESTING SERVICES MARKET, BY TYPE, 2020–2027 (USD MILLION)
      84. TABLE 83 SOUTH AMERICA: MOBILE APPLICATION TESTING SERVICES MARKET, BY INDUSTRY, 2020– 2027 (USD MILLION)
      85. TABLE 84 SOUTH AMERICA: MOBILE APPLICATION TESTING SERVICES MARKET, BY INDUSTRY, 2020– 2027 (USD MILLION) 14 List Of Figures
      86. FIGURE 1 MARKET SYNOPSIS
      87. FIGURE 2 MARKET ATTRACTIVENESS ANALYSIS: GLOBAL MOBILE APPLICATION TESTING SERVICES MARKET
      88. FIGURE 3 GLOBAL MOBILE APPLICATION TESTING SERVICES MARKET ANALYSIS BY TYPE, 2020 (%)
      89. FIGURE 4 GLOBAL MOBILE APPLICATION TESTING SERVICES MARKET ANALYSIS BY INDUSTRY, 2020 (%)
      90. FIGURE 5 GLOBAL MOBILE APPLICATION TESTING SERVICES MARKET ANALYSIS BY REGION, 2020 (%)
      91. FIGURE 6 GLOBAL MOBILE APPLICATION TESTING SERVICES MARKET: MARKET STRUCTURE
      92. FIGURE 7 RESEARCH PROCESS OF MRFR
      93. FIGURE 8 TOP DOWN & BOTTOM UP APPROACH
      94. FIGURE 9 NORTH AMERICA MARKET SIZE & MARKET SHARE BY COUNTRY (2020 VS 2027)
      95. FIGURE 10 EUROPE MARKET SIZE & MARKET SHARE BY COUNTRY (2020 VS 2027)
      96. FIGURE 11 ASIA-PACIFIC & MARKET SHARE BY COUNTRY (2020 VS 2027)
      97. FIGURE 12 REST OF THE WORLD & MARKET SHARE BY COUNTRY (2020 VS 2027)
      98. FIGURE 13 DROC ANALYSIS OF GLOBAL MOBILE APPLICATION TESTING SERVICES MARKET
      99. FIGURE 14 DRIVERS IMPACT ANALYSIS: MOBILE APPLICATION TESTING SERVICES MARKET
      100. FIGURE 15 RESTRAINTS IMPACT ANALYSIS: MOBILE APPLICATION TESTING SERVICES MARKET
      101. FIGURE 16 PORTER''S FIVE FORCES ANALYSIS OF THE GLOBAL MOBILE APPLICATION TESTING SERVICES MARKET
      102. FIGURE 17 GLOBAL MOBILE APPLICATION TESTING SERVICES MARKET, BY TYPE, 2020–2027 (USD MILLION)
      103. FIGURE 18 GLOBAL MOBILE APPLICATION TESTING SERVICES MARKET, BY INDUSTRY, 2020–2027 (USD MILLION)
      104. FIGURE 19 GLOBAL MOBILE APPLICATION TESTING SERVICES MARKET, BY REGION, 2020–2027 (USD MILLION)
      105. FIGURE 20 NORTH AMERICA: MOBILE APPLICATION TESTING SERVICES MARKET SHARE, BY COUNTRY, 2020–2027 (USD MILLION)
      106. FIGURE 21 NORTH AMERICA: MOBILE APPLICATION TESTING SERVICES MARKET SHARE, BY TYPE, 2020–2027 (USD MILLION)
      107. FIGURE 22 NORTH AMERICA: MOBILE APPLICATION TESTING SERVICES MARKET SHARE, BY INDUSTRY, 2020–2027 (USD MILLION)
      108. FIGURE 23 EUROPE: MOBILE APPLICATION TESTING SERVICES MARKET SHARE, BY COUNTRY, 2020–2027 (USD MILLION)<

    Mobile Application Testing Services Market Segmentation

    Market Segmentation Overview

    • Detailed segmentation data will be available in the full report
    • Comprehensive analysis by multiple parameters
    • Regional and country-level breakdowns
    • Market size forecasts by segment
    Infographic

    Free Sample Request

    Kindly complete the form below to receive a free sample of this Report

    Get Free Sample

    Customer Strories

    “I am very pleased with how market segments have been defined in a relevant way for my purposes (such as "Portable Freezers & refrigerators" and "last-mile"). In general the report is well structured. Thanks very much for your efforts.”

    Victoria Milne

    Founder
    Case Study
    Chemicals and Materials