


Mercury Size
Market Size Snapshot
| Year | Value |
|---|---|
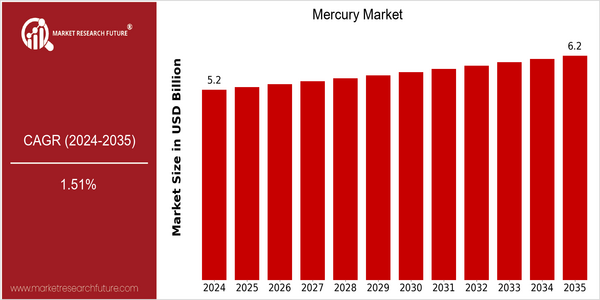
| 2024 | USD 5.25 Billion |
| 2035 | USD 6.19 Billion |
| CAGR (2025-2035) | 1.51 % |
Note – Market size depicts the revenue generated over the financial year
The market for mercury in the world is expected to grow at a steady rate, from its present value of $ 5.25 billion in 2024 to $ 6.19 billion by 2035. The growth rate for this period is expected to be 1.51 per cent. The expansion is mainly due to the increase in demand for various applications, such as industry, telecommunications, and medicine, where mercury plays a critical role in certain products and processes. However, with the growing trend towards sustainable alternatives and the development of new regulations, the market is also expected to grow in the coming years. Advances in the extraction and recovery of mercury have also contributed to the growth of the market. Also, the growing focus on the environment and the stricter regulations on the use of mercury have led to the innovation of new products and processes. The major players in the market, such as Merck KGaA and Aurubis AG, have been involved in strategic initiatives, such as establishing new research and development laboratories and establishing strategic alliances, to explore safer alternatives and improve their product offerings. These efforts not only align with the regulatory requirements, but also position the companies as leaders in the changing market.
Regional Market Size
Regional Deep Dive
The Mercury Market is characterized by a complex interplay of the legal framework, the environment and the industrial use in the different regions. In North America, the strict regulations on mercury emissions and waste disposal drive the development of mercury-free products, while Europe is concerned with sustainable practices and the reduction of the use of mercury in various industries. The rapid industrialization in Asia-Pacific is accompanied by increasing demand for mercury, but also by a growing interest from the environment. The Middle East and Africa are emerging markets with particular challenges and opportunities, especially in the mining and energy sectors. Latin America is balancing economic growth with the need for sustainable development, which is having a significant impact on the market.
Europe
- The European Union's Minamata Convention on Mercury is driving member states to adopt comprehensive strategies for mercury reduction, influencing market practices and product offerings.
- Companies such as Umicore are leading the way in developing mercury recycling technologies, which are expected to significantly reduce the environmental impact of mercury waste.
Asia Pacific
- China's rapid industrial growth has led to increased mercury consumption, but the government is now implementing stricter regulations to curb mercury pollution, which is expected to shift market dynamics.
- Japan is investing in research and development of mercury-free technologies, particularly in the energy sector, which could lead to a decline in mercury usage in the region.
Latin America
- Brazil is facing challenges with illegal gold mining, which often involves mercury use, leading to government efforts to regulate and promote sustainable mining practices.
- The region is seeing increased collaboration between governments and NGOs to address mercury pollution, particularly in the Amazon, which is expected to foster more sustainable practices.
North America
- The U.S. Environmental Protection Agency (EPA) has implemented stricter regulations on mercury emissions, prompting industries to invest in cleaner technologies and alternatives, which is reshaping the market landscape.
- Innovations in mercury detection and remediation technologies are being spearheaded by companies like Thermo Fisher Scientific, enhancing safety and compliance in various sectors.
Middle East And Africa
- The mining sector in South Africa is a significant contributor to mercury emissions, prompting local governments to explore sustainable mining practices and regulations to mitigate environmental impact.
- Emerging initiatives in renewable energy projects in the region are focusing on minimizing mercury use, with organizations like the African Development Bank supporting these transitions.
Did You Know?
“Mercury is one of the few metals that is liquid at room temperature, which has historically made it valuable for various industrial applications, but also poses significant health risks.” — World Health Organization (WHO)
Segmental Market Size
The market for energy-saving solutions is growing, both due to the growing demand for energy and to the increasing regulatory pressure to go green. The main driving forces are the increasing need for sustainable energy sources and the government’s initiatives to promote clean energy. For example, in North America and Europe, strict regulations have been introduced to reduce carbon emissions, which has led to an increase in the use of mercury-free technology in the production of energy. The current phase of the mercury-free market is in its deployment stage. Leading companies such as Siemens and Elon Musk are integrating mercury-free solutions into their products. The main application areas are the production of energy, where mercury-free solutions are used in solar cells and wind generators. Also, the macro trends of global climate change and sustainable development are accelerating growth in this area. The use of smart grids and advanced materials is shaping the development of the mercury-free market, enabling the use of energy to be more efficient and the use of harmful substances to be reduced.
Future Outlook
The Mercury Market is expected to grow steadily from 2024 to 2035. The market is expected to grow from $5.25 billion to $6.19 billion, at a CAGR of 1.51%. The growth of the market is mainly due to the increasing regulations and the awareness of the environment. This has led to the increasing demand for mercury-free alternatives in the field of electronics, medicine and industry. The stricter implementation of the Minamata Convention in the country will gradually lead to a shift towards safer substitutes, which will influence the market dynamics. The technological advancements will also play a major role in shaping the mercury market. Analytical methods and decontamination technology will increase the efficiency of mercury detection and management, which will also boost the market. The trend towards the concept of social responsibility and the concept of sustainable development among manufacturers will also accelerate the use of mercury-free products. By 2035, the penetration rate of mercury-free products in the key sectors is expected to exceed 30%, which will reflect the shift in consumer preferences and regulatory compliance. The whole market will be influenced by both technological progress and the environment, and will be resilient and adaptable.


Leave a Comment