• Cat-intel
  • MedIntelliX
  • Resources
  • About Us
  • Request Free Sample ×

    Kindly complete the form below to receive a free sample of this Report

    Leading companies partner with us for data-driven Insights

    clients tt-cursor

    Managed Industrial Ethernet Switches Market

    ID: MRFR/ICT/30320-HCR
    111 Pages
    Aarti Dhapte
    September 2025

    Managed Industrial Ethernet Switches Market Research Report: By Switch Type (Managed Switches, Unmanaged Switches, Smart Switches), By Port Configuration (10/100/1000 Ethernet Ports, 10 Gigabit Ethernet Ports, Fiber Optic Ports), By Network Protocol (Ethernet/IP, Profinet, EtherCAT), By Application Sector (Manufacturing, Transportation, Energy & Utilities, Oil & Gas), By Form Factor (Rack-Mount, DIN-Rail, Wall-Mount) and By Regional (North America, Europe, South America, Asia Pacific, Middle East and Africa) - Forecast to 2034.

    Share:
    Download PDF ×

    We do not share your information with anyone. However, we may send you emails based on your report interest from time to time. You may contact us at any time to opt-out.

    Managed Industrial Ethernet Switches Market Research Report - Global Forecast by 2034 Infographic
    Purchase Options
    $ 4,950.0
    $ 5,950
    $ 7,250.0
    Table of Contents

    Managed Industrial Ethernet Switches Market Summary

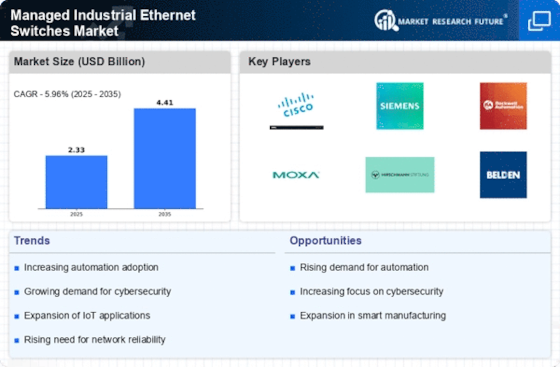
    The Global Managed Industrial Ethernet Switches Market is projected to grow from 2.18 USD Billion in 2024 to 4.41 USD Billion by 2035.

    Key Market Trends & Highlights

    Managed Industrial Ethernet Switches Key Trends and Highlights

    • The market is expected to experience a compound annual growth rate (CAGR) of 6.61% from 2025 to 2035.
    • By 2035, the market valuation is anticipated to reach 4.41 USD Billion, indicating robust growth potential.
    • In 2024, the market is valued at 2.18 USD Billion, reflecting a strong foundation for future expansion.
    • Growing adoption of industrial automation due to increased demand for operational efficiency is a major market driver.

    Market Size & Forecast

    2024 Market Size 2.18 (USD Million)
    2035 Market Size 4.41 (USD Million)
    CAGR (2025-2035) 6.61%

    Major Players

    Advantech, Rockwell Automation, Belden, Westermo, Schneider Electric, Honeywell, Phoenix Contact, NETGEAR, Siemens, Cisco Systems, ABB, NTRON, Hirschmann, DLink, Moxa

    Managed Industrial Ethernet Switches Market Trends

    The Managed Industrial Ethernet Switches Market is primarily driven by the increasing automation and digitization in industries, leading to greater requirements for network reliability, flexibility, and enhanced performance. As industries continue to evolve towards smart manufacturing and Industry 4.0, the need for robust communication networks has become critical. Managed Ethernet switches facilitate advanced network management features, such as Quality of Service (QoS), network security, and redundancy protocols, which are essential for handling complex industrial applications, thereby propelling their adoption across various sectors like manufacturing, energy, transportation, and telecommunications. 

    Amidst these trends, there are notable opportunities that can be explored, particularly in emerging markets where industrial infrastructure is rapidly developing. Companies are poised to capitalize on the increasing demand for real-time data analytics and seamless connectivity as organizations seek to improve operational efficiency and reduce downtime in their processes.

    Additionally, the proliferation of IoT devices and the subsequent need for improved data management create a compelling environment for the introduction of innovative industrial Ethernet solutions. Recent times have witnessed a surge in technological advancements, including the integration of artificial intelligence and machine learning into managed switches. This has led to enhanced predictive maintenance features and automated network performance optimization. Moreover, trends toward sustainability and energy efficiency are influencing product design, resulting in switches that are not only high-performing but also environmentally friendly.

    The continuous evolution of cybersecurity measures within network infrastructure is further shaping the landscape, ensuring that the managed industrial Ethernet switches market remains dynamic and aligned with contemporary industrial needs.

    The ongoing evolution of industrial automation and the increasing demand for reliable communication networks are driving the adoption of managed industrial Ethernet switches, which are poised to enhance operational efficiency across various sectors.

    U.S. Department of Commerce

    Managed Industrial Ethernet Switches Market Drivers

    Market Growth Charts Only

    Rising Need for Network Security

    In the context of the Global Managed Industrial Ethernet Switches Market Industry, the escalating need for network security is a prominent driver. As industries increasingly rely on interconnected devices, the risk of cyber threats grows. Managed Industrial Ethernet Switches offer advanced security features such as VLANs, port security, and access control lists, which are essential for safeguarding sensitive data. This heightened focus on security is likely to propel market growth as organizations prioritize the protection of their networks. The anticipated growth trajectory indicates a market size of 4.41 USD Billion by 2035, underscoring the importance of secure networking solutions.

    Regulatory Compliance and Standards

    Regulatory compliance and adherence to industry standards are critical factors influencing the Global Managed Industrial Ethernet Switches Market Industry. Various sectors, including manufacturing and transportation, are subject to stringent regulations that mandate the use of reliable networking solutions. Managed Industrial Ethernet Switches help organizations meet these compliance requirements by providing robust performance and reliability. As industries strive to adhere to these standards, the demand for compliant networking solutions is expected to grow. This trend further supports the overall expansion of the market, as organizations prioritize compliance alongside operational efficiency.

    Advancements in Networking Technologies

    Technological advancements in networking are pivotal to the Global Managed Industrial Ethernet Switches Market Industry. Innovations such as increased bandwidth, reduced latency, and enhanced reliability are driving the development of more sophisticated Managed Industrial Ethernet Switches. These advancements enable industries to support high-performance applications and ensure uninterrupted communication between devices. As industries evolve and require more complex networking solutions, the demand for advanced Managed Industrial Ethernet Switches is likely to rise. This trend aligns with the overall growth of the market, as organizations seek to leverage cutting-edge technologies to optimize their operations.

    Growing Demand for Industrial Automation

    The Global Managed Industrial Ethernet Switches Market Industry experiences a robust demand driven by the increasing adoption of industrial automation across various sectors. Industries such as manufacturing, oil and gas, and energy are integrating automated systems to enhance operational efficiency and reduce costs. This shift towards automation necessitates reliable and efficient networking solutions, which Managed Industrial Ethernet Switches provide. As a result, the market is projected to reach 2.18 USD Billion in 2024, reflecting the critical role these switches play in facilitating seamless communication between devices in automated environments.

    Integration of IoT in Industrial Applications

    The integration of the Internet of Things (IoT) into industrial applications significantly influences the Global Managed Industrial Ethernet Switches Market Industry. IoT devices require robust networking capabilities to ensure real-time data transmission and communication. Managed Industrial Ethernet Switches facilitate this connectivity, enabling industries to harness the full potential of IoT technologies. As more organizations adopt IoT solutions, the demand for reliable networking infrastructure is expected to surge. This trend is projected to contribute to a compound annual growth rate (CAGR) of 6.61% from 2025 to 2035, reflecting the growing reliance on interconnected systems in industrial settings.

    Market Segment Insights

    Managed Industrial Ethernet Switches Market Switch Type Insights

    The Managed Industrial Ethernet Switches Market encompasses various switch types that play a significant role in enhancing network connectivity and control in industrial environments. In 2023, the market for Managed Industrial Ethernet Switches reached a valuation of 2.08 USD Billion, with significant contributions from its distinct switch types. The market segmentation reveals that Managed Switches account for a notable share, valued at 0.95 USD Billion in 2023, escalating to a projected 1.6 USD Billion by 2032. 

    This segment dominates due to its advanced features, including network management capabilities and enhanced security, making it highly preferred in complex industrial settings where reliability is paramount. Unmanaged Switches, valued at 0.63 USD Billion in 2023 and expected to grow to 1.1 USD Billion by 2032, continue to serve essential roles in simpler network configurations where cost-effectiveness and ease of use are prioritized.

    Their straightforward nature appeals to small-scale operations that do not require the extensive features offered by managed counterparts. Conversely, Smart Switches, a growing segment, are valued at 0.5 USD Billion in 2023, forecasted to reach 0.8 USD Billion by 2032, showcasing their increasing relevance in environments that require a balance between functionality and user control. These market segments exhibit unique characteristics that cater to varied industrial needs, reflecting the overall trends and growth drivers within the Managed Industrial Ethernet Switches Market.

    The gradual shift towards automation and the focus on digital transformation in industries bolster demand for Managed Switches as they facilitate smarter network management. In summary, the Managed Industrial Ethernet Switches Market revenue illustrates a diverse but interrelated ecosystem where each switch type serves distinct purposes, ultimately contributing to enhanced industrial connectivity and network performance.

    Managed Industrial Ethernet Switches Market Switch Type

    Source: Primary Research, Secondary Research, Market Research Future Database and Analyst Review

    Managed Industrial Ethernet Switches Market Port Configuration Insights

    The Managed Industrial Ethernet Switches Market exhibits a robust performance, with a significant focus on the Port Configuration segment. In 2023, the market was valued at 2.08 billion USD, reflecting the growing reliance on industrial networking solutions. Within this landscape, various Port Configurations play a pivotal role, particularly the 10/100/1000 Ethernet Ports, which cater to a wide range of applications by balancing speed and cost-effectiveness, making them highly favored in industrial settings. Additionally, 10 Gigabit Ethernet Ports are recognized for their potential to manage high-throughput environments, fostering advanced communication in demanding applications.

    Fiber Optic Ports are becoming increasingly significant due to their capability of transmitting data over long distances at high speeds while ensuring lower latency, which is essential for critical industrial operations. The demand for these configurations is driven by the rising need for reliable and efficient network solutions in industrial automation, smart factories, and IoT integrations, thus shaping the competitive dynamics of the Managed Industrial Ethernet Switches Market. Insights suggest that as industries continue to digitize, the importance of these Port Configurations will increasingly dominate market conversations, pushing manufacturers to innovate to meet evolving demands.

    Managed Industrial Ethernet Switches Market Network Protocol Insights

    The Managed Industrial Ethernet Switches Market, particularly within the Network Protocol segment, is poised for significant growth, showcasing a valuation of 2.08 billion USD in 2023 and expected to reach 3.5 billion USD by 2032. Key components within this segment include Ethernet/IP, Profinet, and EtherCAT, each playing a crucial role in the overall market dynamics. Ethernet/IP is particularly prominent due to its widespread adoption in various industrial automation sectors, facilitating seamless communication and interoperability. 

    Profinet stands out for its ability to support extensive data transmission in real-time applications, which is critical for industries requiring high reliability.EtherCAT is recognized for its superior performance in time-critical control applications, enabling efficient and precise device communication. The interplay of these protocols drives the market, influenced by trends such as the increasing need for connectivity in industrial environments and the growing demand for automation solutions. However, challenges like the integration of legacy systems with modern protocols persist, presenting both obstacles and opportunities for market participants.

    Overall, the Managed Industrial Ethernet Switches Market underlines the importance of Network Protocols in shaping industrial communication infrastructures.

    Managed Industrial Ethernet Switches Market Application Sector Insights

    The Managed Industrial Ethernet Switches Market, valued at approximately 2.08 USD Billion in 2023, showcases a robust framework across various application sectors, driving market growth through essential connectivity solutions. Manufacturing stands out as a fundamental segment due to the increasing automation and Industry 4.0 initiatives, enhancing operational efficiencies. Transportation is pivotal, facilitating reliable communication networks that ensure the safety and efficiency of systems like railways and intelligent transportation infrastructure.

    The Energy Utilities sector shows significant advancements as the integration of smart grids and renewable energy sources relies heavily on robust network infrastructure, making industrial Ethernet switches essential for data communication. Additionally, the Oil Gas industry dominates the market through the need for reliable, high-performance networking solutions that withstand harsh environmental conditions while maintaining operational integrity. These diverse applications highlight the critical role of the Managed Industrial Ethernet Switches Market in enabling seamless communication, reflecting its substantial impact on industry standards and technological advancements.

    The anticipated growth is supported by increasing investments in digital transformation across these sectors, presenting notable opportunities for future market developments.

    Managed Industrial Ethernet Switches Market Form Factor Insights

    The Managed Industrial Ethernet Switches Market, valued at 2.08 USD Billion in 2023, reflects a diverse landscape across its Form Factor segment. The market includes various configurations such as Rack-Mount, DIN-Rail, and Wall-Mount, each catering to different industrial requirements and environments. The Rack-Mount type is often preferred in data centers for its ability to optimize space and provide extensive connectivity options. Meanwhile, DIN-Rail switches are significant for their compact size, making them vital for control cabinets and industrial automation settings.

    Wall-mount switches dominate in applications where floor space is limited, allowing for easy installation in tight environments. As industries increasingly adopt automation and advanced networking solutions, the demand across these Form Factors is expected to grow substantially. Market growth is propelled by rising investments in infrastructure and smart manufacturing, although challenges like the need for interoperability and cybersecurity threats loom. Overall, the segmentation of the Managed Industrial Ethernet Switches Market illustrates how specific Form Factors address unique operational needs, contributing to the evolving landscape of industrial networking solutions.

    Regional Insights

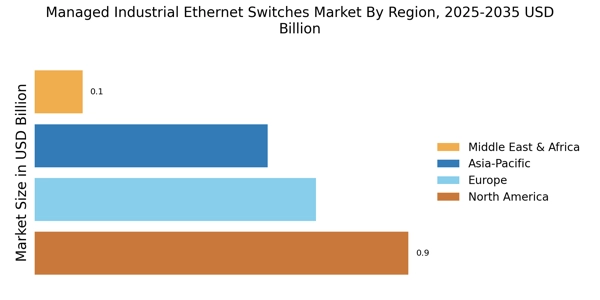
    The Regional segment of the Managed Industrial Ethernet Switches Market is marked by diversified growth across various areas, reflecting significant overall market dynamics. In 2023, North America held a prominent position with a valuation of 0.84 USD Billion, closely followed by Europe at 0.62 USD Billion, indicating their majority holding in the market. Meanwhile, Asia Pacific and the Middle East and Africa showed notable engagement, valued at 0.5 USD Billion and 0.05 USD Billion, respectively. South America, while smaller, contributed with a valuation of 0.07 USD Billion in 2023.

    By 2032, North America is projected to rise to 1.32 USD Billion, showcasing its dominance and growth potential, while Europe is expected to expand to 1.04 USD Billion, reinforcing its significant role. The Asia Pacific region is particularly noteworthy due to its rapid industrialization and increasing demand for efficient networking solutions, projected to reach 0.82 USD Billion by 2032. The challenges and opportunities in this market are driven by technological advancements and the rising adoption of automation across industries, signaling a robust path for growth and transformation within key regions.

    Managed Industrial Ethernet Switches Market Regional

    Source: Primary Research, Secondary Research, Market Research Future Database and Analyst Review

    Key Players and Competitive Insights

    The Managed Industrial Ethernet Switches Market is characterized by its rapid growth and relentless innovation, with key players striving to establish their dominance through advanced technology and tailored solutions. The competitive landscape consists of various companies engaging in a strategic battle to capture market share while addressing the increasing demand for reliable network connectivity in industrial environments. Industry players are focusing on the development of high-performance switches that ensure robust communication, seamless integration with existing systems, and enhanced security features.

    This sector is marked by a mix of established enterprises and emerging players, each contributing unique strengths that shape the evolution of managed industrial Ethernet switches. The market's competitive dynamics are influenced by factors such as technological advancements, geographic presence, and rising end-user demand across diverse industrial verticals, fostering a vibrant ecosystem of collaboration and competition.

    Advantech emerges as a formidable contender in the Managed Industrial Ethernet Switches Market due to its extensive experience and comprehensive product range catering to various industrial applications. The company has a strong presence in diverse sectors, including manufacturing, transportation, utilities, and smart cities, which showcases its capability to meet a broad array of customer needs. 

    One significant strength of Advantech lies in its commitment to quality and reliability, offering high-end solutions that withstand challenging industrial conditions. Furthermore, Advantech invests heavily in research and development, allowing it to remain at the forefront of technology advancements and meet evolving industry standards. The company's strong emphasis on customer support and tailored solutions further solidifies its position as a trusted provider among businesses seeking managed industrial Ethernet switches, making it a key player in the competitive landscape of this market.

    Rockwell Automation is recognized as a significant player in the Managed Industrial Ethernet Switches Market, leveraging its extensive expertise in automation and control systems to offer innovative networking solutions. The company's strong focus on integrated architectures enables seamless communication between devices, enhancing operational efficiency for end-users. Rockwell Automation distinguishes itself through its extensive research and development capabilities, which position it well to address the increasingly complex needs of various industries. 

    With a solid reputation for providing reliable and high-performance products, Rockwell Automation's managed industrial Ethernet switches are equipped with advanced features such as security protocols and redundancy capabilities, ensuring robust performance in demanding environments. The company's proactive approach to fostering partnerships and building its ecosystem further enhances its competitive position, enabling it to stay ahead in a market characterized by rapid technological advancements and shifting customer requirements.

    Key Companies in the Managed Industrial Ethernet Switches Market market include

    Industry Developments

    Recent developments in the Managed Industrial Ethernet Switches Market have underscored a strong trajectory of growth driven by the increasing demand for robust and scalable networking solutions in industrial settings. Innovations in technology, especially in automation and Industry 4.0, have propelled the adoption of managed switches to enhance connectivity and data transfer efficiency. Key players are actively investing in research and development to introduce smarter, more secure Ethernet switches that can withstand harsh industrial environments.

    Additionally, the rise of the Internet of Things (IoT) has further fueled market expansion as businesses aim to integrate various devices seamlessly. Regulatory frameworks aimed at improving industrial cybersecurity are also influencing purchasing decisions, pushing manufacturers to prioritize secure solutions. Partnerships and collaborations among technology firms are becoming more frequent, enabling comprehensive solutions that address evolving industrial networking needs. These trends are expected to influence the market significantly, setting the stage for innovations that enhance operational efficiency and reliability across various sectors.

    Future Outlook

    Managed Industrial Ethernet Switches Market Future Outlook

    The Managed Industrial Ethernet Switches Market is projected to grow at a 6.61% CAGR from 2024 to 2035, driven by advancements in automation, IoT integration, and the demand for reliable connectivity.

    New opportunities lie in:

    • Develop AI-driven network management solutions to enhance operational efficiency.
    • Expand product lines to include cybersecurity features for industrial applications.
    • Leverage partnerships with IoT device manufacturers to create integrated solutions.

    By 2035, the market is expected to achieve substantial growth, reflecting robust demand and technological advancements.

    Market Segmentation

    Managed Industrial Ethernet Switches Market Regional Outlook

    • North America
    • Europe
    • South America
    • Asia Pacific
    • Middle East and Africa

    Managed Industrial Ethernet Switches Market Form Factor Outlook

    • Rack-Mount
    • DIN-Rail
    • Wall-Mount

    Managed Industrial Ethernet Switches Market Switch Type Outlook

    • Managed Switches
    • Unmanaged Switches
    • Smart Switches

    Managed Industrial Ethernet Switches Market Network Protocol Outlook

    • Ethernet/IP
    • Profinet
    • EtherCAT

    Managed Industrial Ethernet Switches Market Application Sector Outlook

    • Manufacturing
    • Transportation
    • Energy Utilities
    • Oil Gas

    Managed Industrial Ethernet Switches Market Port Configuration Outlook

    • 10/100/1000 Ethernet Ports
    • 10 Gigabit Ethernet Ports
    • Fiber Optic Ports

    Report Scope

    Report Attribute/Metric Details
    Market Size 2024 2.33 (USD Billion)
    Market Size 2025 2.47 (USD Billion)
    Market Size 2034 4.16 (USD Billion)
    Compound Annual Growth Rate (CAGR) 5.96% (2025 - 2034)
    Report Coverage Revenue Forecast, Competitive Landscape, Growth Factors, and Trends
    Base Year 2024
    Market Forecast Period 2025 - 2034
    Historical Data 2019 - 2023
    Market Forecast Units USD Billion
    Key Companies Profiled Advantech, Rockwell Automation, Belden, Westermo, Schneider Electric, Honeywell, Phoenix Contact, NETGEAR, Siemens, Cisco Systems, ABB, NTRON, Hirschmann, DLink, Moxa
    Segments Covered Switch Type, Port Configuration, Network Protocol, Application Sector, Form Factor, Regional
    Key Market Opportunities Increased automation adoption Demand for enhanced connectivity Growth in IoT applications Need for network security solutions Rising investment in smart industries.
    Key Market Dynamics Growing automation demand Rising IoT adoption Need for network reliability Increased cybersecurity concerns Expansion of industrial infrastructure.
    Countries Covered North America, Europe, APAC, South America, MEA

    Market Highlights

    Author
    Aarti Dhapte
    Team Lead - Research

    She holds an experience of about 6+ years in Market Research and Business Consulting, working under the spectrum of Information Communication Technology, Telecommunications and Semiconductor domains. Aarti conceptualizes and implements a scalable business strategy and provides strategic leadership to the clients. Her expertise lies in market estimation, competitive intelligence, pipeline analysis, customer assessment, etc.

    Leave a Comment

    FAQs

    What is the projected market size of the Managed Industrial Ethernet Switches Market by 2034?

    The Managed Industrial Ethernet Switches Market is expected to be valued at approximately 4.16 USD Billion by 2034.

    What is the expected CAGR for the Managed Industrial Ethernet Switches Market from 2025 to 2034?

    The market is anticipated to grow at a CAGR of 5.96% from 2025 to 2034.

    Which region is expected to hold the largest market share in 2032?

    North America is projected to have the largest market share, valued at around 1.32 USD Billion in 2032.

    How much is the Managed Switches segment valued in 2032?

    The Managed Switches segment is expected to be valued at approximately 1.6 USD Billion in 2032.

    What is the estimated market value of Unmanaged Switches in 2032?

    The Unmanaged Switches segment is anticipated to be valued at about 1.1 USD Billion by 2032.

    What is the market value of Smart Switches expected to be in 2032?

    Smart Switches are projected to reach a market value of around 0.8 USD Billion by 2032.

    Which are the major players in the Managed Industrial Ethernet Switches Market?

    Key players include Advantech, Rockwell Automation, Belden, Schneider Electric, and Cisco Systems, among others.

    What is the expected market value for Europe in 2032?

    The European market is projected to reach a value of approximately 1.04 USD Billion by 2032.

    How is the APAC region's market size expected to grow by 2032?

    The APAC region's market value is anticipated to grow to about 0.82 USD Billion by 2032.

    What challenges might the Managed Industrial Ethernet Switches Market face?

    The market may encounter challenges such as increasing competition and rapid technological advancements.

    1.     1. EXECUTIVE SUMMARY   
    2.         1.1. Market Overview     
    3.         1.2. Key Findings     
    4.         1.3. Market Segmentation     
    5.         1.4. Competitive Landscape     
    6.         1.5. Challenges and Opportunities     
    7.         1.6. Future Outlook        
    8.     2. MARKET INTRODUCTION   
    9.         2.1. Definition     
    10.         2.2. Scope of the study   
    11.             2.2.1. Research Objective         
    12.             2.2.2. Assumption         
    13.             2.2.3. Limitations              
    14.     3. RESEARCH METHODOLOGY   
    15.         3.1. Overview     
    16.         3.2. Data Mining     
    17.         3.3. Secondary Research     
    18.         3.4. Primary Research   
    19.             3.4.1. Primary Interviews and Information Gathering Process         
    20.             3.4.2. Breakdown of Primary Respondents           
    21.         3.5. Forecasting Model     
    22.         3.6. Market Size Estimation   
    23.             3.6.1. Bottom-Up Approach         
    24.             3.6.2. Top-Down Approach           
    25.         3.7. Data Triangulation     
    26.         3.8. Validation        
    27.     4. MARKET DYNAMICS   
    28.         4.1. Overview     
    29.         4.2. Drivers     
    30.         4.3. Restraints     
    31.         4.4. Opportunities        
    32.     5. MARKET FACTOR ANALYSIS   
    33.         5.1. Value chain Analysis     
    34.         5.2. Porter's Five Forces Analysis   
    35.             5.2.1. Bargaining Power of Suppliers         
    36.             5.2.2. Bargaining Power of Buyers         
    37.             5.2.3. Threat of New Entrants         
    38.             5.2.4. Threat of Substitutes         
    39.             5.2.5. Intensity of Rivalry           
    40.         5.3. COVID-19 Impact Analysis   
    41.             5.3.1. Market Impact Analysis         
    42.             5.3.2. Regional Impact         
    43.             5.3.3. Opportunity and Threat Analysis              
    44.     6. Managed Industrial Ethernet Switches Market, BY Switch Type (USD Billion)   
    45.         6.1. Managed Switches     
    46.         6.2. Unmanaged Switches     
    47.         6.3. Smart Switches        
    48.     7. Managed Industrial Ethernet Switches Market, BY Port Configuration (USD Billion)   
    49.         7.1. 10/100/1000 Ethernet Ports     
    50.         7.2. 10 Gigabit Ethernet Ports     
    51.         7.3. Fiber Optic Ports        
    52.     8. Managed Industrial Ethernet Switches Market, BY Network Protocol (USD Billion)   
    53.         8.1. Ethernet/IP     
    54.         8.2. Profinet     
    55.         8.3. EtherCAT        
    56.     9. Managed Industrial Ethernet Switches Market, BY Application Sector (USD Billion)   
    57.         9.1. Manufacturing     
    58.         9.2. Transportation     
    59.         9.3. Energy & Utilities     
    60.         9.4. Oil & Gas        
    61.     10. Managed Industrial Ethernet Switches Market, BY Form Factor (USD Billion)   
    62.         10.1. Rack-Mount     
    63.         10.2. DIN-Rail     
    64.         10.3. Wall-Mount        
    65.     11. Managed Industrial Ethernet Switches Market, BY Regional (USD Billion)   
    66.         11.1. North America   
    67.             11.1.1. US         
    68.             11.1.2. Canada           
    69.         11.2. Europe   
    70.             11.2.1. Germany         
    71.             11.2.2. UK         
    72.             11.2.3. France         
    73.             11.2.4. Russia         
    74.             11.2.5. Italy         
    75.             11.2.6. Spain         
    76.             11.2.7. Rest of Europe           
    77.         11.3. APAC   
    78.             11.3.1. China         
    79.             11.3.2. India         
    80.             11.3.3. Japan         
    81.             11.3.4. South Korea         
    82.             11.3.5. Malaysia         
    83.             11.3.6. Thailand         
    84.             11.3.7. Indonesia         
    85.             11.3.8. Rest of APAC           
    86.         11.4. South America   
    87.             11.4.1. Brazil         
    88.             11.4.2. Mexico         
    89.             11.4.3. Argentina         
    90.             11.4.4. Rest of South America           
    91.         11.5. MEA   
    92.             11.5.1. GCC Countries         
    93.             11.5.2. South Africa         
    94.             11.5.3. Rest of MEA              
    95.     12. Competitive Landscape   
    96.         12.1. Overview     
    97.         12.2. Competitive Analysis     
    98.         12.3. Market share Analysis     
    99.         12.4. Major Growth Strategy in the Managed Industrial Ethernet Switches Market     
    100.         12.5. Competitive Benchmarking     
    101.         12.6. Leading Players in Terms of Number of Developments in the Managed Industrial Ethernet Switches Market     
    102.         12.7. Key developments and growth strategies   
    103.             12.7.1. New Product Launch/Service Deployment         
    104.             12.7.2. Merger & Acquisitions         
    105.             12.7.3. Joint Ventures           
    106.         12.8. Major Players Financial Matrix    
    107.             12.8.1. Sales and Operating Income         
    108.             12.8.2. Major Players R&D Expenditure. 2023              
    109.     13. Company Profiles   
    110.         13.1. Advantech   
    111.             13.1.1. Financial Overview         
    112.             13.1.2. Products Offered         
    113.             13.1.3. Key Developments         
    114.             13.1.4. SWOT Analysis         
    115.             13.1.5. Key Strategies           
    116.         13.2. Rockwell Automation   
    117.             13.2.1. Financial Overview         
    118.             13.2.2. Products Offered         
    119.             13.2.3. Key Developments         
    120.             13.2.4. SWOT Analysis         
    121.             13.2.5. Key Strategies           
    122.         13.3. Belden   
    123.             13.3.1. Financial Overview         
    124.             13.3.2. Products Offered         
    125.             13.3.3. Key Developments         
    126.             13.3.4. SWOT Analysis         
    127.             13.3.5. Key Strategies           
    128.         13.4. Westermo   
    129.             13.4.1. Financial Overview         
    130.             13.4.2. Products Offered         
    131.             13.4.3. Key Developments         
    132.             13.4.4. SWOT Analysis         
    133.             13.4.5. Key Strategies           
    134.         13.5. Schneider Electric   
    135.             13.5.1. Financial Overview         
    136.             13.5.2. Products Offered         
    137.             13.5.3. Key Developments         
    138.             13.5.4. SWOT Analysis         
    139.             13.5.5. Key Strategies           
    140.         13.6. Honeywell   
    141.             13.6.1. Financial Overview         
    142.             13.6.2. Products Offered         
    143.             13.6.3. Key Developments         
    144.             13.6.4. SWOT Analysis         
    145.             13.6.5. Key Strategies           
    146.         13.7. Phoenix Contact   
    147.             13.7.1. Financial Overview         
    148.             13.7.2. Products Offered         
    149.             13.7.3. Key Developments         
    150.             13.7.4. SWOT Analysis         
    151.             13.7.5. Key Strategies           
    152.         13.8. NETGEAR   
    153.             13.8.1. Financial Overview         
    154.             13.8.2. Products Offered         
    155.             13.8.3. Key Developments         
    156.             13.8.4. SWOT Analysis         
    157.             13.8.5. Key Strategies           
    158.         13.9. Siemens   
    159.             13.9.1. Financial Overview         
    160.             13.9.2. Products Offered         
    161.             13.9.3. Key Developments         
    162.             13.9.4. SWOT Analysis         
    163.             13.9.5. Key Strategies           
    164.         13.10. Cisco Systems   
    165.             13.10.1. Financial Overview         
    166.             13.10.2. Products Offered         
    167.             13.10.3. Key Developments         
    168.             13.10.4. SWOT Analysis         
    169.             13.10.5. Key Strategies           
    170.         13.11. ABB   
    171.             13.11.1. Financial Overview         
    172.             13.11.2. Products Offered         
    173.             13.11.3. Key Developments         
    174.             13.11.4. SWOT Analysis         
    175.             13.11.5. Key Strategies           
    176.         13.12. NTRON   
    177.             13.12.1. Financial Overview         
    178.             13.12.2. Products Offered         
    179.             13.12.3. Key Developments         
    180.             13.12.4. SWOT Analysis         
    181.             13.12.5. Key Strategies           
    182.         13.13. Hirschmann   
    183.             13.13.1. Financial Overview         
    184.             13.13.2. Products Offered         
    185.             13.13.3. Key Developments         
    186.             13.13.4. SWOT Analysis         
    187.             13.13.5. Key Strategies           
    188.         13.14. DLink   
    189.             13.14.1. Financial Overview         
    190.             13.14.2. Products Offered         
    191.             13.14.3. Key Developments         
    192.             13.14.4. SWOT Analysis         
    193.             13.14.5. Key Strategies           
    194.         13.15. Moxa   
    195.             13.15.1. Financial Overview         
    196.             13.15.2. Products Offered         
    197.             13.15.3. Key Developments         
    198.             13.15.4. SWOT Analysis         
    199.             13.15.5. Key Strategies              
    200.     14. Appendix   
    201.         14.1. References     
    202.         14.2. Related Reports        
    203.     Table 1. LIST OF ASSUMPTIONS   
    204.     Table 2. North America Managed Industrial Ethernet Switches Market SIZE ESTIMATES & FORECAST, BY SWITCH TYPE, 2019-2032 (USD Billions)   
    205.     Table 3. North America Managed Industrial Ethernet Switches Market SIZE ESTIMATES & FORECAST, BY PORT CONFIGURATION, 2019-2032 (USD Billions)   
    206.     Table 4. North America Managed Industrial Ethernet Switches Market SIZE ESTIMATES & FORECAST, BY NETWORK PROTOCOL, 2019-2032 (USD Billions)   
    207.     Table 5. North America Managed Industrial Ethernet Switches Market SIZE ESTIMATES & FORECAST, BY APPLICATION SECTOR, 2019-2032 (USD Billions)   
    208.     Table 6. North America Managed Industrial Ethernet Switches Market SIZE ESTIMATES & FORECAST, BY FORM FACTOR, 2019-2032 (USD Billions)   
    209.     Table 7. North America Managed Industrial Ethernet Switches Market SIZE ESTIMATES & FORECAST, BY REGIONAL, 2019-2032 (USD Billions)   
    210.     Table 8. US Managed Industrial Ethernet Switches Market SIZE ESTIMATES & FORECAST, BY SWITCH TYPE, 2019-2032 (USD Billions)   
    211.     Table 9. US Managed Industrial Ethernet Switches Market SIZE ESTIMATES & FORECAST, BY PORT CONFIGURATION, 2019-2032 (USD Billions)   
    212.     Table 10. US Managed Industrial Ethernet Switches Market SIZE ESTIMATES & FORECAST, BY NETWORK PROTOCOL, 2019-2032 (USD Billions)   
    213.     Table 11. US Managed Industrial Ethernet Switches Market SIZE ESTIMATES & FORECAST, BY APPLICATION SECTOR, 2019-2032 (USD Billions)   
    214.     Table 12. US Managed Industrial Ethernet Switches Market SIZE ESTIMATES & FORECAST, BY FORM FACTOR, 2019-2032 (USD Billions)   
    215.     Table 13. US Managed Industrial Ethernet Switches Market SIZE ESTIMATES & FORECAST, BY REGIONAL, 2019-2032 (USD Billions)   
    216.     Table 14. Canada Managed Industrial Ethernet Switches Market SIZE ESTIMATES & FORECAST, BY SWITCH TYPE, 2019-2032 (USD Billions)   
    217.     Table 15. Canada Managed Industrial Ethernet Switches Market SIZE ESTIMATES & FORECAST, BY PORT CONFIGURATION, 2019-2032 (USD Billions)   
    218.     Table 16. Canada Managed Industrial Ethernet Switches Market SIZE ESTIMATES & FORECAST, BY NETWORK PROTOCOL, 2019-2032 (USD Billions)   
    219.     Table 17. Canada Managed Industrial Ethernet Switches Market SIZE ESTIMATES & FORECAST, BY APPLICATION SECTOR, 2019-2032 (USD Billions)   
    220.     Table 18. Canada Managed Industrial Ethernet Switches Market SIZE ESTIMATES & FORECAST, BY FORM FACTOR, 2019-2032 (USD Billions)   
    221.     Table 19. Canada Managed Industrial Ethernet Switches Market SIZE ESTIMATES & FORECAST, BY REGIONAL, 2019-2032 (USD Billions)   
    222.     Table 20. Europe Managed Industrial Ethernet Switches Market SIZE ESTIMATES & FORECAST, BY SWITCH TYPE, 2019-2032 (USD Billions)   
    223.     Table 21. Europe Managed Industrial Ethernet Switches Market SIZE ESTIMATES & FORECAST, BY PORT CONFIGURATION, 2019-2032 (USD Billions)   
    224.     Table 22. Europe Managed Industrial Ethernet Switches Market SIZE ESTIMATES & FORECAST, BY NETWORK PROTOCOL, 2019-2032 (USD Billions)   
    225.     Table 23. Europe Managed Industrial Ethernet Switches Market SIZE ESTIMATES & FORECAST, BY APPLICATION SECTOR, 2019-2032 (USD Billions)   
    226.     Table 24. Europe Managed Industrial Ethernet Switches Market SIZE ESTIMATES & FORECAST, BY FORM FACTOR, 2019-2032 (USD Billions)   
    227.     Table 25. Europe Managed Industrial Ethernet Switches Market SIZE ESTIMATES & FORECAST, BY REGIONAL, 2019-2032 (USD Billions)   
    228.     Table 26. Germany Managed Industrial Ethernet Switches Market SIZE ESTIMATES & FORECAST, BY SWITCH TYPE, 2019-2032 (USD Billions)   
    229.     Table 27. Germany Managed Industrial Ethernet Switches Market SIZE ESTIMATES & FORECAST, BY PORT CONFIGURATION, 2019-2032 (USD Billions)   
    230.     Table 28. Germany Managed Industrial Ethernet Switches Market SIZE ESTIMATES & FORECAST, BY NETWORK PROTOCOL, 2019-2032 (USD Billions)   
    231.     Table 29. Germany Managed Industrial Ethernet Switches Market SIZE ESTIMATES & FORECAST, BY APPLICATION SECTOR, 2019-2032 (USD Billions)   
    232.     Table 30. Germany Managed Industrial Ethernet Switches Market SIZE ESTIMATES & FORECAST, BY FORM FACTOR, 2019-2032 (USD Billions)   
    233.     Table 31. Germany Managed Industrial Ethernet Switches Market SIZE ESTIMATES & FORECAST, BY REGIONAL, 2019-2032 (USD Billions)   
    234.     Table 32. UK Managed Industrial Ethernet Switches Market SIZE ESTIMATES & FORECAST, BY SWITCH TYPE, 2019-2032 (USD Billions)   
    235.     Table 33. UK Managed Industrial Ethernet Switches Market SIZE ESTIMATES & FORECAST, BY PORT CONFIGURATION, 2019-2032 (USD Billions)   
    236.     Table 34. UK Managed Industrial Ethernet Switches Market SIZE ESTIMATES & FORECAST, BY NETWORK PROTOCOL, 2019-2032 (USD Billions)   
    237.     Table 35. UK Managed Industrial Ethernet Switches Market SIZE ESTIMATES & FORECAST, BY APPLICATION SECTOR, 2019-2032 (USD Billions)   
    238.     Table 36. UK Managed Industrial Ethernet Switches Market SIZE ESTIMATES & FORECAST, BY FORM FACTOR, 2019-2032 (USD Billions)   
    239.     Table 37. UK Managed Industrial Ethernet Switches Market SIZE ESTIMATES & FORECAST, BY REGIONAL, 2019-2032 (USD Billions)   
    240.     Table 38. France Managed Industrial Ethernet Switches Market SIZE ESTIMATES & FORECAST, BY SWITCH TYPE, 2019-2032 (USD Billions)   
    241.     Table 39. France Managed Industrial Ethernet Switches Market SIZE ESTIMATES & FORECAST, BY PORT CONFIGURATION, 2019-2032 (USD Billions)   
    242.     Table 40. France Managed Industrial Ethernet Switches Market SIZE ESTIMATES & FORECAST, BY NETWORK PROTOCOL, 2019-2032 (USD Billions)   
    243.     Table 41. France Managed Industrial Ethernet Switches Market SIZE ESTIMATES & FORECAST, BY APPLICATION SECTOR, 2019-2032 (USD Billions)   
    244.     Table 42. France Managed Industrial Ethernet Switches Market SIZE ESTIMATES & FORECAST, BY FORM FACTOR, 2019-2032 (USD Billions)   
    245.     Table 43. France Managed Industrial Ethernet Switches Market SIZE ESTIMATES & FORECAST, BY REGIONAL, 2019-2032 (USD Billions)   
    246.     Table 44. Russia Managed Industrial Ethernet Switches Market SIZE ESTIMATES & FORECAST, BY SWITCH TYPE, 2019-2032 (USD Billions)   
    247.     Table 45. Russia Managed Industrial Ethernet Switches Market SIZE ESTIMATES & FORECAST, BY PORT CONFIGURATION, 2019-2032 (USD Billions)   
    248.     Table 46. Russia Managed Industrial Ethernet Switches Market SIZE ESTIMATES & FORECAST, BY NETWORK PROTOCOL, 2019-2032 (USD Billions)   
    249.     Table 47. Russia Managed Industrial Ethernet Switches Market SIZE ESTIMATES & FORECAST, BY APPLICATION SECTOR, 2019-2032 (USD Billions)   
    250.     Table 48. Russia Managed Industrial Ethernet Switches Market SIZE ESTIMATES & FORECAST, BY FORM FACTOR, 2019-2032 (USD Billions)   
    251.     Table 49. Russia Managed Industrial Ethernet Switches Market SIZE ESTIMATES & FORECAST, BY REGIONAL, 2019-2032 (USD Billions)   
    252.     Table 50. Italy Managed Industrial Ethernet Switches Market SIZE ESTIMATES & FORECAST, BY SWITCH TYPE, 2019-2032 (USD Billions)   
    253.     Table 51. Italy Managed Industrial Ethernet Switches Market SIZE ESTIMATES & FORECAST, BY PORT CONFIGURATION, 2019-2032 (USD Billions)   
    254.     Table 52. Italy Managed Industrial Ethernet Switches Market SIZE ESTIMATES & FORECAST, BY NETWORK PROTOCOL, 2019-2032 (USD Billions)   
    255.     Table 53. Italy Managed Industrial Ethernet Switches Market SIZE ESTIMATES & FORECAST, BY APPLICATION SECTOR, 2019-2032 (USD Billions)   
    256.     Table 54. Italy Managed Industrial Ethernet Switches Market SIZE ESTIMATES & FORECAST, BY FORM FACTOR, 2019-2032 (USD Billions)   
    257.     Table 55. Italy Managed Industrial Ethernet Switches Market SIZE ESTIMATES & FORECAST, BY REGIONAL, 2019-2032 (USD Billions)   
    258.     Table 56. Spain Managed Industrial Ethernet Switches Market SIZE ESTIMATES & FORECAST, BY SWITCH TYPE, 2019-2032 (USD Billions)   
    259.     Table 57. Spain Managed Industrial Ethernet Switches Market SIZE ESTIMATES & FORECAST, BY PORT CONFIGURATION, 2019-2032 (USD Billions)   
    260.     Table 58. Spain Managed Industrial Ethernet Switches Market SIZE ESTIMATES & FORECAST, BY NETWORK PROTOCOL, 2019-2032 (USD Billions)   
    261.     Table 59. Spain Managed Industrial Ethernet Switches Market SIZE ESTIMATES & FORECAST, BY APPLICATION SECTOR, 2019-2032 (USD Billions)   
    262.     Table 60. Spain Managed Industrial Ethernet Switches Market SIZE ESTIMATES & FORECAST, BY FORM FACTOR, 2019-2032 (USD Billions)   
    263.     Table 61. Spain Managed Industrial Ethernet Switches Market SIZE ESTIMATES & FORECAST, BY REGIONAL, 2019-2032 (USD Billions)   
    264.     Table 62. Rest of Europe Managed Industrial Ethernet Switches Market SIZE ESTIMATES & FORECAST, BY SWITCH TYPE, 2019-2032 (USD Billions)   
    265.     Table 63. Rest of Europe Managed Industrial Ethernet Switches Market SIZE ESTIMATES & FORECAST, BY PORT CONFIGURATION, 2019-2032 (USD Billions)   
    266.     Table 64. Rest of Europe Managed Industrial Ethernet Switches Market SIZE ESTIMATES & FORECAST, BY NETWORK PROTOCOL, 2019-2032 (USD Billions)   
    267.     Table 65. Rest of Europe Managed Industrial Ethernet Switches Market SIZE ESTIMATES & FORECAST, BY APPLICATION SECTOR, 2019-2032 (USD Billions)   
    268.     Table 66. Rest of Europe Managed Industrial Ethernet Switches Market SIZE ESTIMATES & FORECAST, BY FORM FACTOR, 2019-2032 (USD Billions)   
    269.     Table 67. Rest of Europe Managed Industrial Ethernet Switches Market SIZE ESTIMATES & FORECAST, BY REGIONAL, 2019-2032 (USD Billions)   
    270.     Table 68. APAC Managed Industrial Ethernet Switches Market SIZE ESTIMATES & FORECAST, BY SWITCH TYPE, 2019-2032 (USD Billions)   
    271.     Table 69. APAC Managed Industrial Ethernet Switches Market SIZE ESTIMATES & FORECAST, BY PORT CONFIGURATION, 2019-2032 (USD Billions)   
    272.     Table 70. APAC Managed Industrial Ethernet Switches Market SIZE ESTIMATES & FORECAST, BY NETWORK PROTOCOL, 2019-2032 (USD Billions)   
    273.     Table 71. APAC Managed Industrial Ethernet Switches Market SIZE ESTIMATES & FORECAST, BY APPLICATION SECTOR, 2019-2032 (USD Billions)   
    274.     Table 72. APAC Managed Industrial Ethernet Switches Market SIZE ESTIMATES & FORECAST, BY FORM FACTOR, 2019-2032 (USD Billions)   
    275.     Table 73. APAC Managed Industrial Ethernet Switches Market SIZE ESTIMATES & FORECAST, BY REGIONAL, 2019-2032 (USD Billions)   
    276.     Table 74. China Managed Industrial Ethernet Switches Market SIZE ESTIMATES & FORECAST, BY SWITCH TYPE, 2019-2032 (USD Billions)   
    277.     Table 75. China Managed Industrial Ethernet Switches Market SIZE ESTIMATES & FORECAST, BY PORT CONFIGURATION, 2019-2032 (USD Billions)   
    278.     Table 76. China Managed Industrial Ethernet Switches Market SIZE ESTIMATES & FORECAST, BY NETWORK PROTOCOL, 2019-2032 (USD Billions)   
    279.     Table 77. China Managed Industrial Ethernet Switches Market SIZE ESTIMATES & FORECAST, BY APPLICATION SECTOR, 2019-2032 (USD Billions)   
    280.     Table 78. China Managed Industrial Ethernet Switches Market SIZE ESTIMATES & FORECAST, BY FORM FACTOR, 2019-2032 (USD Billions)   
    281.     Table 79. China Managed Industrial Ethernet Switches Market SIZE ESTIMATES & FORECAST, BY REGIONAL, 2019-2032 (USD Billions)   
    282.     Table 80. India Managed Industrial Ethernet Switches Market SIZE ESTIMATES & FORECAST, BY SWITCH TYPE, 2019-2032 (USD Billions)   
    283.     Table 81. India Managed Industrial Ethernet Switches Market SIZE ESTIMATES & FORECAST, BY PORT CONFIGURATION, 2019-2032 (USD Billions)   
    284.     Table 82. India Managed Industrial Ethernet Switches Market SIZE ESTIMATES & FORECAST, BY NETWORK PROTOCOL, 2019-2032 (USD Billions)   
    285.     Table 83. India Managed Industrial Ethernet Switches Market SIZE ESTIMATES & FORECAST, BY APPLICATION SECTOR, 2019-2032 (USD Billions)   
    286.     Table 84. India Managed Industrial Ethernet Switches Market SIZE ESTIMATES & FORECAST, BY FORM FACTOR, 2019-2032 (USD Billions)   
    287.     Table 85. India Managed Industrial Ethernet Switches Market SIZE ESTIMATES & FORECAST, BY REGIONAL, 2019-2032 (USD Billions)   
    288.     Table 86. Japan Managed Industrial Ethernet Switches Market SIZE ESTIMATES & FORECAST, BY SWITCH TYPE, 2019-2032 (USD Billions)   
    289.     Table 87. Japan Managed Industrial Ethernet Switches Market SIZE ESTIMATES & FORECAST, BY PORT CONFIGURATION, 2019-2032 (USD Billions)   
    290.     Table 88. Japan Managed Industrial Ethernet Switches Market SIZE ESTIMATES & FORECAST, BY NETWORK PROTOCOL, 2019-2032 (USD Billions)   
    291.     Table 89. Japan Managed Industrial Ethernet Switches Market SIZE ESTIMATES & FORECAST, BY APPLICATION SECTOR, 2019-2032 (USD Billions)   
    292.     Table 90. Japan Managed Industrial Ethernet Switches Market SIZE ESTIMATES & FORECAST, BY FORM FACTOR, 2019-2032 (USD Billions)   
    293.     Table 91. Japan Managed Industrial Ethernet Switches Market SIZE ESTIMATES & FORECAST, BY REGIONAL, 2019-2032 (USD Billions)   
    294.     Table 92. South Korea Managed Industrial Ethernet Switches Market SIZE ESTIMATES & FORECAST, BY SWITCH TYPE, 2019-2032 (USD Billions)   
    295.     Table 93. South Korea Managed Industrial Ethernet Switches Market SIZE ESTIMATES & FORECAST, BY PORT CONFIGURATION, 2019-2032 (USD Billions)   
    296.     Table 94. South Korea Managed Industrial Ethernet Switches Market SIZE ESTIMATES & FORECAST, BY NETWORK PROTOCOL, 2019-2032 (USD Billions)   
    297.     Table 95. South Korea Managed Industrial Ethernet Switches Market SIZE ESTIMATES & FORECAST, BY APPLICATION SECTOR, 2019-2032 (USD Billions)   
    298.     Table 96. South Korea Managed Industrial Ethernet Switches Market SIZE ESTIMATES & FORECAST, BY FORM FACTOR, 2019-2032 (USD Billions)   
    299.     Table 97. South Korea Managed Industrial Ethernet Switches Market SIZE ESTIMATES & FORECAST, BY REGIONAL, 2019-2032 (USD Billions)   
    300.     Table 98. Malaysia Managed Industrial Ethernet Switches Market SIZE ESTIMATES & FORECAST, BY SWITCH TYPE, 2019-2032 (USD Billions)   
    301.     Table 99. Malaysia Managed Industrial Ethernet Switches Market SIZE ESTIMATES & FORECAST, BY PORT CONFIGURATION, 2019-2032 (USD Billions)   
    302.     Table 100. Malaysia Managed Industrial Ethernet Switches Market SIZE ESTIMATES & FORECAST, BY NETWORK PROTOCOL, 2019-2032 (USD Billions)   
    303.     Table 101. Malaysia Managed Industrial Ethernet Switches Market SIZE ESTIMATES & FORECAST, BY APPLICATION SECTOR, 2019-2032 (USD Billions)   
    304.     Table 102. Malaysia Managed Industrial Ethernet Switches Market SIZE ESTIMATES & FORECAST, BY FORM FACTOR, 2019-2032 (USD Billions)   
    305.     Table 103. Malaysia Managed Industrial Ethernet Switches Market SIZE ESTIMATES & FORECAST, BY REGIONAL, 2019-2032 (USD Billions)   
    306.     Table 104. Thailand Managed Industrial Ethernet Switches Market SIZE ESTIMATES & FORECAST, BY SWITCH TYPE, 2019-2032 (USD Billions)   
    307.     Table 105. Thailand Managed Industrial Ethernet Switches Market SIZE ESTIMATES & FORECAST, BY PORT CONFIGURATION, 2019-2032 (USD Billions)   
    308.     Table 106. Thailand Managed Industrial Ethernet Switches Market SIZE ESTIMATES & FORECAST, BY NETWORK PROTOCOL, 2019-2032 (USD Billions)   
    309.     Table 107. Thailand Managed Industrial Ethernet Switches Market SIZE ESTIMATES & FORECAST, BY APPLICATION SECTOR, 2019-2032 (USD Billions)   
    310.     Table 108. Thailand Managed Industrial Ethernet Switches Market SIZE ESTIMATES & FORECAST, BY FORM FACTOR, 2019-2032 (USD Billions)   
    311.     Table 109. Thailand Managed Industrial Ethernet Switches Market SIZE ESTIMATES & FORECAST, BY REGIONAL, 2019-2032 (USD Billions)   
    312.     Table 110. Indonesia Managed Industrial Ethernet Switches Market SIZE ESTIMATES & FORECAST, BY SWITCH TYPE, 2019-2032 (USD Billions)   
    313.     Table 111. Indonesia Managed Industrial Ethernet Switches Market SIZE ESTIMATES & FORECAST, BY PORT CONFIGURATION, 2019-2032 (USD Billions)   
    314.     Table 112. Indonesia Managed Industrial Ethernet Switches Market SIZE ESTIMATES & FORECAST, BY NETWORK PROTOCOL, 2019-2032 (USD Billions)   
    315.     Table 113. Indonesia Managed Industrial Ethernet Switches Market SIZE ESTIMATES & FORECAST, BY APPLICATION SECTOR, 2019-2032 (USD Billions)   
    316.     Table 114. Indonesia Managed Industrial Ethernet Switches Market SIZE ESTIMATES & FORECAST, BY FORM FACTOR, 2019-2032 (USD Billions)   
    317.     Table 115. Indonesia Managed Industrial Ethernet Switches Market SIZE ESTIMATES & FORECAST, BY REGIONAL, 2019-2032 (USD Billions)   
    318.     Table 116. Rest of APAC Managed Industrial Ethernet Switches Market SIZE ESTIMATES & FORECAST, BY SWITCH TYPE, 2019-2032 (USD Billions)   
    319.     Table 117. Rest of APAC Managed Industrial Ethernet Switches Market SIZE ESTIMATES & FORECAST, BY PORT CONFIGURATION, 2019-2032 (USD Billions)   
    320.     Table 118. Rest of APAC Managed Industrial Ethernet Switches Market SIZE ESTIMATES & FORECAST, BY NETWORK PROTOCOL, 2019-2032 (USD Billions)   
    321.     Table 119. Rest of APAC Managed Industrial Ethernet Switches Market SIZE ESTIMATES & FORECAST, BY APPLICATION SECTOR, 2019-2032 (USD Billions)   
    322.     Table 120. Rest of APAC Managed Industrial Ethernet Switches Market SIZE ESTIMATES & FORECAST, BY FORM FACTOR, 2019-2032 (USD Billions)   
    323.     Table 121. Rest of APAC Managed Industrial Ethernet Switches Market SIZE ESTIMATES & FORECAST, BY REGIONAL, 2019-2032 (USD Billions)   
    324.     Table 122. South America Managed Industrial Ethernet Switches Market SIZE ESTIMATES & FORECAST, BY SWITCH TYPE, 2019-2032 (USD Billions)   
    325.     Table 123. South America Managed Industrial Ethernet Switches Market SIZE ESTIMATES & FORECAST, BY PORT CONFIGURATION, 2019-2032 (USD Billions)   
    326.     Table 124. South America Managed Industrial Ethernet Switches Market SIZE ESTIMATES & FORECAST, BY NETWORK PROTOCOL, 2019-2032 (USD Billions)   
    327.     Table 125. South America Managed Industrial Ethernet Switches Market SIZE ESTIMATES & FORECAST, BY APPLICATION SECTOR, 2019-2032 (USD Billions)   
    328.     Table 126. South America Managed Industrial Ethernet Switches Market SIZE ESTIMATES & FORECAST, BY FORM FACTOR, 2019-2032 (USD Billions)   
    329.     Table 127. South America Managed Industrial Ethernet Switches Market SIZE ESTIMATES & FORECAST, BY REGIONAL, 2019-2032 (USD Billions)   
    330.     Table 128. Brazil Managed Industrial Ethernet Switches Market SIZE ESTIMATES & FORECAST, BY SWITCH TYPE, 2019-2032 (USD Billions)   
    331.     Table 129. Brazil Managed Industrial Ethernet Switches Market SIZE ESTIMATES & FORECAST, BY PORT CONFIGURATION, 2019-2032 (USD Billions)   
    332.     Table 130. Brazil Managed Industrial Ethernet Switches Market SIZE ESTIMATES & FORECAST, BY NETWORK PROTOCOL, 2019-2032 (USD Billions)   
    333.     Table 131. Brazil Managed Industrial Ethernet Switches Market SIZE ESTIMATES & FORECAST, BY APPLICATION SECTOR, 2019-2032 (USD Billions)   
    334.     Table 132. Brazil Managed Industrial Ethernet Switches Market SIZE ESTIMATES & FORECAST, BY FORM FACTOR, 2019-2032 (USD Billions)   
    335.     Table 133. Brazil Managed Industrial Ethernet Switches Market SIZE ESTIMATES & FORECAST, BY REGIONAL, 2019-2032 (USD Billions)   
    336.     Table 134. Mexico Managed Industrial Ethernet Switches Market SIZE ESTIMATES & FORECAST, BY SWITCH TYPE, 2019-2032 (USD Billions)   
    337.     Table 135. Mexico Managed Industrial Ethernet Switches Market SIZE ESTIMATES & FORECAST, BY PORT CONFIGURATION, 2019-2032 (USD Billions)   
    338.     Table 136. Mexico Managed Industrial Ethernet Switches Market SIZE ESTIMATES & FORECAST, BY NETWORK PROTOCOL, 2019-2032 (USD Billions)   
    339.     Table 137. Mexico Managed Industrial Ethernet Switches Market SIZE ESTIMATES & FORECAST, BY APPLICATION SECTOR, 2019-2032 (USD Billions)   
    340.     Table 138. Mexico Managed Industrial Ethernet Switches Market SIZE ESTIMATES & FORECAST, BY FORM FACTOR, 2019-2032 (USD Billions)   
    341.     Table 139. Mexico Managed Industrial Ethernet Switches Market SIZE ESTIMATES & FORECAST, BY REGIONAL, 2019-2032 (USD Billions)   
    342.     Table 140. Argentina Managed Industrial Ethernet Switches Market SIZE ESTIMATES & FORECAST, BY SWITCH TYPE, 2019-2032 (USD Billions)   
    343.     Table 141. Argentina Managed Industrial Ethernet Switches Market SIZE ESTIMATES & FORECAST, BY PORT CONFIGURATION, 2019-2032 (USD Billions)   
    344.     Table 142. Argentina Managed Industrial Ethernet Switches Market SIZE ESTIMATES & FORECAST, BY NETWORK PROTOCOL, 2019-2032 (USD Billions)   
    345.     Table 143. Argentina Managed Industrial Ethernet Switches Market SIZE ESTIMATES & FORECAST, BY APPLICATION SECTOR, 2019-2032 (USD Billions)   
    346.     Table 144. Argentina Managed Industrial Ethernet Switches Market SIZE ESTIMATES & FORECAST, BY FORM FACTOR, 2019-2032 (USD Billions)   
    347.     Table 145. Argentina Managed Industrial Ethernet Switches Market SIZE ESTIMATES & FORECAST, BY REGIONAL, 2019-2032 (USD Billions)   
    348.     Table 146. Rest of South America Managed Industrial Ethernet Switches Market SIZE ESTIMATES & FORECAST, BY SWITCH TYPE, 2019-2032 (USD Billions)   
    349.     Table 147. Rest of South America Managed Industrial Ethernet Switches Market SIZE ESTIMATES & FORECAST, BY PORT CONFIGURATION, 2019-2032 (USD Billions)   
    350.     Table 148. Rest of South America Managed Industrial Ethernet Switches Market SIZE ESTIMATES & FORECAST, BY NETWORK PROTOCOL, 2019-2032 (USD Billions)   
    351.     Table 149. Rest of South America Managed Industrial Ethernet Switches Market SIZE ESTIMATES & FORECAST, BY APPLICATION SECTOR, 2019-2032 (USD Billions)   
    352.     Table 150. Rest of South America Managed Industrial Ethernet Switches Market SIZE ESTIMATES & FORECAST, BY FORM FACTOR, 2019-2032 (USD Billions)   
    353.     Table 151. Rest of South America Managed Industrial Ethernet Switches Market SIZE ESTIMATES & FORECAST, BY REGIONAL, 2019-2032 (USD Billions)   
    354.     Table 152. MEA Managed Industrial Ethernet Switches Market SIZE ESTIMATES & FORECAST, BY SWITCH TYPE, 2019-2032 (USD Billions)   
    355.     Table 153. MEA Managed Industrial Ethernet Switches Market SIZE ESTIMATES & FORECAST, BY PORT CONFIGURATION, 2019-2032 (USD Billions)   
    356.     Table 154. MEA Managed Industrial Ethernet Switches Market SIZE ESTIMATES & FORECAST, BY NETWORK PROTOCOL, 2019-2032 (USD Billions)   
    357.     Table 155. MEA Managed Industrial Ethernet Switches Market SIZE ESTIMATES & FORECAST, BY APPLICATION SECTOR, 2019-2032 (USD Billions)   
    358.     Table 156. MEA Managed Industrial Ethernet Switches Market SIZE ESTIMATES & FORECAST, BY FORM FACTOR, 2019-2032 (USD Billions)   
    359.     Table 157. MEA Managed Industrial Ethernet Switches Market SIZE ESTIMATES & FORECAST, BY REGIONAL, 2019-2032 (USD Billions)   
    360.     Table 158. GCC Countries Managed Industrial Ethernet Switches Market SIZE ESTIMATES & FORECAST, BY SWITCH TYPE, 2019-2032 (USD Billions)   
    361.     Table 159. GCC Countries Managed Industrial Ethernet Switches Market SIZE ESTIMATES & FORECAST, BY PORT CONFIGURATION, 2019-2032 (USD Billions)   
    362.     Table 160. GCC Countries Managed Industrial Ethernet Switches Market SIZE ESTIMATES & FORECAST, BY NETWORK PROTOCOL, 2019-2032 (USD Billions)   
    363.     Table 161. GCC Countries Managed Industrial Ethernet Switches Market SIZE ESTIMATES & FORECAST, BY APPLICATION SECTOR, 2019-2032 (USD Billions)   
    364.     Table 162. GCC Countries Managed Industrial Ethernet Switches Market SIZE ESTIMATES & FORECAST, BY FORM FACTOR, 2019-2032 (USD Billions)   
    365.     Table 163. GCC Countries Managed Industrial Ethernet Switches Market SIZE ESTIMATES & FORECAST, BY REGIONAL, 2019-2032 (USD Billions)   
    366.     Table 164. South Africa Managed Industrial Ethernet Switches Market SIZE ESTIMATES & FORECAST, BY SWITCH TYPE, 2019-2032 (USD Billions)   
    367.     Table 165. South Africa Managed Industrial Ethernet Switches Market SIZE ESTIMATES & FORECAST, BY PORT CONFIGURATION, 2019-2032 (USD Billions)   
    368.     Table 166. South Africa Managed Industrial Ethernet Switches Market SIZE ESTIMATES & FORECAST, BY NETWORK PROTOCOL, 2019-2032 (USD Billions)   
    369.     Table 167. South Africa Managed Industrial Ethernet Switches Market SIZE ESTIMATES & FORECAST, BY APPLICATION SECTOR, 2019-2032 (USD Billions)   
    370.     Table 168. South Africa Managed Industrial Ethernet Switches Market SIZE ESTIMATES & FORECAST, BY FORM FACTOR, 2019-2032 (USD Billions)   
    371.     Table 169. South Africa Managed Industrial Ethernet Switches Market SIZE ESTIMATES & FORECAST, BY REGIONAL, 2019-2032 (USD Billions)   
    372.     Table 170. Rest of MEA Managed Industrial Ethernet Switches Market SIZE ESTIMATES & FORECAST, BY SWITCH TYPE, 2019-2032 (USD Billions)   
    373.     Table 171. Rest of MEA Managed Industrial Ethernet Switches Market SIZE ESTIMATES & FORECAST, BY PORT CONFIGURATION, 2019-2032 (USD Billions)   
    374.     Table 172. Rest of MEA Managed Industrial Ethernet Switches Market SIZE ESTIMATES & FORECAST, BY NETWORK PROTOCOL, 2019-2032 (USD Billions)   
    375.     Table 173. Rest of MEA Managed Industrial Ethernet Switches Market SIZE ESTIMATES & FORECAST, BY APPLICATION SECTOR, 2019-2032 (USD Billions)   
    376.     Table 174. Rest of MEA Managed Industrial Ethernet Switches Market SIZE ESTIMATES & FORECAST, BY FORM FACTOR, 2019-2032 (USD Billions)   
    377.     Table 175. Rest of MEA Managed Industrial Ethernet Switches Market SIZE ESTIMATES & FORECAST, BY REGIONAL, 2019-2032 (USD Billions)   
    378.     Table 176. PRODUCT LAUNCH/PRODUCT DEVELOPMENT/APPROVAL   
    379.     Table 177. ACQUISITION/PARTNERSHIP   
    380.     Figure 1. MARKET SYNOPSIS 
    381.     Figure 2. NORTH AMERICA MANAGED INDUSTRIAL ETHERNET SWITCHES MARKET ANALYSIS 
    382.     Figure 3. US MANAGED INDUSTRIAL ETHERNET SWITCHES MARKET ANALYSIS BY SWITCH TYPE 
    383.     Figure 4. US MANAGED INDUSTRIAL ETHERNET SWITCHES MARKET ANALYSIS BY PORT CONFIGURATION 
    384.     Figure 5. US MANAGED INDUSTRIAL ETHERNET SWITCHES MARKET ANALYSIS BY NETWORK PROTOCOL 
    385.     Figure 6. US MANAGED INDUSTRIAL ETHERNET SWITCHES MARKET ANALYSIS BY APPLICATION SECTOR 
    386.     Figure 7. US MANAGED INDUSTRIAL ETHERNET SWITCHES MARKET ANALYSIS BY FORM FACTOR 
    387.     Figure 8. US MANAGED INDUSTRIAL ETHERNET SWITCHES MARKET ANALYSIS BY REGIONAL 
    388.     Figure 9. CANADA MANAGED INDUSTRIAL ETHERNET SWITCHES MARKET ANALYSIS BY SWITCH TYPE 
    389.     Figure 10. CANADA MANAGED INDUSTRIAL ETHERNET SWITCHES MARKET ANALYSIS BY PORT CONFIGURATION 
    390.     Figure 11. CANADA MANAGED INDUSTRIAL ETHERNET SWITCHES MARKET ANALYSIS BY NETWORK PROTOCOL 
    391.     Figure 12. CANADA MANAGED INDUSTRIAL ETHERNET SWITCHES MARKET ANALYSIS BY APPLICATION SECTOR 
    392.     Figure 13. CANADA MANAGED INDUSTRIAL ETHERNET SWITCHES MARKET ANALYSIS BY FORM FACTOR 
    393.     Figure 14. CANADA MANAGED INDUSTRIAL ETHERNET SWITCHES MARKET ANALYSIS BY REGIONAL 
    394.     Figure 15. EUROPE MANAGED INDUSTRIAL ETHERNET SWITCHES MARKET ANALYSIS 
    395.     Figure 16. GERMANY MANAGED INDUSTRIAL ETHERNET SWITCHES MARKET ANALYSIS BY SWITCH TYPE 
    396.     Figure 17. GERMANY MANAGED INDUSTRIAL ETHERNET SWITCHES MARKET ANALYSIS BY PORT CONFIGURATION 
    397.     Figure 18. GERMANY MANAGED INDUSTRIAL ETHERNET SWITCHES MARKET ANALYSIS BY NETWORK PROTOCOL 
    398.     Figure 19. GERMANY MANAGED INDUSTRIAL ETHERNET SWITCHES MARKET ANALYSIS BY APPLICATION SECTOR 
    399.     Figure 20. GERMANY MANAGED INDUSTRIAL ETHERNET SWITCHES MARKET ANALYSIS BY FORM FACTOR 
    400.     Figure 21. GERMANY MANAGED INDUSTRIAL ETHERNET SWITCHES MARKET ANALYSIS BY REGIONAL 
    401.     Figure 22. UK MANAGED INDUSTRIAL ETHERNET SWITCHES MARKET ANALYSIS BY SWITCH TYPE 
    402.     Figure 23. UK MANAGED INDUSTRIAL ETHERNET SWITCHES MARKET ANALYSIS BY PORT CONFIGURATION 
    403.     Figure 24. UK MANAGED INDUSTRIAL ETHERNET SWITCHES MARKET ANALYSIS BY NETWORK PROTOCOL 
    404.     Figure 25. UK MANAGED INDUSTRIAL ETHERNET SWITCHES MARKET ANALYSIS BY APPLICATION SECTOR 
    405.     Figure 26. UK MANAGED INDUSTRIAL ETHERNET SWITCHES MARKET ANALYSIS BY FORM FACTOR 
    406.     Figure 27. UK MANAGED INDUSTRIAL ETHERNET SWITCHES MARKET ANALYSIS BY REGIONAL 
    407.     Figure 28. FRANCE MANAGED INDUSTRIAL ETHERNET SWITCHES MARKET ANALYSIS BY SWITCH TYPE 
    408.     Figure 29. FRANCE MANAGED INDUSTRIAL ETHERNET SWITCHES MARKET ANALYSIS BY PORT CONFIGURATION 
    409.     Figure 30. FRANCE MANAGED INDUSTRIAL ETHERNET SWITCHES MARKET ANALYSIS BY NETWORK PROTOCOL 
    410.     Figure 31. FRANCE MANAGED INDUSTRIAL ETHERNET SWITCHES MARKET ANALYSIS BY APPLICATION SECTOR 
    411.     Figure 32. FRANCE MANAGED INDUSTRIAL ETHERNET SWITCHES MARKET ANALYSIS BY FORM FACTOR 
    412.     Figure 33. FRANCE MANAGED INDUSTRIAL ETHERNET SWITCHES MARKET ANALYSIS BY REGIONAL 
    413.     Figure 34. RUSSIA MANAGED INDUSTRIAL ETHERNET SWITCHES MARKET ANALYSIS BY SWITCH TYPE 
    414.     Figure 35. RUSSIA MANAGED INDUSTRIAL ETHERNET SWITCHES MARKET ANALYSIS BY PORT CONFIGURATION 
    415.     Figure 36. RUSSIA MANAGED INDUSTRIAL ETHERNET SWITCHES MARKET ANALYSIS BY NETWORK PROTOCOL 
    416.     Figure 37. RUSSIA MANAGED INDUSTRIAL ETHERNET SWITCHES MARKET ANALYSIS BY APPLICATION SECTOR 
    417.     Figure 38. RUSSIA MANAGED INDUSTRIAL ETHERNET SWITCHES MARKET ANALYSIS BY FORM FACTOR 
    418.     Figure 39. RUSSIA MANAGED INDUSTRIAL ETHERNET SWITCHES MARKET ANALYSIS BY REGIONAL 
    419.     Figure 40. ITALY MANAGED INDUSTRIAL ETHERNET SWITCHES MARKET ANALYSIS BY SWITCH TYPE 
    420.     Figure 41. ITALY MANAGED INDUSTRIAL ETHERNET SWITCHES MARKET ANALYSIS BY PORT CONFIGURATION 
    421.     Figure 42. ITALY MANAGED INDUSTRIAL ETHERNET SWITCHES MARKET ANALYSIS BY NETWORK PROTOCOL 
    422.     Figure 43. ITALY MANAGED INDUSTRIAL ETHERNET SWITCHES MARKET ANALYSIS BY APPLICATION SECTOR 
    423.     Figure 44. ITALY MANAGED INDUSTRIAL ETHERNET SWITCHES MARKET ANALYSIS BY FORM FACTOR 
    424.     Figure 45. ITALY MANAGED INDUSTRIAL ETHERNET SWITCHES MARKET ANALYSIS BY REGIONAL 
    425.     Figure 46. SPAIN MANAGED INDUSTRIAL ETHERNET SWITCHES MARKET ANALYSIS BY SWITCH TYPE 
    426.     Figure 47. SPAIN MANAGED INDUSTRIAL ETHERNET SWITCHES MARKET ANALYSIS BY PORT CONFIGURATION 
    427.     Figure 48. SPAIN MANAGED INDUSTRIAL ETHERNET SWITCHES MARKET ANALYSIS BY NETWORK PROTOCOL 
    428.     Figure 49. SPAIN MANAGED INDUSTRIAL ETHERNET SWITCHES MARKET ANALYSIS BY APPLICATION SECTOR 
    429.     Figure 50. SPAIN MANAGED INDUSTRIAL ETHERNET SWITCHES MARKET ANALYSIS BY FORM FACTOR 
    430.     Figure 51. SPAIN MANAGED INDUSTRIAL ETHERNET SWITCHES MARKET ANALYSIS BY REGIONAL 
    431.     Figure 52. REST OF EUROPE MANAGED INDUSTRIAL ETHERNET SWITCHES MARKET ANALYSIS BY SWITCH TYPE 
    432.     Figure 53. REST OF EUROPE MANAGED INDUSTRIAL ETHERNET SWITCHES MARKET ANALYSIS BY PORT CONFIGURATION 
    433.     Figure 54. REST OF EUROPE MANAGED INDUSTRIAL ETHERNET SWITCHES MARKET ANALYSIS BY NETWORK PROTOCOL 
    434.     Figure 55. REST OF EUROPE MANAGED INDUSTRIAL ETHERNET SWITCHES MARKET ANALYSIS BY APPLICATION SECTOR 
    435.     Figure 56. REST OF EUROPE MANAGED INDUSTRIAL ETHERNET SWITCHES MARKET ANALYSIS BY FORM FACTOR 
    436.     Figure 57. REST OF EUROPE MANAGED INDUSTRIAL ETHERNET SWITCHES MARKET ANALYSIS BY REGIONAL 
    437.     Figure 58. APAC MANAGED INDUSTRIAL ETHERNET SWITCHES MARKET ANALYSIS 
    438.     Figure 59. CHINA MANAGED INDUSTRIAL ETHERNET SWITCHES MARKET ANALYSIS BY SWITCH TYPE 
    439.     Figure 60. CHINA MANAGED INDUSTRIAL ETHERNET SWITCHES MARKET ANALYSIS BY PORT CONFIGURATION 
    440.     Figure 61. CHINA MANAGED INDUSTRIAL ETHERNET SWITCHES MARKET ANALYSIS BY NETWORK PROTOCOL 
    441.     Figure 62. CHINA MANAGED INDUSTRIAL ETHERNET SWITCHES MARKET ANALYSIS BY APPLICATION SECTOR 
    442.     Figure 63. CHINA MANAGED INDUSTRIAL ETHERNET SWITCHES MARKET ANALYSIS BY FORM FACTOR 
    443.     Figure 64. CHINA MANAGED INDUSTRIAL ETHERNET SWITCHES MARKET ANALYSIS BY REGIONAL 
    444.     Figure 65. INDIA MANAGED INDUSTRIAL ETHERNET SWITCHES MARKET ANALYSIS BY SWITCH TYPE 
    445.     Figure 66. INDIA MANAGED INDUSTRIAL ETHERNET SWITCHES MARKET ANALYSIS BY PORT CONFIGURATION 
    446.     Figure 67. INDIA MANAGED INDUSTRIAL ETHERNET SWITCHES MARKET ANALYSIS BY NETWORK PROTOCOL 
    447.     Figure 68. INDIA MANAGED INDUSTRIAL ETHERNET SWITCHES MARKET ANALYSIS BY APPLICATION SECTOR 
    448.     Figure 69. INDIA MANAGED INDUSTRIAL ETHERNET SWITCHES MARKET ANALYSIS BY FORM FACTOR 
    449.     Figure 70. INDIA MANAGED INDUSTRIAL ETHERNET SWITCHES MARKET ANALYSIS BY REGIONAL 
    450.     Figure 71. JAPAN MANAGED INDUSTRIAL ETHERNET SWITCHES MARKET ANALYSIS BY SWITCH TYPE 
    451.     Figure 72. JAPAN MANAGED INDUSTRIAL ETHERNET SWITCHES MARKET ANALYSIS BY PORT CONFIGURATION 
    452.     Figure 73. JAPAN MANAGED INDUSTRIAL ETHERNET SWITCHES MARKET ANALYSIS BY NETWORK PROTOCOL 
    453.     Figure 74. JAPAN MANAGED INDUSTRIAL ETHERNET SWITCHES MARKET ANALYSIS BY APPLICATION SECTOR 
    454.     Figure 75. JAPAN MANAGED INDUSTRIAL ETHERNET SWITCHES MARKET ANALYSIS BY FORM FACTOR 
    455.     Figure 76. JAPAN MANAGED INDUSTRIAL ETHERNET SWITCHES MARKET ANALYSIS BY REGIONAL 
    456.     Figure 77. SOUTH KOREA MANAGED INDUSTRIAL ETHERNET SWITCHES MARKET ANALYSIS BY SWITCH TYPE 
    457.     Figure 78. SOUTH KOREA MANAGED INDUSTRIAL ETHERNET SWITCHES MARKET ANALYSIS BY PORT CONFIGURATION 
    458.     Figure 79. SOUTH KOREA MANAGED INDUSTRIAL ETHERNET SWITCHES MARKET ANALYSIS BY NETWORK PROTOCOL 
    459.     Figure 80. SOUTH KOREA MANAGED INDUSTRIAL ETHERNET SWITCHES MARKET ANALYSIS BY APPLICATION SECTOR 
    460.     Figure 81. SOUTH KOREA MANAGED INDUSTRIAL ETHERNET SWITCHES MARKET ANALYSIS BY FORM FACTOR 
    461.     Figure 82. SOUTH KOREA MANAGED INDUSTRIAL ETHERNET SWITCHES MARKET ANALYSIS BY REGIONAL 
    462.     Figure 83. MALAYSIA MANAGED INDUSTRIAL ETHERNET SWITCHES MARKET ANALYSIS BY SWITCH TYPE 
    463.     Figure 84. MALAYSIA MANAGED INDUSTRIAL ETHERNET SWITCHES MARKET ANALYSIS BY PORT CONFIGURATION 
    464.     Figure 85. MALAYSIA MANAGED INDUSTRIAL ETHERNET SWITCHES MARKET ANALYSIS BY NETWORK PROTOCOL 
    465.     Figure 86. MALAYSIA MANAGED INDUSTRIAL ETHERNET SWITCHES MARKET ANALYSIS BY APPLICATION SECTOR 
    466.     Figure 87. MALAYSIA MANAGED INDUSTRIAL ETHERNET SWITCHES MARKET ANALYSIS BY FORM FACTOR 
    467.     Figure 88. MALAYSIA MANAGED INDUSTRIAL ETHERNET SWITCHES MARKET ANALYSIS BY REGIONAL 
    468.     Figure 89. THAILAND MANAGED INDUSTRIAL ETHERNET SWITCHES MARKET ANALYSIS BY SWITCH TYPE 
    469.     Figure 90. THAILAND MANAGED INDUSTRIAL ETHERNET SWITCHES MARKET ANALYSIS BY PORT CONFIGURATION 
    470.     Figure 91. THAILAND MANAGED INDUSTRIAL ETHERNET SWITCHES MARKET ANALYSIS BY NETWORK PROTOCOL 
    471.     Figure 92. THAILAND MANAGED INDUSTRIAL ETHERNET SWITCHES MARKET ANALYSIS BY APPLICATION SECTOR 
    472.     Figure 93. THAILAND MANAGED INDUSTRIAL ETHERNET SWITCHES MARKET ANALYSIS BY FORM FACTOR 
    473.     Figure 94. THAILAND MANAGED INDUSTRIAL ETHERNET SWITCHES MARKET ANALYSIS BY REGIONAL 
    474.     Figure 95. INDONESIA MANAGED INDUSTRIAL ETHERNET SWITCHES MARKET ANALYSIS BY SWITCH TYPE 
    475.     Figure 96. INDONESIA MANAGED INDUSTRIAL ETHERNET SWITCHES MARKET ANALYSIS BY PORT CONFIGURATION 
    476.     Figure 97. INDONESIA MANAGED INDUSTRIAL ETHERNET SWITCHES MARKET ANALYSIS BY NETWORK PROTOCOL 
    477.     Figure 98. INDONESIA MANAGED INDUSTRIAL ETHERNET SWITCHES MARKET ANALYSIS BY APPLICATION SECTOR 
    478.     Figure 99. INDONESIA MANAGED INDUSTRIAL ETHERNET SWITCHES MARKET ANALYSIS BY FORM FACTOR 
    479.     Figure 100. INDONESIA MANAGED INDUSTRIAL ETHERNET SWITCHES MARKET ANALYSIS BY REGIONAL 
    480.     Figure 101. REST OF APAC MANAGED INDUSTRIAL ETHERNET SWITCHES MARKET ANALYSIS BY SWITCH TYPE 
    481.     Figure 102. REST OF APAC MANAGED INDUSTRIAL ETHERNET SWITCHES MARKET ANALYSIS BY PORT CONFIGURATION 
    482.     Figure 103. REST OF APAC MANAGED INDUSTRIAL ETHERNET SWITCHES MARKET ANALYSIS BY NETWORK PROTOCOL 
    483.     Figure 104. REST OF APAC MANAGED INDUSTRIAL ETHERNET SWITCHES MARKET ANALYSIS BY APPLICATION SECTOR 
    484.     Figure 105. REST OF APAC MANAGED INDUSTRIAL ETHERNET SWITCHES MARKET ANALYSIS BY FORM FACTOR 
    485.     Figure 106. REST OF APAC MANAGED INDUSTRIAL ETHERNET SWITCHES MARKET ANALYSIS BY REGIONAL 
    486.     Figure 107. SOUTH AMERICA MANAGED INDUSTRIAL ETHERNET SWITCHES MARKET ANALYSIS 
    487.     Figure 108. BRAZIL MANAGED INDUSTRIAL ETHERNET SWITCHES MARKET ANALYSIS BY SWITCH TYPE 
    488.     Figure 109. BRAZIL MANAGED INDUSTRIAL ETHERNET SWITCHES MARKET ANALYSIS BY PORT CONFIGURATION 
    489.     Figure 110. BRAZIL MANAGED INDUSTRIAL ETHERNET SWITCHES MARKET ANALYSIS BY NETWORK PROTOCOL 
    490.     Figure 111. BRAZIL MANAGED INDUSTRIAL ETHERNET SWITCHES MARKET ANALYSIS BY APPLICATION SECTOR 
    491.     Figure 112. BRAZIL MANAGED INDUSTRIAL ETHERNET SWITCHES MARKET ANALYSIS BY FORM FACTOR 
    492.     Figure 113. BRAZIL MANAGED INDUSTRIAL ETHERNET SWITCHES MARKET ANALYSIS BY REGIONAL 
    493.     Figure 114. MEXICO MANAGED INDUSTRIAL ETHERNET SWITCHES MARKET ANALYSIS BY SWITCH TYPE 
    494.     Figure 115. MEXICO MANAGED INDUSTRIAL ETHERNET SWITCHES MARKET ANALYSIS BY PORT CONFIGURATION 
    495.     Figure 116. MEXICO MANAGED INDUSTRIAL ETHERNET SWITCHES MARKET ANALYSIS BY NETWORK PROTOCOL 
    496.     Figure 117. MEXICO MANAGED INDUSTRIAL ETHERNET SWITCHES MARKET ANALYSIS BY APPLICATION SECTOR 
    497.     Figure 118. MEXICO MANAGED INDUSTRIAL ETHERNET SWITCHES MARKET ANALYSIS BY FORM FACTOR 
    498.     Figure 119. MEXICO MANAGED INDUSTRIAL ETHERNET SWITCHES MARKET ANALYSIS BY REGIONAL 
    499.     Figure 120. ARGENTINA MANAGED INDUSTRIAL ETHERNET SWITCHES MARKET ANALYSIS BY SWITCH TYPE 
    500.     Figure 121. ARGENTINA MANAGED INDUSTRIAL ETHERNET SWITCHES MARKET ANALYSIS BY PORT CONFIGURATION 
    501.     Figure 122. ARGENTINA MANAGED INDUSTRIAL ETHERNET SWITCHES MARKET ANALYSIS BY NETWORK PROTOCOL 
    502.     Figure 123. ARGENTINA MANAGED INDUSTRIAL ETHERNET SWITCHES MARKET ANALYSIS BY APPLICATION SECTOR 
    503.     Figure 124. ARGENTINA MANAGED INDUSTRIAL ETHERNET SWITCHES MARKET ANALYSIS BY FORM FACTOR 
    504.     Figure 125. ARGENTINA MANAGED INDUSTRIAL ETHERNET SWITCHES MARKET ANALYSIS BY REGIONAL 
    505.     Figure 126. REST OF SOUTH AMERICA MANAGED INDUSTRIAL ETHERNET SWITCHES MARKET ANALYSIS BY SWITCH TYPE 
    506.     Figure 127. REST OF SOUTH AMERICA MANAGED INDUSTRIAL ETHERNET SWITCHES MARKET ANALYSIS BY PORT CONFIGURATION 
    507.     Figure 128. REST OF SOUTH AMERICA MANAGED INDUSTRIAL ETHERNET SWITCHES MARKET ANALYSIS BY NETWORK PROTOCOL 
    508.     Figure 129. REST OF SOUTH AMERICA MANAGED INDUSTRIAL ETHERNET SWITCHES MARKET ANALYSIS BY APPLICATION SECTOR 
    509.     Figure 130. REST OF SOUTH AMERICA MANAGED INDUSTRIAL ETHERNET SWITCHES MARKET ANALYSIS BY FORM FACTOR 
    510.     Figure 131. REST OF SOUTH AMERICA MANAGED INDUSTRIAL ETHERNET SWITCHES MARKET ANALYSIS BY REGIONAL 
    511.     Figure 132. MEA MANAGED INDUSTRIAL ETHERNET SWITCHES MARKET ANALYSIS 
    512.     Figure 133. GCC COUNTRIES MANAGED INDUSTRIAL ETHERNET SWITCHES MARKET ANALYSIS BY SWITCH TYPE 
    513.     Figure 134. GCC COUNTRIES MANAGED INDUSTRIAL ETHERNET SWITCHES MARKET ANALYSIS BY PORT CONFIGURATION 
    514.     Figure 135. GCC COUNTRIES MANAGED INDUSTRIAL ETHERNET SWITCHES MARKET ANALYSIS BY NETWORK PROTOCOL 
    515.     Figure 136. GCC COUNTRIES MANAGED INDUSTRIAL ETHERNET SWITCHES MARKET ANALYSIS BY APPLICATION SECTOR 
    516.     Figure 137. GCC COUNTRIES MANAGED INDUSTRIAL ETHERNET SWITCHES MARKET ANALYSIS BY FORM FACTOR 
    517.     Figure 138. GCC COUNTRIES MANAGED INDUSTRIAL ETHERNET SWITCHES MARKET ANALYSIS BY REGIONAL 
    518.     Figure 139. SOUTH AFRICA MANAGED INDUSTRIAL ETHERNET SWITCHES MARKET ANALYSIS BY SWITCH TYPE 
    519.     Figure 140. SOUTH AFRICA MANAGED INDUSTRIAL ETHERNET SWITCHES MARKET ANALYSIS BY PORT CONFIGURATION 
    520.     Figure 141. SOUTH AFRICA MANAGED INDUSTRIAL ETHERNET SWITCHES MARKET ANALYSIS BY NETWORK PROTOCOL 
    521.     Figure 142. SOUTH AFRICA MANAGED INDUSTRIAL ETHERNET SWITCHES MARKET ANALYSIS BY APPLICATION SECTOR 
    522.     Figure 143. SOUTH AFRICA MANAGED INDUSTRIAL ETHERNET SWITCHES MARKET ANALYSIS BY FORM FACTOR 
    523.     Figure 144. SOUTH AFRICA MANAGED INDUSTRIAL ETHERNET SWITCHES MARKET ANALYSIS BY REGIONAL 
    524.     Figure 145. REST OF MEA MANAGED INDUSTRIAL ETHERNET SWITCHES MARKET ANALYSIS BY SWITCH TYPE 
    525.     Figure 146. REST OF MEA MANAGED INDUSTRIAL ETHERNET SWITCHES MARKET ANALYSIS BY PORT CONFIGURATION 
    526.     Figure 147. REST OF MEA MANAGED INDUSTRIAL ETHERNET SWITCHES MARKET ANALYSIS BY NETWORK PROTOCOL 
    527.     Figure 148. REST OF MEA MANAGED INDUSTRIAL ETHERNET SWITCHES MARKET ANALYSIS BY APPLICATION SECTOR 
    528.     Figure 149. REST OF MEA MANAGED INDUSTRIAL ETHERNET SWITCHES MARKET ANALYSIS BY FORM FACTOR 
    529.     Figure 150. REST OF MEA MANAGED INDUSTRIAL ETHERNET SWITCHES MARKET ANALYSIS BY REGIONAL 
    530.     Figure 151. KEY BUYING CRITERIA OF MANAGED INDUSTRIAL ETHERNET SWITCHES MARKET 
    531.     Figure 152. RESEARCH PROCESS OF MRFR 
    532.     Figure 153. DRO ANALYSIS OF MANAGED INDUSTRIAL ETHERNET SWITCHES MARKET 
    533.     Figure 154. DRIVERS IMPACT ANALYSIS: MANAGED INDUSTRIAL ETHERNET SWITCHES MARKET 
    534.     Figure 155. RESTRAINTS IMPACT ANALYSIS: MANAGED INDUSTRIAL ETHERNET SWITCHES MARKET 
    535.     Figure 156. SUPPLY / VALUE CHAIN: MANAGED INDUSTRIAL ETHERNET SWITCHES MARKET 
    536.     Figure 157. MANAGED INDUSTRIAL ETHERNET SWITCHES MARKET, BY SWITCH TYPE, 2024 (% SHARE) 
    537.     Figure 158. MANAGED INDUSTRIAL ETHERNET SWITCHES MARKET, BY SWITCH TYPE, 2019 TO 2032 (USD Billions) 
    538.     Figure 159. MANAGED INDUSTRIAL ETHERNET SWITCHES MARKET, BY PORT CONFIGURATION, 2024 (% SHARE) 
    539.     Figure 160. MANAGED INDUSTRIAL ETHERNET SWITCHES MARKET, BY PORT CONFIGURATION, 2019 TO 2032 (USD Billions) 
    540.     Figure 161. MANAGED INDUSTRIAL ETHERNET SWITCHES MARKET, BY NETWORK PROTOCOL, 2024 (% SHARE) 
    541.     Figure 162. MANAGED INDUSTRIAL ETHERNET SWITCHES MARKET, BY NETWORK PROTOCOL, 2019 TO 2032 (USD Billions) 
    542.     Figure 163. MANAGED INDUSTRIAL ETHERNET SWITCHES MARKET, BY APPLICATION SECTOR, 2024 (% SHARE) 
    543.     Figure 164. MANAGED INDUSTRIAL ETHERNET SWITCHES MARKET, BY APPLICATION SECTOR, 2019 TO 2032 (USD Billions) 
    544.     Figure 165. MANAGED INDUSTRIAL ETHERNET SWITCHES MARKET, BY FORM FACTOR, 2024 (% SHARE) 
    545.     Figure 166. MANAGED INDUSTRIAL ETHERNET SWITCHES MARKET, BY FORM FACTOR, 2019 TO 2032 (USD Billions) 
    546.     Figure 167. MANAGED INDUSTRIAL ETHERNET SWITCHES MARKET, BY REGIONAL, 2024 (% SHARE) 
    547.     Figure 168. MANAGED INDUSTRIAL ETHERNET SWITCHES MARKET, BY REGIONAL, 2019 TO 2032 (USD Billions) 
    548.     Figure 169. BENCHMARKING OF MAJOR COMPETITORS 

    Managed Industrial Ethernet Switches Market Market Segmentation

    Managed Industrial Ethernet Switches Market By Switch Type (USD Billion, 2019-2032)

    • Managed Switches
    • Unmanaged Switches
    • Smart Switches


    Managed Industrial Ethernet Switches Market By Port Configuration (USD Billion, 2019-2032)

    • 10/100/1000 Ethernet Ports
    • 10 Gigabit Ethernet Ports
    • Fiber Optic Ports


    Managed Industrial Ethernet Switches Market By Network Protocol (USD Billion, 2019-2032)

    • Ethernet/IP
    • Profinet
    • EtherCAT


    Managed Industrial Ethernet Switches Market By Application Sector (USD Billion, 2019-2032)

    • Manufacturing
    • Transportation
    • Energy & Utilities
    • Oil & Gas


    Managed Industrial Ethernet Switches Market By Form Factor (USD Billion, 2019-2032)

    • Rack-Mount
    • DIN-Rail
    • Wall-Mount


    Managed Industrial Ethernet Switches Market By Regional (USD Billion, 2019-2032)

    • North America
    • Europe
    • South America
    • Asia Pacific
    • Middle East and Africa

    Managed Industrial Ethernet Switches Market Regional Outlook (USD Billion, 2019-2032)


    • North America Outlook (USD Billion, 2019-2032)

      • North America Managed Industrial Ethernet Switches Market by Switch Type

        • Managed Switches
        • Unmanaged Switches
        • Smart Switches
      • North America Managed Industrial Ethernet Switches Market by Port Configuration Type

        • 10/100/1000 Ethernet Ports
        • 10 Gigabit Ethernet Ports
        • Fiber Optic Ports
      • North America Managed Industrial Ethernet Switches Market by Network Protocol Type

        • Ethernet/IP
        • Profinet
        • EtherCAT
      • North America Managed Industrial Ethernet Switches Market by Application Sector Type

        • Manufacturing
        • Transportation
        • Energy & Utilities
        • Oil & Gas
      • North America Managed Industrial Ethernet Switches Market by Form Factor Type

        • Rack-Mount
        • DIN-Rail
        • Wall-Mount
      • North America Managed Industrial Ethernet Switches Market by Regional Type

        • US
        • Canada
      • US Outlook (USD Billion, 2019-2032)
      • US Managed Industrial Ethernet Switches Market by Switch Type

        • Managed Switches
        • Unmanaged Switches
        • Smart Switches
      • US Managed Industrial Ethernet Switches Market by Port Configuration Type

        • 10/100/1000 Ethernet Ports
        • 10 Gigabit Ethernet Ports
        • Fiber Optic Ports
      • US Managed Industrial Ethernet Switches Market by Network Protocol Type

        • Ethernet/IP
        • Profinet
        • EtherCAT
      • US Managed Industrial Ethernet Switches Market by Application Sector Type

        • Manufacturing
        • Transportation
        • Energy & Utilities
        • Oil & Gas
      • US Managed Industrial Ethernet Switches Market by Form Factor Type

        • Rack-Mount
        • DIN-Rail
        • Wall-Mount
      • CANADA Outlook (USD Billion, 2019-2032)
      • CANADA Managed Industrial Ethernet Switches Market by Switch Type

        • Managed Switches
        • Unmanaged Switches
        • Smart Switches
      • CANADA Managed Industrial Ethernet Switches Market by Port Configuration Type

        • 10/100/1000 Ethernet Ports
        • 10 Gigabit Ethernet Ports
        • Fiber Optic Ports
      • CANADA Managed Industrial Ethernet Switches Market by Network Protocol Type

        • Ethernet/IP
        • Profinet
        • EtherCAT
      • CANADA Managed Industrial Ethernet Switches Market by Application Sector Type

        • Manufacturing
        • Transportation
        • Energy & Utilities
        • Oil & Gas
      • CANADA Managed Industrial Ethernet Switches Market by Form Factor Type

        • Rack-Mount
        • DIN-Rail
        • Wall-Mount
    • Europe Outlook (USD Billion, 2019-2032)

      • Europe Managed Industrial Ethernet Switches Market by Switch Type

        • Managed Switches
        • Unmanaged Switches
        • Smart Switches
      • Europe Managed Industrial Ethernet Switches Market by Port Configuration Type

        • 10/100/1000 Ethernet Ports
        • 10 Gigabit Ethernet Ports
        • Fiber Optic Ports
      • Europe Managed Industrial Ethernet Switches Market by Network Protocol Type

        • Ethernet/IP
        • Profinet
        • EtherCAT
      • Europe Managed Industrial Ethernet Switches Market by Application Sector Type

        • Manufacturing
        • Transportation
        • Energy & Utilities
        • Oil & Gas
      • Europe Managed Industrial Ethernet Switches Market by Form Factor Type

        • Rack-Mount
        • DIN-Rail
        • Wall-Mount
      • Europe Managed Industrial Ethernet Switches Market by Regional Type

        • Germany
        • UK
        • France
        • Russia
        • Italy
        • Spain
        • Rest of Europe
      • GERMANY Outlook (USD Billion, 2019-2032)
      • GERMANY Managed Industrial Ethernet Switches Market by Switch Type

        • Managed Switches
        • Unmanaged Switches
        • Smart Switches
      • GERMANY Managed Industrial Ethernet Switches Market by Port Configuration Type

        • 10/100/1000 Ethernet Ports
        • 10 Gigabit Ethernet Ports
        • Fiber Optic Ports
      • GERMANY Managed Industrial Ethernet Switches Market by Network Protocol Type

        • Ethernet/IP
        • Profinet
        • EtherCAT
      • GERMANY Managed Industrial Ethernet Switches Market by Application Sector Type

        • Manufacturing
        • Transportation
        • Energy & Utilities
        • Oil & Gas
      • GERMANY Managed Industrial Ethernet Switches Market by Form Factor Type

        • Rack-Mount
        • DIN-Rail
        • Wall-Mount
      • UK Outlook (USD Billion, 2019-2032)
      • UK Managed Industrial Ethernet Switches Market by Switch Type

        • Managed Switches
        • Unmanaged Switches
        • Smart Switches
      • UK Managed Industrial Ethernet Switches Market by Port Configuration Type

        • 10/100/1000 Ethernet Ports
        • 10 Gigabit Ethernet Ports
        • Fiber Optic Ports
      • UK Managed Industrial Ethernet Switches Market by Network Protocol Type

        • Ethernet/IP
        • Profinet
        • EtherCAT
      • UK Managed Industrial Ethernet Switches Market by Application Sector Type

        • Manufacturing
        • Transportation
        • Energy & Utilities
        • Oil & Gas
      • UK Managed Industrial Ethernet Switches Market by Form Factor Type

        • Rack-Mount
        • DIN-Rail
        • Wall-Mount
      • FRANCE Outlook (USD Billion, 2019-2032)
      • FRANCE Managed Industrial Ethernet Switches Market by Switch Type

        • Managed Switches
        • Unmanaged Switches
        • Smart Switches
      • FRANCE Managed Industrial Ethernet Switches Market by Port Configuration Type

        • 10/100/1000 Ethernet Ports
        • 10 Gigabit Ethernet Ports
        • Fiber Optic Ports
      • FRANCE Managed Industrial Ethernet Switches Market by Network Protocol Type

        • Ethernet/IP
        • Profinet
        • EtherCAT
      • FRANCE Managed Industrial Ethernet Switches Market by Application Sector Type

        • Manufacturing
        • Transportation
        • Energy & Utilities
        • Oil & Gas
      • FRANCE Managed Industrial Ethernet Switches Market by Form Factor Type

        • Rack-Mount
        • DIN-Rail
        • Wall-Mount
      • RUSSIA Outlook (USD Billion, 2019-2032)
      • RUSSIA Managed Industrial Ethernet Switches Market by Switch Type

        • Managed Switches
        • Unmanaged Switches
        • Smart Switches
      • RUSSIA Managed Industrial Ethernet Switches Market by Port Configuration Type

        • 10/100/1000 Ethernet Ports
        • 10 Gigabit Ethernet Ports
        • Fiber Optic Ports
      • RUSSIA Managed Industrial Ethernet Switches Market by Network Protocol Type

        • Ethernet/IP
        • Profinet
        • EtherCAT
      • RUSSIA Managed Industrial Ethernet Switches Market by Application Sector Type

        • Manufacturing
        • Transportation
        • Energy & Utilities
        • Oil & Gas
      • RUSSIA Managed Industrial Ethernet Switches Market by Form Factor Type

        • Rack-Mount
        • DIN-Rail
        • Wall-Mount
      • ITALY Outlook (USD Billion, 2019-2032)
      • ITALY Managed Industrial Ethernet Switches Market by Switch Type

        • Managed Switches
        • Unmanaged Switches
        • Smart Switches
      • ITALY Managed Industrial Ethernet Switches Market by Port Configuration Type

        • 10/100/1000 Ethernet Ports
        • 10 Gigabit Ethernet Ports
        • Fiber Optic Ports
      • ITALY Managed Industrial Ethernet Switches Market by Network Protocol Type

        • Ethernet/IP
        • Profinet
        • EtherCAT
      • ITALY Managed Industrial Ethernet Switches Market by Application Sector Type

        • Manufacturing
        • Transportation
        • Energy & Utilities
        • Oil & Gas
      • ITALY Managed Industrial Ethernet Switches Market by Form Factor Type

        • Rack-Mount
        • DIN-Rail
        • Wall-Mount
      • SPAIN Outlook (USD Billion, 2019-2032)
      • SPAIN Managed Industrial Ethernet Switches Market by Switch Type

        • Managed Switches
        • Unmanaged Switches
        • Smart Switches
      • SPAIN Managed Industrial Ethernet Switches Market by Port Configuration Type

        • 10/100/1000 Ethernet Ports
        • 10 Gigabit Ethernet Ports
        • Fiber Optic Ports
      • SPAIN Managed Industrial Ethernet Switches Market by Network Protocol Type

        • Ethernet/IP
        • Profinet
        • EtherCAT
      • SPAIN Managed Industrial Ethernet Switches Market by Application Sector Type

        • Manufacturing
        • Transportation
        • Energy & Utilities
        • Oil & Gas
      • SPAIN Managed Industrial Ethernet Switches Market by Form Factor Type

        • Rack-Mount
        • DIN-Rail
        • Wall-Mount
      • REST OF EUROPE Outlook (USD Billion, 2019-2032)
      • REST OF EUROPE Managed Industrial Ethernet Switches Market by Switch Type

        • Managed Switches
        • Unmanaged Switches
        • Smart Switches
      • REST OF EUROPE Managed Industrial Ethernet Switches Market by Port Configuration Type

        • 10/100/1000 Ethernet Ports
        • 10 Gigabit Ethernet Ports
        • Fiber Optic Ports
      • REST OF EUROPE Managed Industrial Ethernet Switches Market by Network Protocol Type

        • Ethernet/IP
        • Profinet
        • EtherCAT
      • REST OF EUROPE Managed Industrial Ethernet Switches Market by Application Sector Type

        • Manufacturing
        • Transportation
        • Energy & Utilities
        • Oil & Gas
      • REST OF EUROPE Managed Industrial Ethernet Switches Market by Form Factor Type

        • Rack-Mount
        • DIN-Rail
        • Wall-Mount
    • APAC Outlook (USD Billion, 2019-2032)

      • APAC Managed Industrial Ethernet Switches Market by Switch Type

        • Managed Switches
        • Unmanaged Switches
        • Smart Switches
      • APAC Managed Industrial Ethernet Switches Market by Port Configuration Type

        • 10/100/1000 Ethernet Ports
        • 10 Gigabit Ethernet Ports
        • Fiber Optic Ports
      • APAC Managed Industrial Ethernet Switches Market by Network Protocol Type

        • Ethernet/IP
        • Profinet
        • EtherCAT
      • APAC Managed Industrial Ethernet Switches Market by Application Sector Type

        • Manufacturing
        • Transportation
        • Energy & Utilities
        • Oil & Gas
      • APAC Managed Industrial Ethernet Switches Market by Form Factor Type

        • Rack-Mount
        • DIN-Rail
        • Wall-Mount
      • APAC Managed Industrial Ethernet Switches Market by Regional Type

        • China
        • India
        • Japan
        • South Korea
        • Malaysia
        • Thailand
        • Indonesia
        • Rest of APAC
      • CHINA Outlook (USD Billion, 2019-2032)
      • CHINA Managed Industrial Ethernet Switches Market by Switch Type

        • Managed Switches
        • Unmanaged Switches
        • Smart Switches
      • CHINA Managed Industrial Ethernet Switches Market by Port Configuration Type

        • 10/100/1000 Ethernet Ports
        • 10 Gigabit Ethernet Ports
        • Fiber Optic Ports
      • CHINA Managed Industrial Ethernet Switches Market by Network Protocol Type

        • Ethernet/IP
        • Profinet
        • EtherCAT
      • CHINA Managed Industrial Ethernet Switches Market by Application Sector Type

        • Manufacturing
        • Transportation
        • Energy & Utilities
        • Oil & Gas
      • CHINA Managed Industrial Ethernet Switches Market by Form Factor Type

        • Rack-Mount
        • DIN-Rail
        • Wall-Mount
      • INDIA Outlook (USD Billion, 2019-2032)
      • INDIA Managed Industrial Ethernet Switches Market by Switch Type

        • Managed Switches
        • Unmanaged Switches
        • Smart Switches
      • INDIA Managed Industrial Ethernet Switches Market by Port Configuration Type

        • 10/100/1000 Ethernet Ports
        • 10 Gigabit Ethernet Ports
        • Fiber Optic Ports
      • INDIA Managed Industrial Ethernet Switches Market by Network Protocol Type

        • Ethernet/IP
        • Profinet
        • EtherCAT
      • INDIA Managed Industrial Ethernet Switches Market by Application Sector Type

        • Manufacturing
        • Transportation
        • Energy & Utilities
        • Oil & Gas
      • INDIA Managed Industrial Ethernet Switches Market by Form Factor Type

        • Rack-Mount
        • DIN-Rail
        • Wall-Mount
      • JAPAN Outlook (USD Billion, 2019-2032)
      • JAPAN Managed Industrial Ethernet Switches Market by Switch Type

        • Managed Switches
        • Unmanaged Switches
        • Smart Switches
      • JAPAN Managed Industrial Ethernet Switches Market by Port Configuration Type

        • 10/100/1000 Ethernet Ports
        • 10 Gigabit Ethernet Ports
        • Fiber Optic Ports
      • JAPAN Managed Industrial Ethernet Switches Market by Network Protocol Type

        • Ethernet/IP
        • Profinet
        • EtherCAT
      • JAPAN Managed Industrial Ethernet Switches Market by Application Sector Type

        • Manufacturing
        • Transportation
        • Energy & Utilities
        • Oil & Gas
      • JAPAN Managed Industrial Ethernet Switches Market by Form Factor Type

        • Rack-Mount
        • DIN-Rail
        • Wall-Mount
      • SOUTH KOREA Outlook (USD Billion, 2019-2032)
      • SOUTH KOREA Managed Industrial Ethernet Switches Market by Switch Type

        • Managed Switches
        • Unmanaged Switches
        • Smart Switches
      • SOUTH KOREA Managed Industrial Ethernet Switches Market by Port Configuration Type

        • 10/100/1000 Ethernet Ports
        • 10 Gigabit Ethernet Ports
        • Fiber Optic Ports
      • SOUTH KOREA Managed Industrial Ethernet Switches Market by Network Protocol Type

        • Ethernet/IP
        • Profinet
        • EtherCAT
      • SOUTH KOREA Managed Industrial Ethernet Switches Market by Application Sector Type

        • Manufacturing
        • Transportation
        • Energy & Utilities
        • Oil & Gas
      • SOUTH KOREA Managed Industrial Ethernet Switches Market by Form Factor Type

        • Rack-Mount
        • DIN-Rail
        • Wall-Mount
      • MALAYSIA Outlook (USD Billion, 2019-2032)
      • MALAYSIA Managed Industrial Ethernet Switches Market by Switch Type

        • Managed Switches
        • Unmanaged Switches
        • Smart Switches
      • MALAYSIA Managed Industrial Ethernet Switches Market by Port Configuration Type

        • 10/100/1000 Ethernet Ports
        • 10 Gigabit Ethernet Ports
        • Fiber Optic Ports
      • MALAYSIA Managed Industrial Ethernet Switches Market by Network Protocol Type

        • Ethernet/IP
        • Profinet
        • EtherCAT
      • MALAYSIA Managed Industrial Ethernet Switches Market by Application Sector Type

        • Manufacturing
        • Transportation
        • Energy & Utilities
        • Oil & Gas
      • MALAYSIA Managed Industrial Ethernet Switches Market by Form Factor Type

        • Rack-Mount
        • DIN-Rail
        • Wall-Mount
      • THAILAND Outlook (USD Billion, 2019-2032)
      • THAILAND Managed Industrial Ethernet Switches Market by Switch Type

        • Managed Switches
        • Unmanaged Switches
        • Smart Switches
      • THAILAND Managed Industrial Ethernet Switches Market by Port Configuration Type

        • 10/100/1000 Ethernet Ports
        • 10 Gigabit Ethernet Ports
        • Fiber Optic Ports
      • THAILAND Managed Industrial Ethernet Switches Market by Network Protocol Type

        • Ethernet/IP
        • Profinet
        • EtherCAT
      • THAILAND Managed Industrial Ethernet Switches Market by Application Sector Type

        • Manufacturing
        • Transportation
        • Energy & Utilities
        • Oil & Gas
      • THAILAND Managed Industrial Ethernet Switches Market by Form Factor Type

        • Rack-Mount
        • DIN-Rail
        • Wall-Mount
      • INDONESIA Outlook (USD Billion, 2019-2032)
      • INDONESIA Managed Industrial Ethernet Switches Market by Switch Type

        • Managed Switches
        • Unmanaged Switches
        • Smart Switches
      • INDONESIA Managed Industrial Ethernet Switches Market by Port Configuration Type

        • 10/100/1000 Ethernet Ports
        • 10 Gigabit Ethernet Ports
        • Fiber Optic Ports
      • INDONESIA Managed Industrial Ethernet Switches Market by Network Protocol Type

        • Ethernet/IP
        • Profinet
        • EtherCAT
      • INDONESIA Managed Industrial Ethernet Switches Market by Application Sector Type

        • Manufacturing
        • Transportation
        • Energy & Utilities
        • Oil & Gas
      • INDONESIA Managed Industrial Ethernet Switches Market by Form Factor Type

        • Rack-Mount
        • DIN-Rail
        • Wall-Mount
      • REST OF APAC Outlook (USD Billion, 2019-2032)
      • REST OF APAC Managed Industrial Ethernet Switches Market by Switch Type

        • Managed Switches
        • Unmanaged Switches
        • Smart Switches
      • REST OF APAC Managed Industrial Ethernet Switches Market by Port Configuration Type

        • 10/100/1000 Ethernet Ports
        • 10 Gigabit Ethernet Ports
        • Fiber Optic Ports
      • REST OF APAC Managed Industrial Ethernet Switches Market by Network Protocol Type

        • Ethernet/IP
        • Profinet
        • EtherCAT
      • REST OF APAC Managed Industrial Ethernet Switches Market by Application Sector Type

        • Manufacturing
        • Transportation
        • Energy & Utilities
        • Oil & Gas
      • REST OF APAC Managed Industrial Ethernet Switches Market by Form Factor Type

        • Rack-Mount
        • DIN-Rail
        • Wall-Mount
    • South America Outlook (USD Billion, 2019-2032)

      • South America Managed Industrial Ethernet Switches Market by Switch Type

        • Managed Switches
        • Unmanaged Switches
        • Smart Switches
      • South America Managed Industrial Ethernet Switches Market by Port Configuration Type

        • 10/100/1000 Ethernet Ports
        • 10 Gigabit Ethernet Ports
        • Fiber Optic Ports
      • South America Managed Industrial Ethernet Switches Market by Network Protocol Type

        • Ethernet/IP
        • Profinet
        • EtherCAT
      • South America Managed Industrial Ethernet Switches Market by Application Sector Type

        • Manufacturing
        • Transportation
        • Energy & Utilities
        • Oil & Gas
      • South America Managed Industrial Ethernet Switches Market by Form Factor Type

        • Rack-Mount
        • DIN-Rail
        • Wall-Mount
      • South America Managed Industrial Ethernet Switches Market by Regional Type

        • Brazil
        • Mexico
        • Argentina
        • Rest of South America
      • BRAZIL Outlook (USD Billion, 2019-2032)
      • BRAZIL Managed Industrial Ethernet Switches Market by Switch Type

        • Managed Switches
        • Unmanaged Switches
        • Smart Switches
      • BRAZIL Managed Industrial Ethernet Switches Market by Port Configuration Type

        • 10/100/1000 Ethernet Ports
        • 10 Gigabit Ethernet Ports
        • Fiber Optic Ports
      • BRAZIL Managed Industrial Ethernet Switches Market by Network Protocol Type

        • Ethernet/IP
        • Profinet
        • EtherCAT
      • BRAZIL Managed Industrial Ethernet Switches Market by Application Sector Type

        • Manufacturing
        • Transportation
        • Energy & Utilities
        • Oil & Gas
      • BRAZIL Managed Industrial Ethernet Switches Market by Form Factor Type

        • Rack-Mount
        • DIN-Rail
        • Wall-Mount
      • MEXICO Outlook (USD Billion, 2019-2032)
      • MEXICO Managed Industrial Ethernet Switches Market by Switch Type

        • Managed Switches
        • Unmanaged Switches
        • Smart Switches
      • MEXICO Managed Industrial Ethernet Switches Market by Port Configuration Type

        • 10/100/1000 Ethernet Ports
        • 10 Gigabit Ethernet Ports
        • Fiber Optic Ports
      • MEXICO Managed Industrial Ethernet Switches Market by Network Protocol Type

        • Ethernet/IP
        • Profinet
        • EtherCAT
      • MEXICO Managed Industrial Ethernet Switches Market by Application Sector Type

        • Manufacturing
        • Transportation
        • Energy & Utilities
        • Oil & Gas
      • MEXICO Managed Industrial Ethernet Switches Market by Form Factor Type

        • Rack-Mount
        • DIN-Rail
        • Wall-Mount
      • ARGENTINA Outlook (USD Billion, 2019-2032)
      • ARGENTINA Managed Industrial Ethernet Switches Market by Switch Type

        • Managed Switches
        • Unmanaged Switches
        • Smart Switches
      • ARGENTINA Managed Industrial Ethernet Switches Market by Port Configuration Type

        • 10/100/1000 Ethernet Ports
        • 10 Gigabit Ethernet Ports
        • Fiber Optic Ports
      • ARGENTINA Managed Industrial Ethernet Switches Market by Network Protocol Type

        • Ethernet/IP
        • Profinet
        • EtherCAT
      • ARGENTINA Managed Industrial Ethernet Switches Market by Application Sector Type

        • Manufacturing
        • Transportation
        • Energy & Utilities
        • Oil & Gas
      • ARGENTINA Managed Industrial Ethernet Switches Market by Form Factor Type

        • Rack-Mount
        • DIN-Rail
        • Wall-Mount
      • REST OF SOUTH AMERICA Outlook (USD Billion, 2019-2032)
      • REST OF SOUTH AMERICA Managed Industrial Ethernet Switches Market by Switch Type

        • Managed Switches
        • Unmanaged Switches
        • Smart Switches
      • REST OF SOUTH AMERICA Managed Industrial Ethernet Switches Market by Port Configuration Type

        • 10/100/1000 Ethernet Ports
        • 10 Gigabit Ethernet Ports
        • Fiber Optic Ports
      • REST OF SOUTH AMERICA Managed Industrial Ethernet Switches Market by Network Protocol Type

        • Ethernet/IP
        • Profinet
        • EtherCAT
      • REST OF SOUTH AMERICA Managed Industrial Ethernet Switches Market by Application Sector Type

        • Manufacturing
        • Transportation
        • Energy & Utilities
        • Oil & Gas
      • REST OF SOUTH AMERICA Managed Industrial Ethernet Switches Market by Form Factor Type

        • Rack-Mount
        • DIN-Rail
        • Wall-Mount
    • MEA Outlook (USD Billion, 2019-2032)

      • MEA Managed Industrial Ethernet Switches Market by Switch Type

        • Managed Switches
        • Unmanaged Switches
        • Smart Switches
      • MEA Managed Industrial Ethernet Switches Market by Port Configuration Type

        • 10/100/1000 Ethernet Ports
        • 10 Gigabit Ethernet Ports
        • Fiber Optic Ports
      • MEA Managed Industrial Ethernet Switches Market by Network Protocol Type

        • Ethernet/IP
        • Profinet
        • EtherCAT
      • MEA Managed Industrial Ethernet Switches Market by Application Sector Type

        • Manufacturing
        • Transportation
        • Energy & Utilities
        • Oil & Gas
      • MEA Managed Industrial Ethernet Switches Market by Form Factor Type

        • Rack-Mount
        • DIN-Rail
        • Wall-Mount
      • MEA Managed Industrial Ethernet Switches Market by Regional Type

        • GCC Countries
        • South Africa
        • Rest of MEA
      • GCC COUNTRIES Outlook (USD Billion, 2019-2032)
      • GCC COUNTRIES Managed Industrial Ethernet Switches Market by Switch Type

        • Managed Switches
        • Unmanaged Switches
        • Smart Switches
      • GCC COUNTRIES Managed Industrial Ethernet Switches Market by Port Configuration Type

        • 10/100/1000 Ethernet Ports
        • 10 Gigabit Ethernet Ports
        • Fiber Optic Ports
      • GCC COUNTRIES Managed Industrial Ethernet Switches Market by Network Protocol Type

        • Ethernet/IP
        • Profinet
        • EtherCAT
      • GCC COUNTRIES Managed Industrial Ethernet Switches Market by Application Sector Type

        • Manufacturing
        • Transportation
        • Energy & Utilities
        • Oil & Gas
      • GCC COUNTRIES Managed Industrial Ethernet Switches Market by Form Factor Type

        • Rack-Mount
        • DIN-Rail
        • Wall-Mount
      • SOUTH AFRICA Outlook (USD Billion, 2019-2032)
      • SOUTH AFRICA Managed Industrial Ethernet Switches Market by Switch Type

        • Managed Switches
        • Unmanaged Switches
        • Smart Switches
      • SOUTH AFRICA Managed Industrial Ethernet Switches Market by Port Configuration Type

        • 10/100/1000 Ethernet Ports
        • 10 Gigabit Ethernet Ports
        • Fiber Optic Ports
      • SOUTH AFRICA Managed Industrial Ethernet Switches Market by Network Protocol Type

        • Ethernet/IP
        • Profinet
        • EtherCAT
      • SOUTH AFRICA Managed Industrial Ethernet Switches Market by Application Sector Type

        • Manufacturing
        • Transportation
        • Energy & Utilities
        • Oil & Gas
      • SOUTH AFRICA Managed Industrial Ethernet Switches Market by Form Factor Type

        • Rack-Mount
        • DIN-Rail
        • Wall-Mount
      • REST OF MEA Outlook (USD Billion, 2019-2032)
      • REST OF MEA Managed Industrial Ethernet Switches Market by Switch Type

        • Managed Switches
        • Unmanaged Switches
        • Smart Switches
      • REST OF MEA Managed Industrial Ethernet Switches Market by Port Configuration Type

        • 10/100/1000 Ethernet Ports
        • 10 Gigabit Ethernet Ports
        • Fiber Optic Ports
      • REST OF MEA Managed Industrial Ethernet Switches Market by Network Protocol Type

        • Ethernet/IP
        • Profinet
        • EtherCAT
      • REST OF MEA Managed Industrial Ethernet Switches Market by Application Sector Type

        • Manufacturing
        • Transportation
        • Energy & Utilities
        • Oil & Gas
      • REST OF MEA Managed Industrial Ethernet Switches Market by Form Factor Type

        • Rack-Mount
        • DIN-Rail
        • Wall-Mount


    Report Infographic
    Free Sample Request

    Kindly complete the form below to receive a free sample of this Report

    Customer Strories

    “I am very pleased with how market segments have been defined in a relevant way for my purposes (such as "Portable Freezers & refrigerators" and "last-mile"). In general the report is well structured. Thanks very much for your efforts.”

    Victoria Milne Founder
    Case Study

    Chemicals and Materials