• Cat-intel
  • MedIntelliX
  • Resources
  • About Us
  • Hero Background
    English
    Chinese
    French
    Japanese
    Korean
    German
    Spanish

    Magnesium Chloride Market Share

    ID: MRFR/CnM/6629-CR
    180 Pages
    Anshula Mandaokar
    February 2021

    Magnesium Chloride Market Research Report Information by Form (Liquid and Flakes), Grade (Industrial, Food & Pharmaceutical), Application (Deicing Agent, Dust Suppressant, Chemicals & Derivatives, Building Materials, Pharmaceuticals, Food & Feed and others) and Region (North America, Europe, Asia-Pacific, Middle East & Africa and Latin America) - Forecast till 2035

    Share:
    Download PDF ×

    We do not share your information with anyone. However, we may send you emails based on your report interest from time to time. You may contact us at any time to opt-out.

    Magnesium Chloride Market Infographic
    $ 4,950.0
    $ 5,950.0
    $ 7,250.0

    Market Share

    Magnesium Chloride Market Share Analysis

    The Magnesium Chloride market has grown rapidly, and companies are using market share positioning strategies to gain a competitive edge. One popular strategy is separation, where companies highlight magnesium chloride's unique benefits. This could include cleanliness levels, manufacturing procedures, or value-added services. Through these distinct perspectives, companies hope to establish a market niche and attract customers that value these attributes. Cost management, where companies aim to be the lowest magnesium chloride price maker, is another prevalent strategy. Enhance production methods, buy fiscally smart unrefined components, and run productive store networks with executives. By delivering competitive evaluation, companies want to gain market share from cost-conscious customers who value rationality. This method works well in markets where cost responsiveness influences purchase decisions. Additionally, market division is essential for market share positioning. Companies study the needs of their target market and design magnesium chloride products accordingly. This includes creating product variations to meet industry needs or customer preferences. By meeting the needs of different customer segments, companies can increase market penetration and customer base. Development also affects magnesium chloride market share. Companies invest in innovation to improve details, apps, and delivery methods. These innovations set them apart and allow them to meet customer needs. Development drives market share growth by improving performance, reducing harm to ecosystem goods, or introducing new apps. Vital associations and coordinated efforts are becoming essential to magnesium chloride market share positioning. Organizations can increase market share by forming alliances with wholesalers, suppliers, or other partners. Joint activities can improve conveyance, enter new markets, and pool assets, increasing market share. For market share growth, client relationships and brand building are crucial. Setting up strong presence areas and fostering great client encounters helps boost brand loyalty, repeat business, and positive reviews. Companies invest in marketing and special events to raise brand awareness and highlight the benefits of magnesium chloride products. Overall, the magnesium chloride industry offers many opportunities for market share positioning. Companies might examine the competitive landscape and gain a larger market share by separation, cost initiative, division, development, key associations, or brand creation. For companies to succeed in the robust magnesium chloride market, these methods must be adjusted and refined as the business grows.

    Market Summary

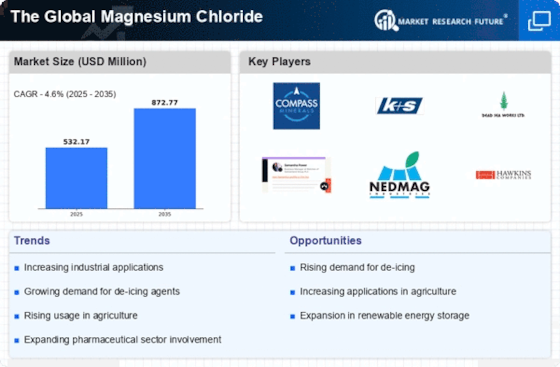
    As per Market Research Future Analysis, the Global Magnesium Chloride Market was valued at USD 508.77 Million in 2023 and is projected to grow to USD 762.62 Million by 2032, with a CAGR of 4.60% from 2024 to 2032. The market is driven by increasing demand across various industries, particularly for deicing applications in cooler regions. The COVID-19 pandemic initially hampered growth but is expected to rebound due to rising health awareness and demand for magnesium chloride in pharmaceuticals and nutrition. The Asia-Pacific region is anticipated to dominate the market, driven by rapid urbanization and industrialization.

    Key Market Trends & Highlights

    Key trends influencing the Magnesium Chloride market include health benefits and industrial applications.

    • Market Size in 2023: USD 508.77 Million; projected to reach USD 762.62 Million by 2032. CAGR from 2024 to 2032: 4.60%; driven by demand in deicing and health sectors. Asia-Pacific region expected to register a CAGR of 5% by 2032; due to urbanization and industrial growth. COVID-19 impact led to temporary disruptions; recovery anticipated as demand for health supplements rises.

    Market Size & Forecast

    2023 Market Size USD 508.77 Million
    2024 Market Size USD 532.1 Million
    2032 Market Size USD 762.62 Million
    CAGR (2024-2032) 4.60%

    Major Players

    <p>Compass Minerals (US), ICL (Israel), Merck KGaA (Germany), NikoMag (Russia), K+S KALI GmbH (Germany), Intrepid (US), Nedmag B.V. (Netherlands), DEUSA International GmbH (Germany), HuiTai Investment Co. Ltd (China), Skyline Chemical Corporation (US)</p>

    Market Trends

    - An estimate of market value, market volume, and market share as per the market supply and demand.

    - A study on factors driving the market, new opportunities being created, and restraints the market faces.

    - An analysis of the market segmentation as type, application, and region.

    - A brief note of the leading manufacturers, investors, competitive landscape as per regional analysis, and recent innovations and developments as per data collected by industrial experts.

    Segment Overview:

    By Form:

    The Global Magnesium Chloride Market is segmented based on form as Liquid, powder, and Flakes.

    By Grade:

    The Global Magnesium Chloride Market is segmented based on Industrial, Pharmaceutical, Food, and Beverage.

     By Application:

    The Global Magnesium Chloride Market is segmented based on application as Deicing Agent, Chemicals, Derivatives, Pharmaceuticals, Dust Suppressant, Building Materials, Food, Beverage, and Feed.Metals like lithium and copper located in Tier 1 mining zones can be extracted by C29 Metals Limited utilizing cutting-edge technology. After raising A$5.0 million in an IPO in November 2021, C29 Metals made its debut on the Australian Stock Exchange (ASX) with the intention of developing copper, gold, uranium, and base metal assets in Tier 1 Australian mining jurisdictions.

    This would get over issues brought on by magnesium, calcium, and boron, three common pollutants found in brine.

    Regional Analysis:

    The Global Magnesium Chloride Market is segmented based on region as:

    North America (The US, Canada) Europe (Germany, UK, Russia, The Netherlands, Austria, France, Italy, Spain, Belgium, and the Rest of Europe) Asia-Pacific (Japan, China, India, New Zealand, Australia, Indonesia, South Korea) Latin America (Brazil, Argentina, Mexico) Middle East (Turkey, Israel, Saudi Arabia, UAE, Egypt) Africa

    - The Asia-Pacific held the position of the market-dominant of the Global Magnesium Chloride Market by estimation of registering a CAGR of 5% by the end of the forecast period. This rise is because of rapid urbanization and industrialization in emerging economies like India, China, Indonesia, Thailand, Malaysia, and others.

    - The rising demand for magnesium chloride as a deicing agent and anti-icing in the European regions like Norway, Iceland, Switzerland, and Greenland is likely to generate a revenue of more than 50,000 thousand million US dollars during the forecast period.To fund the first stage of its potash development project located north of Pointe Noire, Kanga Potash stated in July 2022 that it was seeking to finance approximately $500 million. Mezzanine financing and other forms of equity will account for about 40% of the total.

    Competitive Landscape:

    A detailed study of company overview, production capacities, revenue generated, global presence, new market initiatives, market potential, strengths, and weaknesses of the market is studied under the competitive landscape of the global Magnesium Chloride Market.

    The Intended Audience of the Magnesium Chloride Market is:

    - Manufacturers of Magnesium chloride supplements

    - Wholesalers

    - Retailers

    - Distributors

    - Governments associations

    - industrial bodies

    - Trade experts and Investors

    The magnificent leaders of the global Magnesium Chloride Market are:

    - Compass Minerals (US)

    - ICL (Israel)

    - Merck KGaA (Germany)

    - NikoMag (Russia)

    - K+S KALI GmbH (Germany)

    - Intrepid (US)

    - Nedmag B.V. (the Netherlands)

    - DEUSA International GmbH (Germany)

    - HuiTai Investment Co. Ltd (China)

    - Skyline Chemical Corporation (US)

     Recent Developments:

    -Magnesium chloride anhydrous resulted in its emergence as the dominant product segment in the market. It enjoyed the largest market share in 2018. The main reason behind this is an increased demand for metal processing, the construction sector, as well as, automotive on a large scale. 

    -The market segment led by building material is expected to emerge as a dominant player by the end of the global forecast year ending in 2024. There is an ongoing boom in the construction sector that is a result of increased demand for residential, as well as, commercial infrastructure. Also, urbanization is likely to play a major role in helping the segment grow. 

    -China is the highest producer of MgCl2. This is gaining a lot of government support that is likely to help in the expansion of production lines. This is going to help the regional market grow at a good pace by the end of the global forecast period in 2024. 

    -In 2018, the APAC region enjoyed the title of being the leading region in the global market and has the largest market share. The region is undergoing innovation, renovation, as well as, refurbishment activities combined with an increase in rising expenditure for road construction, bridges, as well as, infrastructure for public utility.

    Q3 2025: USA Magnesium Chloride Prices to Stay Firm in August and Drop in September 2025 In July 2025, U.S. magnesium chloride producers reported stable domestic production and strong demand from dust suppression and industrial chemical sectors, with prices rising 5%. The market is expected to see a price correction in September as summer demand wanes and inventory levels are closely monitored.

    Report Overview:

    The report overview of the global Magnesium Chloride Market is:

    - A comprehensive and detailed outlook on market trends in the field of study.

    - An update on the going global pandemic and its effect on the magnesium chloride market.

    - A study on the various approaches followed by the government and industrial manufactures.

    - Trade regulations, Import export analysis, and Production analysis as per historical and current market dynamics.

    - An estimate of market value, market revenue, market CAGR, market volume, and market share as per the market supply and demand.

    - A study on factors driving the market, new opportunities being created, and restraints the market faces.

    - An analysis of the market segmentation as type, application, and region.

    - A brief note of the leading manufacturers, investors, competitive landscape as per regional analysis, and recent innovations and developments as per data collected by industrial experts.

    - Price trend analysis and Trade route analysis that affect the collaborations between industrial leaders.


    <p>The increasing demand for magnesium chloride in various applications, including de-icing and dust control, reflects its versatility and growing significance in industrial processes.</p>

    U.S. Geological Survey

    Magnesium Chloride Market Market Drivers

    Market Growth Projections

    Expansion in Agriculture Sector

    The Global Magnesium Chloride Market Industry benefits from the expanding agricultural sector, where magnesium chloride is utilized as a fertilizer and soil conditioner. Its role in enhancing soil quality and crop yield is increasingly recognized by farmers and agricultural professionals. As global food demand rises, the need for effective agricultural inputs becomes paramount. Magnesium chloride not only improves nutrient absorption but also aids in water retention in soils. This trend is expected to contribute to the market's growth, with projections indicating a rise to 872.8 USD Million by 2035. The agricultural applications of magnesium chloride are likely to play a crucial role in the Global Magnesium Chloride Market Industry.

    Growth in Industrial Applications

    The Global Magnesium Chloride Market Industry is experiencing growth due to its diverse industrial applications, particularly in the production of magnesium metal and as a drying agent in various processes. Industries such as construction, textiles, and chemicals utilize magnesium chloride for its properties that enhance product quality and efficiency. The increasing industrialization in emerging economies is expected to drive demand further. As industries seek sustainable and efficient materials, magnesium chloride's versatility positions it favorably. The market's expansion in this sector is anticipated to contribute to a compound annual growth rate of 4.6% from 2025 to 2035, underscoring its importance in the Global Magnesium Chloride Market Industry.

    Rising Demand in De-icing Applications

    The Global Magnesium Chloride Market Industry experiences a notable increase in demand driven by its application in de-icing roads and highways. As winter weather conditions persist in various regions, municipalities and transportation authorities are increasingly adopting magnesium chloride due to its effectiveness in melting ice and snow. This trend is particularly evident in North America and Europe, where harsh winters necessitate reliable de-icing solutions. The market is projected to reach 532.1 USD Million in 2024, reflecting the growing reliance on magnesium chloride for winter maintenance. This demand is likely to sustain growth in the Global Magnesium Chloride Market Industry over the coming years.

    Technological Advancements in Production

    The Global Magnesium Chloride Market Industry is benefiting from technological advancements in production methods that enhance efficiency and reduce costs. Innovations in extraction and processing techniques allow for higher purity levels and better product quality, which are crucial for various applications. As production becomes more efficient, manufacturers can meet the growing demand without compromising on quality. This trend is particularly relevant as the market anticipates reaching 532.1 USD Million in 2024. The ongoing improvements in production technology are likely to sustain the competitive edge of magnesium chloride in the Global Magnesium Chloride Market Industry.

    Environmental Regulations Favoring Sustainable Solutions

    The Global Magnesium Chloride Market Industry is positively influenced by stringent environmental regulations that encourage the use of sustainable and eco-friendly products. Magnesium chloride is often viewed as a more environmentally benign alternative to traditional de-icing agents, such as sodium chloride, which can have detrimental effects on soil and water quality. As governments worldwide implement policies aimed at reducing environmental impact, the adoption of magnesium chloride in various applications is likely to increase. This shift not only aligns with regulatory requirements but also meets consumer demand for greener solutions, thereby enhancing the market's growth potential in the Global Magnesium Chloride Market Industry.

    Market Segment Insights

    Regional Insights

    Key Companies in the Magnesium Chloride Market market include

    Industry Developments

    -Magnesium chloride anhydrous resulted in its emergence as the dominant product segment in the market. It enjoyed the largest market share in 2018. The main reason behind this is an increased demand for metal processing, the construction sector, as well as, automotive on a large scale. 

    -The market segment led by building material is expected to emerge as a dominant player by the end of the global forecast year ending in 2024. There is an ongoing boom in the construction sector that is a result of increased demand for residential, as well as, commercial infrastructure. Also, urbanization is likely to play a major role in helping the segment grow. 

    -China is the highest producer of MgCl2. This is gaining a lot of government support that is likely to help in the expansion of production lines. This is going to help the regional market grow at a good pace by the end of the global forecast period in 2024. 

    -In 2018, the APAC region enjoyed the title of being the leading region in the global market and has the largest market share. The region is undergoing innovation, renovation, as well as, refurbishment activities combined with an increase in rising expenditure for road construction, bridges, as well as, infrastructure for public utility.

    Q3 2025: USA Magnesium Chloride Prices to Stay Firm in August and Drop in September 2025 In July 2025, U.S. magnesium chloride producers reported stable domestic production and strong demand from dust suppression and industrial chemical sectors, with prices rising 5%. The market is expected to see a price correction in September as summer demand wanes and inventory levels are closely monitored.


    Future Outlook

    Magnesium Chloride Market Future Outlook

    <p>The Global Magnesium Chloride Market is projected to grow at a 4.6% CAGR from 2024 to 2035, driven by increasing demand in de-icing and industrial applications.</p>

    New opportunities lie in:

    • <p>Develop eco-friendly magnesium chloride products for sustainable applications. Expand distribution networks in emerging markets to capture new customer segments. Invest in R&amp;D for innovative uses in agriculture and food preservation.</p>

    <p>By 2035, the market is expected to exhibit robust growth, positioning itself as a key player in various industries.</p>

    Market Segmentation

    Report Scope

    Report Attribute/MetricDetails
    Market Size 2023USD 508.77 million
    Market Size 2024USD 532.17 Million
    Market Size 2032USD 762.62 Million
     CAGR 4.60%
     Base Year 2023
     Forecast Period 2024-2032
     Historical Data 2019
     Forecast Units Value (USD Million)
     Report CoverageRevenue Forecast, Competitive Landscape, Growth Factors, and Trends
     Segments CoveredBy Form, Application and Region
     Geographies CoveredNorth America, Europe, Asia-Pacific, and Rest of the World (RoW)
      Key VendorsCompass Minerals (US), ICL (Israel), Merck KGaA (Germany), NikoMag (Russia), K+S KALI GmbH (Germany), Intrepid (US),Nedmag B.V. (the Netherlands), DEUSA International GmbH (Germany), HuiTai Investment Co. Ltd (China),Skyline Chemical Corporation (US)
      Key Market OpportunitiesThe factor influencing the market growth is major because of the increasing demand for magnesium chloride in various industries.
      Key Market DriversFaster deicing of ice in cooler regions than rock salt. Increased use of Magnesium chloride in commercial and residential sectors due to various nutritional supplement values.


    Market Highlights

    Author

    Anshula Mandaokar
    Team Lead - Research

    She holds an experience of about 6+ years in market research and business consulting, working under the spectrum of information communication technology, telecommunications and semiconductor domains. aarti conceptualizes and implements a scalable business strategy and provides strategic leadership to the clients. her expertise lies in market estimation, competitive intelligence, pipeline analysis, customer assessment, etc.

    Leave a Comment

    Latest Comments

    John Doe
    john@example.com

    This is a great article! Really helped me understand the topic better.

    Posted on July 23, 2025, 10:15 AM
    Jane Smith
    jane@domain.com

    Thanks for sharing this. I’ve bookmarked it for later reference.

    Posted on July 22, 2025, 7:45 PM

    FAQs

    At what CAGR is the magnesium chloride market projected to grow during the forecast period?

    The magnesium chloride market is projected to grow at a 4.60% CAGR between 2024-2032.

    What will be the value of the magnesium chloride market during the forecast period?

    The magnesium chloride market is predicted to touch USD 762.62 million by 2032.

    Which region is expected to dominate the magnesium chloride market?

    The Asia Pacific is expected to dominate the magnesium chloride market.

    What are the major applications of magnesium chloride?

    It finds extensive applications in food and feed, pharmaceuticals, dust suppressant, and others.

    Which factors may hamper the magnesium chloride market growth?

    Availability of substitutes may hamper market growth.

    1. --- "1 Prologue
    2. Market Introduction
      1. Definition 18
      2. Scope of the Study 18
      3. Market Structure 18
    3. Market Insights
      1. Market Insights 19
    4. Research Methodology
      1. Research Process 22
      2. Primary Research 23
      3. Secondary Research 24
      4. Market Size Estimation 24
      5. Forecast Model 25
      6. List Of Assumptions 26
    5. Market Dynamics
      1. Introduction 27
      2. Drivers 28
        1. Extensive Use Of Magnesium Chloride In Anti-Icing Application 28
        2. Health Benefits Associated With The Consumption Of Magnesium Chloride 29
        3. Use Of Magnesium Chloride In Cement Production 29
      3. Restraints 31
        1. Availability Of Substitutes 31
      4. Opportunity 32
        1. Growing Adoption Of Magnesium Chloride In Wastewater Treatment 32
      5. Trends 32
        1. Benefits Associated With Magnesium Chloride Baths And Soaks 32
    6. Market Factor Analysis
      1. Supply Chain Analysis 33
        1. Market Concentration 33
        2. Key Industry Stakeholders 33
        3. Logistics Scenario 34
        4. Supply Chain Levels 34
      2. Porter’s Five Forces Analysis 34
        1. Threat Of New Entrants 35
        2. Threat Of Rivalry 35
        3. Threat Of Substitutes 35
        4. Bargaining Power Of Suppliers 36
        5. Bargaining Power Of Buyers 36
      3. Pricing Analysis 36
        1. Trade Analysis 36
      4. Pricing Analysis, 2020-2028 (USD/TON) 39
    7. Global Magnesium Chloride Market, By Form
      1. Introduction 40
      2. Liquid 41
      3. Flakes 43
    8. Global Magnesium Chloride Market, By Grade
      1. Introduction 44
      2. Industrial 45
      3. Food And Pharmaceutical 46
    9. Global Magnesium Chloride Market, By Application
      1. Introduction 48
      2. Deicing Agent 50
      3. Dust Suppressant 51
      4. Chemicals & Derivatives 51
      5. Building Materials 52
      6. Pharmaceuticals 54
      7. Food & Feed 55
      8. Others 56
    10. Global Magnesium Chloride Market, By Region
      1. Introduction 57
      2. North America 61
        1. US 64
        2. Canada 66
      3. Europe 69
        1. Germany 73
        2. France 75
        3. UK 78
        4. Italy 80
        5. Russia 83
        6. Spain 85
        7. The Netherlands 88
        8. Belgium 90
        9. Austria 93
        10. Rest Of Europe 95
      4. Asia-Pacific 98
        1. China 101
        2. Japan 104
        3. India 106
        4. South Korea 109
        5. Australia And New Zealand 111
        6. Indonesia 114
        7. Rest Of Asia-Pacific 116
      5. Latin America 119
        1. Mexico 122
        2. Brazil 125
        3. Argentina 127
        4. Est Of Latin America 130
      6. Middle East And Africa 132
        1. Turkey 136
        2. UAE 138
        3. Saudi Arabia 141
        4. Israel 143
        5. South Africa 146
        6. Egypt 148
        7. Rest Of Middle East And Africa 151
    11. Competitive Landscape
      1. Introduction 154
      2. Market Strategy Analysis 154
    12. Company Profiles
      1. Compass Minerals 155
        1. Company Overview 155
        2. Financial Overview 155
        3. Products Offered 156
        4. Key Developments 156
        5. SWOT Analysis 156
        6. Key Strategies 156
      2. K+S KALI GmbH 157
        1. Company Overview 157
        2. Financial Overview 157
        3. Products Offered 158
        4. Key Developments 158
        5. SWOT Analysis 158
        6. Key Strategies 158
      3. ICL 159
        1. Company Overview 159
        2. Financial Overview 159
        3. Products Offered 160
        4. Key Developments 160
        5. SWOT Analysis 160
        6. Key Strategies 160
      4. Intrepid_x005F_x000B_ 161
        1. Company Overview 161
        2. Financial Overview 161
        3. Products Offered 162
        4. Key Developments 162
        5. SWOT Analysis 162
        6. Key Strategies 162
      5. Merck KGaA 163
        1. Company Overview 163
        2. Financial Overview 163
        3. Products Offered 164
        4. Key Developments 164
        5. SWOT Analysis 164
        6. Key Strategies 164
      6. Nedmag B.V. 165
        1. Company Overview 165
        2. Financial Overview 165
        3. Products Offered 165
        4. Key Developments 165
        5. SWOT Analysis 166
        6. Key Strategies 166
      7. NikoMag 167
        1. Company Overview 167
        2. Financial Overview 167
        3. Products Offered 167
        4. Key Developments 167
        5. SWOT Analysis 167
        6. Key Strategies 167
      8. DEUSA International GmbH 168
        1. Company Overview 168
        2. Financial Overview 168
        3. Products Offered 169
        4. Key Developments 169
        5. SWOT Analysis 169
        6. Key Strategies 169
      9. Skyline Chemical Corporation 170
        1. Company Overview 170
        2. Financial Overview 170
        3. Products Offered 170
        4. Key Developments 170
        5. SWOT Analysis 170
        6. Key Strategies 170
      10. HuiTai Investment Co., Ltd 171
        1. Company Overview 171
        2. Financial Overview 171
        3. Products Offered 171
        4. Key Developments 171
        5. SWOT Analysis 171
        6. Key Strategies 171
    13. Conclusion
      1. Key Findings 172
      2. Industry Trends 172
    14. List of Tables and Figures
      1. 14 List Of Tables
      2. TABLE 1 MARKET SYNOPSIS 17
      3. TABLE 2 LIST OF ASSUMPTIONS 26
      4. TABLE 3 EGYPT MAGNESIUM CHLORIDE MARKET, TRADE ANALYSIS, 2020 36
      5. TABLE 4 ALGERIA MAGNESIUM CHLORIDE MARKET, TRADE ANALYSIS, 2020 36
      6. TABLE 5 MOROCCO MAGNESIUM CHLORIDE MAKRET, TRADE ANALYSIS, 2020 37
      7. TABLE 6 TUNISIA MAGNESIUM CHLORIDE MARKET, TRADE ANALYSIS, 2020 37
      8. TABLE 7 NIGERIA MAGNESIUM CHLORIDE MARKET, TRADE ANALYSIS, 2020 37
      9. TABLE 8 SAUDI ARABIA MAGNESIUM CHLORIDE MARKET, TRADE ANALYSIS, 2020 37
      10. TABLE 9 ITALY MAGNESIUM CHLORIDE MARKET, TRADE ANALYSIS, 2020 38
      11. TABLE 10 UK MAGNESIUM CHLORIDE MARKET, TRADE ANALYSIS, 2020 38
      12. TABLE 11 GLOBAL MAGNESIUM CHLORIDE MARKET, BY REGION 39
      13. TABLE 1 GLOBAL MAGNESIUM CHLORIDE MARKET, BY FORM, 2020‒2027 (USD THOUSAND) 40
      14. TABLE 2 GLOBAL MAGNESIUM CHLORIDE MARKET, BY FORM, 2020‒2027 (TONS) 41
      15. TABLE 3 LIQUID: GLOBAL MAGNESIUM CHLORIDE MARKET, BY REGION, 2020‒2027 (USD THOUSAND) 42
      16. TABLE 4 LIQUID: GLOBAL MAGNESIUM CHLORIDE MARKET, BY REGION, 2020‒2027 (TONS) 42
      17. TABLE 5 FLAKES: GLOBAL MAGNESIUM CHLORIDE MARKET, BY REGION, 2020‒2027 (USD THOUSAND) 43
      18. TABLE 6 FLAKES: GLOBAL MAGNESIUM CHLORIDE MARKET, BY REGION, 2020‒2027 (TONS) 43
      19. TABLE 7 GLOBAL MAGNESIUM CHLORIDE MARKET, BY GRADE, 2020‒2027 (USD THOUSAND) 44
      20. TABLE 8 GLOBAL MAGNESIUM CHLORIDE MARKET, BY GRADE, 2020‒2027 (TONS) 45
      21. TABLE 9 INDUSTRIAL: GLOBAL MAGNESIUM CHLORIDE MARKET, BY REGION, 2020‒2027 (USD THOUSAND) 46
      22. TABLE 10 INDUSTRIAL: GLOBAL MAGNESIUM CHLORIDE MARKET, BY REGION, 2020‒2027 (TONS) 46
      23. TABLE 11 FOOD AND PHARMACEUTICAL: GLOBAL MAGNESIUM CHLORIDE MARKET, BY REGION, 2020‒2027 (USD THOUSAND) 47
      24. TABLE 12 FOOD AND PHARMACEUTICAL: GLOBAL MAGNESIUM CHLORIDE MARKET, BY REGION, 2020‒2027 (TONS) 47
      25. TABLE 13 GLOBAL MAGNESIUM CHLORIDE MARKET, BY APPLICATION, 2020‒2027 (USD THOUSAND) 48
      26. TABLE 14 GLOBAL MAGNESIUM CHLORIDE MARKET, BY APPLICATION, 2020‒2027 (TONS) 49
      27. TABLE 15 DEICING AGENT: GLOBAL MAGNESIUM CHLORIDE MARKET, BY REGION, 2020‒2027 (USD THOUSAND) 50
      28. TABLE 16 DEICING AGENT: GLOBAL MAGNESIUM CHLORIDE MARKET, BY REGION, 2020‒2027 (TONS) 50
      29. TABLE 17 DUST SUPPRESSANT: GLOBAL MAGNESIUM CHLORIDE MARKET, BY REGION, 2020‒2027 (USD THOUSAND) 51
      30. TABLE 18 DUST SUPPRESSANT: GLOBAL MAGNESIUM CHLORIDE MARKET, BY REGION, 2020‒2027 (TONS) 51
      31. TABLE 19 CHEMICALS & DERIVATIVES: GLOBAL MAGNESIUM CHLORIDE MARKET, BY REGION, 2020‒2027 (USD THOUSAND) 52
      32. TABLE 20 CHEMICALS & DERIVATIVES: GLOBAL MAGNESIUM CHLORIDE MARKET, BY REGION, 2020‒2027 (TONS) 52
      33. TABLE 21 BUILDING MATERIALS: GLOBAL MAGNESIUM CHLORIDE MARKET, BY REGION, 2020‒2027 (USD THOUSAND) 53
      34. TABLE 22 BUILDING MATERIALS: GLOBAL MAGNESIUM CHLORIDE MARKET, BY REGION, 2020‒2027 (TONS) 53
      35. TABLE 23 PHARMACEUTICALS: GLOBAL MAGNESIUM CHLORIDE MARKET, BY REGION, 2020‒2027 (USD THOUSAND) 54
      36. TABLE 24 PHARMACEUTICALS: GLOBAL MAGNESIUM CHLORIDE MARKET, BY REGION, 2020‒2027 (TONS) 54
      37. TABLE 25 FOOD & FEED: GLOBAL MAGNESIUM CHLORIDE MARKET, BY REGION, 2020‒2027 (USD THOUSAND) 55
      38. TABLE 26 FOOD & FEED: GLOBAL MAGNESIUM CHLORIDE MARKET, BY REGION, 2020‒2027 (TONS) 55
      39. TABLE 27 OTHERS: GLOBAL MAGNESIUM CHLORIDE MARKET, BY REGION, 2020‒2027 (USD THOUSAND) 56
      40. TABLE 28 OTHERS: GLOBAL MAGNESIUM CHLORIDE MARKET, BY REGION, 2020‒2027 (TONS) 56
      41. TABLE 29 GLOBAL MAGNESIUM CHLORIDE MARKET, BY REGION, 2020‒2027 (USD THOUSAND) 57
      42. TABLE 30 GLOBAL MAGNESIUM CHLORIDE MARKET, BY REGION, 2020‒2027 (TONS) 58
      43. TABLE 31 GLOBAL MAGNESIUM CHLORIDE MARKET, BY FORM, 2020‒2027 (USD THOUSAND) 58
      44. TABLE 32 GLOBAL MAGNESIUM CHLORIDE MARKET, BY FORM, 2020‒2027 (TONS) 59
      45. TABLE 33 GLOBAL MAGNESIUM CHLORIDE MARKET, BY GRADE, 2020‒2027 (USD THOUSAND) 59
      46. TABLE 34 GLOBAL MAGNESIUM CHLORIDE MARKET, BY GRADE, 2020‒2027 (TONS) 59
      47. TABLE 35 GLOBAL MAGNESIUM CHLORIDE MARKET, BY APPLICATION, 2020‒2027 (USD THOUSAND) 60
      48. TABLE 36 GLOBAL MAGNESIUM CHLORIDE MARKET, BY APPLICATION, 2020‒2027 (TONS) 60
      49. TABLE 37 NORTH AMERICA: MAGNESIUM CHLORIDE MARKET, BY COUNTRY, 2020‒2027 (USD THOUSAND) 61
      50. TABLE 38 NORTH AMERICA: MAGNESIUM CHLORIDE MARKET, BY COUNTRY, 2020‒2027 (TONS) 61
      51. TABLE 39 NORTH AMERICA: MAGNESIUM CHLORIDE MARKET, BY FORM, 2020‒2027 (USD THOUSAND) 61
      52. TABLE 40 NORTH AMERICA: MAGNESIUM CHLORIDE MARKET, BY FORM, 2020‒2027 (TONS) 62
      53. TABLE 41 NORTH AMERICA: MAGNESIUM CHLORIDE MARKET, BY GRADE, 2020‒2027 (USD THOUSAND) 62
      54. TABLE 42 NORTH AMERICA: MAGNESIUM CHLORIDE MARKET, BY GRADE, 2020‒2027 (TONS) 62
      55. TABLE 43 NORTH AMERICA: MAGNESIUM CHLORIDE MARKET, BY APPLICATION, 2020‒2027 (USD THOUSAND) 63
      56. TABLE 44 NORTH AMERICA: MAGNESIUM CHLORIDE MARKET, BY APPLICATION, 2020‒2027 (TONS) 63
      57. TABLE 45 US: MAGNESIUM CHLORIDE MARKET, BY FORM, 2020‒2027 (USD THOUSAND) 64
      58. TABLE 46 US: MAGNESIUM CHLORIDE MARKET, BY FORM, 2020‒2027 (TONS) 64
      59. TABLE 47 US: MAGNESIUM CHLORIDE MARKET, BY GRADE, 2020‒2027 (USD THOUSAND) 64
      60. TABLE 48 US: MAGNESIUM CHLORIDE MARKET, BY GRADE, 2020‒2027 (TONS) 65
      61. TABLE 49 US: MAGNESIUM CHLORIDE MARKET, BY APPLICATION, 2020‒2027 (USD THOUSAND) 65
      62. TABLE 50 US: MAGNESIUM CHLORIDE MARKET, BY APPLICATION, 2020‒2027 (TONS) 66
      63. TABLE 51 CANADA: MAGNESIUM CHLORIDE MARKET, BY FORM, 2020‒2027 (USD THOUSAND) 66
      64. TABLE 52 CANADA: MAGNESIUM CHLORIDE MARKET, BY FORM, 2020‒2027 (TONS) 67
      65. TABLE 53 CANADA: MAGNESIUM CHLORIDE MARKET, BY GRADE, 2020‒2027 (USD THOUSAND) 67
      66. TABLE 54 CANADA: MAGNESIUM CHLORIDE MARKET, BY GRADE, 2020‒2027 (TONS) 67
      67. TABLE 55 CANADA: MAGNESIUM CHLORIDE MARKET, BY APPLICATION, 2020‒2027 (USD THOUSAND) 68
      68. TABLE 56 CANADA: MAGNESIUM CHLORIDE MARKET, BY APPLICATION, 2020‒2027 (TONS) 68
      69. TABLE 57 EUROPE: MAGNESIUM CHLORIDE MARKET, BY COUNTRY, 2020‒2027 (USD THOUSAND) 69
      70. TABLE 58 EUROPE: MAGNESIUM CHLORIDE MARKET, BY COUNTRY, 2020‒2027 (TONS) 70
      71. TABLE 59 EUROPE: MAGNESIUM CHLORIDE MARKET, BY FORM, 2020‒2027 (USD THOUSAND) 70
      72. TABLE 60 EUROPE: MAGNESIUM CHLORIDE MARKET, BY FORM, 2020‒2027 (TONS) 71
      73. TABLE 61 EUROPE: MAGNESIUM CHLORIDE MARKET, BY GRADE, 2020‒2027 (USD THOUSAND) 71
      74. TABLE 62 EUROPE: MAGNESIUM CHLORIDE MARKET, BY GRADE, 2020‒2027 (TONS) 71
      75. TABLE 63 EUROPE: MAGNESIUM CHLORIDE MARKET, BY APPLICATION, 2020‒2027 (USD THOUSAND) 72
      76. TABLE 64 EUROPE: MAGNESIUM CHLORIDE MARKET, BY APPLICATION, 2020‒2027 (TONS) 72
      77. TABLE 65 GERMANY: MAGNESIUM CHLORIDE MARKET, BY FORM, 2020‒2027 (USD THOUSAND) 73
      78. TABLE 66 GERMANY: MAGNESIUM CHLORIDE MARKET, BY FORM, 2020‒2027 (TONS) 73
      79. TABLE 67 GERMANY: MAGNESIUM CHLORIDE MARKET, BY GRADE, 2020‒2027 (USD THOUSAND) 73
      80. TABLE 68 GERMANY: MAGNESIUM CHLORIDE MARKET, BY GRADE, 2020‒2027 (TONS) 74
      81. TABLE 69 GERMANY: MAGNESIUM CHLORIDE MARKET, BY APPLICATION, 2020‒2027 (USD THOUSAND) 74
      82. TABLE 70 GERMANY: MAGNESIUM CHLORIDE MARKET, BY APPLICATION, 2020‒2027 (TONS) 75
      83. TABLE 71 FRANCE: MAGNESIUM CHLORIDE MARKET, BY FORM, 2020‒2027 (USD THOUSAND) 75
      84. TABLE 72 FRANCE: MAGNESIUM CHLORIDE MARKET, BY FORM, 2020‒2027 (TONS) 76
      85. TABLE 73 FRANCE: MAGNESIUM CHLORIDE MARKET, BY GRADE, 2020‒2027 (USD THOUSAND) 76
      86. TABLE 74 FRANCE: MAGNESIUM CHLORIDE MARKET, BY GRADE, 2020‒2027 (TONS) 76
      87. TABLE 75 FRANCE: MAGNESIUM CHLORIDE MARKET, BY APPLICATION, 2020‒2027 (USD THOUSAND) 77
      88. TABLE 76 FRANCE: MAGNESIUM CHLORIDE MARKET, BY APPLICATION, 2020‒2027 (TONS) 77
      89. TABLE 77 UK: MAGNESIUM CHLORIDE MARKET, BY FORM, 2020‒2027 (USD THOUSAND) 78
      90. TABLE 78 UK: MAGNESIUM CHLORIDE MARKET, BY FORM, 2020‒2027 (TONS) 78
      91. TABLE 79 UK: MAGNESIUM CHLORIDE MARKET, BY GRADE, 2020‒2027 (USD THOUSAND) 78
      92. TABLE 80 UK: MAGNESIUM CHLORIDE MARKET, BY GRADE, 2020‒2027 (TONS) 79
      93. TABLE 81 UK: MAGNESIUM CHLORIDE MARKET, BY APPLICATION, 2020‒2027 (USD THOUSAND) 79
      94. TABLE 82 UK: MAGNESIUM CHLORIDE MARKET, BY APPLICATION, 2020‒2027 (TONS) 80
      95. TABLE 83 ITALY: MAGNESIUM CHLORIDE MARKET, BY FORM, 2020‒2027 (USD THOUSAND) 80
      96. TABLE 84 ITALY: MAGNESIUM CHLORIDE MARKET, BY FORM, 2020‒2027 (TONS) 81
      97. TABLE 85 ITALY: MAGNESIUM CHLORIDE MARKET, BY GRADE, 2020‒2027 (USD THOUSAND) 81
      98. TABLE 86 ITALY: MAGNESIUM CHLORIDE MARKET, BY GRADE, 2020‒2027 (TONS) 81
      99. TABLE 87 TALY: MAGNESIUM CHLORIDE MARKET, BY APPLICATION, 2020‒2027 (USD THOUSAND) 82
      100. TABLE 88 ITALY: MAGNESIUM CHLORIDE MARKET, BY APPLICATION, 2020‒2027 (TONS) 82
      101. TABLE 89 RUSSIA: MAGNESIUM CHLORIDE MARKET, BY FORM, 2020‒2027 (USD THOUSAND) 83
      102. TABLE 90 RUSSIA: MAGNESIUM CHLORIDE MARKET, BY FORM, 2020‒2027 (TONS) 83
      103. TABLE 91 RUSSIA: MAGNESIUM CHLORIDE MARKET, BY GRADE, 2020‒2027 (USD THOUSAND) 83
      104. TABLE 92 RUSSIA: MAGNESIUM CHLORIDE MARKET, BY GRADE, 2020‒2027 (TONS) 84
      105. TABLE 93 RUSSIA: MAGNESIUM CHLORIDE MARKET, BY APPLICATION, 2020‒2027 (USD THOUSAND) 84
      106. TABLE 94 RUSSIA: MAGNESIUM CHLORIDE MARKET, BY APPLICATION, 2020‒2027 (TONS) 85
      107. TABLE 95 SPAIN: MAGNESIUM CHLORIDE MARKET, BY FORM, 2020‒2027 (USD THOUSAND) 85
      108. TABLE 96 SPAIN: MAGNESIUM CHLORIDE MARKET, BY FORM, 2020‒2027 (TONS) 86
      109. TABLE 97 SPAIN: MAGNESIUM CHLORIDE MARKET, BY GRADE, 2020‒2027 (USD THOUSAND) 86
      110. TABLE 98 SPAIN: MAGNESIUM CHLORIDE MARKET, BY GRADE, 2020‒2027 (TONS) 86
      111. TABLE 99 SPAIN: MAGNESIUM CHLORIDE MARKET, BY APPLICATION, 2020‒2027 (USD THOUSAND) 87
      112. TABLE 100 SPAIN: MAGNESIUM CHLORIDE MARKET, BY APPLICATION, 2020‒2027 (TONS) 87
      113. TABLE 101 THE NETHERLANDS: MAGNESIUM CHLORIDE MARKET, BY FORM, 2020‒2027 (USD THOUSAND) 88
      114. TABLE 102 THE NETHERLANDS: MAGNESIUM CHLORIDE MARKET, BY FORM, 2020‒2027 (TONS) 88
      115. TABLE 103 THE NETHERLANDS: MAGNESIUM CHLORIDE MARKET, BY GRADE, 2020‒2027 (USD THOUSAND) 88
      116. TABLE 104 THE NETHERLANDS: MAGNESIUM CHLORIDE MARKET, BY GRADE, 2020‒2027 (TONS) 89
      117. TABLE 105 THE NETHERLANDS: MAGNESIUM CHLORIDE MARKET, BY APPLICATION, 2020‒2027 (USD THOUSAND) 89
      118. TABLE 106 THE NETHERLANDS: MAGNESIUM CHLORIDE MARKET, BY APPLICATION, 2020‒2027 (TONS) 90
      119. TABLE 107 BELGIUM: MAGNESIUM CHLORIDE MARKET, BY FORM, 2020‒2027 (USD THOUSAND) 90
      120. TABLE 108 BELGIUM: MAGNESIUM CHLORIDE MARKET, BY FORM, 2020‒2027 (TONS) 91
      121. TABLE 109 BELGIUM: MAGNESIUM CHLORIDE MARKET, BY GRADE, 2020‒2027 (USD THOUSAND) 91
      122. TABLE 110 BELGIUM: MAGNESIUM CHLORIDE MARKET, BY GRADE, 2020‒2027 (TONS) 91
      123. TABLE 111 BELGIUM: MAGNESIUM CHLORIDE MARKET, BY APPLICATION, 2020‒2027 (USD THOUSAND) 92
      124. TABLE 112 BELGIUM: MAGNESIUM CHLORIDE MARKET, BY APPLICATION, 2020‒2027 (TONS) 92
      125. TABLE 113 AUSTRIA: MAGNESIUM CHLORIDE MARKET, BY FORM, 2020‒2027 (USD THOUSAND) 93
      126. TABLE 114 AUSTRIA: MAGNESIUM CHLORIDE MARKET, BY FORM, 2020‒2027 (TONS) 93
      127. TABLE 115 AUSTRIA: MAGNESIUM CHLORIDE MARKET, BY GRADE, 2020‒2027 (USD THOUSAND) 93
      128. TABLE 116 AUSTRIA: MAGNESIUM CHLORIDE MARKET, BY GRADE, 2020‒2027 (TONS) 94
      129. TABLE 117 AUSTRIA: MAGNESIUM CHLORIDE MARKET, BY APPLICATION, 2020‒2027 (USD THOUSAND) 94
      130. TABLE 118 AUSTRIA: MAGNESIUM CHLORIDE MARKET, BY APPLICATION, 2020‒2027 (TONS) 95
      131. TABLE 119 REST OF EUROPE: MAGNESIUM CHLORIDE MARKET, BY FORM, 2020‒2027 (USD THOUSAND) 95
      132. TABLE 120 REST OF EUROPE: MAGNESIUM CHLORIDE MARKET, BY FORM, 2020‒2027 (TONS) 96
      133. TABLE 121 REST OF EUROPE: MAGNESIUM CHLORIDE MARKET, BY GRADE, 2020‒2027 (USD THOUSAND) 96
      134. TABLE 122 REST OF EUROPE: MAGNESIUM CHLORIDE MARKET, BY GRADE, 2020‒2027 (TONS) 96
      135. TABLE 123 REST OF EUROPE: MAGNESIUM CHLORIDE MARKET, BY APPLICATION, 2020‒2027 (USD THOUSAND) 97
      136. TABLE 124 REST OF EUROPE: MAGNESIUM CHLORIDE MARKET, BY APPLICATION, 2020‒2027 (TONS) 97
      137. TABLE 125 ASIA-PACIFIC: MAGNESIUM CHLORIDE MARKET, BY COUNTRY, 2020‒2027 (USD THOUSAND) 98
      138. TABLE 126 ASIA-PACIFIC: MAGNESIUM CHLORIDE MARKET, BY COUNTRY, 2020‒2027 (TONS) 98
      139. TABLE 127 ASIA-PACIFIC: MAGNESIUM CHLORIDE MARKET, BY FORM, 2020‒2027 (USD THOUSAND) 99
      140. TABLE 128 ASIA-PACIFIC: MAGNESIUM CHLORIDE MARKET, BY FORM, 2020‒2027 (TONS) 99
      141. TABLE 129 ASIA-PACIFIC: MAGNESIUM CHLORIDE MARKET, BY GRADE, 2020‒2027 (USD THOUSAND) 99
      142. TABLE 130 SIA-PACIFIC: MAGNESIUM CHLORIDE MARKET, BY GRADE, 2020‒2027 (TONS) 100
      143. TABLE 131 ASIA-PACIFIC: MAGNESIUM CHLORIDE MARKET, BY APPLICATION, 2020‒2027 (USD THOUSAND) 100
      144. TABLE 132 ASIA-PACIFIC: MAGNESIUM CHLORIDE MARKET, BY APPLICATION, 2020‒2027 (TONS) 101
      145. TABLE 133 CHINA: MAGNESIUM CHLORIDE MARKET, BY FORM, 2020‒2027 (USD THOUSAND) 101
      146. TABLE 134 CHINA: MAGNESIUM CHLORIDE MARKET, BY FORM, 2020‒2027 (TONS) 102
      147. TABLE 135 CHINA: MAGNESIUM CHLORIDE MARKET, BY GRADE, 2020‒2027 (USD THOUSAND) 102
      148. TABLE 136 CHINA: MAGNESIUM CHLORIDE MARKET, BY GRADE, 2020‒2027 (TONS) 102
      149. TABLE 137 CHINA: MAGNESIUM CHLORIDE MARKET, BY APPLICATION, 2020‒2027 (USD THOUSAND) 103
      150. TABLE 138 CHINA: MAGNESIUM CHLORIDE MARKET, BY APPLICATION, 2020‒2027 (TONS) 103
      151. TABLE 139 JAPAN: MAGNESIUM CHLORIDE MARKET, BY FORM, 2020‒2027 (USD THOUSAND) 104
      152. TABLE 140 JAPAN: MAGNESIUM CHLORIDE MARKET, BY FORM, 2020‒2027 (TONS) 104
      153. TABLE 141 JAPAN: MAGNESIUM CHLORIDE MARKET, BY GRADE, 2020‒2027 (USD THOUSAND) 104
      154. TABLE 142 JAPAN: MAGNESIUM CHLORIDE MARKET, BY GRADE, 2020‒2027 (TONS) 105
      155. TABLE 143 JAPAN: MAGNESIUM CHLORIDE MARKET, BY APPLICATION, 2020‒2027 (USD THOUSAND) 105
      156. TABLE 144 JAPAN: MAGNESIUM CHLORIDE MARKET, BY APPLICATION, 2020‒2027 (TONS) 106
      157. TABLE 145 INDIA: MAGNESIUM CHLORIDE MARKET, BY FORM, 2020‒2027 (USD THOUSAND) 106
      158. TABLE 146 INDIA: MAGNESIUM CHLORIDE MARKET, BY FORM, 2020‒2027 (TONS) 107
      159. TABLE 147 INDIA: MAGNESIUM CHLORIDE MARKET, BY GRADE, 2020‒2027 (USD THOUSAND) 107
      160. TABLE 148 INDIA: MAGNESIUM CHLORIDE MARKET, BY GRADE, 2020‒2027 (TONS) 107
      161. TABLE 149 INDIA: MAGNESIUM CHLORIDE MARKET, BY APPLICATION, 2020‒2027 (USD THOUSAND) 108
      162. TABLE 150 INDIA: MAGNESIUM CHLORIDE MARKET, BY APPLICATION, 2020‒2027 (TONS) 108
      163. TABLE 151 SOUTH KOREA: MAGNESIUM CHLORIDE MARKET, BY FORM, 2020‒2027 (USD THOUSAND) 109
      164. TABLE 152 SOUTH KOREA: MAGNESIUM CHLORIDE MARKET, BY FORM, 2020‒2027 (TONS) 109
      165. TABLE 153 SOUTH KOREA: MAGNESIUM CHLORIDE MARKET, BY GRADE, 2020‒2027 (USD THOUSAND) 109
      166. TABLE 154 SOUTH KOREA: MAGNESIUM CHLORIDE MARKET, BY GRADE, 2020‒2027 (TONS) 110
      167. TABLE 155 SOUTH KOREA: MAGNESIUM CHLORIDE MARKET, BY APPLICATION, 2020‒2027 (USD THOUSAND) 110
      168. TABLE 156 SOUTH KOREA: MAGNESIUM CHLORIDE MARKET, BY APPLICATION, 2020‒2027 (TONS) 111
      169. TABLE 157 AUSTRALIA AND NEW ZEALAND: MAGNESIUM CHLORIDE MARKET, BY FORM, 2020‒2027 (USD THOUSAND) 111
      170. TABLE 158 AUSTRALIA AND NEW ZEALAND: MAGNESIUM CHLORIDE MARKET, BY FORM, 2020‒2027 (TONS) 112
      171. TABLE 159 AUSTRALIA AND NEW ZEALAND: MAGNESIUM CHLORIDE MARKET, BY GRADE, 2020‒2027 (USD THOUSAND) 112
      172. TABLE 160 AUSTRALIA AND NEW ZEALAND: MAGNESIUM CHLORIDE MARKET, BY GRADE, 2020‒2027 (TONS) 112
      173. TABLE 161 AUSTRALIA AND NEW ZEALAND: MAGNESIUM CHLORIDE MARKET, BY APPLICATION, 2020‒2027 (USD THOUSAND) 113
      174. TABLE 162 AUSTRALIA AND NEW ZEALAND: MAGNESIUM CHLORIDE MARKET, BY APPLICATION, 2020‒2027 (TONS) 113
      175. TABLE 163 INDONESIA: MAGNESIUM CHLORIDE MARKET, BY FORM, 2020‒2027 (USD THOUSAND) 114
      176. TABLE 164 INDONESIA: MAGNESIUM CHLORIDE MARKET, BY FORM, 2020‒2027 (TONS) 114
      177. TABLE 165 INDONESIA: MAGNESIUM CHLORIDE MARKET, BY GRADE, 2020‒2027 (USD THOUSAND) 114
      178. TABLE 166 INDONESIA: MAGNESIUM CHLORIDE MARKET, BY GRADE, 2020‒2027 (TONS) 115
      179. TABLE 167 INDONESIA: MAGNESIUM CHLORIDE MARKET, BY APPLICATION, 2020‒2027 (USD THOUSAND) 115
      180. TABLE 168 INDONESIA: MAGNESIUM CHLORIDE MARKET, BY APPLICATION, 2020‒2027 (TONS) 116
      181. TABLE 169 REST OF ASIA-PACIFIC: MAGNESIUM CHLORIDE MARKET, BY FORM, 2020‒2027 (USD THOUSAND) 116
      182. TABLE 170 REST OF ASIA-PACIFIC: MAGNESIUM CHLORIDE MARKET, BY FORM, 2020‒2027 (TONS) 117
      183. TABLE 171 REST OF ASIA-PACIFIC: MAGNESIUM CHLORIDE MARKET, BY GRADE, 2020‒2027 (USD THOUSAND) 117
      184. TABLE 172 REST OF ASIA-PACIFIC: MAGNESIUM CHLORIDE MARKET, BY GRADE, 2020‒2027 (TONS) 117
      185. TABLE 173 REST OF ASIA-PACIFIC: MAGNESIUM CHLORIDE MARKET, BY APPLICATION, 2020‒2027 (USD THOUSAND) 118
      186. TABLE 174 REST OF ASIA-PACIFIC: MAGNESIUM CHLORIDE MARKET, BY APPLICATION, 2020‒2027 (TONS) 118
      187. TABLE 175 LATIN AMERICA: MAGNESIUM CHLORIDE MARKET, BY COUNTRY, 2020‒2027 (USD MILLION) 119
      188. TABLE 176 LATIN AMERICA: MAGNESIUM CHLORIDE MARKET, BY COUNTRY, 2020‒2027 (KILO TONS) 119
      189. TABLE 177 LATIN AMERICA: MAGNESIUM CHLORIDE MARKET, BY FORM, 2020‒2027 (USD MILLION) 120
      190. TABLE 178 LATIN AMERICA: MAGNESIUM CHLORIDE MARKET, BY FORM, 2020‒2027 (KILO TONS) 120
      191. TABLE 179 LATIN AMERICA: MAGNESIUM CHLORIDE MARKET, BY GRADE, 2020‒2027 (USD MILLION) 120
      192. TABLE 180 LATIN AMERICA: MAGNESIUM CHLORIDE MARKET, BY GRADE, 2020‒2027 (KILO TONS) 121
      193. TABLE 181 LATIN AMERICA: MAGNESIUM CHLORIDE MARKET, BY APPLICATION, 2020‒2027 (USD MILLION) 121
      194. TABLE 182 LATIN AMERICA: MAGNESIUM CHLORIDE MARKET, BY APPLICATION, 2020‒2027 (KILO TONS) 122
      195. TABLE 183 MEXICO: MAGNESIUM CHLORIDE MARKET, BY FORM, 2020‒2027 (USD MILLION) 122
      196. TABLE 184 MEXICO: MAGNESIUM CHLORIDE MARKET, BY FORM, 2020‒2027 (KILO TONS) 123
      197. TABLE 185 MEXICO: MAGNESIUM CHLORIDE MARKET, BY GRADE, 2020‒2027 (USD MILLION) 123
      198. TABLE 186 MEXICO: MAGNESIUM CHLORIDE MARKET, BY GRADE, 2020‒2027 (KILO TONS) 123
      199. TABLE 187 MEXICO: MAGNESIUM CHLORIDE MARKET, BY APPLICATION, 2020‒2027 (USD MILLION) 124
      200. TABLE 188 MEXICO: MAGNESIUM CHLORIDE MARKET, BY APPLICATION, 2020‒2027 (KILO TONS) 124
      201. TABLE 189 BRAZIL: MAGNESIUM CHLORIDE MARKET, BY FORM, 2020‒2027 (USD MILLION) 125
      202. TABLE 190 BRAZIL: MAGNESIUM CHLORIDE MARKET, BY FORM, 2020‒2027 (KILO TONS) 125
      203. TABLE 191 BRAZIL: MAGNESIUM CHLORIDE MARKET, BY GRADE, 2020‒2027 (USD MILLION) 125
      204. TABLE 192 BRAZIL: MAGNESIUM CHLORIDE MARKET, BY GRADE, 2020‒2027 (KILO TONS) 126
      205. TABLE 193 BRAZIL: MAGNESIUM CHLORIDE MARKET, BY APPLICATION, 2020‒2027 (USD MILLION) 126
      206. TABLE 194 BRAZIL: MAGNESIUM CHLORIDE MARKET, BY APPLICATION, 2020‒2027 (KILO TONS) 127
      207. TABLE 195 ARGENTINA: MAGNESIUM CHLORIDE MARKET, BY FORM, 2020‒2027 (USD MILLION) 127
      208. TABLE 196 ARGENTINA: MAGNESIUM CHLORIDE MARKET, BY FORM, 2020‒2027 (KILO TONS) 128
      209. TABLE 197 ARGENTINA: MAGNESIUM CHLORIDE MARKET, BY GRADE, 2020‒2027 (USD MILLION) 128
      210. TABLE 198 ARGENTINA: MAGNESIUM CHLORIDE MARKET, BY GRADE, 2020‒2027 (KILO TONS) 128
      211. TABLE 199 ARGENTINA: MAGNESIUM CHLORIDE MARKET, BY APPLICATION, 2020‒2027 (USD MILLION) 129
      212. TABLE 200 ARGENTINA: MAGNESIUM CHLORIDE MARKET, BY APPLICATION, 2020‒2027 (KILO TONS) 129
      213. TABLE 201 REST OF LATIN AMERICA: MAGNESIUM CHLORIDE MARKET, BY FORM, 2020‒2027 (USD MILLION) 130
      214. TABLE 202 REST OF LATIN AMERICA: MAGNESIUM CHLORIDE MARKET, BY FORM, 2020‒2027 (KILO TONS) 130
      215. TABLE 203 REST OF LATIN AMERICA: MAGNESIUM CHLORIDE MARKET, BY GRADE, 2020‒2027 (USD MILLION) 130
      216. TABLE 204 REST OF LATIN AMERICA: MAGNESIUM CHLORIDE MARKET, BY GRADE, 2020‒2027 (KILO TONS) 131
      217. TABLE 205 REST OF LATIN AMERICA: MAGNESIUM CHLORIDE MARKET, BY APPLICATION, 2020‒2027 (USD MILLION) 131
      218. TABLE 206 REST OF LATIN AMERICA: MAGNESIUM CHLORIDE MARKET, BY APPLICATION, 2020‒2027 (KILO TONS) 132
      219. TABLE 207 MIDDLE EAST AND AFRICA: MAGNESIUM CHLORIDE MARKET, BY COUNTRY, 2020‒2027 (USD MILLION) 132
      220. TABLE 208 MIDDLE EAST AND AFRICA: MAGNESIUM CHLORIDE MARKET, BY COUNTRY, 2020‒2027 (KILO TONS) 133
      221. TABLE 209 MIDDLE EAST AND AFRICA: MAGNESIUM CHLORIDE MARKET, BY FORM, 2020‒2027 (USD MILLION) 133
      222. TABLE 210 MIDDLE EAST AND AFRICA: MAGNESIUM CHLORIDE MARKET, BY FORM, 2020‒2027 (KILO TONS) 133
      223. TABLE 211 MIDDLE EAST AND AFRICA: MAGNESIUM CHLORIDE MARKET, BY GRADE, 2020‒2027 (USD MILLION) 134
      224. TABLE 212 MIDDLE EAST AND AFRICA: MAGNESIUM CHLORIDE MARKET, BY GRADE, 2020‒2027 (KILO TONS) 134
      225. TABLE 213 MIDDLE EAST AND AFRICA: MAGNESIUM CHLORIDE MARKET, BY APPLICATION, 2020‒2027 (USD MILLION) 135
      226. TABLE 214 MIDDLE EAST AND AFRICA: MAGNESIUM CHLORIDE MARKET, BY APPLICATION, 2020‒2027 (KILO TONS) 135
      227. TABLE 215 TURKEY: MAGNESIUM CHLORIDE MARKET, BY FORM, 2020‒2027 (USD MILLION) 136
      228. TABLE 216 TURKEY: MAGNESIUM CHLORIDE MARKET, BY FORM, 2020‒2027 (KILO TONS) 136
      229. TABLE 217 TURKEY: MAGNESIUM CHLORIDE MARKET, BY GRADE, 2020‒2027 (USD MILLION) 136
      230. TABLE 218 TURKEY: MAGNESIUM CHLORIDE MARKET, BY GRADE, 2020‒2027 (KILO TONS) 137
      231. TABLE 219 TURKEY: MAGNESIUM CHLORIDE MARKET, BY APPLICATION, 2020‒2027 (USD MILLION) 137
      232. TABLE 220 TURKEY: MAGNESIUM CHLORIDE MARKET, BY APPLICATION, 2020‒2027 (KILO TONS) 138
      233. TABLE 221 UAE: MAGNESIUM CHLORIDE MARKET, BY FORM, 2020‒2027 (USD MILLION) 138
      234. TABLE 222 UAE: MAGNESIUM CHLORIDE MARKET, BY FORM, 2020‒2027 (KILO TONS) 139
      235. TABLE 223 UAE: MAGNESIUM CHLORIDE MARKET, BY GRADE, 2020‒2027 (USD MILLION) 139
      236. TABLE 224 UAE: MAGNESIUM CHLORIDE MARKET, BY GRADE, 2020‒2027 (KILO TONS) 139
      237. TABLE 225 UAE: MAGNESIUM CHLORIDE MARKET, BY APPLICATION, 2020‒2027 (USD MILLION) 140
      238. TABLE 226 UAE: MAGNESIUM CHLORIDE MARKET, BY APPLICATION, 2020‒2027 (KILO TONS) 140
      239. TABLE 227 SAUDI ARABIA: MAGNESIUM CHLORIDE MARKET, BY FORM, 2020‒2027 (USD MILLION) 141
      240. TABLE 228 SAUDI ARABIA: MAGNESIUM CHLORIDE MARKET, BY FORM, 2020‒2027 (KILO TONS) 141
      241. TABLE 229 SAUDI ARABIA: MAGNESIUM CHLORIDE MARKET, BY GRADE, 2020‒2027 (USD MILLION) 141
      242. TABLE 230 SAUDI ARABIA: MAGNESIUM CHLORIDE MARKET, BY GRADE, 2020‒2027 (KILO TONS) 142
      243. TABLE 231 SAUDI ARABIA: MAGNESIUM CHLORIDE MARKET, BY APPLICATION, 2020‒2027 (USD MILLION) 142
      244. TABLE 232 SAUDI ARABIA: MAGNESIUM CHLORIDE MARKET, BY APPLICATION, 2020‒2027 (KILO TONS) 143
      245. TABLE 233 ISRAEL: MAGNESIUM CHLORIDE MARKET, BY FORM, 2020‒2027 (USD MILLION) 143
      246. TABLE 234 ISRAEL: MAGNESIUM CHLORIDE MARKET, BY FORM, 2020‒2027 (KILO TONS) 144
      247. TABLE 235 ISRAEL: MAGNESIUM CHLORIDE MARKET, BY GRADE, 2020‒2027 (USD MILLION) 144
      248. TABLE 236 ISRAEL: MAGNESIUM CHLORIDE MARKET, BY GRADE, 2020‒2027 (KILO TONS) 144
      249. TABLE 237 ISRAEL: MAGNESIUM CHLORIDE MARKET, BY APPLICATION, 2020‒2027 (USD MILLION) 145
      250. TABLE 238 ISRAEL: MAGNESIUM CHLORIDE MARKET, BY APPLICATION, 2020‒2027 (KILO TONS) 145
      251. TABLE 239 SOUTH AFRICA: MAGNESIUM CHLORIDE MARKET, BY FORM, 2020‒2027 (USD MILLION) 146
      252. TABLE 240 SOUTH AFRICA: MAGNESIUM CHLORIDE MARKET, BY FORM, 2020‒2027 (KILO TONS) 146
      253. TABLE 241 SOUTH AFRICA: MAGNESIUM CHLORIDE MARKET, BY GRADE, 2020‒2027 (USD MILLION) 146
      254. TABLE 242 SOUTH AFRICA: MAGNESIUM CHLORIDE MARKET, BY GRADE, 2020‒2027 (KILO TONS) 147
      255. TABLE 243 SOUTH AFRICA: MAGNESIUM CHLORIDE MARKET, BY APPLICATION, 2020‒2027 (USD MILLION) 147
      256. TABLE 244 SOUTH AFRICA: MAGNESIUM CHLORIDE MARKET, BY APPLICATION, 2020‒2027 (KILO TONS) 148
      257. TABLE 245 EGYPT: MAGNESIUM CHLORIDE MARKET, BY FORM, 2020‒2027 (USD MILLION) 148
      258. TABLE 246 EGYPT: MAGNESIUM CHLORIDE MARKET, BY FORM, 2020‒2027 (KILO TONS) 149
      259. TABLE 247 EGYPT: MAGNESIUM CHLORIDE MARKET, BY GRADE, 2020‒2027 (USD MILLION) 149
      260. TABLE 248 EGYPT: MAGNESIUM CHLORIDE MARKET, BY GRADE, 2020‒2027 (KILO TONS) 149
      261. TABLE 249 EGYPT: MAGNESIUM CHLORIDE MARKET, BY APPLICATION, 2020‒2027 (USD MILLION) 150
      262. TABLE 250 EGYPT: MAGNESIUM CHLORIDE MARKET, BY APPLICATION, 2020‒2027 (KILO TONS) 150
      263. TABLE 251 REST OF MIDDLE EAST AND AFRICA: MAGNESIUM CHLORIDE MARKET, BY FORM, 2020‒2027 (USD MILLION) 151
      264. TABLE 252 REST OF MIDDLE EAST AND AFRICA: MAGNESIUM CHLORIDE MARKET, BY FORM, 2020‒2027 (KILO TONS) 151
      265. TABLE 253 REST OF MIDDLE EAST AND AFRICA: MAGNESIUM CHLORIDE MARKET, BY GRADE, 2020‒2027 (USD MILLION) 151
      266. TABLE 254 REST OF MIDDLE EAST AND AFRICA: MAGNESIUM CHLORIDE MARKET, BY GRADE, 2020‒2027 (KILO TONS) 152
      267. TABLE 255 REST OF MIDDLE EAST AND AFRICA: MAGNESIUM CHLORIDE MARKET, BY APPLICATION, 2020‒2027 (USD MILLION) 152
      268. TABLE 256 REST OF MIDDLE EAST AND AFRICA: MAGNESIUM CHLORIDE MARKET, BY APPLICATION, 2020‒2027 (KILO TONS) 153 15 List Of Figures
      269. FIGURE 1 GLOBAL MAGNESIUM CHLORIDE MARKET: MARKET STRUCTURE 18
      270. FIGURE 2 NORTH AMERICA MARKET SIZE & MARKET SHARE BY COUNTRY (2020-2027) 19
      271. FIGURE 3 EUROPE MARKET SIZE & MARKET SHARE BY COUNTRY (2020-2027) 20
      272. FIGURE 4 ASIA-PACIFIC & MARKET SHARE BY COUNTRY (2020-2027) 20
      273. FIGURE 5 LATIN AMERICA MARKET SIZE & MARKET SHARE BY COUNTRY (2020-2027) 21
      274. FIGURE 6 MIDDLE EAST & AFRICA MARKET SIZE & MARKET SHARE BY COUNTRY (2020-2027) 21
      275. FIGURE 7 RESEARCH PROCESS OF MRFR 22
      276. FIGURE 8 TOP-DOWN & BOTTOM-UP"

    Magnesium Chloride Market Segmentation

    Market Segmentation Overview

    • Detailed segmentation data will be available in the full report
    • Comprehensive analysis by multiple parameters
    • Regional and country-level breakdowns
    • Market size forecasts by segment
    Infographic

    Free Sample Request

    Kindly complete the form below to receive a free sample of this Report

    Get Free Sample

    Customer Strories

    “I am very pleased with how market segments have been defined in a relevant way for my purposes (such as "Portable Freezers & refrigerators" and "last-mile"). In general the report is well structured. Thanks very much for your efforts.”

    Victoria Milne

    Founder
    Case Study
    Chemicals and Materials