• Cat-intel
  • MedIntelliX
  • Resources
  • About Us
  • Request Free Sample

    ×

    Kindly complete the form below to receive a free sample of this Report

    Leading companies partner with us for data-driven Insights

    clients tt-cursor

    LNG Filling Station Market

    ID: MRFR/E&P/24284-HCR
    128 Pages
    Garvit Vyas
    September 2025

    LNG Filling Station Market Research Report By Application (Heavy-Duty Vehicles, Light-Duty Vehicles, Marine Vessels, Industrial), By Technology (Liquefaction Process, Storage Capacity, Dispensing Infrastructure), By Tank Capacity (Small-Scale (Under 10,000 Gallons), Mid-Scale (10,000-100,000 Gallons), Large-Scale (Over 100,000 Gallons)), By End User (Transportation Industry, Logistics and Supply Chain, Construction Sector, Energy Sector), By Fueling Mode (Fast-Fill Stations, Slow-Fill Stations) and By Regional (North America, Europe, South A...

    Share:

    Download PDF

    ×

    We do not share your information with anyone. However, we may send you emails based on your report interest from time to time. You may contact us at any time to opt-out.

    LNG Filling Station Market Research Report - Global Forecast till 2034 Infographic
    $ 4,950.0
    $ 5,950.0
    $ 7,250.0
    Table of Contents

    LNG Filling Station Market Summary

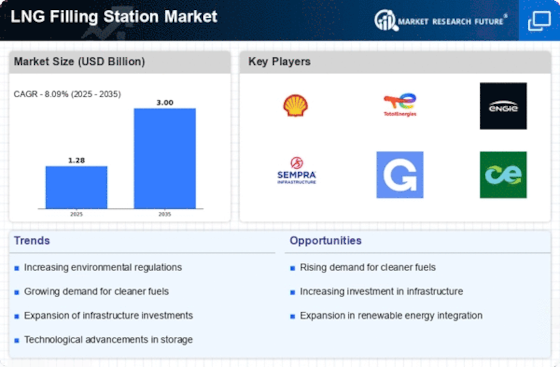
    The Global LNG Filling Station Market is projected to grow significantly from 1.28 USD Billion in 2024 to 3.03 USD Billion by 2035.

    Key Market Trends & Highlights

    LNG Filling Station Key Trends and Highlights

    • The market is expected to experience a compound annual growth rate (CAGR) of 8.14% from 2025 to 2035.
    • By 2035, the market valuation is anticipated to reach 3.03 USD Billion, indicating robust growth potential.
    • In 2024, the market is valued at 1.28 USD Billion, reflecting the increasing demand for LNG infrastructure.
    • Growing adoption of LNG technology due to environmental regulations is a major market driver.

    Market Size & Forecast

    2024 Market Size 1.28 (USD Billion)
    2035 Market Size 3.03 (USD Billion)
    CAGR (2025-2035) 8.14%
    Largest Regional Market Share in 2024 latin_america)

    Major Players

    Linde, MOL Liquefied Natural Gas, Iwatani Corporation, Golar LNG, Chart Industries, Mitsui O.S.K. Lines, Tokyo Gas, Air Liquide, GasLog, Baker Hughes, Knutsen NYK Offshore Tankers, JGC Holdings, Exmar, NYK Line, Hoegh LNG

    LNG Filling Station Market Trends

    The global Liquefied Natural Gas (LNG) Filling Station Market is poised for significant growth, driven by the rising demand for clean and sustainable transportation fuels. Governments worldwide are introducing stringent emissions regulations, promoting LNG as a viable alternative to traditional fossil fuels.

    The expansion of LNG filling stations is poised to play a crucial role in the global transition towards cleaner energy sources, as governments increasingly prioritize sustainable transportation solutions.

    U.S. Department of Energy

    LNG Filling Station Market Drivers

    Market Growth Projections

    The Global LNG Filling Station Market Industry is projected to experience robust growth in the coming years. With a market value anticipated to reach 1.28 USD Billion in 2024 and 3.03 USD Billion by 2035, the industry is poised for significant expansion. The compound annual growth rate (CAGR) of 8.14% from 2025 to 2035 indicates a strong upward trajectory, driven by various factors such as increasing demand for cleaner energy, expansion of LNG infrastructure, and government support. This growth reflects a broader trend towards sustainable energy solutions and the increasing role of LNG in the global energy landscape.

    Expansion of LNG Infrastructure

    The expansion of LNG infrastructure is a pivotal driver for the Global LNG Filling Station Market Industry. Countries are increasingly investing in the development of LNG terminals and filling stations to support the growing demand for LNG as a fuel source. For example, the United States has seen significant growth in its LNG infrastructure, with numerous projects underway to enhance distribution capabilities. This expansion not only facilitates the use of LNG in transportation but also supports the integration of LNG into various sectors, including maritime and heavy-duty vehicles. As infrastructure develops, it is anticipated that the market will continue to grow, aligning with global energy transition goals.

    Growing Demand for Clean Energy

    The Global LNG Filling Station Market Industry is experiencing a surge in demand for cleaner energy alternatives as nations strive to reduce carbon emissions. Governments worldwide are implementing stringent regulations to promote the adoption of liquefied natural gas (LNG) as a transitional fuel. For instance, the European Union has set ambitious targets for reducing greenhouse gas emissions, which has led to increased investments in LNG infrastructure. This shift towards cleaner energy sources is expected to drive the market, with projections indicating that the market could reach 1.28 USD Billion in 2024 and 3.03 USD Billion by 2035, reflecting a compound annual growth rate (CAGR) of 8.14% from 2025 to 2035.

    Government Incentives and Support

    Government incentives and support are vital drivers for the Global LNG Filling Station Market Industry. Many governments are offering financial incentives, subsidies, and grants to encourage the establishment of LNG filling stations. These initiatives aim to promote the use of LNG as a cleaner alternative to traditional fuels. For example, countries like Japan and South Korea have implemented policies that provide financial assistance for the construction of LNG infrastructure. Such support not only lowers the entry barriers for new players in the market but also stimulates investment in LNG technology and infrastructure, thereby fostering market growth.

    Increasing Adoption of LNG in Transportation

    The increasing adoption of LNG in transportation is significantly influencing the Global LNG Filling Station Market Industry. As the transportation sector seeks to reduce its carbon footprint, LNG is emerging as a preferred alternative to diesel and gasoline. Heavy-duty trucks, buses, and marine vessels are increasingly utilizing LNG due to its lower emissions and cost-effectiveness. For instance, several major logistics companies are transitioning their fleets to LNG-powered vehicles, which is driving the demand for LNG filling stations. This trend is expected to continue, further propelling market growth as more stakeholders recognize the benefits of LNG in achieving sustainability goals.

    Technological Advancements in LNG Technology

    Technological advancements in LNG technology are playing a crucial role in shaping the Global LNG Filling Station Market Industry. Innovations in liquefaction processes, storage solutions, and refueling systems are enhancing the efficiency and safety of LNG filling stations. For instance, advancements in cryogenic technology have improved the handling and storage of LNG, making it a more viable option for various applications. These technological improvements not only reduce operational costs but also increase the attractiveness of LNG as a fuel alternative. As these technologies continue to evolve, they are likely to bolster market growth and facilitate wider adoption of LNG across different sectors.

    Market Segment Insights

    LNG Filling Station Market Application Insights

    The LNG Filling Station Market is segmented into various applications, including heavy-duty vehicles, light-duty vehicles, marine vessels, and industrial. Heavy-duty vehicles, such as trucks and buses, were the key consumers of the LNG Filling Station Market, taking an 88.77% consumption share in 2023, and it is anticipated to remain the key application segment during the forecast period. This is because of the increasing adoption of LNG as a fuel for heavy-duty vehicles, such as trucks and buses. The adoption is mainly because of the cost-effectiveness, environmentally friendly nature, and availability compared to other alternative sources.

    Light-duty vehicles, such as SUV cars, took 8.73% of the LNG Filling Station Market in 2023, and the demand is to increase during the forecast period, an attributable growth at a CAGR of over 9%. The increasing adoption of LNG as a fuel for light-duty vehicles, including passenger cars and SUVs, is because government incentives and regulations promote the adoption of clean and sustainable transportation. Marin vessels, including ships that are one of the key applications, represent 1.72% of the LNG Filling Station Market.

    The demand for LNG as a critical fuel for marine vessels, especially in the shipping and maritime industries, is increasing because of the benefits associated with it.

    The benefits include the production of less harmful emissions than traditional marine vessels, lower operational costs, and better fuel efficiency. In industrial applications, the demand represented 0.78% of the LNG Filling Station Market. This is expected to rise during the forecast period because LNG is increasingly becoming an ideal environmentally friendly and efficient fuel for industrial applications like food and beverage heating production, power generation, and other manufacturing processes. Overall, LNG’s adoption as a source of fuel in each application segment is the main reason that will drive the growth of the LNG Filling Station Market.

    Source: Primary Research, Secondary Research, Market Research Future Database and Analyst Review

    LNG Filling Station Market Technology Insights

    The segmentation of the LNG Filling Station Market by technology includes Liquefaction Process, Storage Capacity, and Dispensing Infrastructure. It is expected that the Liquefaction Process segment will dominate the market by 2023, accounting for 45% of the total revenue. The reason for that is the increasing demand for liquefied natural gas, which is more efficient and cleaner in comparison with other fuels.

    The Storage Capacity segment will evolve at a significant rate over the period under consideration as there is a need for it to be both effective and reliable.The Dispensing Infrastructure will also entail substantial growth rates as around the world; there is an increasing number of constructed LNG filling stations.

    LNG Filling Station Market Tank Capacity Insights

    The LNG Filling Station Market is segmented by tank capacity into small-scale (under 10,000 gallons), mid-scale (10,000-100,000 gallons), and large-scale (over 100,000 gallons). The large-scale segment is expected to hold the largest market share in 2023, owing to the increasing demand for large-scale LNG filling stations from the transportation and industrial sectors. However, the small-scale segment is expected to grow at the highest CAGR during the forecast period due to the rising adoption of small-scale LNG filling stations in remote areas and developing countries.

    The LNG Filling Station Market is expected to reach a value of USD 2.2 billion by 2032, expanding at a CAGR of 8.09% from 2024 to 2032.

    LNG Filling Station Market End User Insights

    The LNG Filling Station Market Segmentation by End User offers valuable insights into various industries utilizing LNG filling stations. In 2023, the Transportation Industry held a significant market share due to the growing demand for LNG-powered vehicles in the commercial and heavy-duty segments. For instance, in 2024, the global market for LNG-powered trucks is projected to reach 20,000 units, representing a 15% increase from the previous year.

    The Logistics and Supply Chain sector is also witnessing increased adoption of LNG filling stations to reduce emissions and enhance efficiency in long-haul transportation.Furthermore, the Construction Sector is exploring the use of LNG-powered equipment to minimize environmental impact on construction sites. The Energy Sector, including power plants and industrial facilities, is expected to drive demand for LNG filling stations in the coming years as LNG becomes a cleaner and more sustainable energy source.

    LNG Filling Station Market Fueling Mode Insights

    The LNG Filling Station Market segmentation by Fueling Mode includes Fast-Fill Stations and Slow-Fill Stations. Fast-Fill Stations are designed to rapidly dispense LNG into vehicles, typically within 5-10 minutes, making them suitable for heavy-duty vehicles and long-haul transportation. Slow-fill stations, on the other hand, dispense LNG at a slower rate, typically taking several hours to fill a vehicle. They are commonly used for light-duty vehicles and local transportation.

    In 2023, the Fast-Fill Stations segment held a larger market share due to the growing demand for efficient and time-saving fueling solutions in the commercial transportation sector. However, the Slow-Fill Stations segment is expected to witness significant growth in the coming years, driven by the increasing adoption of LNG-powered passenger vehicles and the expansion of LNG refueling infrastructure in residential and commercial areas.

    Get more detailed insights about LNG Filling Station Market Research Report - Global Forecast till 2034

    Regional Insights

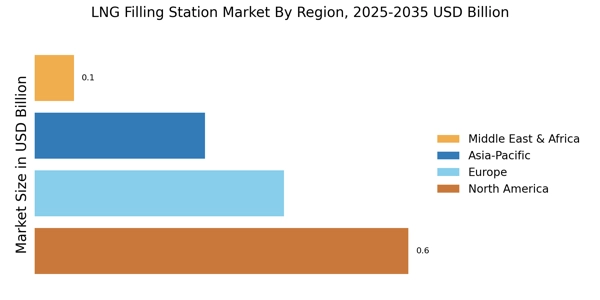
    The LNG Filling Station Market is segmented into North America, Europe, APAC, South America, and MEA. In 2023, North America accounted for the largest market share, followed by Europe. The APAC region is expected to grow at the highest CAGR from 2024 to 2032. The growth of the LNG Filling Station Market in North America is attributed to the increasing demand for LNG as a transportation fuel.

    Europe is also a major market for the LNG Filling Station Market, with a growing number of LNG-powered vehicles. The APAC region is expected to witness significant growth in the LNG Filling Station Market, owing to the increasing demand for LNG in the transportation and power generation sectors.South America and MEA are also expected to witness steady growth in the LNG Filling Station Market, driven by the increasing government support for LNG as a clean fuel.

    LNG Filling Station Market, By Regional

    Source: Primary Research, Secondary Research, Market Research Future Database and Analyst Review

    Key Players and Competitive Insights

    Major players in the LNG Filling Station Market industry are constantly striving to gain a competitive edge by introducing innovative technologies and expanding their product portfolios. Leading LNG Filling Station Market players are actively involved in research and development to enhance the efficiency and safety of their products. They are also focused on developing cost-effective solutions to cater to the growing demand for LNG as a clean and sustainable fuel. The LNG Filling Station Market development is being driven by the increasing adoption of LNG as a transportation fuel.

    Government regulations and incentives aimed at promoting the use of LNG are also contributing to the growth of the market.

    A leading company in the LNG Filling Station Market, Chart Industries, has a strong global presence and offers a wide range of LNG fueling solutions. The company is focused on providing innovative and reliable products and services to meet the evolving needs of its customers. Chart Industries has a well-established distribution network and a team of experienced engineers to support its customers worldwide. The company's commitment to quality and customer satisfaction has earned it a reputation as a trusted provider of LNG fueling solutions.

    A prominent competitor in the LNG Filling Station Market, Iwatani Corporation, is a leading supplier of LNG and related equipment in Japan. The company is expanding its presence in international markets and has established a joint venture with Chart Industries to develop and market LNG fueling solutions. Iwatani Corporation has a strong track record of innovation and is committed to providing high-quality products and services to its customers. The company's focus on safety and reliability has made it a preferred choice for customers in the LNG industry.

    Key Companies in the LNG Filling Station Market market include

    Industry Developments

    Future Outlook

    LNG Filling Station Market Future Outlook

    The LNG Filling Station Market is projected to grow at an 8.14% CAGR from 2024 to 2035, driven by increasing demand for cleaner fuels and supportive government policies.

    New opportunities lie in:

    • Invest in advanced LNG storage technologies to enhance efficiency and safety.
    • Develop strategic partnerships with logistics companies for expanded distribution networks.
    • Explore innovative financing models to facilitate station construction and operation.

    By 2035, the LNG Filling Station Market is expected to achieve substantial growth, positioning itself as a key player in the energy transition.

    Market Segmentation

    LNG Filling Station Market End User Outlook

    • Transportation Industry
    • Logistics and Supply Chain
    • Construction Sector
    • Energy Sector

    LNG Filling Station Market Regional Outlook

    • North America
    • Europe
    • South America
    • Asia Pacific
    • Middle East and Africa

    LNG Filling Station Market Technology Outlook

    • Liquefaction Process
    • Storage Capacity
    • Dispensing Infrastructure

    LNG Filling Station Market Application Outlook

    • Heavy-Duty Vehicles
    • Light-Duty Vehicles
    • Marine Vessels
    • Industrial

    LNG Filling Station Market Fueling Mode Outlook

    • Fast-Fill Stations
    • Slow-Fill Stations

    LNG Filling Station Market Tank Capacity Outlook

    • Small-Scale (Under 10,000 Gallons)
    • Mid-Scale (10,000-100,000 Gallons)
    • Large-Scale (Over 100,000 Gallons)

    Report Scope

    Report Attribute/Metric Details
    Market Size 2024    1.28 (USD Billion)
    Market Size 2025    1.38 (USD Billion)
    Market Size 2034     2.78 (USD Billion)
    Compound Annual Growth Rate (CAGR)      8.92% (2025 - 2034)
    Report Coverage Revenue Forecast, Competitive Landscape, Growth Factors, and Trends
    Base Year 2024
    Market Forecast Period 2025 - 2034
    Historical Data 2019 - 2023
    Market Forecast Units USD Billion
    Key Companies Profiled Linde, MOL Liquefied Natural Gas, Iwatani Corporation, Golar LNG, Chart Industries, Mitsui O.S.K. Lines, Tokyo Gas, Air Liquide, GasLog, Baker Hughes, Knutsen NYK Offshore Tankers, JGC Holdings, Exmar, NYK Lin, Hoegh LNG
    Segments Covered Application, Technology, Tank Capacity, End User, Fueling Mode, Regional
    Key Market Opportunities Expansion to Remote Areas Technological Advancements Government Support Growing LNG Vehicle Adoption Increase in LNG Production and Distribution
    Key Market Dynamics Increased government incentives, technological advancements, growing environmental concerns, rising demand from the transportation sector, expanding LNG infrastructure
    Countries Covered North America, Europe, APAC, South America, MEA

    Market Highlights

    Author

    Garvit Vyas
    Analyst

    Explore the profile of Garvit Vyas, one of our esteemed authors at Market Research Future, and access their expert research contributions in the field of market research and industry analysis

    Leave a Comment

    FAQs

    What is the projected market size of the LNG Filling Station Market in 2024?

    The LNG Filling Station Market is anticipated to reach a valuation of approximately USD 1.28 billion in 2024, showcasing a steady growth trajectory.

    What is the anticipated CAGR of the LNG Filling Station Market from 2025 to 2034?

    The LNG Filling Station Market is projected to exhibit a consistent growth rate, with a CAGR of 8.92% estimated for the period from 2025 to 2034.

    Which region is expected to dominate the LNG Filling Station Market in terms of revenue?

    The Asia-Pacific region is anticipated to lead the LNG Filling Station Market in terms of revenue, driven by increasing demand for clean energy sources and government initiatives to promote sustainable transportation.

    What are the primary applications of LNG Filling Stations?

    LNG Filling Stations are primarily utilized for fueling heavy-duty vehicles such as trucks, buses, and ships, contributing to the reduction of greenhouse gas emissions and the promotion of sustainable transportation practices.

    Who are some of the key competitors in the LNG Filling Station Market?

    Major players in the LNG Filling Station Market include companies like Shell, Gazprom, Air Liquide, and Chart Industries, among others, who are actively involved in the development, manufacturing, and distribution of LNG Filling Stations.

    What factors are contributing to the growth of the LNG Filling Station Market?

    The expanding adoption of LNG as a clean and cost-effective fuel, coupled with stringent government regulations aimed at reducing carbon emissions, are key factors driving the growth of the LNG Filling Station Market.

    What are the potential challenges faced by the LNG Filling Station Market?

    The high upfront investment costs associated with LNG Filling Station infrastructure, as well as the limited availability of LNG fuel in certain regions, pose potential challenges to the growth of the market.

    How is technological advancement impacting the LNG Filling Station Market?

    Ongoing advancements in LNG storage and transportation technologies, such as the development of smaller and more efficient LNG storage tanks, are contributing to the expansion of the LNG Filling Station Market.

    What role do government regulations play in shaping the LNG Filling Station Market?

    Government policies and regulations aimed at promoting sustainable transportation and reducing greenhouse gas emissions are creating a favorable landscape for the growth of the LNG Filling Station Market.

    What are the key trends expected to shape the future of the LNG Filling Station Market?

    The increasing emphasis on reducing carbon emissions, the expansion of LNG fueling infrastructure, and technological advancements are expected to continue shaping the future of the LNG Filling Station Market.

    1. |- TABLE OF CONTENTS         1. EXECUTIVE SUMMARY  1.1. Market Overview  1.2. Key Findings  1.3. Market Segmentation  1.4. Competitive Landscape  1.5. Challenges and Opportunities  1.6. Future Outlook        2. MARKET INTRODUCTION  2.1. Definition  2.2. Scope of the study  2.2.1. Research Objective  2.2.2. Assumption  2.2.3. Limitations  3. RESEARCH METHODOLOGY  3.1. Overview  3.2. Data Mining  3.3. Secondary Research  3.4. Primary Research  3.4.1. Primary Interviews and Information Gathering Process  3.4.2. Breakdown of Primary Respondents  3.5. Forecasting Model  3.6. Market Size Estimation  3.6.1. Bottom-Up Approach  3.6.2. Top-Down Approach  3.7. Data Triangulation  3.8. Validation        4. MARKET DYNAMICS  4.1. Overview  4.2. Drivers  4.3. Restraints  4.4. Opportunities  5. MARKET FACTOR ANALYSIS  5.1. Value chain Analysis  5.2. Porter's Five Forces Analysis  5.2.1. Bargaining Power of Suppliers  5.2.2. Bargaining Power of Buyers  5.2.3. Threat of New Entrants  5.2.4. Threat of Substitutes  5.2.5. Intensity of Rivalry  5.3. COVID-19 Impact Analysis  5.3.1. Market Impact Analysis  5.3.2. Regional Impact  5.3.3. Opportunity and Threat Analysis        6. LNG FILLING STATION MARKET, BY APPLICATION (USD BILLION)  6.1. Heavy-Duty Vehicles  6.2. Light-Duty Vehicles  6.3. Marine Vessels  6.4. Industrial  7. LNG FILLING STATION MARKET, BY TECHNOLOGY (USD BILLION)  7.1. Liquefaction Process  7.2. Storage Capacity  7.3. Dispensing Infrastructure  8. LNG FILLING STATION MARKET, BY TANK CAPACITY (USD BILLION)  8.1. Small-Scale (Under 10,000 Gallons)  8.2. Mid-Scale (10,000-100,000 Gallons)  8.3. Large-Scale (Over 100,000 Gallons)  9. LNG FILLING STATION MARKET, BY END USER (USD BILLION)  9.1. Transportation Industry  9.2. Logistics and Supply Chain  9.3. Construction Sector  9.4. Energy Sector  10. LNG FILLING STATION MARKET, BY FUELING MODE (USD BILLION)  10.1. Fast-Fill Stations  10.2. Slow-Fill Stations  11. LNG FILLING STATION MARKET, BY REGIONAL (USD BILLION)  11.1. North America  11.1.1. US  11.1.2. Canada  11.2. Europe  11.2.1. Germany  11.2.2. UK  11.2.3. France  11.2.4. Russia  11.2.5. Italy  11.2.6. Spain  11.2.7. Rest of Europe  11.3. APAC  11.3.1. China  11.3.2. India  11.3.3. Japan  11.3.4. South Korea  11.3.5. Malaysia  11.3.6. Thailand  11.3.7. Indonesia  11.3.8. Rest of APAC  11.4. South America  11.4.1. Brazil  11.4.2. Mexico  11.4.3. Argentina  11.4.4. Rest of South America  11.5. MEA  11.5.1. GCC Countries  11.5.2. South Africa  11.5.3. Rest of MEA        12. COMPETITIVE LANDSCAPE  12.1. Overview  12.2. Competitive Analysis  12.3. Market share Analysis  12.4. Major Growth Strategy in the Lng Filling Station Market  12.5. Competitive Benchmarking  12.6. Leading Players in Terms of Number of Developments in the Lng Filling Station Market  12.7. Key developments and growth strategies  12.7.1. New Product Launch/Service Deployment  12.7.2. Merger & Acquisitions  12.7.3. Joint Ventures  12.8. Major Players Financial Matrix  12.8.1. Sales and Operating Income  12.8.2. Major Players R&D Expenditure. 2023  13. COMPANY PROFILES  13.1. Linde  13.1.1. Financial Overview  13.1.2. Products Offered  13.1.3. Key Developments  13.1.4. SWOT Analysis  13.1.5. Key Strategies  13.2. MOL Liquefied Natural Gas  13.2.1. Financial Overview  13.2.2. Products Offered  13.2.3. Key Developments  13.2.4. SWOT Analysis  13.2.5. Key Strategies  13.3. Iwatani Corporation  13.3.1. Financial Overview  13.3.2. Products Offered  13.3.3. Key Developments  13.3.4. SWOT Analysis  13.3.5. Key Strategies  13.4. Golar LNG  13.4.1. Financial Overview  13.4.2. Products Offered  13.4.3. Key Developments  13.4.4. SWOT Analysis  13.4.5. Key Strategies  13.5. Chart Industries  13.5.1. Financial Overview  13.5.2. Products Offered  13.5.3. Key Developments  13.5.4. SWOT Analysis  13.5.5. Key Strategies  13.6. Mitsui O.S.K. Lines  13.6.1. Financial Overview  13.6.2. Products Offered  13.6.3. Key Developments  13.6.4. SWOT Analysis  13.6.5. Key Strategies  13.7. Tokyo Gas  13.7.1. Financial Overview  13.7.2. Products Offered  13.7.3. Key Developments  13.7.4. SWOT Analysis  13.7.5. Key Strategies  13.8. Air Liquide  13.8.1. Financial Overview  13.8.2. Products Offered  13.8.3. Key Developments  13.8.4. SWOT Analysis  13.8.5. Key Strategies  13.9. GasLog  13.9.1. Financial Overview  13.9.2. Products Offered  13.9.3. Key Developments  13.9.4. SWOT Analysis  13.9.5. Key Strategies  13.10. Baker Hughes  13.10.1. Financial Overview  13.10.2. Products Offered  13.10.3. Key Developments  13.10.4. SWOT Analysis  13.10.5. Key Strategies  13.11. Knutsen NYK Offshore Tankers  13.11.1. Financial Overview  13.11.2. Products Offered  13.11.3. Key Developments  13.11.4. SWOT Analysis  13.11.5. Key Strategies  13.12. JGC Holdings  13.12.1. Financial Overview  13.12.2. Products Offered  13.12.3. Key Developments  13.12.4. SWOT Analysis  13.12.5. Key Strategies  13.13. Exmar  13.13.1. Financial Overview  13.13.2. Products Offered  13.13.3. Key Developments  13.13.4. SWOT Analysis  13.13.5. Key Strategies  13.14. NYK Lin  13.14.1. Financial Overview  13.14.2. Products Offered  13.14.3. Key Developments  13.14.4. SWOT Analysis  13.14.5. Key Strategies  13.15. Hoegh LNG  13.15.1. Financial Overview  13.15.2. Products Offered  13.15.3. Key Developments  13.15.4. SWOT Analysis  13.15.5. Key Strategies  14. APPENDIX  14.1. References  14.2. Related Reports  LIST OF TABLES   TABLE 1. LIST OF ASSUMPTIONS  TABLE 2. NORTH AMERICA LNG FILLING STATION MARKET SIZE ESTIMATES & FORECAST, BY APPLICATION, 2019-2032 (USD BILLIONS)  TABLE 3. NORTH AMERICA LNG FILLING STATION MARKET SIZE ESTIMATES & FORECAST, BY TECHNOLOGY, 2019-2032 (USD BILLIONS)  TABLE 4. NORTH AMERICA LNG FILLING STATION MARKET SIZE ESTIMATES & FORECAST, BY TANK CAPACITY, 2019-2032 (USD BILLIONS)  TABLE 5. NORTH AMERICA LNG FILLING STATION MARKET SIZE ESTIMATES & FORECAST, BY END USER, 2019-2032 (USD BILLIONS)  TABLE 6. NORTH AMERICA LNG FILLING STATION MARKET SIZE ESTIMATES & FORECAST, BY FUELING MODE, 2019-2032 (USD BILLIONS)  TABLE 7. NORTH AMERICA LNG FILLING STATION MARKET SIZE ESTIMATES & FORECAST, BY REGIONAL, 2019-2032 (USD BILLIONS)  TABLE 8. US LNG FILLING STATION MARKET SIZE ESTIMATES & FORECAST, BY APPLICATION, 2019-2032 (USD BILLIONS)  TABLE 9. US LNG FILLING STATION MARKET SIZE ESTIMATES & FORECAST, BY TECHNOLOGY, 2019-2032 (USD BILLIONS)  TABLE 10. US LNG FILLING STATION MARKET SIZE ESTIMATES & FORECAST, BY TANK CAPACITY, 2019-2032 (USD BILLIONS)  TABLE 11. US LNG FILLING STATION MARKET SIZE ESTIMATES & FORECAST, BY END USER, 2019-2032 (USD BILLIONS)  TABLE 12. US LNG FILLING STATION MARKET SIZE ESTIMATES & FORECAST, BY FUELING MODE, 2019-2032 (USD BILLIONS)  TABLE 13. US LNG FILLING STATION MARKET SIZE ESTIMATES & FORECAST, BY REGIONAL, 2019-2032 (USD BILLIONS)  TABLE 14. CANADA LNG FILLING STATION MARKET SIZE ESTIMATES & FORECAST, BY APPLICATION, 2019-2032 (USD BILLIONS)  TABLE 15. CANADA LNG FILLING STATION MARKET SIZE ESTIMATES & FORECAST, BY TECHNOLOGY, 2019-2032 (USD BILLIONS)  TABLE 16. CANADA LNG FILLING STATION MARKET SIZE ESTIMATES & FORECAST, BY TANK CAPACITY, 2019-2032 (USD BILLIONS)  TABLE 17. CANADA LNG FILLING STATION MARKET SIZE ESTIMATES & FORECAST, BY END USER, 2019-2032 (USD BILLIONS)  TABLE 18. CANADA LNG FILLING STATION MARKET SIZE ESTIMATES & FORECAST, BY FUELING MODE, 2019-2032 (USD BILLIONS)  TABLE 19. CANADA LNG FILLING STATION MARKET SIZE ESTIMATES & FORECAST, BY REGIONAL, 2019-2032 (USD BILLIONS)  TABLE 20. EUROPE LNG FILLING STATION MARKET SIZE ESTIMATES & FORECAST, BY APPLICATION, 2019-2032 (USD BILLIONS)  TABLE 21. EUROPE LNG FILLING STATION MARKET SIZE ESTIMATES & FORECAST, BY TECHNOLOGY, 2019-2032 (USD BILLIONS)  TABLE 22. EUROPE LNG FILLING STATION MARKET SIZE ESTIMATES & FORECAST, BY TANK CAPACITY, 2019-2032 (USD BILLIONS)  TABLE 23. EUROPE LNG FILLING STATION MARKET SIZE ESTIMATES & FORECAST, BY END USER, 2019-2032 (USD BILLIONS)  TABLE 24. EUROPE LNG FILLING STATION MARKET SIZE ESTIMATES & FORECAST, BY FUELING MODE, 2019-2032 (USD BILLIONS)  TABLE 25. EUROPE LNG FILLING STATION MARKET SIZE ESTIMATES & FORECAST, BY REGIONAL, 2019-2032 (USD BILLIONS)  TABLE 26. GERMANY LNG FILLING STATION MARKET SIZE ESTIMATES & FORECAST, BY APPLICATION, 2019-2032 (USD BILLIONS)  TABLE 27. GERMANY LNG FILLING STATION MARKET SIZE ESTIMATES & FORECAST, BY TECHNOLOGY, 2019-2032 (USD BILLIONS)  TABLE 28. GERMANY LNG FILLING STATION MARKET SIZE ESTIMATES & FORECAST, BY TANK CAPACITY, 2019-2032 (USD BILLIONS)  TABLE 29. GERMANY LNG FILLING STATION MARKET SIZE ESTIMATES & FORECAST, BY END USER, 2019-2032 (USD BILLIONS)  TABLE 30. GERMANY LNG FILLING STATION MARKET SIZE ESTIMATES & FORECAST, BY FUELING MODE, 2019-2032 (USD BILLIONS)  TABLE 31. GERMANY LNG FILLING STATION MARKET SIZE ESTIMATES & FORECAST, BY REGIONAL, 2019-2032 (USD BILLIONS)  TABLE 32. UK LNG FILLING STATION MARKET SIZE ESTIMATES & FORECAST, BY APPLICATION, 2019-2032 (USD BILLIONS)  TABLE 33. UK LNG FILLING STATION MARKET SIZE ESTIMATES & FORECAST, BY TECHNOLOGY, 2019-2032 (USD BILLIONS)  TABLE 34. UK LNG FILLING STATION MARKET SIZE ESTIMATES & FORECAST, BY TANK CAPACITY, 2019-2032 (USD BILLIONS)  TABLE 35. UK LNG FILLING STATION MARKET SIZE ESTIMATES & FORECAST, BY END USER, 2019-2032 (USD BILLIONS)  TABLE 36. UK LNG FILLING STATION MARKET SIZE ESTIMATES & FORECAST, BY FUELING MODE, 2019-2032 (USD BILLIONS)  TABLE 37. UK LNG FILLING STATION MARKET SIZE ESTIMATES & FORECAST, BY REGIONAL, 2019-2032 (USD BILLIONS)  TABLE 38. FRANCE LNG FILLING STATION MARKET SIZE ESTIMATES & FORECAST, BY APPLICATION, 2019-2032 (USD BILLIONS)  TABLE 39. FRANCE LNG FILLING STATION MARKET SIZE ESTIMATES & FORECAST, BY TECHNOLOGY, 2019-2032 (USD BILLIONS)  TABLE 40. FRANCE LNG FILLING STATION MARKET SIZE ESTIMATES & FORECAST, BY TANK CAPACITY, 2019-2032 (USD BILLIONS)  TABLE 41. FRANCE LNG FILLING STATION MARKET SIZE ESTIMATES & FORECAST, BY END USER, 2019-2032 (USD BILLIONS)  TABLE 42. FRANCE LNG FILLING STATION MARKET SIZE ESTIMATES & FORECAST, BY FUELING MODE, 2019-2032 (USD BILLIONS)  TABLE 43. FRANCE LNG FILLING STATION MARKET SIZE ESTIMATES & FORECAST, BY REGIONAL, 2019-2032 (USD BILLIONS)  TABLE 44. RUSSIA LNG FILLING STATION MARKET SIZE ESTIMATES & FORECAST, BY APPLICATION, 2019-2032 (USD BILLIONS)  TABLE 45. RUSSIA LNG FILLING STATION MARKET SIZE ESTIMATES & FORECAST, BY TECHNOLOGY, 2019-2032 (USD BILLIONS)  TABLE 46. RUSSIA LNG FILLING STATION MARKET SIZE ESTIMATES & FORECAST, BY TANK CAPACITY, 2019-2032 (USD BILLIONS)  TABLE 47. RUSSIA LNG FILLING STATION MARKET SIZE ESTIMATES & FORECAST, BY END USER, 2019-2032 (USD BILLIONS)  TABLE 48. RUSSIA LNG FILLING STATION MARKET SIZE ESTIMATES & FORECAST, BY FUELING MODE, 2019-2032 (USD BILLIONS)  TABLE 49. RUSSIA LNG FILLING STATION MARKET SIZE ESTIMATES & FORECAST, BY REGIONAL, 2019-2032 (USD BILLIONS)  TABLE 50. ITALY LNG FILLING STATION MARKET SIZE ESTIMATES & FORECAST, BY APPLICATION, 2019-2032 (USD BILLIONS)  TABLE 51. ITALY LNG FILLING STATION MARKET SIZE ESTIMATES & FORECAST, BY TECHNOLOGY, 2019-2032 (USD BILLIONS)  TABLE 52. ITALY LNG FILLING STATION MARKET SIZE ESTIMATES & FORECAST, BY TANK CAPACITY, 2019-2032 (USD BILLIONS)  TABLE 53. ITALY LNG FILLING STATION MARKET SIZE ESTIMATES & FORECAST, BY END USER, 2019-2032 (USD BILLIONS)  TABLE 54. ITALY LNG FILLING STATION MARKET SIZE ESTIMATES & FORECAST, BY FUELING MODE, 2019-2032 (USD BILLIONS)  TABLE 55. ITALY LNG FILLING STATION MARKET SIZE ESTIMATES & FORECAST, BY REGIONAL, 2019-2032 (USD BILLIONS)  TABLE 56. SPAIN LNG FILLING STATION MARKET SIZE ESTIMATES & FORECAST, BY APPLICATION, 2019-2032 (USD BILLIONS)  TABLE 57. SPAIN LNG FILLING STATION MARKET SIZE ESTIMATES & FORECAST, BY TECHNOLOGY, 2019-2032 (USD BILLIONS)  TABLE 58. SPAIN LNG FILLING STATION MARKET SIZE ESTIMATES & FORECAST, BY TANK CAPACITY, 2019-2032 (USD BILLIONS)  TABLE 59. SPAIN LNG FILLING STATION MARKET SIZE ESTIMATES & FORECAST, BY END USER, 2019-2032 (USD BILLIONS)  TABLE 60. SPAIN LNG FILLING STATION MARKET SIZE ESTIMATES & FORECAST, BY FUELING MODE, 2019-2032 (USD BILLIONS)  TABLE 61. SPAIN LNG FILLING STATION MARKET SIZE ESTIMATES & FORECAST, BY REGIONAL, 2019-2032 (USD BILLIONS)  TABLE 62. REST OF EUROPE LNG FILLING STATION MARKET SIZE ESTIMATES & FORECAST, BY APPLICATION, 2019-2032 (USD BILLIONS)  TABLE 63. REST OF EUROPE LNG FILLING STATION MARKET SIZE ESTIMATES & FORECAST, BY TECHNOLOGY, 2019-2032 (USD BILLIONS)  TABLE 64. REST OF EUROPE LNG FILLING STATION MARKET SIZE ESTIMATES & FORECAST, BY TANK CAPACITY, 2019-2032 (USD BILLIONS)  TABLE 65. REST OF EUROPE LNG FILLING STATION MARKET SIZE ESTIMATES & FORECAST, BY END USER, 2019-2032 (USD BILLIONS)  TABLE 66. REST OF EUROPE LNG FILLING STATION MARKET SIZE ESTIMATES & FORECAST, BY FUELING MODE, 2019-2032 (USD BILLIONS)  TABLE 67. REST OF EUROPE LNG FILLING STATION MARKET SIZE ESTIMATES & FORECAST, BY REGIONAL, 2019-2032 (USD BILLIONS)  TABLE 68. APAC LNG FILLING STATION MARKET SIZE ESTIMATES & FORECAST, BY APPLICATION, 2019-2032 (USD BILLIONS)  TABLE 69. APAC LNG FILLING STATION MARKET SIZE ESTIMATES & FORECAST, BY TECHNOLOGY, 2019-2032 (USD BILLIONS)  TABLE 70. APAC LNG FILLING STATION MARKET SIZE ESTIMATES & FORECAST, BY TANK CAPACITY, 2019-2032 (USD BILLIONS)  TABLE 71. APAC LNG FILLING STATION MARKET SIZE ESTIMATES & FORECAST, BY END USER, 2019-2032 (USD BILLIONS)  TABLE 72. APAC LNG FILLING STATION MARKET SIZE ESTIMATES & FORECAST, BY FUELING MODE, 2019-2032 (USD BILLIONS)  TABLE 73. APAC LNG FILLING STATION MARKET SIZE ESTIMATES & FORECAST, BY REGIONAL, 2019-2032 (USD BILLIONS)  TABLE 74. CHINA LNG FILLING STATION MARKET SIZE ESTIMATES & FORECAST, BY APPLICATION, 2019-2032 (USD BILLIONS)  TABLE 75. CHINA LNG FILLING STATION MARKET SIZE ESTIMATES & FORECAST, BY TECHNOLOGY, 2019-2032 (USD BILLIONS)  TABLE 76. CHINA LNG FILLING STATION MARKET SIZE ESTIMATES & FORECAST, BY TANK CAPACITY, 2019-2032 (USD BILLIONS)  TABLE 77. CHINA LNG FILLING STATION MARKET SIZE ESTIMATES & FORECAST, BY END USER, 2019-2032 (USD BILLIONS)  TABLE 78. CHINA LNG FILLING STATION MARKET SIZE ESTIMATES & FORECAST, BY FUELING MODE, 2019-2032 (USD BILLIONS)  TABLE 79. CHINA LNG FILLING STATION MARKET SIZE ESTIMATES & FORECAST, BY REGIONAL, 2019-2032 (USD BILLIONS)  TABLE 80. INDIA LNG FILLING STATION MARKET SIZE ESTIMATES & FORECAST, BY APPLICATION, 2019-2032 (USD BILLIONS)  TABLE 81. INDIA LNG FILLING STATION MARKET SIZE ESTIMATES & FORECAST, BY TECHNOLOGY, 2019-2032 (USD BILLIONS)  TABLE 82. INDIA LNG FILLING STATION MARKET SIZE ESTIMATES & FORECAST, BY TANK CAPACITY, 2019-2032 (USD BILLIONS)  TABLE 83. INDIA LNG FILLING STATION MARKET SIZE ESTIMATES & FORECAST, BY END USER, 2019-2032 (USD BILLIONS)  TABLE 84. INDIA LNG FILLING STATION MARKET SIZE ESTIMATES & FORECAST, BY FUELING MODE, 2019-2032 (USD BILLIONS)  TABLE 85. INDIA LNG FILLING STATION MARKET SIZE ESTIMATES & FORECAST, BY REGIONAL, 2019-2032 (USD BILLIONS)  TABLE 86. JAPAN LNG FILLING STATION MARKET SIZE ESTIMATES & FORECAST, BY APPLICATION, 2019-2032 (USD BILLIONS)  TABLE 87. JAPAN LNG FILLING STATION MARKET SIZE ESTIMATES & FORECAST, BY TECHNOLOGY, 2019-2032 (USD BILLIONS)  TABLE 88. JAPAN LNG FILLING STATION MARKET SIZE ESTIMATES & FORECAST, BY TANK CAPACITY, 2019-2032 (USD BILLIONS)  TABLE 89. JAPAN LNG FILLING STATION MARKET SIZE ESTIMATES & FORECAST, BY END USER, 2019-2032 (USD BILLIONS)  TABLE 90. JAPAN LNG FILLING STATION MARKET SIZE ESTIMATES & FORECAST, BY FUELING MODE, 2019-2032 (USD BILLIONS)  TABLE 91. JAPAN LNG FILLING STATION MARKET SIZE ESTIMATES & FORECAST, BY REGIONAL, 2019-2032 (USD BILLIONS)  TABLE 92. SOUTH KOREA LNG FILLING STATION MARKET SIZE ESTIMATES & FORECAST, BY APPLICATION, 2019-2032 (USD BILLIONS)  TABLE 93. SOUTH KOREA LNG FILLING STATION MARKET SIZE ESTIMATES & FORECAST, BY TECHNOLOGY, 2019-2032 (USD BILLIONS)  TABLE 94. SOUTH KOREA LNG FILLING STATION MARKET SIZE ESTIMATES & FORECAST, BY TANK CAPACITY, 2019-2032 (USD BILLIONS)  TABLE 95. SOUTH KOREA LNG FILLING STATION MARKET SIZE ESTIMATES & FORECAST, BY END USER, 2019-2032 (USD BILLIONS)  TABLE 96. SOUTH KOREA LNG FILLING STATION MARKET SIZE ESTIMATES & FORECAST, BY FUELING MODE, 2019-2032 (USD BILLIONS)  TABLE 97. SOUTH KOREA LNG FILLING STATION MARKET SIZE ESTIMATES & FORECAST, BY REGIONAL, 2019-2032 (USD BILLIONS)  TABLE 98. MALAYSIA LNG FILLING STATION MARKET SIZE ESTIMATES & FORECAST, BY APPLICATION, 2019-2032 (USD BILLIONS)  TABLE 99. MALAYSIA LNG FILLING STATION MARKET SIZE ESTIMATES & FORECAST, BY TECHNOLOGY, 2019-2032 (USD BILLIONS)  TABLE 100. MALAYSIA LNG FILLING STATION MARKET SIZE ESTIMATES & FORECAST, BY TANK CAPACITY, 2019-2032 (USD BILLIONS)  TABLE 101. MALAYSIA LNG FILLING STATION MARKET SIZE ESTIMATES & FORECAST, BY END USER, 2019-2032 (USD BILLIONS)  TABLE 102. MALAYSIA LNG FILLING STATION MARKET SIZE ESTIMATES & FORECAST, BY FUELING MODE, 2019-2032 (USD BILLIONS)  TABLE 103. MALAYSIA LNG FILLING STATION MARKET SIZE ESTIMATES & FORECAST, BY REGIONAL, 2019-2032 (USD BILLIONS)  TABLE 104. THAILAND LNG FILLING STATION MARKET SIZE ESTIMATES & FORECAST, BY APPLICATION, 2019-2032 (USD BILLIONS)  TABLE 105. THAILAND LNG FILLING STATION MARKET SIZE ESTIMATES & FORECAST, BY TECHNOLOGY, 2019-2032 (USD BILLIONS)  TABLE 106. THAILAND LNG FILLING STATION MARKET SIZE ESTIMATES & FORECAST, BY TANK CAPACITY, 2019-2032 (USD BILLIONS)  TABLE 107. THAILAND LNG FILLING STATION MARKET SIZE ESTIMATES & FORECAST, BY END USER, 2019-2032 (USD BILLIONS)  TABLE 108. THAILAND LNG FILLING STATION MARKET SIZE ESTIMATES & FORECAST, BY FUELING MODE, 2019-2032 (USD BILLIONS)  TABLE 109. THAILAND LNG FILLING STATION MARKET SIZE ESTIMATES & FORECAST, BY REGIONAL, 2019-2032 (USD BILLIONS)  TABLE 110. INDONESIA LNG FILLING STATION MARKET SIZE ESTIMATES & FORECAST, BY APPLICATION, 2019-2032 (USD BILLIONS)  TABLE 111. INDONESIA LNG FILLING STATION MARKET SIZE ESTIMATES & FORECAST, BY TECHNOLOGY, 2019-2032 (USD BILLIONS)  TABLE 112. INDONESIA LNG FILLING STATION MARKET SIZE ESTIMATES & FORECAST, BY TANK CAPACITY, 2019-2032 (USD BILLIONS)  TABLE 113. INDONESIA LNG FILLING STATION MARKET SIZE ESTIMATES & FORECAST, BY END USER, 2019-2032 (USD BILLIONS)  TABLE 114. INDONESIA LNG FILLING STATION MARKET SIZE ESTIMATES & FORECAST, BY FUELING MODE, 2019-2032 (USD BILLIONS)  TABLE 115. INDONESIA LNG FILLING STATION MARKET SIZE ESTIMATES & FORECAST, BY REGIONAL, 2019-2032 (USD BILLIONS)  TABLE 116. REST OF APAC LNG FILLING STATION MARKET SIZE ESTIMATES & FORECAST, BY APPLICATION, 2019-2032 (USD BILLIONS)  TABLE 117. REST OF APAC LNG FILLING STATION MARKET SIZE ESTIMATES & FORECAST, BY TECHNOLOGY, 2019-2032 (USD BILLIONS)  TABLE 118. REST OF APAC LNG FILLING STATION MARKET SIZE ESTIMATES & FORECAST, BY TANK CAPACITY, 2019-2032 (USD BILLIONS)  TABLE 119. REST OF APAC LNG FILLING STATION MARKET SIZE ESTIMATES & FORECAST, BY END USER, 2019-2032 (USD BILLIONS)  TABLE 120. REST OF APAC LNG FILLING STATION MARKET SIZE ESTIMATES & FORECAST, BY FUELING MODE, 2019-2032 (USD BILLIONS)  TABLE 121. REST OF APAC LNG FILLING STATION MARKET SIZE ESTIMATES & FORECAST, BY REGIONAL, 2019-2032 (USD BILLIONS)  TABLE 122. SOUTH AMERICA LNG FILLING STATION MARKET SIZE ESTIMATES & FORECAST, BY APPLICATION, 2019-2032 (USD BILLIONS)  TABLE 123. SOUTH AMERICA LNG FILLING STATION MARKET SIZE ESTIMATES & FORECAST, BY TECHNOLOGY, 2019-2032 (USD BILLIONS)  TABLE 124. SOUTH AMERICA LNG FILLING STATION MARKET SIZE ESTIMATES & FORECAST, BY TANK CAPACITY, 2019-2032 (USD BILLIONS)  TABLE 125. SOUTH AMERICA LNG FILLING STATION MARKET SIZE ESTIMATES & FORECAST, BY END USER, 2019-2032 (USD BILLIONS)  TABLE 126. SOUTH AMERICA LNG FILLING STATION MARKET SIZE ESTIMATES & FORECAST, BY FUELING MODE, 2019-2032 (USD BILLIONS)  TABLE 127. SOUTH AMERICA LNG FILLING STATION MARKET SIZE ESTIMATES & FORECAST, BY REGIONAL, 2019-2032 (USD BILLIONS)  TABLE 128. BRAZIL LNG FILLING STATION MARKET SIZE ESTIMATES & FORECAST, BY APPLICATION, 2019-2032 (USD BILLIONS)  TABLE 129. BRAZIL LNG FILLING STATION MARKET SIZE ESTIMATES & FORECAST, BY TECHNOLOGY, 2019-2032 (USD BILLIONS)  TABLE 130. BRAZIL LNG FILLING STATION MARKET SIZE ESTIMATES & FORECAST, BY TANK CAPACITY, 2019-2032 (USD BILLIONS)  TABLE 131. BRAZIL LNG FILLING STATION MARKET SIZE ESTIMATES & FORECAST, BY END USER, 2019-2032 (USD BILLIONS)  TABLE 132. BRAZIL LNG FILLING STATION MARKET SIZE ESTIMATES & FORECAST, BY FUELING MODE, 2019-2032 (USD BILLIONS)  TABLE 133. BRAZIL LNG FILLING STATION MARKET SIZE ESTIMATES & FORECAST, BY REGIONAL, 2019-2032 (USD BILLIONS)  TABLE 134. MEXICO LNG FILLING STATION MARKET SIZE ESTIMATES & FORECAST, BY APPLICATION, 2019-2032 (USD BILLIONS)  TABLE 135. MEXICO LNG FILLING STATION MARKET SIZE ESTIMATES & FORECAST, BY TECHNOLOGY, 2019-2032 (USD BILLIONS)  TABLE 136. MEXICO LNG FILLING STATION MARKET SIZE ESTIMATES & FORECAST, BY TANK CAPACITY, 2019-2032 (USD BILLIONS)  TABLE 137. MEXICO LNG FILLING STATION MARKET SIZE ESTIMATES & FORECAST, BY END USER, 2019-2032 (USD BILLIONS)  TABLE 138. MEXICO LNG FILLING STATION MARKET SIZE ESTIMATES & FORECAST, BY FUELING MODE, 2019-2032 (USD BILLIONS)  TABLE 139. MEXICO LNG FILLING STATION MARKET SIZE ESTIMATES & FORECAST, BY REGIONAL, 2019-2032 (USD BILLIONS)  TABLE 140. ARGENTINA LNG FILLING STATION MARKET SIZE ESTIMATES & FORECAST, BY APPLICATION, 2019-2032 (USD BILLIONS)  TABLE 141. ARGENTINA LNG FILLING STATION MARKET SIZE ESTIMATES & FORECAST, BY TECHNOLOGY, 2019-2032 (USD BILLIONS)  TABLE 142. ARGENTINA LNG FILLING STATION MARKET SIZE ESTIMATES & FORECAST, BY TANK CAPACITY, 2019-2032 (USD BILLIONS)  TABLE 143. ARGENTINA LNG FILLING STATION MARKET SIZE ESTIMATES & FORECAST, BY END USER, 2019-2032 (USD BILLIONS)  TABLE 144. ARGENTINA LNG FILLING STATION MARKET SIZE ESTIMATES & FORECAST, BY FUELING MODE, 2019-2032 (USD BILLIONS)  TABLE 145. ARGENTINA LNG FILLING STATION MARKET SIZE ESTIMATES & FORECAST, BY REGIONAL, 2019-2032 (USD BILLIONS)  TABLE 146. REST OF SOUTH AMERICA LNG FILLING STATION MARKET SIZE ESTIMATES & FORECAST, BY APPLICATION, 2019-2032 (USD BILLIONS)  TABLE 147. REST OF SOUTH AMERICA LNG FILLING STATION MARKET SIZE ESTIMATES & FORECAST, BY TECHNOLOGY, 2019-2032 (USD BILLIONS)  TABLE 148. REST OF SOUTH AMERICA LNG FILLING STATION MARKET SIZE ESTIMATES & FORECAST, BY TANK CAPACITY, 2019-2032 (USD BILLIONS)  TABLE 149. REST OF SOUTH AMERICA LNG FILLING STATION MARKET SIZE ESTIMATES & FORECAST, BY END USER, 2019-2032 (USD BILLIONS)  TABLE 150. REST OF SOUTH AMERICA LNG FILLING STATION MARKET SIZE ESTIMATES & FORECAST, BY FUELING MODE, 2019-2032 (USD BILLIONS)  TABLE 151. REST OF SOUTH AMERICA LNG FILLING STATION MARKET SIZE ESTIMATES & FORECAST, BY REGIONAL, 2019-2032 (USD BILLIONS)  TABLE 152. MEA LNG FILLING STATION MARKET SIZE ESTIMATES & FORECAST, BY APPLICATION, 2019-2032 (USD BILLIONS)  TABLE 153. MEA LNG FILLING STATION MARKET SIZE ESTIMATES & FORECAST, BY TECHNOLOGY, 2019-2032 (USD BILLIONS)  TABLE 154. MEA LNG FILLING STATION MARKET SIZE ESTIMATES & FORECAST, BY TANK CAPACITY, 2019-2032 (USD BILLIONS)  TABLE 155. MEA LNG FILLING STATION MARKET SIZE ESTIMATES & FORECAST, BY END USER, 2019-2032 (USD BILLIONS)  TABLE 156. MEA LNG FILLING STATION MARKET SIZE ESTIMATES & FORECAST, BY FUELING MODE, 2019-2032 (USD BILLIONS)  TABLE 157. MEA LNG FILLING STATION MARKET SIZE ESTIMATES & FORECAST, BY REGIONAL, 2019-2032 (USD BILLIONS)  TABLE 158. GCC COUNTRIES LNG FILLING STATION MARKET SIZE ESTIMATES & FORECAST, BY APPLICATION, 2019-2032 (USD BILLIONS)  TABLE 159. GCC COUNTRIES LNG FILLING STATION MARKET SIZE ESTIMATES & FORECAST, BY TECHNOLOGY, 2019-2032 (USD BILLIONS)  TABLE 160. GCC COUNTRIES LNG FILLING STATION MARKET SIZE ESTIMATES & FORECAST, BY TANK CAPACITY, 2019-2032 (USD BILLIONS)  TABLE 161. GCC COUNTRIES LNG FILLING STATION MARKET SIZE ESTIMATES & FORECAST, BY END USER, 2019-2032 (USD BILLIONS)  TABLE 162. GCC COUNTRIES LNG FILLING STATION MARKET SIZE ESTIMATES & FORECAST, BY FUELING MODE, 2019-2032 (USD BILLIONS)  TABLE 163. GCC COUNTRIES LNG FILLING STATION MARKET SIZE ESTIMATES & FORECAST, BY REGIONAL, 2019-2032 (USD BILLIONS)  TABLE 164. SOUTH AFRICA LNG FILLING STATION MARKET SIZE ESTIMATES & FORECAST, BY APPLICATION, 2019-2032 (USD BILLIONS)  TABLE 165. SOUTH AFRICA LNG FILLING STATION MARKET SIZE ESTIMATES & FORECAST, BY TECHNOLOGY, 2019-2032 (USD BILLIONS)  TABLE 166. SOUTH AFRICA LNG FILLING STATION MARKET SIZE ESTIMATES & FORECAST, BY TANK CAPACITY, 2019-2032 (USD BILLIONS)  TABLE 167. SOUTH AFRICA LNG FILLING STATION MARKET SIZE ESTIMATES & FORECAST, BY END USER, 2019-2032 (USD BILLIONS)  TABLE 168. SOUTH AFRICA LNG FILLING STATION MARKET SIZE ESTIMATES & FORECAST, BY FUELING MODE, 2019-2032 (USD BILLIONS)  TABLE 169. SOUTH AFRICA LNG FILLING STATION MARKET SIZE ESTIMATES & FORECAST, BY REGIONAL, 2019-2032 (USD BILLIONS)  TABLE 170. REST OF MEA LNG FILLING STATION MARKET SIZE ESTIMATES & FORECAST, BY APPLICATION, 2019-2032 (USD BILLIONS)  TABLE 171. REST OF MEA LNG FILLING STATION MARKET SIZE ESTIMATES & FORECAST, BY TECHNOLOGY, 2019-2032 (USD BILLIONS)  TABLE 172. REST OF MEA LNG FILLING STATION MARKET SIZE ESTIMATES & FORECAST, BY TANK CAPACITY, 2019-2032 (USD BILLIONS)  TABLE 173. REST OF MEA LNG FILLING STATION MARKET SIZE ESTIMATES & FORECAST, BY END USER, 2019-2032 (USD BILLIONS)  TABLE 174. REST OF MEA LNG FILLING STATION MARKET SIZE ESTIMATES & FORECAST, BY FUELING MODE, 2019-2032 (USD BILLIONS)  TABLE 175. REST OF MEA LNG FILLING STATION MARKET SIZE ESTIMATES & FORECAST, BY REGIONAL, 2019-2032 (USD BILLIONS)  TABLE 176. PRODUCT LAUNCH/PRODUCT DEVELOPMENT/APPROVAL  TABLE 177. ACQUISITION/PARTNERSHIP                                                            LIST OF FIGURES   FIGURE 1. MARKET SYNOPSIS  FIGURE 2. NORTH AMERICA LNG FILLING STATION MARKET ANALYSIS  FIGURE 3. US LNG FILLING STATION MARKET ANALYSIS BY APPLICATION  FIGURE 4. US LNG FILLING STATION MARKET ANALYSIS BY TECHNOLOGY  FIGURE 5. US LNG FILLING STATION MARKET ANALYSIS BY TANK CAPACITY  FIGURE 6. US LNG FILLING STATION MARKET ANALYSIS BY END USER  FIGURE 7. US LNG FILLING STATION MARKET ANALYSIS BY FUELING MODE  FIGURE 8. US LNG FILLING STATION MARKET ANALYSIS BY REGIONAL  FIGURE 9. CANADA LNG FILLING STATION MARKET ANALYSIS BY APPLICATION  FIGURE 10. CANADA LNG FILLING STATION MARKET ANALYSIS BY TECHNOLOGY  FIGURE 11. CANADA LNG FILLING STATION MARKET ANALYSIS BY TANK CAPACITY  FIGURE 12. CANADA LNG FILLING STATION MARKET ANALYSIS BY END USER  FIGURE 13. CANADA LNG FILLING STATION MARKET ANALYSIS BY FUELING MODE  FIGURE 14. CANADA LNG FILLING STATION MARKET ANALYSIS BY REGIONAL  FIGURE 15. EUROPE LNG FILLING STATION MARKET ANALYSIS  FIGURE 16. GERMANY LNG FILLING STATION MARKET ANALYSIS BY APPLICATION  FIGURE 17. GERMANY LNG FILLING STATION MARKET ANALYSIS BY TECHNOLOGY  FIGURE 18. GERMANY LNG FILLING STATION MARKET ANALYSIS BY TANK CAPACITY  FIGURE 19. GERMANY LNG FILLING STATION MARKET ANALYSIS BY END USER  FIGURE 20. GERMANY LNG FILLING STATION MARKET ANALYSIS BY FUELING MODE  FIGURE 21. GERMANY LNG FILLING STATION MARKET ANALYSIS BY REGIONAL  FIGURE 22. UK LNG FILLING STATION MARKET ANALYSIS BY APPLICATION  FIGURE 23. UK LNG FILLING STATION MARKET ANALYSIS BY TECHNOLOGY  FIGURE 24. UK LNG FILLING STATION MARKET ANALYSIS BY TANK CAPACITY  FIGURE 25. UK LNG FILLING STATION MARKET ANALYSIS BY END USER  FIGURE 26. UK LNG FILLING STATION MARKET ANALYSIS BY FUELING MODE  FIGURE 27. UK LNG FILLING STATION MARKET ANALYSIS BY REGIONAL  FIGURE 28. FRANCE LNG FILLING STATION MARKET ANALYSIS BY APPLICATION  FIGURE 29. FRANCE LNG FILLING STATION MARKET ANALYSIS BY TECHNOLOGY  FIGURE 30. FRANCE LNG FILLING STATION MARKET ANALYSIS BY TANK CAPACITY  FIGURE 31. FRANCE LNG FILLING STATION MARKET ANALYSIS BY END USER  FIGURE 32. FRANCE LNG FILLING STATION MARKET ANALYSIS BY FUELING MODE  FIGURE 33. FRANCE LNG FILLING STATION MARKET ANALYSIS BY REGIONAL  FIGURE 34. RUSSIA LNG FILLING STATION MARKET ANALYSIS BY APPLICATION  FIGURE 35. RUSSIA LNG FILLING STATION MARKET ANALYSIS BY TECHNOLOGY  FIGURE 36. RUSSIA LNG FILLING STATION MARKET ANALYSIS BY TANK CAPACITY  FIGURE 37. RUSSIA LNG FILLING STATION MARKET ANALYSIS BY END USER  FIGURE 38. RUSSIA LNG FILLING STATION MARKET ANALYSIS BY FUELING MODE  FIGURE 39. RUSSIA LNG FILLING STATION MARKET ANALYSIS BY REGIONAL  FIGURE 40. ITALY LNG FILLING STATION MARKET ANALYSIS BY APPLICATION  FIGURE 41. ITALY LNG FILLING STATION MARKET ANALYSIS BY TECHNOLOGY  FIGURE 42. ITALY LNG FILLING STATION MARKET ANALYSIS BY TANK CAPACITY  FIGURE 43. ITALY LNG FILLING STATION MARKET ANALYSIS BY END USER  FIGURE 44. ITALY LNG FILLING STATION MARKET ANALYSIS BY FUELING MODE  FIGURE 45. ITALY LNG FILLING STATION MARKET ANALYSIS BY REGIONAL  FIGURE 46. SPAIN LNG FILLING STATION MARKET ANALYSIS BY APPLICATION  FIGURE 47. SPAIN LNG FILLING STATION MARKET ANALYSIS BY TECHNOLOGY  FIGURE 48. SPAIN LNG FILLING STATION MARKET ANALYSIS BY TANK CAPACITY  FIGURE 49. SPAIN LNG FILLING STATION MARKET ANALYSIS BY END USER  FIGURE 50. SPAIN LNG FILLING STATION MARKET ANALYSIS BY FUELING MODE  FIGURE 51. SPAIN LNG FILLING STATION MARKET ANALYSIS BY REGIONAL  FIGURE 52. REST OF EUROPE LNG FILLING STATION MARKET ANALYSIS BY APPLICATION  FIGURE 53. REST OF EUROPE LNG FILLING STATION MARKET ANALYSIS BY TECHNOLOGY  FIGURE 54. REST OF EUROPE LNG FILLING STATION MARKET ANALYSIS BY TANK CAPACITY  FIGURE 55. REST OF EUROPE LNG FILLING STATION MARKET ANALYSIS BY END USER  FIGURE 56. REST OF EUROPE LNG FILLING STATION MARKET ANALYSIS BY FUELING MODE  FIGURE 57. REST OF EUROPE LNG FILLING STATION MARKET ANALYSIS BY REGIONAL  FIGURE 58. APAC LNG FILLING STATION MARKET ANALYSIS  FIGURE 59. CHINA LNG FILLING STATION MARKET ANALYSIS BY APPLICATION  FIGURE 60. CHINA LNG FILLING STATION MARKET ANALYSIS BY TECHNOLOGY  FIGURE 61. CHINA LNG FILLING STATION MARKET ANALYSIS BY TANK CAPACITY  FIGURE 62. CHINA LNG FILLING STATION MARKET ANALYSIS BY END USER  FIGURE 63. CHINA LNG FILLING STATION MARKET ANALYSIS BY FUELING MODE  FIGURE 64. CHINA LNG FILLING STATION MARKET ANALYSIS BY REGIONAL  FIGURE 65. INDIA LNG FILLING STATION MARKET ANALYSIS BY APPLICATION  FIGURE 66. INDIA LNG FILLING STATION MARKET ANALYSIS BY TECHNOLOGY  FIGURE 67. INDIA LNG FILLING STATION MARKET ANALYSIS BY TANK CAPACITY  FIGURE 68. INDIA LNG FILLING STATION MARKET ANALYSIS BY END USER  FIGURE 69. INDIA LNG FILLING STATION MARKET ANALYSIS BY FUELING MODE  FIGURE 70. INDIA LNG FILLING STATION MARKET ANALYSIS BY REGIONAL  FIGURE 71. JAPAN LNG FILLING STATION MARKET ANALYSIS BY APPLICATION  FIGURE 72. JAPAN LNG FILLING STATION MARKET ANALYSIS BY TECHNOLOGY  FIGURE 73. JAPAN LNG FILLING STATION MARKET ANALYSIS BY TANK CAPACITY  FIGURE 74. JAPAN LNG FILLING STATION MARKET ANALYSIS BY END USER  FIGURE 75. JAPAN LNG FILLING STATION MARKET ANALYSIS BY FUELING MODE  FIGURE 76. JAPAN LNG FILLING STATION MARKET ANALYSIS BY REGIONAL  FIGURE 77. SOUTH KOREA LNG FILLING STATION MARKET ANALYSIS BY APPLICATION  FIGURE 78. SOUTH KOREA LNG FILLING STATION MARKET ANALYSIS BY TECHNOLOGY  FIGURE 79. SOUTH KOREA LNG FILLING STATION MARKET ANALYSIS BY TANK CAPACITY  FIGURE 80. SOUTH KOREA LNG FILLING STATION MARKET ANALYSIS BY END USER  FIGURE 81. SOUTH KOREA LNG FILLING STATION MARKET ANALYSIS BY FUELING MODE  FIGURE 82. SOUTH KOREA LNG FILLING STATION MARKET ANALYSIS BY REGIONAL  FIGURE 83. MALAYSIA LNG FILLING STATION MARKET ANALYSIS BY APPLICATION  FIGURE 84. MALAYSIA LNG FILLING STATION MARKET ANALYSIS BY TECHNOLOGY  FIGURE 85. MALAYSIA LNG FILLING STATION MARKET ANALYSIS BY TANK CAPACITY  FIGURE 86. MALAYSIA LNG FILLING STATION MARKET ANALYSIS BY END USER  FIGURE 87. MALAYSIA LNG FILLING STATION MARKET ANALYSIS BY FUELING MODE  FIGURE 88. MALAYSIA LNG FILLING STATION MARKET ANALYSIS BY REGIONAL  FIGURE 89. THAILAND LNG FILLING STATION MARKET ANALYSIS BY APPLICATION  FIGURE 90. THAILAND LNG FILLING STATION MARKET ANALYSIS BY TECHNOLOGY  FIGURE 91. THAILAND LNG FILLING STATION MARKET ANALYSIS BY TANK CAPACITY  FIGURE 92. THAILAND LNG FILLING STATION MARKET ANALYSIS BY END USER  FIGURE 93. THAILAND LNG FILLING STATION MARKET ANALYSIS BY FUELING MODE  FIGURE 94. THAILAND LNG FILLING STATION MARKET ANALYSIS BY REGIONAL  FIGURE 95. INDONESIA LNG FILLING STATION MARKET ANALYSIS BY APPLICATION  FIGURE 96. INDONESIA LNG FILLING STATION MARKET ANALYSIS BY TECHNOLOGY  FIGURE 97. INDONESIA LNG FILLING STATION MARKET ANALYSIS BY TANK CAPACITY  FIGURE 98. INDONESIA LNG FILLING STATION MARKET ANALYSIS BY END USER  FIGURE 99. INDONESIA LNG FILLING STATION MARKET ANALYSIS BY FUELING MODE  FIGURE 100. INDONESIA LNG FILLING STATION MARKET ANALYSIS BY REGIONAL  FIGURE 101. REST OF APAC LNG FILLING STATION MARKET ANALYSIS BY APPLICATION  FIGURE 102. REST OF APAC LNG FILLING STATION MARKET ANALYSIS BY TECHNOLOGY  FIGURE 103. REST OF APAC LNG FILLING STATION MARKET ANALYSIS BY TANK CAPACITY  FIGURE 104. REST OF APAC LNG FILLING STATION MARKET ANALYSIS BY END USER  FIGURE 105. REST OF APAC LNG FILLING STATION MARKET ANALYSIS BY FUELING MODE  FIGURE 106. REST OF APAC LNG FILLING STATION MARKET ANALYSIS BY REGIONAL  FIGURE 107. SOUTH AMERICA LNG FILLING STATION MARKET ANALYSIS  FIGURE 108. BRAZIL LNG FILLING STATION MARKET ANALYSIS BY APPLICATION  FIGURE 109. BRAZIL LNG FILLING STATION MARKET ANALYSIS BY TECHNOLOGY  FIGURE 110. BRAZIL LNG FILLING STATION MARKET ANALYSIS BY TANK CAPACITY  FIGURE 111. BRAZIL LNG FILLING STATION MARKET ANALYSIS BY END USER  FIGURE 112. BRAZIL LNG FILLING STATION MARKET ANALYSIS BY FUELING MODE  FIGURE 113. BRAZIL LNG FILLING STATION MARKET ANALYSIS BY REGIONAL  FIGURE 114. MEXICO LNG FILLING STATION MARKET ANALYSIS BY APPLICATION  FIGURE 115. MEXICO LNG FILLING STATION MARKET ANALYSIS BY TECHNOLOGY  FIGURE 116. MEXICO LNG FILLING STATION MARKET ANALYSIS BY TANK CAPACITY  FIGURE 117. MEXICO LNG FILLING STATION MARKET ANALYSIS BY END USER  FIGURE 118. MEXICO LNG FILLING STATION MARKET ANALYSIS BY FUELING MODE  FIGURE 119. MEXICO LNG FILLING STATION MARKET ANALYSIS BY REGIONAL  FIGURE 120. ARGENTINA LNG FILLING STATION MARKET ANALYSIS BY APPLICATION  FIGURE 121. ARGENTINA LNG FILLING STATION MARKET ANALYSIS BY TECHNOLOGY  FIGURE 122. ARGENTINA LNG FILLING STATION MARKET ANALYSIS BY TANK CAPACITY  FIGURE 123. ARGENTINA LNG FILLING STATION MARKET ANALYSIS BY END USER  FIGURE 124. ARGENTINA LNG FILLING STATION MARKET ANALYSIS BY FUELING MODE  FIGURE 125. ARGENTINA LNG FILLING STATION MARKET ANALYSIS BY REGIONAL  FIGURE 126. REST OF SOUTH AMERICA LNG FILLING STATION MARKET ANALYSIS BY APPLICATION  FIGURE 127. REST OF SOUTH AMERICA LNG FILLING STATION MARKET ANALYSIS BY TECHNOLOGY  FIGURE 128. REST OF SOUTH AMERICA LNG FILLING STATION MARKET ANALYSIS BY TANK CAPACITY  FIGURE 129. REST OF SOUTH AMERICA LNG FILLING STATION MARKET ANALYSIS BY END USER  FIGURE 130. REST OF SOUTH AMERICA LNG FILLING STATION MARKET ANALYSIS BY FUELING MODE  FIGURE 131. REST OF SOUTH AMERICA LNG FILLING STATION MARKET ANALYSIS BY REGIONAL  FIGURE 132. MEA LNG FILLING STATION MARKET ANALYSIS  FIGURE 133. GCC COUNTRIES LNG FILLING STATION MARKET ANALYSIS BY APPLICATION  FIGURE 134. GCC COUNTRIES LNG FILLING STATION MARKET ANALYSIS BY TECHNOLOGY  FIGURE 135. GCC COUNTRIES LNG FILLING STATION MARKET ANALYSIS BY TANK CAPACITY  FIGURE 136. GCC COUNTRIES LNG FILLING STATION MARKET ANALYSIS BY END USER  FIGURE 137. GCC COUNTRIES LNG FILLING STATION MARKET ANALYSIS BY FUELING MODE  FIGURE 138. GCC COUNTRIES LNG FILLING STATION MARKET ANALYSIS BY REGIONAL  FIGURE 139. SOUTH AFRICA LNG FILLING STATION MARKET ANALYSIS BY APPLICATION  FIGURE 140. SOUTH AFRICA LNG FILLING STATION MARKET ANALYSIS BY TECHNOLOGY  FIGURE 141. SOUTH AFRICA LNG FILLING STATION MARKET ANALYSIS BY TANK CAPACITY  FIGURE 142. SOUTH AFRICA LNG FILLING STATION MARKET ANALYSIS BY END USER  FIGURE 143. SOUTH AFRICA LNG FILLING STATION MARKET ANALYSIS BY FUELING MODE  FIGURE 144. SOUTH AFRICA LNG FILLING STATION MARKET ANALYSIS BY REGIONAL  FIGURE 145. REST OF MEA LNG FILLING STATION MARKET ANALYSIS BY APPLICATION  FIGURE 146. REST OF MEA LNG FILLING STATION MARKET ANALYSIS BY TECHNOLOGY  FIGURE 147. REST OF MEA LNG FILLING STATION MARKET ANALYSIS BY TANK CAPACITY  FIGURE 148. REST OF MEA LNG FILLING STATION MARKET ANALYSIS BY END USER  FIGURE 149. REST OF MEA LNG FILLING STATION MARKET ANALYSIS BY FUELING MODE  FIGURE 150. REST OF MEA LNG FILLING STATION MARKET ANALYSIS BY REGIONAL  FIGURE 151. KEY BUYING CRITERIA OF LNG FILLING STATION MARKET  FIGURE 152. RESEARCH PROCESS OF MRFR  FIGURE 153. DRO ANALYSIS OF LNG FILLING STATION MARKET  FIGURE 154. DRIVERS IMPACT ANALYSIS: LNG FILLING STATION MARKET  FIGURE 155. RESTRAINTS IMPACT ANALYSIS: LNG FILLING STATION MARKET  FIGURE 156. SUPPLY / VALUE CHAIN: LNG FILLING STATION MARKET  FIGURE 157. LNG FILLING STATION MARKET, BY APPLICATION, 2024 (% SHARE)  FIGURE 158. LNG FILLING STATION MARKET, BY APPLICATION, 2019 TO 2032 (USD Billions)  FIGURE 159. LNG FILLING STATION MARKET, BY TECHNOLOGY, 2024 (% SHARE)  FIGURE 160. LNG FILLING STATION MARKET, BY TECHNOLOGY, 2019 TO 2032 (USD Billions)  FIGURE 161. LNG FILLING STATION MARKET, BY TANK CAPACITY, 2024 (% SHARE)  FIGURE 162. LNG FILLING STATION MARKET, BY TANK CAPACITY, 2019 TO 2032 (USD Billions)  FIGURE 163. LNG FILLING STATION MARKET, BY END USER, 2024 (% SHARE)  FIGURE 164. LNG FILLING STATION MARKET, BY END USER, 2019 TO 2032 (USD Billions)  FIGURE 165. LNG FILLING STATION MARKET, BY FUELING MODE, 2024 (% SHARE)  FIGURE 166. LNG FILLING STATION MARKET, BY FUELING MODE, 2019 TO 2032 (USD Billions)  FIGURE 167. LNG FILLING STATION MARKET, BY REGIONAL, 2024 (% SHARE)  FIGURE 168. LNG FILLING STATION MARKET, BY REGIONAL, 2019 TO 2032 (USD Billions)  FIGURE 169. BENCHMARKING OF MAJOR COMPETITORS   

    Lng Filling Station Market Segmentation

    • Lng Filling Station Market By Application (USD Billion, 2019-2032)

      • Heavy-Duty Vehicles
      • Light-Duty Vehicles
      • Marine Vessels
      • Industrial
    • Lng Filling Station Market By Technology (USD Billion, 2019-2032)

      • Liquefaction Process
      • Storage Capacity
      • Dispensing Infrastructure
    • Lng Filling Station Market By Tank Capacity (USD Billion, 2019-2032)

      • Small-Scale (Under 10,000 Gallons)
      • Mid-Scale (10,000-100,000 Gallons)
      • Large-Scale (Over 100,000 Gallons)
    • Lng Filling Station Market By End User (USD Billion, 2019-2032)

      • Transportation Industry
      • Logistics and Supply Chain
      • Construction Sector
      • Energy Sector
    • Lng Filling Station Market By Fueling Mode (USD Billion, 2019-2032)

      • Fast-Fill Stations
      • Slow-Fill Stations
    • Lng Filling Station Market By Regional (USD Billion, 2019-2032)

      • North America
      • Europe
      • South America
      • Asia Pacific
      • Middle East and Africa

    Lng Filling Station Market Regional Outlook (USD Billion, 2019-2032)

    • North America Outlook (USD Billion, 2019-2032)

      • North America Lng Filling Station Market by Application Type

        • Heavy-Duty Vehicles
        • Light-Duty Vehicles
        • Marine Vessels
        • Industrial
      • North America Lng Filling Station Market by Technology Type

        • Liquefaction Process
        • Storage Capacity
        • Dispensing Infrastructure
      • North America Lng Filling Station Market by Tank Capacity Type

        • Small-Scale (Under 10,000 Gallons)
        • Mid-Scale (10,000-100,000 Gallons)
        • Large-Scale (Over 100,000 Gallons)
      • North America Lng Filling Station Market by End User Type

        • Transportation Industry
        • Logistics and Supply Chain
        • Construction Sector
        • Energy Sector
      • North America Lng Filling Station Market by Fueling Mode Type

        • Fast-Fill Stations
        • Slow-Fill Stations
      • North America Lng Filling Station Market by Regional Type

        • US
        • Canada
      • US Outlook (USD Billion, 2019-2032)
      • US Lng Filling Station Market by Application Type

        • Heavy-Duty Vehicles
        • Light-Duty Vehicles
        • Marine Vessels
        • Industrial
      • US Lng Filling Station Market by Technology Type

        • Liquefaction Process
        • Storage Capacity
        • Dispensing Infrastructure
      • US Lng Filling Station Market by Tank Capacity Type

        • Small-Scale (Under 10,000 Gallons)
        • Mid-Scale (10,000-100,000 Gallons)
        • Large-Scale (Over 100,000 Gallons)
      • US Lng Filling Station Market by End User Type

        • Transportation Industry
        • Logistics and Supply Chain
        • Construction Sector
        • Energy Sector
      • US Lng Filling Station Market by Fueling Mode Type

        • Fast-Fill Stations
        • Slow-Fill Stations
      • CANADA Outlook (USD Billion, 2019-2032)
      • CANADA Lng Filling Station Market by Application Type

        • Heavy-Duty Vehicles
        • Light-Duty Vehicles
        • Marine Vessels
        • Industrial
      • CANADA Lng Filling Station Market by Technology Type

        • Liquefaction Process
        • Storage Capacity
        • Dispensing Infrastructure
      • CANADA Lng Filling Station Market by Tank Capacity Type

        • Small-Scale (Under 10,000 Gallons)
        • Mid-Scale (10,000-100,000 Gallons)
        • Large-Scale (Over 100,000 Gallons)
      • CANADA Lng Filling Station Market by End User Type

        • Transportation Industry
        • Logistics and Supply Chain
        • Construction Sector
        • Energy Sector
      • CANADA Lng Filling Station Market by Fueling Mode Type

        • Fast-Fill Stations
        • Slow-Fill Stations
    • Europe Outlook (USD Billion, 2019-2032)

      • Europe Lng Filling Station Market by Application Type

        • Heavy-Duty Vehicles
        • Light-Duty Vehicles
        • Marine Vessels
        • Industrial
      • Europe Lng Filling Station Market by Technology Type

        • Liquefaction Process
        • Storage Capacity
        • Dispensing Infrastructure
      • Europe Lng Filling Station Market by Tank Capacity Type

        • Small-Scale (Under 10,000 Gallons)
        • Mid-Scale (10,000-100,000 Gallons)
        • Large-Scale (Over 100,000 Gallons)
      • Europe Lng Filling Station Market by End User Type

        • Transportation Industry
        • Logistics and Supply Chain
        • Construction Sector
        • Energy Sector
      • Europe Lng Filling Station Market by Fueling Mode Type

        • Fast-Fill Stations
        • Slow-Fill Stations
      • Europe Lng Filling Station Market by Regional Type

        • Germany
        • UK
        • France
        • Russia
        • Italy
        • Spain
        • Rest of Europe
      • GERMANY Outlook (USD Billion, 2019-2032)
      • GERMANY Lng Filling Station Market by Application Type

        • Heavy-Duty Vehicles
        • Light-Duty Vehicles
        • Marine Vessels
        • Industrial
      • GERMANY Lng Filling Station Market by Technology Type

        • Liquefaction Process
        • Storage Capacity
        • Dispensing Infrastructure
      • GERMANY Lng Filling Station Market by Tank Capacity Type

        • Small-Scale (Under 10,000 Gallons)
        • Mid-Scale (10,000-100,000 Gallons)
        • Large-Scale (Over 100,000 Gallons)
      • GERMANY Lng Filling Station Market by End User Type

        • Transportation Industry
        • Logistics and Supply Chain
        • Construction Sector
        • Energy Sector
      • GERMANY Lng Filling Station Market by Fueling Mode Type

        • Fast-Fill Stations
        • Slow-Fill Stations
      • UK Outlook (USD Billion, 2019-2032)
      • UK Lng Filling Station Market by Application Type

        • Heavy-Duty Vehicles
        • Light-Duty Vehicles
        • Marine Vessels
        • Industrial
      • UK Lng Filling Station Market by Technology Type

        • Liquefaction Process
        • Storage Capacity
        • Dispensing Infrastructure
      • UK Lng Filling Station Market by Tank Capacity Type

        • Small-Scale (Under 10,000 Gallons)
        • Mid-Scale (10,000-100,000 Gallons)
        • Large-Scale (Over 100,000 Gallons)
      • UK Lng Filling Station Market by End User Type

        • Transportation Industry
        • Logistics and Supply Chain
        • Construction Sector
        • Energy Sector
      • UK Lng Filling Station Market by Fueling Mode Type

        • Fast-Fill Stations
        • Slow-Fill Stations
      • FRANCE Outlook (USD Billion, 2019-2032)
      • FRANCE Lng Filling Station Market by Application Type

        • Heavy-Duty Vehicles
        • Light-Duty Vehicles
        • Marine Vessels
        • Industrial
      • FRANCE Lng Filling Station Market by Technology Type

        • Liquefaction Process
        • Storage Capacity
        • Dispensing Infrastructure
      • FRANCE Lng Filling Station Market by Tank Capacity Type

        • Small-Scale (Under 10,000 Gallons)
        • Mid-Scale (10,000-100,000 Gallons)
        • Large-Scale (Over 100,000 Gallons)
      • FRANCE Lng Filling Station Market by End User Type

        • Transportation Industry
        • Logistics and Supply Chain
        • Construction Sector
        • Energy Sector
      • FRANCE Lng Filling Station Market by Fueling Mode Type

        • Fast-Fill Stations
        • Slow-Fill Stations
      • RUSSIA Outlook (USD Billion, 2019-2032)
      • RUSSIA Lng Filling Station Market by Application Type

        • Heavy-Duty Vehicles
        • Light-Duty Vehicles
        • Marine Vessels
        • Industrial
      • RUSSIA Lng Filling Station Market by Technology Type

        • Liquefaction Process
        • Storage Capacity
        • Dispensing Infrastructure
      • RUSSIA Lng Filling Station Market by Tank Capacity Type

        • Small-Scale (Under 10,000 Gallons)
        • Mid-Scale (10,000-100,000 Gallons)
        • Large-Scale (Over 100,000 Gallons)
      • RUSSIA Lng Filling Station Market by End User Type

        • Transportation Industry
        • Logistics and Supply Chain
        • Construction Sector
        • Energy Sector
      • RUSSIA Lng Filling Station Market by Fueling Mode Type

        • Fast-Fill Stations
        • Slow-Fill Stations
      • ITALY Outlook (USD Billion, 2019-2032)
      • ITALY Lng Filling Station Market by Application Type

        • Heavy-Duty Vehicles
        • Light-Duty Vehicles
        • Marine Vessels
        • Industrial
      • ITALY Lng Filling Station Market by Technology Type

        • Liquefaction Process
        • Storage Capacity
        • Dispensing Infrastructure
      • ITALY Lng Filling Station Market by Tank Capacity Type

        • Small-Scale (Under 10,000 Gallons)
        • Mid-Scale (10,000-100,000 Gallons)
        • Large-Scale (Over 100,000 Gallons)
      • ITALY Lng Filling Station Market by End User Type

        • Transportation Industry
        • Logistics and Supply Chain
        • Construction Sector
        • Energy Sector
      • ITALY Lng Filling Station Market by Fueling Mode Type

        • Fast-Fill Stations
        • Slow-Fill Stations
      • SPAIN Outlook (USD Billion, 2019-2032)
      • SPAIN Lng Filling Station Market by Application Type

        • Heavy-Duty Vehicles
        • Light-Duty Vehicles
        • Marine Vessels
        • Industrial
      • SPAIN Lng Filling Station Market by Technology Type

        • Liquefaction Process
        • Storage Capacity
        • Dispensing Infrastructure
      • SPAIN Lng Filling Station Market by Tank Capacity Type

        • Small-Scale (Under 10,000 Gallons)
        • Mid-Scale (10,000-100,000 Gallons)
        • Large-Scale (Over 100,000 Gallons)
      • SPAIN Lng Filling Station Market by End User Type

        • Transportation Industry
        • Logistics and Supply Chain
        • Construction Sector
        • Energy Sector
      • SPAIN Lng Filling Station Market by Fueling Mode Type

        • Fast-Fill Stations
        • Slow-Fill Stations
      • REST OF EUROPE Outlook (USD Billion, 2019-2032)
      • REST OF EUROPE Lng Filling Station Market by Application Type

        • Heavy-Duty Vehicles
        • Light-Duty Vehicles
        • Marine Vessels
        • Industrial
      • REST OF EUROPE Lng Filling Station Market by Technology Type

        • Liquefaction Process
        • Storage Capacity
        • Dispensing Infrastructure
      • REST OF EUROPE Lng Filling Station Market by Tank Capacity Type

        • Small-Scale (Under 10,000 Gallons)
        • Mid-Scale (10,000-100,000 Gallons)
        • Large-Scale (Over 100,000 Gallons)
      • REST OF EUROPE Lng Filling Station Market by End User Type

        • Transportation Industry
        • Logistics and Supply Chain
        • Construction Sector
        • Energy Sector
      • REST OF EUROPE Lng Filling Station Market by Fueling Mode Type

        • Fast-Fill Stations
        • Slow-Fill Stations
    • APAC Outlook (USD Billion, 2019-2032)

      • APAC Lng Filling Station Market by Application Type

        • Heavy-Duty Vehicles
        • Light-Duty Vehicles
        • Marine Vessels
        • Industrial
      • APAC Lng Filling Station Market by Technology Type

        • Liquefaction Process
        • Storage Capacity
        • Dispensing Infrastructure
      • APAC Lng Filling Station Market by Tank Capacity Type

        • Small-Scale (Under 10,000 Gallons)
        • Mid-Scale (10,000-100,000 Gallons)
        • Large-Scale (Over 100,000 Gallons)
      • APAC Lng Filling Station Market by End User Type

        • Transportation Industry
        • Logistics and Supply Chain
        • Construction Sector
        • Energy Sector
      • APAC Lng Filling Station Market by Fueling Mode Type

        • Fast-Fill Stations
        • Slow-Fill Stations
      • APAC Lng Filling Station Market by Regional Type

        • China
        • India
        • Japan
        • South Korea
        • Malaysia
        • Thailand
        • Indonesia
        • Rest of APAC
      • CHINA Outlook (USD Billion, 2019-2032)
      • CHINA Lng Filling Station Market by Application Type

        • Heavy-Duty Vehicles
        • Light-Duty Vehicles
        • Marine Vessels
        • Industrial
      • CHINA Lng Filling Station Market by Technology Type

        • Liquefaction Process
        • Storage Capacity
        • Dispensing Infrastructure
      • CHINA Lng Filling Station Market by Tank Capacity Type

        • Small-Scale (Under 10,000 Gallons)
        • Mid-Scale (10,000-100,000 Gallons)
        • Large-Scale (Over 100,000 Gallons)
      • CHINA Lng Filling Station Market by End User Type

        • Transportation Industry
        • Logistics and Supply Chain
        • Construction Sector
        • Energy Sector
      • CHINA Lng Filling Station Market by Fueling Mode Type

        • Fast-Fill Stations
        • Slow-Fill Stations
      • INDIA Outlook (USD Billion, 2019-2032)
      • INDIA Lng Filling Station Market by Application Type

        • Heavy-Duty Vehicles
        • Light-Duty Vehicles
        • Marine Vessels
        • Industrial
      • INDIA Lng Filling Station Market by Technology Type

        • Liquefaction Process
        • Storage Capacity
        • Dispensing Infrastructure
      • INDIA Lng Filling Station Market by Tank Capacity Type

        • Small-Scale (Under 10,000 Gallons)
        • Mid-Scale (10,000-100,000 Gallons)
        • Large-Scale (Over 100,000 Gallons)
      • INDIA Lng Filling Station Market by End User Type

        • Transportation Industry
        • Logistics and Supply Chain
        • Construction Sector
        • Energy Sector
      • INDIA Lng Filling Station Market by Fueling Mode Type

        • Fast-Fill Stations
        • Slow-Fill Stations
      • JAPAN Outlook (USD Billion, 2019-2032)
      • JAPAN Lng Filling Station Market by Application Type

        • Heavy-Duty Vehicles
        • Light-Duty Vehicles
        • Marine Vessels
        • Industrial
      • JAPAN Lng Filling Station Market by Technology Type

        • Liquefaction Process
        • Storage Capacity
        • Dispensing Infrastructure
      • JAPAN Lng Filling Station Market by Tank Capacity Type

        • Small-Scale (Under 10,000 Gallons)
        • Mid-Scale (10,000-100,000 Gallons)
        • Large-Scale (Over 100,000 Gallons)
      • JAPAN Lng Filling Station Market by End User Type

        • Transportation Industry
        • Logistics and Supply Chain
        • Construction Sector
        • Energy Sector
      • JAPAN Lng Filling Station Market by Fueling Mode Type

        • Fast-Fill Stations
        • Slow-Fill Stations
      • SOUTH KOREA Outlook (USD Billion, 2019-2032)
      • SOUTH KOREA Lng Filling Station Market by Application Type

        • Heavy-Duty Vehicles
        • Light-Duty Vehicles
        • Marine Vessels
        • Industrial
      • SOUTH KOREA Lng Filling Station Market by Technology Type

        • Liquefaction Process
        • Storage Capacity
        • Dispensing Infrastructure
      • SOUTH KOREA Lng Filling Station Market by Tank Capacity Type

        • Small-Scale (Under 10,000 Gallons)
        • Mid-Scale (10,000-100,000 Gallons)
        • Large-Scale (Over 100,000 Gallons)
      • SOUTH KOREA Lng Filling Station Market by End User Type

        • Transportation Industry
        • Logistics and Supply Chain
        • Construction Sector
        • Energy Sector
      • SOUTH KOREA Lng Filling Station Market by Fueling Mode Type

        • Fast-Fill Stations
        • Slow-Fill Stations
      • MALAYSIA Outlook (USD Billion, 2019-2032)
      • MALAYSIA Lng Filling Station Market by Application Type

        • Heavy-Duty Vehicles
        • Light-Duty Vehicles
        • Marine Vessels
        • Industrial
      • MALAYSIA Lng Filling Station Market by Technology Type

        • Liquefaction Process
        • Storage Capacity
        • Dispensing Infrastructure
      • MALAYSIA Lng Filling Station Market by Tank Capacity Type

        • Small-Scale (Under 10,000 Gallons)
        • Mid-Scale (10,000-100,000 Gallons)
        • Large-Scale (Over 100,000 Gallons)
      • MALAYSIA Lng Filling Station Market by End User Type

        • Transportation Industry
        • Logistics and Supply Chain
        • Construction Sector
        • Energy Sector
      • MALAYSIA Lng Filling Station Market by Fueling Mode Type

        • Fast-Fill Stations
        • Slow-Fill Stations
      • THAILAND Outlook (USD Billion, 2019-2032)
      • THAILAND Lng Filling Station Market by Application Type

        • Heavy-Duty Vehicles
        • Light-Duty Vehicles
        • Marine Vessels
        • Industrial
      • THAILAND Lng Filling Station Market by Technology Type

        • Liquefaction Process
        • Storage Capacity
        • Dispensing Infrastructure
      • THAILAND Lng Filling Station Market by Tank Capacity Type

        • Small-Scale (Under 10,000 Gallons)
        • Mid-Scale (10,000-100,000 Gallons)
        • Large-Scale (Over 100,000 Gallons)
      • THAILAND Lng Filling Station Market by End User Type

        • Transportation Industry
        • Logistics and Supply Chain
        • Construction Sector
        • Energy Sector
      • THAILAND Lng Filling Station Market by Fueling Mode Type

        • Fast-Fill Stations
        • Slow-Fill Stations
      • INDONESIA Outlook (USD Billion, 2019-2032)
      • INDONESIA Lng Filling Station Market by Application Type

        • Heavy-Duty Vehicles
        • Light-Duty Vehicles
        • Marine Vessels
        • Industrial
      • INDONESIA Lng Filling Station Market by Technology Type

        • Liquefaction Process
        • Storage Capacity
        • Dispensing Infrastructure
      • INDONESIA Lng Filling Station Market by Tank Capacity Type

        • Small-Scale (Under 10,000 Gallons)
        • Mid-Scale (10,000-100,000 Gallons)
        • Large-Scale (Over 100,000 Gallons)
      • INDONESIA Lng Filling Station Market by End User Type

        • Transportation Industry
        • Logistics and Supply Chain
        • Construction Sector
        • Energy Sector
      • INDONESIA Lng Filling Station Market by Fueling Mode Type

        • Fast-Fill Stations
        • Slow-Fill Stations
      • REST OF APAC Outlook (USD Billion, 2019-2032)
      • REST OF APAC Lng Filling Station Market by Application Type

        • Heavy-Duty Vehicles
        • Light-Duty Vehicles
        • Marine Vessels
        • Industrial
      • REST OF APAC Lng Filling Station Market by Technology Type

        • Liquefaction Process
        • Storage Capacity
        • Dispensing Infrastructure
      • REST OF APAC Lng Filling Station Market by Tank Capacity Type

        • Small-Scale (Under 10,000 Gallons)
        • Mid-Scale (10,000-100,000 Gallons)
        • Large-Scale (Over 100,000 Gallons)
      • REST OF APAC Lng Filling Station Market by End User Type

        • Transportation Industry
        • Logistics and Supply Chain
        • Construction Sector
        • Energy Sector
      • REST OF APAC Lng Filling Station Market by Fueling Mode Type

        • Fast-Fill Stations
        • Slow-Fill Stations
    • South America Outlook (USD Billion, 2019-2032)

      • South America Lng Filling Station Market by Application Type

        • Heavy-Duty Vehicles
        • Light-Duty Vehicles
        • Marine Vessels
        • Industrial
      • South America Lng Filling Station Market by Technology Type

        • Liquefaction Process
        • Storage Capacity
        • Dispensing Infrastructure
      • South America Lng Filling Station Market by Tank Capacity Type

        • Small-Scale (Under 10,000 Gallons)
        • Mid-Scale (10,000-100,000 Gallons)
        • Large-Scale (Over 100,000 Gallons)
      • South America Lng Filling Station Market by End User Type

        • Transportation Industry
        • Logistics and Supply Chain
        • Construction Sector
        • Energy Sector
      • South America Lng Filling Station Market by Fueling Mode Type

        • Fast-Fill Stations
        • Slow-Fill Stations
      • South America Lng Filling Station Market by Regional Type

        • Brazil
        • Mexico
        • Argentina
        • Rest of South America
      • BRAZIL Outlook (USD Billion, 2019-2032)
      • BRAZIL Lng Filling Station Market by Application Type

        • Heavy-Duty Vehicles
        • Light-Duty Vehicles
        • Marine Vessels
        • Industrial
      • BRAZIL Lng Filling Station Market by Technology Type

        • Liquefaction Process
        • Storage Capacity
        • Dispensing Infrastructure
      • BRAZIL Lng Filling Station Market by Tank Capacity Type

        • Small-Scale (Under 10,000 Gallons)
        • Mid-Scale (10,000-100,000 Gallons)
        • Large-Scale (Over 100,000 Gallons)
      • BRAZIL Lng Filling Station Market by End User Type

        • Transportation Industry
        • Logistics and Supply Chain
        • Construction Sector
        • Energy Sector
      • BRAZIL Lng Filling Station Market by Fueling Mode Type

        • Fast-Fill Stations
        • Slow-Fill Stations
      • MEXICO Outlook (USD Billion, 2019-2032)
      • MEXICO Lng Filling Station Market by Application Type

        • Heavy-Duty Vehicles
        • Light-Duty Vehicles
        • Marine Vessels
        • Industrial
      • MEXICO Lng Filling Station Market by Technology Type

        • Liquefaction Process
        • Storage Capacity
        • Dispensing Infrastructure
      • MEXICO Lng Filling Station Market by Tank Capacity Type

        • Small-Scale (Under 10,000 Gallons)
        • Mid-Scale (10,000-100,000 Gallons)
        • Large-Scale (Over 100,000 Gallons)
      • MEXICO Lng Filling Station Market by End User Type

        • Transportation Industry
        • Logistics and Supply Chain
        • Construction Sector
        • Energy Sector
      • MEXICO Lng Filling Station Market by Fueling Mode Type

        • Fast-Fill Stations
        • Slow-Fill Stations
      • ARGENTINA Outlook (USD Billion, 2019-2032)
      • ARGENTINA Lng Filling Station Market by Application Type

        • Heavy-Duty Vehicles
        • Light-Duty Vehicles
        • Marine Vessels
        • Industrial
      • ARGENTINA Lng Filling Station Market by Technology Type

        • Liquefaction Process
        • Storage Capacity
        • Dispensing Infrastructure
      • ARGENTINA Lng Filling Station Market by Tank Capacity Type

        • Small-Scale (Under 10,000 Gallons)
        • Mid-Scale (10,000-100,000 Gallons)
        • Large-Scale (Over 100,000 Gallons)
      • ARGENTINA Lng Filling Station Market by End User Type

        • Transportation Industry
        • Logistics and Supply Chain
        • Construction Sector
        • Energy Sector
      • ARGENTINA Lng Filling Station Market by Fueling Mode Type

        • Fast-Fill Stations
        • Slow-Fill Stations
      • REST OF SOUTH AMERICA Outlook (USD Billion, 2019-2032)
      • REST OF SOUTH AMERICA Lng Filling Station Market by Application Type

        • Heavy-Duty Vehicles
        • Light-Duty Vehicles
        • Marine Vessels
        • Industrial
      • REST OF SOUTH AMERICA Lng Filling Station Market by Technology Type

        • Liquefaction Process
        • Storage Capacity
        • Dispensing Infrastructure
      • REST OF SOUTH AMERICA Lng Filling Station Market by Tank Capacity Type

        • Small-Scale (Under 10,000 Gallons)
        • Mid-Scale (10,000-100,000 Gallons)
        • Large-Scale (Over 100,000 Gallons)
      • REST OF SOUTH AMERICA Lng Filling Station Market by End User Type

        • Transportation Industry
        • Logistics and Supply Chain
        • Construction Sector
        • Energy Sector
      • REST OF SOUTH AMERICA Lng Filling Station Market by Fueling Mode Type

        • Fast-Fill Stations
        • Slow-Fill Stations
    • MEA Outlook (USD Billion, 2019-2032)

      • MEA Lng Filling Station Market by Application Type

        • Heavy-Duty Vehicles
        • Light-Duty Vehicles
        • Marine Vessels
        • Industrial
      • MEA Lng Filling Station Market by Technology Type

        • Liquefaction Process
        • Storage Capacity
        • Dispensing Infrastructure
      • MEA Lng Filling Station Market by Tank Capacity Type

        • Small-Scale (Under 10,000 Gallons)
        • Mid-Scale (10,000-100,000 Gallons)
        • Large-Scale (Over 100,000 Gallons)
      • MEA Lng Filling Station Market by End User Type

        • Transportation Industry
        • Logistics and Supply Chain
        • Construction Sector
        • Energy Sector
      • MEA Lng Filling Station Market by Fueling Mode Type

        • Fast-Fill Stations
        • Slow-Fill Stations
      • MEA Lng Filling Station Market by Regional Type

        • GCC Countries
        • South Africa
        • Rest of MEA
      • GCC COUNTRIES Outlook (USD Billion, 2019-2032)
      • GCC COUNTRIES Lng Filling Station Market by Application Type

        • Heavy-Duty Vehicles
        • Light-Duty Vehicles
        • Marine Vessels
        • Industrial
      • GCC COUNTRIES Lng Filling Station Market by Technology Type

        • Liquefaction Process
        • Storage Capacity
        • Dispensing Infrastructure
      • GCC COUNTRIES Lng Filling Station Market by Tank Capacity Type

        • Small-Scale (Under 10,000 Gallons)
        • Mid-Scale (10,000-100,000 Gallons)
        • Large-Scale (Over 100,000 Gallons)
      • GCC COUNTRIES Lng Filling Station Market by End User Type

        • Transportation Industry
        • Logistics and Supply Chain
        • Construction Sector
        • Energy Sector
      • GCC COUNTRIES Lng Filling Station Market by Fueling Mode Type

        • Fast-Fill Stations
        • Slow-Fill Stations
      • SOUTH AFRICA Outlook (USD Billion, 2019-2032)
      • SOUTH AFRICA Lng Filling Station Market by Application Type

        • Heavy-Duty Vehicles
        • Light-Duty Vehicles
        • Marine Vessels
        • Industrial
      • SOUTH AFRICA Lng Filling Station Market by Technology Type

        • Liquefaction Process
        • Storage Capacity
        • Dispensing Infrastructure
      • SOUTH AFRICA Lng Filling Station Market by Tank Capacity Type

        • Small-Scale (Under 10,000 Gallons)
        • Mid-Scale (10,000-100,000 Gallons)
        • Large-Scale (Over 100,000 Gallons)
      • SOUTH AFRICA Lng Filling Station Market by End User Type

        • Transportation Industry
        • Logistics and Supply Chain
        • Construction Sector
        • Energy Sector
      • SOUTH AFRICA Lng Filling Station Market by Fueling Mode Type

        • Fast-Fill Stations
        • Slow-Fill Stations
      • REST OF MEA Outlook (USD Billion, 2019-2032)
      • REST OF MEA Lng Filling Station Market by Application Type

        • Heavy-Duty Vehicles
        • Light-Duty Vehicles
        • Marine Vessels
        • Industrial
      • REST OF MEA Lng Filling Station Market by Technology Type

        • Liquefaction Process
        • Storage Capacity
        • Dispensing Infrastructure
      • REST OF MEA Lng Filling Station Market by Tank Capacity Type

        • Small-Scale (Under 10,000 Gallons)
        • Mid-Scale (10,000-100,000 Gallons)
        • Large-Scale (Over 100,000 Gallons)
      • REST OF MEA Lng Filling Station Market by End User Type

        • Transportation Industry
        • Logistics and Supply Chain
        • Construction Sector
        • Energy Sector
      • REST OF MEA Lng Filling Station Market by Fueling Mode Type

        • Fast-Fill Stations
        • Slow-Fill Stations
    Report Infographic

    Free Sample Request

    Kindly complete the form below to receive a free sample of this Report

    Customer Strories

    “I am very pleased with how market segments have been defined in a relevant way for my purposes (such as "Portable Freezers & refrigerators" and "last-mile"). In general the report is well structured. Thanks very much for your efforts.”

    Victoria Milne

    Founder
    Case Study

    Chemicals and Materials