• Cat-intel
  • MedIntelliX
  • Resources
  • About Us
  • Hero Background
    English
    Chinese
    French
    Japanese
    Korean
    German
    Spanish

    Liquid Polybutadiene Market Share

    ID: MRFR/CnM/2682-CR
    123 Pages
    Priya Nagrale
    October 2017

    Liquid Polybutadiene Market Research Report Information by Application (Tire Manufacturing, Industrial Rubber, Polymer Modification, Protective Films, Chemicals, Coatings, Adhesives & Sealants, and Others), by End Use (Transportation, Construction, Industrial, and Others) and by Region (Asia Pacific, Europe, North America, Latin America, and Middle East & Africa) - Forecast till 2035

    Share:
    Download PDF ×

    We do not share your information with anyone. However, we may send you emails based on your report interest from time to time. You may contact us at any time to opt-out.

    Liquid Polybutadiene Market Infographic
    $ 4,950.0
    $ 5,950.0
    $ 7,250.0

    Market Share

    Liquid Polybutadiene Market Share Analysis

    Market share positioning strategies play a crucial role in the competitive landscape of the Liquid Polybutadiene Market. This specialized market, known for its versatile applications ranging from adhesives, sealants, and coatings, requires strategic approaches in order to achieve a significant presence within it. Product differentiation is commonly used by major players operating in this segment while developing pricing strategies that help build up brand name or increase loyalty among customers; however, a cost-based pricing model can be implemented across different markets, resulting in a larger customer base being targeted through offering cost-effective solutions without compromising quality at that specific period depending on demand levels; alternatively premium prices could be charged for higher quality Liquid Polybutadiene varieties especially those desired by first time buyers who prefer top-tier products instead; striking appropriate balance between price affordable ones that still provide perceived value necessary succeed this industry. Distribution channels also influence market share positioning in the Liquid Polybutadiene market. Having a strong and efficient distribution network ensures that widespread access to Liquid Polybutadiene products is achieved. Companies may decide to involve distributors, intermediaries, or users in their operations. A well-thought-out distribution plan serves two purposes: it gives the company's customers easy access to its products and enhances brand visibility. Another important aspect of market share positioning within the Liquid Polybutadiene Market is innovation. Research and development can create new applications or improve existing ones for liquid polybutadiene, leading to market segment expansion. Companies that invest in cutting-edge technologies or have environmentally friendly formulations may appeal to eco-conscious consumers who are willing to pay more for such products. Companies must be at par with technological advances so as to maintain a progressive position in the market. Collaborations and partnerships are strategic moves that affect market share greatly. Forming alliances with other industry players or related businesses can lead to mutually beneficial outcomes. For instance, a partnership between a producer of liquid polybutadiene adhesives and an adhesive manufacturer can help increase the company's market reach as well as integrate its product lines into those of the partner's major brands. Moreover, effective marketing and branding strategies are indispensable for market share positioning'. Building brand loyalty through establishing a strong brand identity that resonates with target audience members connects companies with their clients emotionally.' Not only does this require traditional advertising methods but also digital channels like social media sites including Facebook, Twitter, Instagram, and LinkedIn, among others.' By educating potential buyers about the benefits and applications of LPB, people can become aware of its presence, which influences their buying decisions.

    Author
    Priya Nagrale
    Senior Research Analyst

    With an experience of over five years in market research industry (Chemicals & Materials domain), I gather and analyze market data from diverse sources to produce results, which are then presented back to a client. Also, provide recommendations based on the findings. As a Senior Research Analyst, I perform quality checks (QC) for market estimations, QC for reports, and handle queries and work extensively on client customizations. Also, handle the responsibilities of client proposals, report planning, report finalization, and execution

    Leave a Comment

    FAQs

    What is the expected CAGR growth for the global market by the end of the global forecast period in 2035?

    The market is expected to grow at a CAGR of 4.85 by the end of the forecast period in 2035.

    Which region is expected to enjoy maximum growth by the end of 2035?

    The Asian Pacific or APAC region

    Name the market segments?

    The market has been segmented based on application, end-users and regions.

    Market Summary

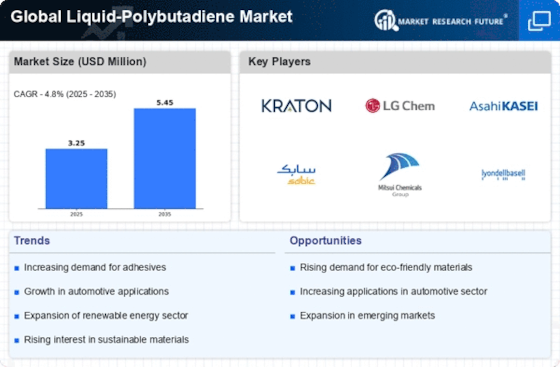
    The Global Liquid-Polybutadiene Market is projected to grow from 3.14 USD Billion in 2024 to 5.26 USD Billion by 2035, reflecting a robust CAGR of 4.8%.

    Key Market Trends & Highlights

    Global Liquid-Polybutadiene Key Trends and Highlights

    • The market valuation is expected to reach 5.26 USD Billion by 2035, indicating a strong growth trajectory.
    • From 2025 to 2035, the market is anticipated to expand at a compound annual growth rate of 4.8%.
    • In 2024, the market is valued at 3.14 USD Billion, laying a solid foundation for future growth.
    • Growing adoption of eco-friendly materials due to increasing environmental regulations is a major market driver.

    Market Size & Forecast

    2024 Market Size 3.14 (USD Million)
    2035 Market Size 5.26 (USD Million)
    CAGR (2025-2035) 4.8%
    Largest Regional Market Share in 2024 latin_america)

    Major Players

    Cray Valley, Kuraray Co. Ltd., Evonik Industries AG, SIBUR International GmbH, Nippon Soda Co. Ltd., Reliance Industries Limited, Synthomer plc, Versalis S.p.A., Uber Industries

    Market Trends

    The ongoing advancements in polymer technology and the increasing demand for high-performance materials are likely to drive the growth of the liquid-polybutadiene market in the coming years.

    U.S. Department of Energy

    Liquid Polybutadiene Market Market Drivers

    Growing Demand from Automotive Sector

    The Global Liquid-Polybutadiene Market Industry experiences a notable surge in demand from the automotive sector, primarily due to its application in manufacturing high-performance tires and various automotive components. As the automotive industry increasingly focuses on enhancing fuel efficiency and reducing emissions, the use of lightweight materials becomes paramount. Liquid polybutadiene, with its superior elasticity and resilience, is well-suited for these applications. In 2024, the market is projected to reach approximately 3.14 USD Billion, driven by the automotive sector's ongoing innovations and the shift towards sustainable materials.

    Market Segment Insights

    Regional Insights

    Key Companies in the Liquid Polybutadiene Market market include

    Industry Developments

    In 2016, Kuraray Co. Ltd, PTT Global Chemical, as well as, Sumitomo Corporation had signed a memorandum of understanding to conduct a shared study targeting the expansion of the Butadiene derivates in various parts of Thailand.

    Various key market players belonging to the Asian Pacific nations are expanding their operations to step into the international market and increase their footprint in the global market in the upcoming future years.Amid the ongoing COVID 19 pandemic, there is a growing emergence and volatility in the prices of commodities like crude oil, as well as, other raw materials.

    This is presenting the market hurdles which are being vanished by the adoption of new uses of the key players prevalent in the market through its functions.There is a huge increase in the demand for the market segments of automotive across various locations of the world, thus, increasing the demand for tires that is an application of the global LPBD market. Hence, tire manufacturing demand is likely to increase at a considerable scale by the end of 2023.The prominent market players belonging to the North American region are shifting to produce biodegradable plastic, as well as, petroleum-based plastic products.

    These are contributing to overcome the environmental restraints and helping the market grow at a good pace.

    Future Outlook

    Liquid Polybutadiene Market Future Outlook

    The Global Liquid-Polybutadiene Market is projected to grow at a 4.8% CAGR from 2024 to 2035, driven by increasing demand in automotive and consumer goods sectors.

    New opportunities lie in:

    • Invest in bio-based liquid-polybutadiene to capture eco-conscious consumer segments.
    • Develop advanced formulations for enhanced performance in high-temperature applications.
    • Expand distribution networks in emerging markets to leverage growing industrial demand.

    By 2035, the market is expected to achieve robust growth, positioning itself as a key player in the polymer industry.

    Market Segmentation

    Report Scope

    Attribute/Metric Details
      Market Size 2022: USD 2.96 billion 2030: Significant Value
      CAGR   4.8%(2022-2030)
      Base Year   2021
      Forecast Period   2022 to 2030
      Historical Data   2019 & 2020
      Forecast Units   Value (USD billion)
      Report Coverage   Revenue Forecast, Competitive Landscape, Growth Factors, and Trends
      Segments Covered   Application and End-Use
      Geographies Covered   North America, Europe, Asia-Pacific, and Rest of the World (RoW)
      Key Vendors   Cray Valley, Kuraray Co. Ltd., Evonik Industries AG, SIBUR International GmbH, Nippon Soda Co. Ltd., Reliance Industries Limited, Synthomer plc, Versalis S.p.A., Uber Industries
      Key Market Opportunities   The current market is undergoing a huge demand for chemical resistance
      Key Market Drivers   The growth of the construction industry is playing a major role

    Market Highlights

    Author

    Priya Nagrale
    Senior Research Analyst

    She holds an experience of about 6+ years in market research and business consulting, working under the spectrum of information communication technology, telecommunications and semiconductor domains. aarti conceptualizes and implements a scalable business strategy and provides strategic leadership to the clients. her expertise lies in market estimation, competitive intelligence, pipeline analysis, customer assessment, etc.

    Leave a Comment

    Latest Comments

    John Doe
    john@example.com

    This is a great article! Really helped me understand the topic better.

    Posted on July 23, 2025, 10:15 AM
    Jane Smith
    jane@domain.com

    Thanks for sharing this. I’ve bookmarked it for later reference.

    Posted on July 22, 2025, 7:45 PM

    FAQs

    What is the expected CAGR growth for the global market by the end of the global forecast period in 2035?

    The market is expected to grow at a CAGR of 4.85 by the end of the forecast period in 2035.

    Which region is expected to enjoy maximum growth by the end of 2035?

    The Asian Pacific or APAC region

    Name the market segments?

    The market has been segmented based on application, end-users and regions.

    1. Report Prologue
    2. Scope Of The Report
      1. Market Definition
      2. 13
      3. Scope Of The Study 13
        1. Research Objectives 13
        2. Assumptions
        3. Limitations 14
      4. 14
      5. Markets Structure 14
    3. Research Methodology
      1. Research Process 16
      2. Primary Research 17
      3. Secondary Research
      4. 17
      5. Market Size Estimation 17
    4. Market Dynamics
      1. Introduction
      2. 20
      3. Drivers 21
        1. Increasing Tire Manufacturing Across The Globe
        2. Growing Construction Industry Driving Liquid Polybutadiene Market (35% Impact
      4. Is A Key Factor Driving Demand Of Liquid Polybutadiene (65% Impact Weightage) 21
      5. Weightage) 22
      6. Restraints 23
        1. Fluctuation In Raw Material Prices
      7. 23
      8. Trends & Opportunities 24
        1. Rising Demand Of Bio Based
        2. Upsurge In Construction
      9. Liquid Polybutadiene In Tire Manufacturing 24
      10. Activities In Asia And Middle East & Africa To Offer Lucarative Opportunities
      11. 24
      12. Macroeconomic Indicators 24
        1. Rise In Disposable Income Coupled
      13. With Increased Spending On Automotive And Construction Activities. 24
    5. Market
      1. Factor Analysis
      2. Supply Chain Analysis 26
        1. Raw Material Suppliers
        2. Liquid Polybutadiene Producers 27
        3. Liquid Polybutadiene
        4. End User 27
      3. 26
      4. Distributors 27
      5. Porter''s 5 Forces Analysis 27
        1. Threat Of New Entrants 27
        2. Threat Of Rivalry 27
        3. Threat
        4. Bargaining Power Of Supplier 28
        5. Bargaining
      6. Of Substitute 28
      7. Power Of Buyer 28
    6. Global Liquid Polybutadiene Market, By Application
      1. 6.1
      2. Introduction 29
      3. Tire Manufacturing 33
      4. Industrial Rubber 34
      5. Polymer Modification 35
      6. Protective Films 36
      7. Chemicals 37
      8. Coatings 37
      9. Adhesives & Sealants 38
      10. Others 39
      11. 7
    7. Global Liquid Polybutadiene Market, By End Use
      1. Introduction 42
      2. 7.2
      3. Transportation 45
      4. Construction 46
      5. Industrial 47
      6. Others
      7. 47
    8. Global Liquid Polybutadiene Market, By Region
      1. Introduction 49
      2. North America 51
        1. U.S. 55
        2. Canada 58
      3. Europe 61
        1. Germany 65
        2. UK 67
        3. Spain 70
        4. France 73
        5. Italy 76
        6. Rest Of The Europe 79
      4. Asia Pacific 82
        1. India 89
        2. Japan 92
        3. Rest Of The Asia Pacific
      5. 8.4.1
      6. China 86
      7. 95
      8. Latin America 98
        1. Mexico 102
        2. Brazil 105
      9. 8.5.3
      10. Rest Of The Latin America 108
      11. Middle East & Africa 111
        1. UAE
        2. Saudi Arabia 118
        3. Rest Of The Middle East & Africa
      12. 115
      13. 121
    9. Competitive Landscape
      1. Introduction 124
      2. Key Development
      3. & Strategies 124
    10. Company Profile
      1. Kuraray Co. Ltd. 126
        1. Product/Business Segment Overview 126
        2. Key Developments 127
      2. 10.1.1
      3. Company Overview 126
      4. 10.1.3
      5. Financial Updates 127
      6. SIBUR International
        1. Company Overview 128
        2. Product/Business Segment Overview
        3. Production Capacity Of Business Segment 128
        4. Financial
        5. Key Developments 129
      7. GmbH 128
      8. 128
      9. Updates 129
      10. Idemitsu Kosan Co.,Ltd. (Japan)
        1. Company Overview 130
        2. Product/Business Segment Overview
        3. Sales Volume Of Business Segment 130
        4. Financial Updates
        5. Key Developments 131
      11. 130
      12. 130
      13. 131
      14. Versalis S.P.A (Italy) 132
        1. Product/Business Segment Overview 132
        2. Financial Updates 132
      15. 10.4.1
      16. Company Overview 132
      17. 10.4.3
      18. Sales And Production Business Segment 132
      19. 10.4.5
      20. Key Developments 133
      21. Evonik Industries AG (Germany) 133
        1. Company
        2. Product/Business Segment Overview 134
        3. Financial
        4. Key Developments 135
      22. Overview 133
      23. Updates 135
      24. Cray Valley (France) 136
        1. Company Overview 136
        2. Product/Business Segment Overview 136
        3. Financial Updates 136
        4. Key Developments 137
      25. NIPPON
        1. Company Overview 138
        2. Product/Business
        3. Financial Updates 138
        4. Key Developments
      26. SODA CO., LTD (Japan) 138
      27. Segment Overview 138
      28. 138
    11. Conclusion
    12. List Of Tables
    13. GLOBAL LIQUID POLYBUTADIENE
    14. MARKET, BY APPLICATION 2020-2027 ( USD MILLION) 30
    15. GLOBAL LIQUID POLYBUTADIENE
    16. MARKET, BY APPLICATION 2020-2027 ( KT) 32
    17. GLOBAL LIQUID POLYBUTADIENE
      1. MARKET FOR, TIRE MANUFACTURING 2020-2027 (USD MILLION) 33
    18. GLOBAL LIQUID
      1. POLYBUTADIENE MARKET FOR, TIRE MANUFACTURING 2020-2027 (KT) 33
    19. GLOBAL
      1. LIQUID POLYBUTADIENE MARKET FOR, INDUSTRIAL RUBBER 2020-2027 (USD MILLION) 34
    20. GLOBAL LIQUID POLYBUTADIENE MARKET FOR, INDUSTRIAL & SKYLIGHTS 2020-2027
      1. (KT) 34
    21. GLOBAL LIQUID POLYBUTADIENE MARKET FOR, POLYMER MODIFICANTION
    22. GLOBAL LIQUID POLYBUTADIENE MARKET FOR,
      1. POLYMER MODIFICANTION 2020-2027 (KT) 35
    23. GLOBAL LIQUID POLYBUTADIENE
      1. MARKET FOR, PROTECTIVE FILMS 2020-2027 (USD MILLION) 36
    24. GLOBAL LIQUID
      1. POLYBUTADIENE MARKET FOR, PROTECTIVE FILMS 2020-2027 (KT) 36
    25. GLOBAL
      1. LIQUID POLYBUTADIENE MARKET FOR, CHEMICALS 2020-2027 (USD MILLION) 37
      2. TABLE
    26. GLOBAL LIQUID POLYBUTADIENE MARKET FOR, CHEMICALS 2020-2027 (KT) 37
      1. TABLE
    27. GLOBAL LIQUID POLYBUTADIENE MARKET FOR, COATINGS 2020-2027 (USD MILLION) 37
    28. GLOBAL LIQUID POLYBUTADIENE MARKET FOR, COATINGS 2020-2027 (KT) 38
    29. GLOBAL LIQUID POLYBUTADIENE MARKET FOR, ADHESIVES & SEALANTS 2020-2027
      1. (USD MILLION) 38
    30. GLOBAL LIQUID POLYBUTADIENE MARKET FOR, ADHESIVES
      1. & SEALANTS 2020-2027 (KT) 39
    31. GLOBAL LIQUID POLYBUTADIENE MARKET
      1. FOR, OTHERS 2020-2027 (USD MILLION) 39
    32. GLOBAL LIQUID POLYBUTADIENE
      1. MARKET FOR, OTHERS 2020-2027 (KT) 40
    33. GLOBALN LIQUID POLUBUTADIENE
      1. MARKET BY, END USE 2020-2027 (USD MILLION) 43
    34. GLOBALN LIQUID POLUBUTADIENE
      1. MARKET BY, END USE 2020-2027 (KT) 44
    35. GLOBAL LIQUID POLUBUTADIENE MARKET
      1. FOR TRANSPORTATION 2020-2027 (USD MILLION) 45
    36. GLOBAL LIQUID POLUBUTADIENE
      1. MARKET FOR TRANSPORTATION 2020-2027 (KT) 45
    37. GLOBAL LIQUID POLUBUTADIENE
      1. MARKET FOR CONSTRUCTION 2020-2027 (USD MILLION) 46
    38. GLOBAL LIQUID POLUBUTADIENE
      1. MARKET FOR CONSTRUCTION 2020-2027 (KT) 46
    39. GLOBAL LIQUID POLUBUTADIENE
      1. MARKET FOR INDUSTRIAL 2020-2027 (USD MILLION) 47
    40. GLOBAL LIQUID POLUBUTADIENE
      1. MARKET FOR INDUSTRIAL 2020-2027 (KT) 47
    41. GLOBAL LIQUID POLUBUTADIENE
      1. MARKET FOR OTHERS 2020-2027 (USD MILLION) 47
    42. GLOBAL LIQUID POLUBUTADIENE
      1. MARKET FOR OTHERS 2020-2027 (KT) 48
    43. GLOBAL LIQUID POLYBUTADIENE MARKET,
      1. BY REGION 2020-2027 (USD MILLION) 50
    44. GLOBAL LIQUID POLYBUTADIENE MARKET,
      1. BY REGION 2020-2027 (KT) 50
    45. NORTH AMERICA LIQUID POLYBUTADIENE MARKET
      1. BY COUNTRY (USD MILLION) 51
    46. NORTH AMERICA LIQUID POLYBUTADIENE MARKET
      1. BY COUNTRY (KT) 51
    47. NORTH AMERICA LIQUID POLYBUTADIENE MARKET BY APPLICATION
      1. (USD MILLION) 52
    48. NORTH AMERICA LIQUID POLYBUTADIENE MARKET BY APPLICATION
      1. (KT) 53
    49. NORTH AMERICA LIQUID POLYBUTADIENE MARKET BY END USE (USD
      1. MILLION) 53
    50. NORTH AMERICA LIQUID POLYBUTADIENE MARKET BY END USE (KT)
      1. 53
    51. U.S. LIQUID POLYBUTADIENE MARKET BY APPLICATION (USD MILLION) 55
    52. U.S. LIQUID POLYBUTADIENE MARKET BY APPLICATION (KT) 56
      1. TABLE 39
      2. U.S. LIQUID POLYBUTADIENE MARKET BY END USE (USD MILLION) 56
    53. U.S.
      1. LIQUID POLYBUTADIENE MARKET BY END USE (KT) 56
    54. CANADA LIQUID POLYBUTADIENE
      1. MARKET BY APPLICATION (USD MILLION) 58
    55. CANADA LIQUID POLYBUTADIENE
      1. MARKET BY APPLICATION (KT) 59
    56. CANADA LIQUID POLYBUTADIENE MARKET BY
      1. END USE (USD MILLION) 60
    57. CANADA LIQUID POLYBUTADIENE MARKET BY END
      1. USE (KT) 60
    58. EUROPE LIQUID POLYBUTADIENE MARKET BY COUNTRY 2020-2027(USD
      1. MILLION) 61
    59. EUROPE LIQUID POLYBUTADIENE MARKET BY COUNTRY 2020-2027
      1. (KT) 62
    60. EUROPE LIQUID POLYBUTADIENE MARKET BY APPLICATION 2020-2027
      1. (USD MILLION) 62
    61. EUROPE LIQUID POLYBUTADIENE MARKET BY APPLICATION
    62. EUROPE LIQUID POLYBUTADIENE MARKET BY END USE 2020-2027
      1. (USD MILLION) 64
    63. EUROPE LIQUID POLYBUTADIENE MARKET BY END USE 2020-2027
      1. (KT) 64
    64. GERMANY LIQUID POLYBUTADIENE MARKET BY APPLICATION 2020-2027
      1. (USD MILLION) 65
    65. GERMANY LIQUID POLYBUTADIENE MARKET BY APPLICATION
    66. GERMANY LIQUID POLYBUTADIENE MARKET BY END USE 2020-2027
      1. (USD MILLION) 66
    67. GERMANY LIQUID POLYBUTADIENE MARKET BY END USE 2020-2027
      1. (KT) 66
    68. UK LIQUID POLYBUTADIENE MARKET BY APPLICATION 2020-2027 (USD
      1. MILLION) 67
    69. UK LIQUID POLYBUTADIENE MARKET BY APPLICATION 2020-2027
      1. (KT) 67
    70. UK LIQUID POLYBUTADIENE MARKET BY END USE 2020-2027 (USD MILLION)
      1. 68
    71. UK LIQUID POLYBUTADIENE MARKET BY END USE 2020-2027 (KT) 68
    72. SPAIN LIQUID POLYBUTADIENE MARKET BY APPLICATION 2020-2027 (USD MILLION)
      1. 70
    73. SPAIN LIQUID POLYBUTADIENE MARKET BY APPLICATION 2020-2027 (KT)
      1. 71
    74. SPAIN LIQUID POLYBUTADIENE MARKET BY END USE 2020-2027 (USD MILLION)
      1. 71
    75. SPAIN LIQUID POLYBUTADIENE MARKET BY END USE 2020-2027 (KT) 71
    76. FRANCE LIQUID POLYBUTADIENE MARKET BY APPLICATION 2020-2027 (USD MILLION)
      1. 73
    77. FRANCE LIQUID POLYBUTADIENE MARKET BY APPLICATION 2020-2027 (KT)
      1. 74
    78. FRANCE LIQUID POLYBUTADIENE MARKET BY END USE 2020-2027 (USD MILLION)
      1. 74
    79. FRANCE LIQUID POLYBUTADIENE MARKET BY END USE 2020-2027 (KT) 74
    80. ITALY LIQUID POLYBUTADIENE MARKET BY APPLICATION 2020-2027 (USD MILLION)
      1. 76
    81. ITALY LIQUID POLYBUTADIENE MARKET BY APPLICATION 2020-2027 (KT)
      1. 77
    82. ITALY LIQUID POLYBUTADIENE MARKET BY END USE 2020-2027 (USD MILLION)
      1. 77
    83. ITALY LIQUID POLYBUTADIENE MARKET BY END USE 2020-2027 (KT) 77
    84. RESRT OF THE EUROPE LIQUID POLYBUTADIENE MARKET BY APPLICATION 2020-2027
      1. (USD MILLION) 79
    85. RESRT OF THE EUROPE LIQUID POLYBUTADIENE MARKET BY
      1. APPLICATION 2020-2027 (KT) 80
    86. RESRT OF THE EUROPE LIQUID POLYBUTADIENE
      1. MARKET BY END USE 2020-2027 (USD MILLION) 80
    87. RESRT OF THE EUROPE LIQUID
      1. POLYBUTADIENE MARKET BY END USE 2020-2027 (KT) 81
    88. ASIA PACIFIC LIQUID
    89. POLYBUTADIENE MARKET, BY COUNTRY 2020-2027N (USD MILLION) 82
    90. ASIA
    91. PACIFIC LIQUID POLYBUTADIENE MARKET, BY COUNTRY 2020-2027N (KT) 82
      1. TABLE 77
    92. ASIA PACIFIC LIQUID POLYBUTADIENE MARKET, BY APPLICATION 2020-2027N (USD MILLION)
      1. 83
    93. ASIA PACIFIC LIQUID POLYBUTADIENE MARKET, BY APPLICATION 2020-2027N
      1. (KT) 84
    94. ASIA PACIFIC LIQUID POLYBUTADIENE MARKET, BY END USE 2020-2027N
      1. (USD MILLION) 84
    95. ASIA PACIFIC LIQUID POLYBUTADIENE MARKET, BY END
      1. USE 2020-2027N (KT) 84
    96. CHINA LIQUID POLYBUTADIENE MARKET, BY APPLICATION
    97. CHINA LIQUID POLYBUTADIENE MARKET, BY
      1. APPLICATION 2020-2027N (KT) 87
    98. CHINA LIQUID POLYBUTADIENE MARKET,
      1. BY END USE 2020-2027N (USD MILLION) 87
    99. CHINA LIQUID POLYBUTADIENE
    100. MARKET, BY END USE 2020-2027 (KT) 87
    101. INDIA LIQUID POLYBUTADIENE MARKET,
      1. BY APPLICATION 2020-2027 (USD MILLION) 89
    102. INDIA LIQUID POLYBUTADIENE
    103. MARKET, BY APPLICATION 2020-2027 (KT) 90
    104. INDIA LIQUID POLYBUTADIENE
    105. MARKET, BY END USE 2020-2027 (USD MILLION) 90
    106. INDIA LIQUID POLYBUTADIENE
    107. MARKET, BY END USE 2020-2027 (KT) 90
    108. JAPAN LIQUID POLYBUTADIENE MARKET,
      1. BY APPLICATION 2020-2027 (USD MILLION) 92
    109. JAPAN LIQUID POLYBUTADIENE
    110. MARKET, BY APPLICATION 2020-2027 (KT) 93
    111. JAPAN LIQUID POLYBUTADIENE
    112. MARKET, BY END USE 2020-2027 (USD MILLION) 93
    113. JAPAN LIQUID POLYBUTADIENE
    114. MARKET, BY END USE 2020-2027 (KT) 93
    115. REST OF THE ASIA PACIFIC LIQUID
    116. POLYBUTADIENE MARKET, BY APPLICATION 2020-2027 (USD MILLION) 95
    117. REST
    118. OF THE ASIA PACIFIC LIQUID POLYBUTADIENE MARKET, BY APPLICATION 2020-2027 (KT) 96
    119. REST OF THE ASIA PACIFIC LIQUID POLYBUTADIENE MARKET, BY END USE 2020-2027
      1. (USD MILLION) 96
    120. REST OF THE ASIA PACIFIC LIQUID POLYBUTADIENE MARKET,
      1. BY END USE 2020-2027 (KT) 97
    121. LATIN AMERICA LIQUID POLYBUTADIENE MARKET,
      1. BY APPLICATION 2020-2027 (USD MILLION) 98
    122. LATIN AMERICA LIQUID POLYBUTADIENE
    123. MARKET, BY APPLICATION 2020-2027 (KT) 98
    124. LATIN AMERICA LIQUID POLYBUTADIENE
    125. MARKET, BY APPLICATION 2020-2027 (USD MILLION) 99
    126. LATIN AMERICA LIQUID
    127. POLYBUTADIENE MARKET, BY APPLICATION 2020-2027 (KT) 100
    128. LATIN AMERICA
    129. LIQUID POLYBUTADIENE MARKET, BY END USE 2020-2027 (USD MILLION 100
      1. TABLE 102
    130. LATIN AMERICA LIQUID POLYBUTADIENE MARKET, BY END USE 2020-2027 (USD MILLION) 101
    131. MEXICO LIQUID POLYBUTADIENE MARKET, BY APPLICATION 2020-2027 (USD MILLION)
      1. 102
    132. MEXICO LIQUID POLYBUTADIENE MARKET, BY APPLICATION 2020-2027
      1. (KT) 103
    133. MEXICO LIQUID POLYBUTADIENE MARKET, BY END USE 2020-2027
      1. (USD MILLION) 103
    134. MEXICO LIQUID POLYBUTADIENE MARKET, BY END USE
    135. BRAZIL LIQUID POLYBUTADIENE MARKET, BY APPLICATION
    136. BRAZIL LIQUID POLYBUTADIENE MARKET, BY
      1. APPLICATION 2020-2027 (KT) 106
    137. BRAZIL LIQUID POLYBUTADIENE MARKET,
      1. BY END USE 2020-2027 (USD MILLION) 106
    138. BRAZIL LIQUID POLYBUTADIENE
    139. MARKET, BY END USE 2020-2027 (KT) 106
    140. REST OF THE LATIN AMERICA LIQUID
    141. POLYBUTADIENE MARKET, BY APPLICATION 2020-2027 (USD MILLION) 108
      1. TABLE 112
    142. REST OF THE LATIN AMERICA LIQUID POLYBUTADIENE MARKET, BY APPLICATION 2020-2027
      1. (KT) 109
    143. REST OF THE LATIN AMERICA LIQUID POLYBUTADIENE MARKET, BY
      1. END USE 2020-2027 (USD MILLION) 109
    144. REST OF THE LATIN AMERICA LIQUID
    145. POLYBUTADIENE MARKET, BY END USE 2020-2027 (KT) 110
    146. MIDDLE EAST &
    147. AFRICA LIQUID POLYBUTADIENE MARKET, BY COUNTRIES 2020-2027 (USD MILLION) 111
    148. MIDDLE EAST & AFRICA LIQUID POLYBUTADIENE MARKET, BY COUNTRIES 2020-2027
      1. (KT) 111
    149. MIDDLE EAST & AFRICA LIQUID POLYBUTADIENE MARKET, BY
      1. APPLICATION 2020-2027 (USD MILLION) 112
    150. MIDDLE EAST & AFRICA
    151. LIQUID POLYBUTADIENE MARKET, BY APPLICATION 2020-2027 (KT) 113
    152. MIDDLE
    153. EAST & AFRICA LIQUID POLYBUTADIENE MARKET, BY END USE 2020-2027 (USD MILLION)
      1. 113
    154. MIDDLE EAST & AFRICA LIQUID POLYBUTADIENE MARKET, BY END
      1. USE 2020-2027 (KT) 114
    155. UAE LIQUID POLYBUTADIENE MARKET, BY APPLICATION
    156. UAE LIQUID POLYBUTADIENE MARKET, BY APPLICATION
    157. UAE LIQUID POLYBUTADIENE MARKET, BY END USE 2020-2027
      1. (USD MILLION) 116
    158. UAE LIQUID POLYBUTADIENE MARKET, BY END USE 2020-2027
      1. (KT) 116
    159. SAUDI ARABIA LIQUID POLYBUTADIENE MARKET, BY APPLICATION
    160. SAUDI ARABIA LIQUID POLYBUTADIENE MARKET,
      1. BY APPLICATION 2020-2027 (KT) 119
    161. SAUDI ARABIA LIQUID POLYBUTADIENE
    162. MARKET, BY END USE 2020-2027 (USD MILLION) 119
    163. SAUDI ARABIA LIQUID
    164. POLYBUTADIENE MARKET, BY END USE 2020-2027 (KT) 119
    165. REST OF THE MIDDLE
    166. EAST & AFRICA LIQUID POLYBUTADIENE MARKET, BY APPLICATION 2020-2027 (USD MILLION)
      1. 121
    167. REST OF THE MIDDLE EAST & AFRICA LIQUID POLYBUTADIENE MARKET,
      1. BY APPLICATION 2020-2027 (KT) 122
    168. REST OF THE MIDDLE EAST & AFRICA
    169. LIQUID POLYBUTADIENE MARKET, BY END USE 2020-2027 (USD MILLION) 122
      1. TABLE 132
    170. REST OF THE MIDDLE EAST & AFRICA LIQUID POLYBUTADIENE MARKET, BY END USE 2020-2027
      1. (KT) 123
    171. KEY DEVELOPMENT (2012-2020) 124
    172. KURARAY CO.
      1. LTD: SEGMENT OVERVIEW 126
    173. KURARAY CO. LTD:KEY DEVELOPMENTS 127
    174. SIBUR INTERNATIONAL GMBH: SEGMENT OVERVIEW 128
    175. SIBUR
      1. INTERNATIONAL GMBH: PRODUCTION ANALYSIS 128
    176. SIBUR INTERNATIONAL GMBH:KEY
      1. DEVELOPMENTS 129
    177. IDEMITSU KOSAN CO.,LTD.: SEGMENT OVERVIEW 130
    178. IDEMITSU KOSAN CO.,LTD.: SALES AND PRODUCTION ANALYSIS 130
      1. TABLE
    179. VERSALIS: SEGMENT OVERVIEW 132
    180. VERSALIS: SALES AND PRODUCTION
      1. ANALYSIS 132
    181. VERSALIS:KEY DEVELOPMENTS 133
    182. EVONIK
      1. INDUSTRIES AG: SEGMENT OVERVIEW 134
    183. EVONIK INDUSTRIES AG:KEY DEVELOPMENTS
      1. 135
    184. CRAY VALLEY: SEGMENT OVERVIEW 136
    185. CRAY VALLEY
      1. S.A:KEY DEVELOPMENTS 137
    186. NIPPON SODA CO., LTD: SEGMENT OVERVIEW 138
    187. List Of Figures
    188. TOP DOWN & BOTTOM UP APPROACH
      1. 18
    189. FORECAST MODEL 19
    190. MARKET DYNAMICS 20
      1. FIGURE
    191. SUPPLY CHAIN ANALYSIS 26
    192. GLOBAL LIQUID POLYBUTADIENE MARKET, BY
      1. APPLICATION 2020-2027 ( USD MILLION) 29
    193. GLOBAL LIQUID POLYBUTADIENE
    194. MARKET, BY APPLICATION 2020-2027 ( KT) 31
    195. GLOBALN LIQUID POLUBUTADIENE
      1. MARKET BY, END USE 2020-2027 (USD MILLION) 42
    196. GLOBALN LIQUID POLUBUTADIENE
      1. MARKET BY, END USE 2020-2027 (KT) 43
    197. GLOBAL LIQUID POLYBUTADIENE MARKET,
      1. BY REGION 2020 (%) 49
    198. KURARAY CO. LTD: RECENT FINANCIAL 127
      1. FIGURE
    199. SIBUR INTERNATIONAL GMBH: RECENT FINANCIAL 129
    200. IDEMITSU KOSAN
      1. CO.,LTD.: RECENT FINANCIAL 131
    201. VERSALIS: RECENT FINANCIALS 132
    202. EVONIK INDUSTRIES AG: RECENT FINANCIALS 135
    203. NIPPON SODA
      1. CO., LTD: RECENT FINANCIALS 138
    Liquid Polybutadiene Market Segmentation

    Market Segmentation Overview

    • Detailed segmentation data will be available in the full report
    • Comprehensive analysis by multiple parameters
    • Regional and country-level breakdowns
    • Market size forecasts by segment
    Infographic

    Free Sample Request

    Kindly complete the form below to receive a free sample of this Report

    Get Free Sample

    Customer Strories

    “I am very pleased with how market segments have been defined in a relevant way for my purposes (such as "Portable Freezers & refrigerators" and "last-mile"). In general the report is well structured. Thanks very much for your efforts.”

    Victoria Milne

    Founder
    Case Study
    Chemicals and Materials