• Cat-intel
  • MedIntelliX
  • Resources
  • About Us
  • Request Free Sample ×

    Kindly complete the form below to receive a free sample of this Report

    Leading companies partner with us for data-driven Insights

    clients tt-cursor

    Japan Mobile Augmented Reality Market

    ID: MRFR/ICT/63531-HCR
    200 Pages
    Aarti Dhapte
    September 2025

    Japan Mobile Augmented Reality Market Research Report By Application (Gaming, Education, Retail, Healthcare, Real Estate), By Device Type (Smartphones, Tablets, Wearable Devices, Smart Glasses), By Technology (Marker-Based Augmented Reality, Markerless Augmented Reality, Projection-Based Augmented Reality, Superimposition-Based Augmented Reality) and By End Use (Individual Users, Enterprise Users, Government)- Forecast to 2035

    Share:
    Download PDF ×

    We do not share your information with anyone. However, we may send you emails based on your report interest from time to time. You may contact us at any time to opt-out.

    Purchase Options
    $ 4,950.0
    $ 5,950.0
    $ 7,250.0
    Table of Contents

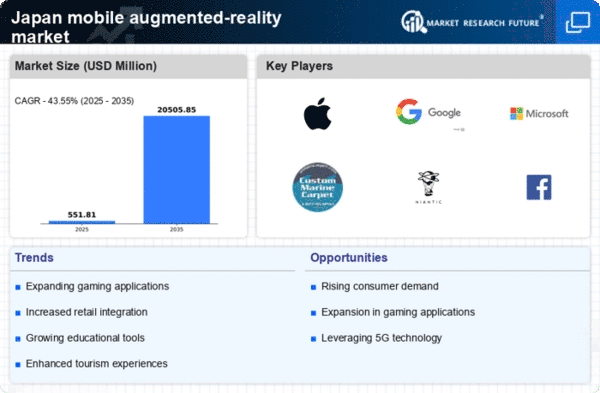
    Japan Mobile Augmented Reality Market Summary

    Key Market Trends & Highlights

    Japan Mobile Augmented Reality Market Trends

    Several critical market drivers are propelling the Japan Mobile Augmented Reality Market to significant growth. The pervasive adoption of smartphones with sophisticated AR capabilities is one of the primary drivers, as it enables users to seamlessly integrate digital content with their real-world environment. Furthermore, the growing interest in AR applications is being stimulated by the emphasis on innovation in sectors such as retail, education, and gaming. The development of AR technologies is also supported by the Japanese government's initiative to promote digital transformation in various sectors, which ultimately enhances user experiences. 

    The Japan Mobile Augmented Reality Market offers significant opportunities, particularly in sectors such as tourism and manufacturing, where AR can improve efficiency and increase user engagement. Companies have the opportunity to establish partnerships in order to create AR content that is tailored to the specific needs of Japanese consumers, given Japan's status as a global leader in technology and innovation. The potential for AR to improve remote collaboration, particularly in a country with a geriatric workforce, opens up additional opportunities for growth and development. In recent years, there has been a significant increase in the number of augmented reality applications that are specifically designed for cultural and historical experiences, in accordance with Japan's rich heritage. 

    Companies are currently emphasizing the integration of AR experiences into historical sites, museums, and festivals in order to attract both domestic and international visitors. In addition, the recent expansion of e-commerce in Japan is incentivizing retailers to integrate AR capabilities into mobile purchasing applications, which will enable consumers to virtually sample products prior to making a purchase. This trend indicates that consumer behaviors are becoming more in line with technological advancements, illustrating the importance of AR in Japan's digital ecosystem.

    Japan Mobile Augmented Reality Market Drivers

    Market Segment Insights

    Japan Mobile Augmented Reality Market Segment Insights

    Mobile Augmented Reality Market Application Insights

    The Application segment of the Japan Mobile Augmented Reality Market represents a diverse array of use cases that cater to various industries, underscoring the versatility and wide adoption of augmented reality technologies across essential sectors. Among these, Gaming continues to significantly drive growth, with interactive gameplay creating engaging experiences that resonate with both casual and professional gamers. This segment has cultivated a vibrant ecosystem, where immersive technologies are leveraged to enhance user experience and foster community building.In Education, Mobile Augmented Reality proves vital for innovative learning approaches, allowing students to interact with complex concepts through 3D visualizations, ultimately aiding comprehension and retention. 

    The educational sector in Japan has increasingly adapted AR for practical training, providing real-world applications that enhance the quality of education. In Retail, the capability to visualize products in real-world settings before purchase fundamentally transforms shopping behavior, offering customers an interactive experience that goes beyond traditional retail paradigms.This interaction not only boosts consumer engagement but also enhances sales as customers are more likely to convert after experiencing AR-enabled reviews or virtual try-ons. The Healthcare industry also benefits from this technology, employing augmented reality for training medical professionals and facilitating surgical procedures with real-time data overlay, thus increasing efficiency and decreasing risks during operations. 

    Furthermore, in Real Estate, Mobile Augmented Reality facilitates virtual tours and property showcases, allowing potential buyers to visualize properties from the comfort of their homes, significantly influencing purchasing decisions.The blend of user convenience and enhanced information access further reinforces the importance of such applications in shaping consumer behavior in Japan. Through a combination of digital innovation and specific application benefits, the Japan Mobile Augmented Reality Market's Application segment illustrates significant potential for growth, driven by the continued integration of technology across multiple sectors. Furthermore, evolving consumer preferences and advances in mobile technologies will likely lead to sustained market expansion in Japan, positioning the country as a leader in augmented reality innovation.

    Japan Mobile Augmented Reality Market Segment

    Source: Primary Research, Secondary Research, MRFR Database and Analyst Review

    Mobile Augmented Reality Market Device Type Insights

    The Japan Mobile Augmented Reality Market demonstrates a robust segmentation strategy centered on Device Type, which includes Smartphones, Tablets, Wearable Devices, and Smart Glasses. Smartphones are a crucial component, as their ubiquitous presence and advanced graphics capabilities make them an ideal platform for AR applications, facilitating everyday user engagement. Tablets, while slightly less dominant, offer larger screens that enhance the immersive experience, catering to both entertainment and educational applications. 

    Wearable Devices, particularly smart glasses, have gained traction in niche sectors, providing hands-free access to AR content, which significantly benefits industries like manufacturing and healthcare.The rise of AR gaming and interactive shopping experiences is propelling the demand for these devices, leading to a competitive landscape focused on innovation. However, challenges such as consumer adoption rates and technology integration remain. Ultimately, the Device Type segment is becoming increasingly significant in the Japan Mobile Augmented Reality Market as it aligns with evolving consumer behaviors and technological advancements, reflecting broader trends in the digital landscape.

    Mobile Augmented Reality Market Technology Insights

    The Japan Mobile Augmented Reality Market within the Technology segment showcases a dynamic and evolving landscape driven by various technological innovations. Marker-Based Augmented Reality remains a critical approach that utilizes visual markers to trigger digital content, making it especially popular in educational and advertising applications. Meanwhile, Markerless Augmented Reality is significantly reshaping user interactions by allowing digital overlays without the need for physical markers, leveraging advanced mobile sensors to enhance real-world experiences.Projection-Based Augmented Reality creates immersive experiences by projecting digital graphics onto real-world surfaces, which finds extensive use in retail and entertainment sectors, fostering customer engagement. 

    Furthermore, Superimposition-Based Augmented Reality, which enables users to see virtual objects seamlessly integrated into their real-world environments, is gaining traction in industries such as real estate and maintenance. The growth of these technological segments is further encouraged by Japan’s robust smartphone penetration and the increasing adoption of mobile applications, contributing to the overall expansion and sophistication of the Japan Mobile Augmented Reality Market.As advancements continue, these segments are positioned to provide immense opportunities for innovation and immersive user experiences across various industries in Japan.

    Mobile Augmented Reality Market End Use Insights

    The Japan Mobile Augmented Reality Market exhibits a diverse landscape across its End Use segment, which includes Individual Users, Enterprise Users, and Government. Individual Users are increasingly adopting mobile augmented reality for various applications such as gaming, education, and personal utility, highlighting the significant demand for engaging and interactive experiences. Meanwhile, Enterprise Users leverage mobile augmented reality to enhance operational efficiency, offering solutions in industries like retail, manufacturing, and training, where immersive experiences can drive productivity and innovation.

    The Government sector is also recognizing the potential of mobile AR for initiatives in urban planning, defense, and public safety, using technology to improve service delivery and citizen engagement. This diverse segmentation underscores the broad applicability of augmented reality technologies in Japan, driven by rapid advancements in mobile technology and a strong consumer interest in interactive digital experiences. With a government focus on fostering innovation, augmented reality is well-positioned to grow and influence various sectors, shaping the future digital landscape in Japan.The increasing prevalence of smart devices further supports the trends within these segments, creating new opportunities for developers and businesses in the ever-evolving mobile augmented reality landscape.

    Regional Insights

    Key Players and Competitive Insights

    The competitive landscape of the Japan Mobile Augmented Reality Market is characterized by rapid technological advancements and a surge in the adoption of AR solutions across diverse sectors. This market is witnessing the influx of both established players and emerging startups, leveraging the unique cultural and technological framework of Japan. Companies are innovating to create enhanced user experiences by integrating AR applications in gaming, retail, education, and other industries, tapping into local consumer preferences and trends. The competitive environment is further intensified by collaborations, increasing investments in R&D, and the necessity for businesses to differentiate their offerings through unique features and superior customer experiences. 

    The demand for AR technology in Japan is growing as users become more engaged with mobile applications, driving innovations and competitive strategies among key players.Zebra Technologies has established a robust presence in the Japan Mobile Augmented Reality Market through its focus on retail and supply chain solutions. The company is recognized for its strengths in enterprise asset intelligence which leverages AR to improve operational efficiencies. By providing tools that enhance product visualization and streamline inventory management, Zebra Technologies caters to a wide array of industries looking to elevate their customer engagement through augmented reality. Its innovative approach and commitment to tailoring solutions that align with local business needs position Zebra Technologies favorably within this competitive market. 

    Furthermore, Zebra’s ongoing investment in research and development ensures it remains at the forefront of AR technology, consistently launching new products that respond to the evolving demands of the Japanese market.Google remains a significant player in the Japan Mobile Augmented Reality Market, leveraging its extensive technological infrastructure and software capabilities. The company has introduced several key products and services in this domain, including virtual reality and AR platforms that enhance both consumer interaction and business operations. Google’s strengths lie in its immersive technology portfolio, which encompasses advancements in cloud computing and machine learning, enabling richer AR experiences. The company maintains strong market presence through strategic partnerships, mergers, and acquisitions that bolster its capabilities in augmented reality. 

    Google’s commitment to innovation and user-centric designs has positioned it as a leader in AR technology, allowing it to cater effectively to diverse segments within Japan. This blend of cutting-edge technology and understanding of the Japanese market enables Google to adapt its offerings to meet the specific needs of consumers and businesses alike.

    Industry Developments

    In recent months, the Japan Mobile Augmented Reality Market has witnessed significant advancements, particularly with companies like Google and Unity Technologies pushing the boundaries of AR technology. Niantic is also gaining traction with its collaborations for mobile games and interactive experiences, enhancing user engagement. In October 2023, an exciting development occurred when Bandai Namco announced a partnership with Sony to explore AR applications in gaming, reflecting the growing trend of cross-industry collaborations. Notably, in September 2023, Apple released updates to its ARKit, improving functionalities for developers and attracting more developers into the Japanese AR ecosystem. 

    The market's growth is evident, with valuations reaching new heights due to increased investments and consumer interest in immersive experiences. The last two years have seen significant movements, including the launch of several AR applications tailored to local preferences and demographics, further stimulating the sector, while firms like Microsoft have been active in establishing a regional presence through strategic initiatives to support local developers. The dynamic nature of this market indicates a vibrant future for augmented reality within Japan, which remains a global hub for technological innovation.

    Market Segmentation

    Mobile Augmented Reality Market End Use Outlook

    • Individual Users
    • Enterprise Users
    • Government

    Mobile Augmented Reality Market Technology Outlook

    • Marker-Based Augmented Reality
    • Markerless Augmented Reality
    • Projection-Based Augmented Reality
    • Superimposition-Based Augmented Reality

    Mobile Augmented Reality Market Application Outlook

    • Gaming
    • Education
    • Retail
    • Healthcare
    • Real Estate

    Mobile Augmented Reality Market Device Type Outlook

    • Smartphones
    • Tablets
    • Wearable Devices
    • Smart Glasses

    Report Scope


    Report Attribute/Metric Source: Details
    MARKET SIZE 2023 401.62(USD Million)
    MARKET SIZE 2024 582.23(USD Million)
    MARKET SIZE 2035 3054.89(USD Million)
    COMPOUND ANNUAL GROWTH RATE (CAGR) 16.264% (2025 - 2035)
    REPORT COVERAGE Revenue Forecast, Competitive Landscape, Growth Factors, and Trends
    BASE YEAR 2024
    MARKET FORECAST PERIOD 2025 - 2035
    HISTORICAL DATA 2019 - 2024
    MARKET FORECAST UNITS USD Million
    KEY COMPANIES PROFILED Zebra Technologies, Google, Unity Technologies, Niantic, Square Enix, Bandai Namco, Apple, Vuforia, Microsoft, Snap, Blippar, Sony, Wikitude, Augmented Reality Inc.
    SEGMENTS COVERED Application, Device Type, Technology, End Use
    KEY MARKET OPPORTUNITIES Increased gaming and entertainment demand, Integration in retail experiences, Growth in educational applications, Enhanced tourism and travel experiences, Expansion of remote collaboration tools
    KEY MARKET DYNAMICS increased smartphone penetration, growing gaming industry, advancements in AR technology, rise of social media, demand for immersive experiences
    COUNTRIES COVERED Japan

    Market Highlights

    Author
    Aarti Dhapte
    Team Lead - Research

    She holds an experience of about 6+ years in Market Research and Business Consulting, working under the spectrum of Information Communication Technology, Telecommunications and Semiconductor domains. Aarti conceptualizes and implements a scalable business strategy and provides strategic leadership to the clients. Her expertise lies in market estimation, competitive intelligence, pipeline analysis, customer assessment, etc.

    Leave a Comment

    FAQs

    What is the expected market size of the Japan Mobile Augmented Reality Market by 2024?

    The Japan Mobile Augmented Reality Market is expected to be valued at 582.23 million USD by 2024.

    What is the projected market size of the Japan Mobile Augmented Reality Market by 2035?

    By 2035, the Japan Mobile Augmented Reality Market is projected to reach 3054.89 million USD.

    What is the expected CAGR for the Japan Mobile Augmented Reality Market from 2025 to 2035?

    The expected compound annual growth rate for the Japan Mobile Augmented Reality Market from 2025 to 2035 is 16.264%.

    Which application is anticipated to have the highest market value in the Japan Mobile Augmented Reality Market by 2035?

    The gaming application is anticipated to have the highest market value, reaching 780.0 million USD by 2035.

    What are the projected market values for the education segment in the Japan Mobile Augmented Reality Market by 2035?

    The education segment is projected to reach a market value of 600.0 million USD by 2035.

    What is the market size of the retail application segment in the Japan Mobile Augmented Reality Market for 2024?

    The market size of the retail application segment is valued at 100.0 million USD in 2024.

    Which key players are dominating the Japan Mobile Augmented Reality Market?

    Key players in the Japan Mobile Augmented Reality Market include Zebra Technologies, Google, Apple, and Unity Technologies.

    What is the anticipated market value for the real estate application in 2035?

    The real estate application is anticipated to reach a market value of 774.89 million USD by 2035.

    How much is the healthcare application segment expected to be valued in 2035?

    The healthcare application segment is expected to be valued at 400.0 million USD by 2035.

    What growth opportunities exist for the Japan Mobile Augmented Reality Market in the upcoming years?

    The Japan Mobile Augmented Reality Market shows growth opportunities through advancements in technology and applications in various sectors.

    1. EXECUTIVE
    2. SUMMARY
    3. Market Overview
    4. Key Findings
    5. Market Segmentation
    6. Competitive Landscape
    7. Challenges and Opportunities
    8. Future Outlook
    9. MARKET INTRODUCTION
    10. Definition
    11. Scope of the study
    12. Research Objective
    13. Assumption
    14. Limitations
    15. RESEARCH
    16. METHODOLOGY
    17. Overview
    18. Data
    19. Mining
    20. Secondary Research
    21. Primary
    22. Research
    23. Primary Interviews and Information Gathering
    24. Process
    25. Breakdown of Primary Respondents
    26. Forecasting
    27. Model
    28. Market Size Estimation
    29. Bottom-Up
    30. Approach
    31. Top-Down Approach
    32. Data
    33. Triangulation
    34. Validation
    35. MARKET
    36. DYNAMICS
    37. Overview
    38. Drivers
    39. Restraints
    40. Opportunities
    41. MARKET FACTOR ANALYSIS
    42. Value chain Analysis
    43. Porter's
    44. Five Forces Analysis
    45. Bargaining Power of Suppliers
    46. Bargaining
    47. Power of Buyers
    48. Threat of New Entrants
    49. Threat
    50. of Substitutes
    51. Intensity of Rivalry
    52. COVID-19
    53. Impact Analysis
    54. Market Impact Analysis
    55. Regional
    56. Impact
    57. Opportunity and Threat Analysis
    58. Japan
    59. Mobile Augmented Reality Market, BY Application (USD Million)
    60. Gaming
    61. Education
    62. Retail
    63. Healthcare
    64. Real
    65. Estate
    66. Japan Mobile Augmented
    67. Reality Market, BY Device Type (USD Million)
    68. Smartphones
    69. Wearable
    70. Devices
    71. Smart Glasses
    72. Japan
    73. Mobile Augmented Reality Market, BY Technology (USD Million)
    74. Marker-Based
    75. Augmented Reality
    76. Markerless Augmented Reality
    77. Projection-Based
    78. Augmented Reality
    79. Superimposition-Based Augmented Reality
    80. Japan
    81. Mobile Augmented Reality Market, BY End Use (USD Million)
    82. Individual
    83. Users
    84. Enterprise Users
    85. Government
    86. Competitive Landscape
    87. Overview
    88. Competitive
    89. Analysis
    90. Market share Analysis
    91. Major
    92. Growth Strategy in the Mobile Augmented Reality Market
    93. Competitive
    94. Benchmarking
    95. Leading Players in Terms of Number of Developments
    96. in the Mobile Augmented Reality Market
    97. Key developments
    98. and growth strategies
    99. New Product Launch/Service Deployment
    100. Merger
    101. & Acquisitions
    102. Joint Ventures
    103. Major
    104. Players Financial Matrix
    105. Sales and Operating Income
    106. Major
    107. Players R&D Expenditure. 2023
    108. Company
    109. Profiles
    110. Zebra Technologies
    111. Financial
    112. Overview
    113. Products Offered
    114. Key
    115. Developments
    116. SWOT Analysis
    117. Key
    118. Strategies
    119. Google
    120. Financial
    121. Overview
    122. Products Offered
    123. Key
    124. Developments
    125. SWOT Analysis
    126. Key
    127. Strategies
    128. Unity Technologies
    129. Financial
    130. Overview
    131. Products Offered
    132. Key
    133. Developments
    134. SWOT Analysis
    135. Key
    136. Strategies
    137. Niantic
    138. Financial
    139. Overview
    140. Products Offered
    141. Key
    142. Developments
    143. SWOT Analysis
    144. Key
    145. Strategies
    146. Square Enix
    147. Financial
    148. Overview
    149. Products Offered
    150. Key
    151. Developments
    152. SWOT Analysis
    153. Key
    154. Strategies
    155. Bandai Namco
    156. Financial
    157. Overview
    158. Products Offered
    159. Key
    160. Developments
    161. SWOT Analysis
    162. Key
    163. Strategies
    164. Apple
    165. Financial
    166. Overview
    167. Products Offered
    168. Key
    169. Developments
    170. SWOT Analysis
    171. Key
    172. Strategies
    173. Vuforia
    174. Financial
    175. Overview
    176. Products Offered
    177. Key
    178. Developments
    179. SWOT Analysis
    180. Key
    181. Strategies
    182. Microsoft
    183. Financial
    184. Overview
    185. Products Offered
    186. Key
    187. Developments
    188. SWOT Analysis
    189. Key
    190. Strategies
    191. Snap
    192. Financial
    193. Overview
    194. Products Offered
    195. Key
    196. Developments
    197. SWOT Analysis
    198. Key
    199. Strategies
    200. Blippar
    201. Financial
    202. Overview
    203. Products Offered
    204. Key
    205. Developments
    206. SWOT Analysis
    207. Key
    208. Strategies
    209. Sony
    210. Financial
    211. Overview
    212. Products Offered
    213. Key
    214. Developments
    215. SWOT Analysis
    216. Key
    217. Strategies
    218. Wikitude
    219. Financial
    220. Overview
    221. Products Offered
    222. Key
    223. Developments
    224. SWOT Analysis
    225. Key
    226. Strategies
    227. Augmented Reality Inc.
    228. Financial
    229. Overview
    230. Products Offered
    231. Key
    232. Developments
    233. SWOT Analysis
    234. Key
    235. Strategies
    236. References
    237. Related
    238. Reports
    239. LIST
    240. OF ASSUMPTIONS
    241. Japan Mobile Augmented Reality Market
    242. SIZE ESTIMATES & FORECAST, BY APPLICATION, 2019-2035 (USD Billions)
    243. Japan
    244. Mobile Augmented Reality Market SIZE ESTIMATES & FORECAST, BY DEVICE TYPE, 2019-2035
    245. (USD Billions)
    246. Japan Mobile Augmented Reality Market
    247. SIZE ESTIMATES & FORECAST, BY TECHNOLOGY, 2019-2035 (USD Billions)
    248. Japan
    249. Mobile Augmented Reality Market SIZE ESTIMATES & FORECAST, BY END USE, 2019-2035
    250. (USD Billions)
    251. PRODUCT LAUNCH/PRODUCT DEVELOPMENT/APPROVAL
    252. ACQUISITION/PARTNERSHIP
    253. LIST
    254. Of figures
    255. MARKET SYNOPSIS
    256. JAPAN
    257. MOBILE AUGMENTED REALITY MARKET ANALYSIS BY APPLICATION
    258. JAPAN
    259. MOBILE AUGMENTED REALITY MARKET ANALYSIS BY DEVICE TYPE
    260. JAPAN
    261. MOBILE AUGMENTED REALITY MARKET ANALYSIS BY TECHNOLOGY
    262. JAPAN
    263. MOBILE AUGMENTED REALITY MARKET ANALYSIS BY END USE
    264. KEY
    265. BUYING CRITERIA OF MOBILE AUGMENTED REALITY MARKET
    266. RESEARCH
    267. PROCESS OF MRFR
    268. DRO ANALYSIS OF MOBILE AUGMENTED REALITY
    269. MARKET
    270. DRIVERS IMPACT ANALYSIS: MOBILE AUGMENTED REALITY
    271. MARKET
    272. RESTRAINTS IMPACT ANALYSIS: MOBILE AUGMENTED REALITY
    273. MARKET
    274. SUPPLY / VALUE CHAIN: MOBILE AUGMENTED REALITY
    275. MARKET
    276. MOBILE AUGMENTED REALITY MARKET, BY APPLICATION,
    277. (% SHARE)
    278. MOBILE AUGMENTED REALITY MARKET, BY APPLICATION,
    279. TO 2035 (USD Billions)
    280. MOBILE AUGMENTED REALITY
    281. MARKET, BY DEVICE TYPE, 2025 (% SHARE)
    282. MOBILE AUGMENTED
    283. REALITY MARKET, BY DEVICE TYPE, 2019 TO 2035 (USD Billions)
    284. MOBILE
    285. AUGMENTED REALITY MARKET, BY TECHNOLOGY, 2025 (% SHARE)
    286. MOBILE
    287. AUGMENTED REALITY MARKET, BY TECHNOLOGY, 2019 TO 2035 (USD Billions)
    288. MOBILE
    289. AUGMENTED REALITY MARKET, BY END USE, 2025 (% SHARE)
    290. MOBILE
    291. AUGMENTED REALITY MARKET, BY END USE, 2019 TO 2035 (USD Billions)
    292. BENCHMARKING
    293. OF MAJOR COMPETITORS

    Japan Mobile Augmented Reality Market Segmentation

    • Mobile Augmented Reality Market By Application (USD Million, 2019-2035)

      • Gaming
      • Education
      • Retail
      • Healthcare
      • Real Estate


    • Mobile Augmented Reality Market By Device Type (USD Million, 2019-2035)

      • Smartphones
      • Tablets
      • Wearable Devices
      • Smart Glasses


    • Mobile Augmented Reality Market By Technology (USD Million, 2019-2035)

      • Marker-Based Augmented Reality
      • Markerless Augmented Reality
      • Projection-Based Augmented Reality
      • Superimposition-Based Augmented Reality


    • Mobile Augmented Reality Market By End Use (USD Million, 2019-2035)

      • Individual Users
      • Enterprise Users
      • Government


    No infographic available

    Free Sample Request

    Kindly complete the form below to receive a free sample of this Report

    Customer Strories

    “I am very pleased with how market segments have been defined in a relevant way for my purposes (such as "Portable Freezers & refrigerators" and "last-mile"). In general the report is well structured. Thanks very much for your efforts.”

    Victoria Milne Founder
    Case Study

    Chemicals and Materials