• Cat-intel
  • MedIntelliX
  • Resources
  • About Us
  • Request Free Sample ×

    Kindly complete the form below to receive a free sample of this Report

    Leading companies partner with us for data-driven Insights

    clients tt-cursor

    Hydrogenated Nitrile Butadiene Rubber Market

    ID: MRFR/CnM/5563-CR
    163 Pages
    Chitranshi Jaiswal
    September 2019

    Hydrogenated Nitrile Butadiene Rubber (HNBR) Market Research Report Information By Product (HNBR Solid [Belts & Cables, Seals & O-Rings, Hoses, Adhesives & Sealants, Foamed Products and others], HNBR Latex [Gloves, Non-Woven Fabric, Films & Coating, Paper Saturation] and others), By End-Use Industry (Automotive, Machinery, Oil & Gas, Medical, Construction, Others) - Forecast till 2030

    Share:
    Download PDF ×

    We do not share your information with anyone. However, we may send you emails based on your report interest from time to time. You may contact us at any time to opt-out.

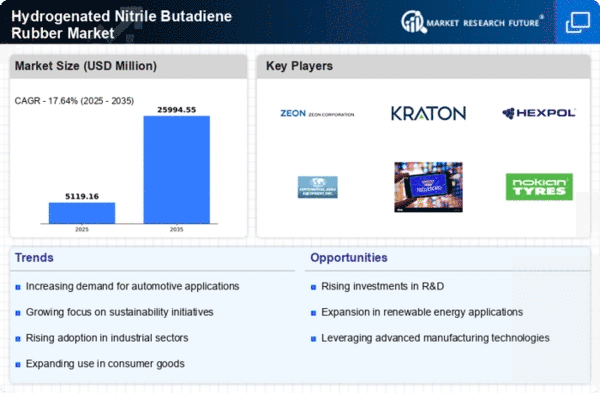
    Hydrogenated Nitrile Butadiene Rubber (HNBR) Market Global Research Report - Forecast till 2030 Infographic
    Purchase Options
    $ 4,950.0
    $ 5,950.0
    $ 7,250.0
    Table of Contents

    Hydrogenated Nitrile Butadiene Rubber Market Summary

    As per Market Research Future Analysis, the Global Hydrogenated Nitrile Butadiene Rubber (HNBR) Market is projected to grow at a CAGR of 9.7%, reaching USD 21.3 Billion by 2030. The primary driver for this growth is the increased consumption of HNBR in industrial and medical gloves. The automotive sector leads the end-use industries, accounting for 52% of the market share in 2018, driven by the demand for belts, seals, and hoses. The Asia-Pacific region dominated the market with a 42% share in 2018, and is expected to maintain the highest CAGR of 9.30% by 2025. However, the market faces challenges such as high manufacturing costs and potential health impacts from COVID-19, which temporarily affected production activities.

    Key Market Trends & Highlights

    Key trends influencing the HNBR market include rising demand across various sectors and significant R&D investments.

    • HNBR consumption in industrial and medical gloves is a primary growth driver.
    • The automotive sector accounted for 52% of the market share in 2018.
    • Asia-Pacific held the largest market share of 42% in 2018, with a projected CAGR of 9.30% by 2025.
    • High manufacturing costs are a significant restraint on market growth.

    Market Size & Forecast

    Current Market Size USD 21.3 Billion by 2030
    CAGR 9.7%
    Largest Regional Market Share in 2018 Asia-Pacific (42%)

    Major Players

    Arlanxeo (The Netherlands), Zeon Corporation (US), Polycomp (The Netherlands), Eriks NV (The Netherlands), Rahco Rubber, Inc. (US), Mantaline (US), Trelleborg Sealing Solutions (US), MCM SpA (Italy)

    Hydrogenated Nitrile Butadiene Rubber Market Trends

    The demand for hydrogenated nitrile butadiene rubber is anticipated to rise as industries increasingly prioritize materials that offer enhanced durability and resistance to harsh environments.

    U.S. Department of Energy

    Hydrogenated Nitrile Butadiene Rubber Market Drivers

    Expansion in Emerging Markets

    The Global Hydrogenated Nitrile Butadiene Rubber Market Industry is witnessing expansion in emerging markets, where industrialization and urbanization are accelerating. Countries in Asia-Pacific and Latin America are increasingly adopting hydrogenated nitrile butadiene rubber due to its superior properties and versatility across multiple applications. The growing automotive and oil and gas sectors in these regions are particularly driving demand. As these markets develop, the industry is poised for substantial growth, contributing to the overall market value projected to reach 6.96 USD Billion by 2035.

    Market Trends and Projections

    Growth in Oil and Gas Applications

    The Global Hydrogenated Nitrile Butadiene Rubber Market Industry is significantly influenced by the growth in oil and gas applications. This material is favored for its excellent resistance to oil, making it ideal for seals and gaskets used in drilling and extraction processes. As global energy demands rise, the oil and gas sector is expected to expand, thereby increasing the consumption of hydrogenated nitrile butadiene rubber. The industry's projected growth to 6.96 USD Billion by 2035 indicates a robust market potential, driven by the need for durable and reliable materials in challenging environments.

    Increasing Focus on Sustainability

    The Global Hydrogenated Nitrile Butadiene Rubber Market Industry is increasingly shaped by a focus on sustainability and eco-friendly materials. Manufacturers are exploring bio-based alternatives and recycling methods to reduce environmental impact. This shift is driven by regulatory pressures and consumer preferences for sustainable products. As industries strive to meet sustainability goals, the demand for hydrogenated nitrile butadiene rubber, which can be produced with lower environmental footprints, is expected to rise. This trend may further propel the market's growth, aligning with global efforts to promote sustainable practices across various sectors.

    Rising Demand from Automotive Sector

    The Global Hydrogenated Nitrile Butadiene Rubber Market Industry experiences a notable surge in demand from the automotive sector, primarily due to the increasing need for high-performance materials that can withstand extreme temperatures and harsh environments. Hydrogenated nitrile butadiene rubber is utilized in various automotive components, including seals, gaskets, and hoses, which require superior resistance to oils and fuels. As the automotive industry continues to evolve, with a projected market value of 2.62 USD Billion in 2024, the adoption of hydrogenated nitrile butadiene rubber is likely to expand significantly, contributing to the overall growth of the industry.

    Technological Advancements in Manufacturing

    Technological advancements in the manufacturing processes of hydrogenated nitrile butadiene rubber are enhancing the efficiency and quality of production. Innovations such as improved polymerization techniques and better compounding methods are enabling manufacturers to produce higher-grade materials that meet stringent industry standards. This evolution not only boosts the performance characteristics of hydrogenated nitrile butadiene rubber but also reduces production costs, making it more accessible to various industries. As a result, the Global Hydrogenated Nitrile Butadiene Rubber Market Industry is likely to witness a compound annual growth rate of 9.3% from 2025 to 2035, reflecting the positive impact of these advancements.

    Market Segment Insights

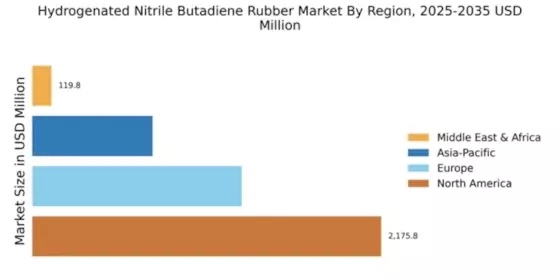
    Regional Insights

    Key Companies in the Hydrogenated Nitrile Butadiene Rubber Market market include

    Industry Developments

    September 2020: In deep blue and red, Apple launched two new braided Solo Loop Apple Watch Bands. "A patent application from Apple was published by the US Patent & Trademark Office covering the production of this new band, which Apple describes as "Stretchable recycled yarn interwoven with silicone threads, made of different elastic materials, including hydrogenated nitrile butadiene rubber, designed for ultra comfort without buckles or clasps.

    July 2020: Arlanxeo held a 24-hour synthetic rubber multimedia scientific marathon, featuring "world-class" lectures with more than 2,000 professionals participating. EPDM crosslinking chemistry and Arlanxeo's Therban HT, a plastic re-enforced hydrogenated nitrile butadiene rubber (HNBR) with enhanced high-temperature properties, were addressed in some of the main fields.

    Future Outlook

    Hydrogenated Nitrile Butadiene Rubber Market Future Outlook

    The Hydrogenated Nitrile Butadiene Rubber Market is projected to grow at a 9.3% CAGR from 2024 to 2035, driven by rising demand in automotive and industrial applications.

    New opportunities lie in:

    • Develop eco-friendly hydrogenated nitrile butadiene rubber formulations to meet sustainability goals.
    • Expand production capabilities in emerging markets to capture growing regional demand.
    • Invest in R&D for high-performance applications in aerospace and medical sectors.

    By 2035, the market is expected to achieve substantial growth, reflecting robust demand and innovation.

    Market Segmentation

    Report Overview

    By Product
    • HNBR Solid
    • HNBR Latex
    • Others
    By End-Use Industry
    • Automotive
    • Machinery
    • Oil & Gas
    • Medical
    • Construction
    • Others

    Report Scope

    Report Attribute/Metric Details
      Market Size   USD 21.3 billion 2030
      CAGR   9.7% (2021–2030)
      Base Year   2021
      Forecast Period   2021–2030
      Historical Data   2020
      Forecast Units   Value (USD Billion)
      Report Coverage   Revenue Forecast, Competitive Landscape, Growth Factors, and Trends
      Segments Covered   Product and End-Use
      Geographies Covered   North America, Europe, Asia-Pacific, and Rest of the World (RoW)
      Key Vendors   Arlanxeo (The Netherlands), Zeon Corporation (US), Polycomp (The Netherlands), Eriks NV (The Netherlands), Rahco Rubber, Inc. (US), Mantaline (US), Trelleborg Sealing Solutions (US), MCM SpA (Italy)
      Key Market Opportunities   Growing R&D Investments to Create Growth Avenues for Market Players
      Key Market Drivers   Growing Adoption from Oil & Gas Sector to Drive Market Growth

    Market Highlights

    Author
    Chitranshi Jaiswal
    Research Analyst Level I

    In her 3 years of experience in the market research field, she has handled critical cross-domain projects. She has an in-depth knowledge of market estimation & analysis, problem-solving, primary as well as secondary research, and team management.She holds an engineering degree and is an MBA professional from a well-known university, capable of evaluating the market and competitive conditions. An exceptional strategist with excellent communication skills and a passion for delivering cutting-edge & practical insights for the market. Proficient in multi-tasking, and can successfully deal with competing demands, while maintaining complete confidentiality. Generated business through active client and project development, networking, and high-quality responses. Her knowledge and skills have helped in making solid business decisions, securing funding from investors, and avoiding business failures.

    Leave a Comment

    FAQs

    At what CAGR is the hydrogenated nitrile butadiene rubber market expected to grow over the forecast period?

    The hydrogenated nitrile butadiene rubber market is predicted to grow at a 9.7% CAGR between 2021-2030.

    What will be the possible market valuation of the hydrogenated nitrile butadiene rubber market?

    The global hydrogenated nitrile butadiene rubber market is predicted to touch USD 21.3 billion by 2030.

    Which region will spearhead the hydrogenated nitrile butadiene rubber market?

    Asia Pacific is predicted to spearhead the hydrogenated nitrile butadiene rubber market.

    Which end use industry will dominate the hydrogenated nitrile butadiene rubber market?

    The automotive industry will dominate the hydrogenated nitrile butadiene rubber market.

    Which factors may limit the will dominate the hydrogenated nitrile butadiene rubber market growth?

    High manufacturing cost and raw material price may limit the market growth.

    1. Report Prologue
    2. Market Introduction
    3. Market Definition 24
      1. Scope Of The Study 24
        1. Research
    4. Objectives 24
      1. List Of Assumptions 25
      2. Market Structure
    5. Market Insights
      1. Key Takeaways 28
    6. Research
    7. Methodology
      1. Research Process 33
      2. Primary Research 34
      3. Secondary Research 35
      4. Market Size Estimation 35
      5. Forecast Model 36
    8. Market Dynamics
      1. Introduction
      2. Drivers 39
        1. Growing Use In Manufacturing Industrial
    9. And Medical Gloves 39
      1. High Demand In Automobiles And Machinery
        1. Surging Demand For HNBR In Oil & Gas Industry 40
      2. Restraint 41
        1. Relatively High Cost Of HNBR 41
    10. Opportunity 42
      1. Development Of Innovative Grades Of HNBR For The
    11. Automotive Industry 42
      1. Challenge 42
        1. Fluctuating
    12. Prices In The Global Elastomers Market 42
    13. Market Factor Analysis
      1. Supply Chain Analysis 44
        1. Raw Material Suppliers 44
        2. HNBR Manufacturers 44
        3. Distribution Channel 45
        4. End-Use Industry 45
      2. Porter’s Five Force Analysis
        1. Threat Of New Entrants 45
        2. Threat Of Rivalry
        3. Threat Of Substitutes 46
        4. Bargaining Power Of
    14. Suppliers 46
      1. Bargaining Power Of Buyers 46
    15. Global
    16. Hydrogenated Nitrile Butadiene Rubber (HNBR) Market, By Product
      1. Introduction
      2. HNBR Solid 50
        1. HNBR Solid, By Application 51
      3. HNBR Latex
        1. HNBR Latex, By Application 60
        2. Others 67
    17. Global
    18. Hydrogenated Nitrile Butadiene Rubber (HNBR) Market, By End-Use Industry
      1. Introduction 70
      2. Automotive 72
      3. Machinery 73
      4. Oil & Gas 74
      5. Medical 75
      6. Construction
      7. Others 78
    19. Global Hydrogenated Nitrile Butadiene Rubber
    20. (HNBR) Market, By Region
      1. Introduction 81
      2. North America
        1. U.S. 87
        2. Canada 91
      3. Europe 95
        1. Germany 99
        2. UK 103
        3. Russia 107
        4. France 110
        5. Spain 114
        6. Italy 118
        7. Poland 122
        8. Rest Of Europe 126
      4. Asia
    21. Pacific 130
      1. China 135
        1. Japan 139
    22. India 143
      1. Australia & New Zealand 147
        1. Indonesia
        2. South Korea 155
        3. Thailand 159
    23. Rest Of Asia-Pacific 163
      1. Latin America 167
        1. Mexico
        2. Brazil 175
        3. Argentina 179
    24. Rest Of Latin America 183
      1. Middle East & Africa 187
    25. Turkey 192
      1. UAE 195
        1. Saudi Arabia 199
    26. Rest Of Middle East & Africa 203
    27. Competitive Landscape
      1. Introduction 209
      2. Market Strategy Analysis 209
    28. Company Profiles
      1. Arlanxeo 212
        1. Company Overview
        2. Financial Overview 212
        3. Products Offered
        4. Key Developments 213
        5. SWOT Analysis 213
        6. Key Strategy 213
      2. Zeon Corporation 214
    29. Company Overview 214
      1. Financial Overview 214
    30. Products Offered 215
      1. Key Developments 215
        1. SWOT
    31. Analysis 216
      1. Key Strategy 216
      2. AirBoss Of America
    32. Corp. 217
      1. Company Overview 217
        1. Financial Overview
        2. Products Offered 217
        3. Key Developments 218
        4. SWOT Analysis 218
        5. Key Strategy 218
    33. Precision Associates, Inc. 219
      1. Company Overview 219
    34. Financial Overview 219
      1. Products Offered 219
    35. Key Developments 219
      1. SWOT Analysis 219
        1. Key Strategy
      2. Polycomp 220
        1. Company Overview
        2. Financial Overview 220
        3. Products Offered
        4. Key Developments 220
        5. SWOT Analysis 220
        6. Key Strategy 220
      3. ERIKS NV 221
        1. Company
    36. Overview 221
      1. Financial Overview 221
        1. Products
    37. Offered 221
      1. Key Developments 221
        1. SWOT Analysis
        2. Key Strategy 221
      2. Rahco Rubber, Inc. 222
        1. Company Overview 222
        2. Financial Overview 222
        3. Products Offered 222
        4. Key Developments 222
        5. SWOT Analysis 222
        6. Key Strategy 222
      3. Mantaline
        1. Company Overview 223
        2. Financial Overview
        3. Products Offered 223
        4. Key Developments 223
        5. SWOT Analysis 223
        6. Key Strategy 223
    38. Trelleborg Sealing Solutions 224
      1. Company Overview 224
        1. Financial Overview 224
        2. Products Offered 224
        3. Key Developments 225
        4. SWOT Analysis 225
    39. Key Strategy 225
      1. MCM S.P.A. 226
        1. Company Overview
        2. Financial Overview 226
        3. Products Offered
        4. Key Developments 226
        5. SWOT Analysis 226
        6. Key Strategy 226
    40. Conclusion
    41. ASSUMPTIONS 25
    42. MARKET, BY PRODUCT, 2020-2027 (USD MILLION) 48
    43. NITRILE BUTADIENE RUBBER (HNBR) MARKET, BY PRODUCT, 2020-2027 (KILO TONS) 49
    44. SOLID, BY REGION, 2020-2027
    45. (USD MILLION) 50
    46. HYDROGENATED NITRILE BUTADIENE RUBBER (HNBR) MARKET FOR HNBR SOLID, BY REGION, 2020-2027
    47. (KILO TONS) 50
    48. RUBBER (HNBR), BY SOLID APPLICATION, 2020-2027 (USD MILLION) 51
    49. GLOBAL HYDROGENATED NITRILE BUTADIENE RUBBER (HNBR) MARKET, BY SOLID APPLICATION,
    50. 2027 (KILO TONS) 52
    51. RUBBER (HNBR) MARKET FOR BELTS AND CABLES, BY REGION,
    52. 2027 (USD
    53. MILLION) 53
    54. MARKET FOR BELTS AND CABLES, BY REGION,
    55. 2027 (KILO TONS) 53
    56. & O-RINGS, BY REGION,
    57. 2027 (USD MILLION) 54
    58. GLOBAL HYDROGENATED NITRILE BUTADIENE RUBBER (HNBR) MARKET FOR SEALS & O-RINGS,
    59. BY REGION,
    60. 2027 (KILO TONS) 55
    61. NITRILE BUTADIENE RUBBER (HNBR) MARKET FOR HOSES, BY REGION, 2020-2027 (USD MILLION)
    62. FOR HOSES, BY REGION, 2020-2027 (KILO TONS) 56
    63. NITRILE BUTADIENE RUBBER (HNBR) MARKET FOR ADHESIVES & SEALANTS, BY REGION,
    64. 2027 (USD MILLION) 56
    65. BUTADIENE RUBBER (HNBR) MARKET FOR ADHESIVES & SEALANTS, BY REGION,
    66. 2027 (KILO TONS) 57
    67. RUBBER (HNBR) MARKET FOR FOAMED PRODUCTS, BY REGION,
    68. 2027 (USD MILLION)
    69. FOR FOAMED PRODUCTS, BY REGION,
    70. 2027 (KILO TONS) 58
    71. GLOBAL HYDROGENATED NITRILE BUTADIENE RUBBER (HNBR) MARKET FOR OTHERS, BY REGION,
    72. 2027 (USD MILLION) 58
    73. RUBBER (HNBR) MARKET FOR OTHERS, BY REGION, 2020-2027 (KILO TONS) 59
    74. GLOBAL HYDROGENATED NITRILE BUTADIENE RUBBER (HNBR) MARKET FOR HNBR LATEX, BY
    75. REGION, 2020-2027
    76. (USD MILLION) 59
    77. NITRILE BUTADIENE RUBBER (HNBR) MARKET FOR HNBR LATEX, BY REGION, 2020-2027 (KILO
    78. TONS) 60
    79. BY LATEX APPLICATION, 2020-2027 (USD MILLION) 61
    80. NITRILE BUTADIENE RUBBER (HNBR) MARKET, LATEX APPLICATION, 2020-2027 (KILO TONS)
    81. FOR GLOVES, BY REGION, 2020-2027 (USD MILLION) 63
    82. NITRILE BUTADIENE RUBBER (HNBR) MARKET FOR GLOVES, BY REGION, 2020-2027 (KILO TONS)
    83. FOR NON-WOVEN FABRIC, BY REGION,
    84. 2027 (USD MILLION) 64
    85. FABRIC, BY REGION,
    86. 2027 (KILO TONS) 65
    87. HYDROGENATED NITRILE BUTADIENE RUBBER (HNBR) MARKET FOR FILMS AND COATING, BY REGION,
    88. 2027 (USD MILLION) 65
    89. BUTADIENE RUBBER (HNBR)MARKET FOR FILMS AND COATING, BY REGION,
    90. (KILO TONS) 66
    91. (HNBR) MARKET FOR PAPER SATURATION, BY REGION,
    92. 2027 (USD MILLION)
    93. FOR PAPER SATURATION, BY REGION,
    94. 2027 (KILO TONS) 67
    95. GLOBAL HYDROGENATED NITRILE BUTADIENE RUBBER (HNBR) MARKET FOR OTHERS, BY REGION,
    96. 2027 (USD MILLION) 67
    97. RUBBER (HNBR) MARKET FOR OTHERS, BY REGION, 2020-2027 (KILO TONS) 68
    98. GLOBAL HYDROGENATED NITRILE BUTADIENE RUBBER (HNBR), BY END-USE INDUSTRY, 2020-2027
    99. (USD MILLION) 70
    100. (HNBR) MARKET, BY END-USE INDUSTRY, 2020-2027 (KILO TONS) 71
    101. GLOBAL HYDROGENATED NITRILE BUTADIENE RUBBER (HNBR) MARKET FOR AUTOMOTIVE, BY REGION,
    102. 2027 (KILO TONS) 72
    103. RUBBER (HNBR) MARKET FOR MACHINERY, BY REGION, 2020-2027
    104. (USD MILLION)
    105. FOR MACHINERY, BY REGION, 2020-2027 (KILO TONS) 74
    106. NITRILE BUTADIENE RUBBER (HNBR) MARKET FOR OIL & GAS, BY REGION, 2020-2027 (USD
    107. MILLION) 74
    108. MARKET FOR OIL & GAS, BY REGION, 2020-2027 (KILO TONS) 75
    109. GLOBAL HYDROGENATED NITRILE BUTADIENE RUBBER (HNBR) MARKET FOR MEDICAL, BY REGION,
    110. 2027 (KILO TONS) 76
    111. RUBBER (HNBR) MARKET FOR CONSTRUCTION, BY REGION, 2020-2027
    112. (USD MILLION)
    113. FOR CONSTRUCTION, BY REGION, 2020-2027
    114. (KILO TONS) 77
    115. GLOBAL HYDROGENATED NITRILE BUTADIENE RUBBER (HNBR) MARKET FOR OTHERS, BY REGION,
    116. 2027 (USD MILLION) 78
    117. RUBBER (HNBR) MARKET FOR OTHERS, BY REGION, 2020-2027 (KILO TONS) 79
    118. GLOBAL HYDROGENATED NITRILE BUTADIENE RUBBER (HNBR) MARKET, BY REGION, 2020-2027
    119. (USD MILLION) 81
    120. (HNBR) MARKET, BY REGION, 2020-2027 (KILO TONS) 82
    121. HYDROGENATED NITRILE BUTADIENE RUBBER (HNBR) MARKET, BY COUNTRY, 2020-2027 (USD
    122. MILLION) 83
    123. (HNBR) MARKET, BY COUNTRY, 2020-2027 (KILO TONS) 83
    124. HYDROGENATED NITRILE BUTADIENE RUBBER (HNBR) MARKET, BY PRODUCT, 2020-2027 (USD
    125. MILLION) 83
    126. (HNBR) MARKET, BY PRODUCT, 2020-2027 (KILO TONS) 84
    127. HYDROGENATED NITRILE BUTADIENE RUBBER (HNBR) MARKET, BY SOLID APPLICATION, 2020-2027
    128. (USD MILLION) 84
    129. BUTADIENE RUBBER (HNBR) MARKET, BY SOLID APPLICATION, 2020-2027
    130. (KILO
    131. TONS) 85
    132. (HNBR) MARKET, BY LATEX APPLICATION, 2020-2027
    133. (USD MILLION) 85
    134. LATEX APPLICATION, 2020-2027
    135. (KILO TONS) 86
    136. AMERICA HYDROGENATED NITRILE BUTADIENE RUBBER (HNBR) MARKET, BY END-USE INDUSTRY,
    137. (USD MILLION) 86
    138. NITRILE BUTADIENE RUBBER (HNBR) MARKET, BY END-USE INDUSTRY, 2020-2027
    139. (KILO TONS) 87
    140. (HNBR) MARKET, BY PRODUCT, 2020-2027 (USD MILLION) 87
    141. NITRILE BUTADIENE RUBBER (HNBR) MARKET, BY PRODUCT, 2020-2027 (KILO TONS) 88
    142. APPLICATION, 2020-2027 (USD MILLION) 88
    143. BUTADIENE RUBBER (HNBR) MARKET, BY SOLID APPLICATION, 2020-2027 (KILO TONS) 89
    144. APPLICATION, 2020-2027 (USD MILLION) 89
    145. BUTADIENE RUBBER (HNBR) MARKET, BY LATEX APPLICATION, 2020-2027 (KILO TONS) 90
    146. INDUSTRY, 2020-2027 (USD MILLION) 90
    147. BUTADIENE RUBBER (HNBR) MARKET, BY END-USE INDUSTRY, 2020-2027 (KILO TONS) 91
    148. PRODUCT, 2020-2027 (USD MILLION) 91
    149. BUTADIENE RUBBER (HNBR) MARKET, BY PRODUCT, 2020-2027 (KILO TONS) 91
    150. CANADA HYDROGENATED NITRILE BUTADIENE RUBBER (HNBR) MARKET, BY SOLID APPLICATION,
    151. 2027 (USD MILLION) 92
    152. RUBBER (HNBR) MARKET, BY SOLID APPLICATION, 2020-2027 (KILO TONS) 92
    153. CANADA HYDROGENATED NITRILE BUTADIENE RUBBER (HNBR) MARKET, BY LATEX APPLICATION,
    154. 2027 (USD MILLION) 93
    155. RUBBER (HNBR) MARKET, BY LATEX APPLICATION, 2020-2027 (KILO TONS) 93
    156. CANADA HYDROGENATED NITRILE BUTADIENE RUBBER (HNBR) MARKET, BY END-USE INDUSTRY,
    157. 2027 (USD MILLION) 94
    158. RUBBER (HNBR) MARKET, BY END-USE INDUSTRY, 2020-2027 (KILO TONS) 94
    159. EUROPE HYDROGENATED NITRILE BUTADIENE RUBBER (HNBR) MARKET, BY COUNTRY, 2020-2027
    160. (USD MILLION) 95
    161. (HNBR) MARKET, BY COUNTRY, 2020-2027 (KILO TONS) 95
    162. NITRILE BUTADIENE RUBBER (HNBR) MARKET, BY PRODUCT, 2020-2027 (USD MILLION) 96
    163. PRODUCT, 2020-2027 (KILO TONS) 96
    164. BUTADIENE RUBBER (HNBR) MARKET, BY SOLID APPLICATION, 2020-2027 (USD MILLION) 96
    165. SOLID APPLICATION, 2020-2027 (KILO TONS) 97
    166. NITRILE BUTADIENE RUBBER (HNBR) MARKET, BY LATEX APPLICATION, 2020-2027 (USD MILLION)
    167. BY LATEX APPLICATION, 2020-2027 (KILO TONS) 98
    168. NITRILE BUTADIENE RUBBER (HNBR) MARKET, BY END-USE INDUSTRY, 2020-2027 (USD MILLION)
    169. BY END-USE INDUSTRY, 2020-2027 (KILO TONS) 99
    170. NITRILE BUTADIENE RUBBER (HNBR) MARKET, BY PRODUCT, 2020-2027 (USD MILLION) 99
    171. PRODUCT, 2020-2027 (KILO TONS) 100
    172. BUTADIENE RUBBER (HNBR) MARKET, BY SOLID APPLICATION, 2020-2027 (USD MILLION) 100
    173. SOLID APPLICATION, 2020-2027 (KILO TONS) 101
    174. NITRILE BUTADIENE RUBBER (HNBR) MARKET, BY LATEX APPLICATION, 2020-2027 (USD MILLION)
    175. BY LATEX APPLICATION, 2020-2027 (KILO TONS) 102
    176. NITRILE BUTADIENE RUBBER (HNBR) MARKET, BY END-USE INDUSTRY, 2020-2027 (USD MILLION)
    177. BY END-USE INDUSTRY, 2020-2027 (KILO TONS) 103
    178. NITRILE BUTADIENE RUBBER (HNBR) MARKET, BY PRODUCT, 2020-2027 (USD MILLION) 103
    179. 2027 (KILO TONS) 103
    180. RUBBER (HNBR) MARKET, BY SOLID APPLICATION, 2020-2027 (USD MILLION) 104
    181. 2027 (KILO TONS) 104
    182. RUBBER (HNBR) MARKET, BY LATEX APPLICATION, 2020-2027 (USD MILLION) 105
    183. 2027 (KILO TONS) 105
    184. RUBBER (HNBR) MARKET, BY END-USE INDUSTRY, 2020-2027 (USD MILLION) 106
    185. 2027 (KILO TONS) 106
    186. RUBBER (HNBR) MARKET, BY PRODUCT, 2020-2027 (USD MILLION) 107
    187. RUSSIA HYDROGENATED NITRILE BUTADIENE RUBBER (HNBR) MARKET, BY PRODUCT, 2020-2027
    188. (KILO TONS) 107
    189. (HNBR) MARKET, BY SOLID APPLICATION, 2020-2027 (USD MILLION) 107
    190. RUSSIA HYDROGENATED NITRILE BUTADIENE RUBBER (HNBR) MARKET, BY SOLID APPLICATION,
    191. 2027 (KILO TONS) 108
    192. RUBBER (HNBR) MARKET, BY LATEX APPLICATION, 2020-2027 (USD MILLION) 108
    193. APPLICATION, 2020-2027 (KILO TONS) 109
    194. NITRILE BUTADIENE RUBBER (HNBR) MARKET, BY END-USE INDUSTRY, 2020-2027 (USD MILLION)
    195. BY END-USE INDUSTRY, 2020-2027 (KILO TONS) 110
    196. NITRILE BUTADIENE RUBBER (HNBR) MARKET, BY PRODUCT, 2020-2027 (USD MILLION) 110
    197. PRODUCT, 2020-2027 (KILO TONS) 111
    198. BUTADIENE RUBBER (HNBR) MARKET, BY SOLID APPLICATION, 2020-2027 (USD MILLION) 111
    199. SOLID APPLICATION, 2020-2027 (KILO TONS) 112
    200. NITRILE BUTADIENE RUBBER (HNBR) MARKET, BY LATEX APPLICATION, 2020-2027 (USD MILLION)
    201. BY LATEX APPLICATION, 2020-2027 (KILO TONS) 113
    202. NITRILE BUTADIENE RUBBER (HNBR) MARKET, BY END-USE INDUSTRY, 2020-2027 (USD MILLION)
    203. BY END-USE INDUSTRY, 2020-2027 (KILO TONS) 114
    204. NITRILE BUTADIENE RUBBER (HNBR) MARKET, BY PRODUCT, 2020-2027 (USD MILLION) 114
    205. PRODUCT, 2020-2027 (KILO TONS) 115
    206. BUTADIENE RUBBER (HNBR) MARKET, BY SOLID APPLICATION, 2020-2027 (USD MILLION) 115
    207. SOLID APPLICATION, 2020-2027 (KILO TONS) 116
    208. NITRILE BUTADIENE RUBBER (HNBR) MARKET, BY LATEX APPLICATION, 2020-2027 (USD MILLION)
    209. BY LATEX APPLICATION, 2020-2027 (KILO TONS) 117
    210. NITRILE BUTADIENE RUBBER (HNBR) MARKET, BY END-USE INDUSTRY, 2020-2027 (USD MILLION)
    211. BY END-USE INDUSTRY, 2020-2027 (KILO TONS) 118
    212. NITRILE BUTADIENE RUBBER (HNBR) MARKET, BY PRODUCT, 2020-2027 (USD MILLION) 118
    213. PRODUCT, 2020-2027 (KILO TONS) 119
    214. BUTADIENE RUBBER (HNBR) MARKET, BY SOLID APPLICATION, 2020-2027 (USD MILLION) 119
    215. SOLID APPLICATION, 2020-2027 (KILO TONS) 120
    216. NITRILE BUTADIENE RUBBER (HNBR) MARKET, BY LATEX APPLICATION, 2020-2027 (USD MILLION)
    217. BY LATEX APPLICATION, 2020-2027 (KILO TONS) 121
    218. NITRILE BUTADIENE RUBBER (HNBR) MARKET, BY END-USE INDUSTRY, 2020-2027 (USD MILLION)
    219. BY END-USE INDUSTRY, 2020-2027 (KILO TONS) 122
    220. NITRILE BUTADIENE RUBBER (HNBR) MARKET, BY PRODUCT, 2020-2027 (USD MILLION) 122
    221. PRODUCT, 2020-2027 (KILO TONS) 123
    222. BUTADIENE RUBBER (HNBR) MARKET, BY SOLID APPLICATION, 2020-2027 (USD MILLION) 123
    223. SOLID APPLICATION, 2020-2027 (KILO TONS) 124
    224. NITRILE BUTADIENE RUBBER (HNBR) MARKET, BY LATEX APPLICATION, 2020-2027 (USD MILLION)
    225. BY LATEX APPLICATION, 2020-2027 (KILO TONS) 125
    226. NITRILE BUTADIENE RUBBER (HNBR) MARKET, BY END-USE INDUSTRY, 2020-2027 (USD MILLION)
    227. BY END-USE INDUSTRY, 2020-2027 (KILO TONS) 126
    228. HYDROGENATED NITRILE BUTADIENE RUBBER (HNBR) MARKET, BY PRODUCT, 2020-2027 (USD
    229. MILLION) 126
    230. RUBBER (HNBR) MARKET, BY PRODUCT, 2020-2027 (KILO TONS) 127
    231. REST OF EUROPE HYDROGENATED NITRILE BUTADIENE RUBBER (HNBR) MARKET, BY SOLID APPLICATION,
    232. (USD MILLION) 127
    233. NITRILE BUTADIENE RUBBER (HNBR) MARKET, BY SOLID APPLICATION, 2020-2027
    234. (KILO TONS) 128
    235. RUBBER (HNBR) MARKET, BY LATEX APPLICATION, 2020-2027
    236. (USD MILLION) 128
    237. BY LATEX APPLICATION, 2020-2027
    238. (KILO TONS) 129
    239. REST OF EUROPE HYDROGENATED NITRILE BUTADIENE RUBBER (HNBR) MARKET, BY END-USE INDUSTRY,
    240. (USD MILLION) 129
    241. NITRILE BUTADIENE RUBBER (HNBR) MARKET, BY END-USE INDUSTRY, 2020-2027
    242. (KILO TONS) 130
    243. RUBBER (HNBR) MARKET, BY COUNTRY, 2020-2027 (USD MILLION) 130
    244. ASIA PACIFIC HYDROGENATED NITRILE BUTADIENE RUBBER (HNBR) MARKET, BY COUNTRY, 2020-2027
    245. (KILO TONS) 131
    246. RUBBER (HNBR) MARKET, BY PRODUCT, 2020-2027 (USD MILLION) 131
    247. ASIA PACIFIC HYDROGENATED NITRILE BUTADIENE RUBBER (HNBR) MARKET, BY PRODUCT, 2020-2027
    248. (KILO TONS) 132
    249. RUBBER (HNBR) MARKET, BY SOLID APPLICATION, 2020-2027
    250. (USD MILLION) 132
    251. BY SOLID APPLICATION, 2020-2027
    252. (KILO TONS) 133
    253. ASIA PACIFIC HYDROGENATED NITRILE BUTADIENE RUBBER (HNBR) MARKET, BY LATEX APPLICATION,
    254. (USD MILLION) 133
    255. NITRILE BUTADIENE RUBBER (HNBR) MARKET, BY LATEX APPLICATION, 2020-2027 (KILO TONS)
    256. MARKET, BY END-USE INDUSTRY, 2020-2027 (USD MILLION) 134
    257. PACIFIC HYDROGENATED NITRILE BUTADIENE RUBBER (HNBR) MARKET, BY END-USE INDUSTRY,
    258. 2027 (KILO TONS) 135
    259. RUBBER (HNBR) MARKET, BY PRODUCT, 2020-2027 (USD MILLION) 135
    260. CHINA HYDROGENATED NITRILE BUTADIENE RUBBER (HNBR) MARKET, BY PRODUCT, 2020-2027
    261. (KILO TONS) 136
    262. (HNBR) MARKET, BY SOLID APPLICATION, 2020-2027 (USD MILLION) 136
    263. CHINA HYDROGENATED NITRILE BUTADIENE RUBBER (HNBR) MARKET, BY SOLID APPLICATION,
    264. 2027 (KILO TONS) 137
    265. RUBBER (HNBR) MARKET, BY LATEX APPLICATION, 2020-2027 (USD MILLION) 137
    266. APPLICATION, 2020-2027 (KILO TONS) 138
    267. BUTADIENE RUBBER (HNBR) MARKET, BY END-USE INDUSTRY, 2020-2027 (USD MILLION) 138
    268. END-USE INDUSTRY, 2020-2027 (KILO TONS) 139
    269. NITRILE BUTADIENE RUBBER (HNBR) MARKET, BY PRODUCT, 2020-2027 (USD MILLION) 139
    270. PRODUCT, 2020-2027 (KILO TONS) 140
    271. BUTADIENE RUBBER (HNBR) MARKET, BY SOLID APPLICATION, 2020-2027 (USD MILLION) 140
    272. SOLID APPLICATION, 2020-2027 (KILO TONS) 141
    273. NITRILE BUTADIENE RUBBER (HNBR) MARKET, BY LATEX APPLICATION, 2020-2027 (USD MILLION)
    274. BY LATEX APPLICATION, 2020-2027 (KILO TONS) 142
    275. NITRILE BUTADIENE RUBBER (HNBR) MARKET, BY END-USE INDUSTRY, 2020-2027 (USD MILLION)
    276. BY END-USE INDUSTRY, 2020-2027 (KILO TONS) 143
    277. NITRILE BUTADIENE RUBBER (HNBR) MARKET, BY PRODUCT, 2020-2027 (USD MILLION) 143
    278. PRODUCT, 2020-2027 (KILO TONS) 144
    279. BUTADIENE RUBBER (HNBR) MARKET, BY SOLID APPLICATION, 2020-2027 (USD MILLION) 144
    280. SOLID APPLICATION, 2020-2027 (KILO TONS) 145
    281. NITRILE BUTADIENE RUBBER (HNBR) MARKET, BY LATEX APPLICATION, 2020-2027 (USD MILLION)
    282. BY LATEX APPLICATION, 2020-2027 (KILO TONS) 146
    283. NITRILE BUTADIENE RUBBER (HNBR) MARKET, BY END-USE INDUSTRY, 2020-2027 (USD MILLION)
    284. BY END-USE INDUSTRY, 2020-2027 (KILO TONS) 147
    285. NEW ZEALAND HYDROGENATED NITRILE BUTADIENE RUBBER (HNBR) MARKET, BY PRODUCT,
    286. 2027 (USD MILLION) 147
    287. HYDROGENATED NITRILE BUTADIENE RUBBER (HNBR) MARKET, BY PRODUCT,
    288. (KILO TONS) 148
    289. BUTADIENE RUBBER (HNBR) MARKET, BY SOLID APPLICATION,
    290. 2027 (USD
    291. MILLION) 148
    292. BUTADIENE RUBBER (HNBR) MARKET, BY SOLID APPLICATION,
    293. 2027 (KILO
    294. TONS) 149
    295. BUTADIENE RUBBER (HNBR) MARKET, BY LATEX APPLICATION,
    296. 2027 (USD
    297. MILLION) 149
    298. BUTADIENE RUBBER (HNBR) MARKET, BY LATEX APPLICATION,
    299. 2027 (KILO
    300. TONS) 150
    301. BUTADIENE RUBBER (HNBR) MARKET, BY END-USE INDUSTRY,
    302. 2027 (USD MILLION)
    303. RUBBER (HNBR) MARKET, BY END-USE INDUSTRY,
    304. 2027 (KILO TONS) 151
    305. BY PRODUCT, 2020-2027 (USD MILLION) 151
    306. NITRILE BUTADIENE RUBBER (HNBR) MARKET, BY PRODUCT, 2020-2027 (KILO TONS) 152
    307. BY SOLID APPLICATION, 2020-2027 (USD MILLION) 152
    308. HYDROGENATED NITRILE BUTADIENE RUBBER (HNBR) MARKET, BY SOLID APPLICATION, 2020-2027
    309. (KILO TONS) 153
    310. (HNBR) MARKET, BY LATEX APPLICATION, 2020-2027 (USD MILLION) 153
    311. INDONESIA HYDROGENATED NITRILE BUTADIENE RUBBER (HNBR) MARKET, BY LATEX APPLICATION,
    312. 2027 (KILO TONS) 154
    313. RUBBER (HNBR) MARKET, BY END-USE INDUSTRY, 2020-2027 (USD MILLION) 154
    314. INDUSTRY, 2020-2027 (KILO TONS) 155
    315. NITRILE BUTADIENE RUBBER (HNBR) MARKET, BY PRODUCT, 2020-2027 (USD MILLION) 155
    316. BY PRODUCT, 2020-2027 (KILO TONS) 156
    317. NITRILE BUTADIENE RUBBER (HNBR) MARKET, BY SOLID APPLICATION,

    Hydrogenated Nitrile Butadiene Rubber (HNBR) Market Segmentation

    Market Segmentation Overview

    • Detailed segmentation data will be available in the full report
    • Comprehensive analysis by multiple parameters
    • Regional and country-level breakdowns
    • Market size forecasts by segment
    Hydrogenated Nitrile Butadiene Rubber (HNBR) Market Global Research Report - Forecast till 2030 Infographic
    Free Sample Request

    Kindly complete the form below to receive a free sample of this Report

    Customer Strories

    “I am very pleased with how market segments have been defined in a relevant way for my purposes (such as "Portable Freezers & refrigerators" and "last-mile"). In general the report is well structured. Thanks very much for your efforts.”

    Victoria Milne Founder
    Case Study

    Chemicals and Materials