• Cat-intel
  • MedIntelliX
  • Resources
  • About Us
  • Request Free Sample ×

    Kindly complete the form below to receive a free sample of this Report

    Leading companies partner with us for data-driven Insights

    clients tt-cursor

    High Purity Ultra Pure Ga Market

    ID: MRFR/CnM/29220-HCR
    111 Pages
    Chitranshi Jaiswal
    September 2025

    High Purity Ultra Pure Ga Market Research Report: By Application (Electronic Circuitry, Semiconductor Production, Medical Materials, Optical Components, Scientific Research), By Purity Level (99.99% to 99.9999%) (99.99%, 99.999%, 99.9999%, 99.99999%), By Form (Gallium (GA), Gallium Arsenide (GaAs), Gallium Nitride (GaN)), By Packaging (Ingots, Wafers, Powder, Liquids), By End-User Industry (Electronics Manufacturing, Semiconductor Industry, Medical and Healthcare, Aerospace and Defense, Research and Development) and By Regional (North Americ...

    Share:
    Download PDF ×

    We do not share your information with anyone. However, we may send you emails based on your report interest from time to time. You may contact us at any time to opt-out.

    High Purity Ultra Pure Ga Market Research Report - Global Forecast by 2034 Infographic
    Purchase Options
    $ 4,950.0
    $ 5,950
    $ 7,250.0
    Table of Contents

    High Purity Ultra Pure Ga Market Summary

    The Global High Purity Ultra Pure Ga Market is projected to grow significantly over the next decade.

    Key Market Trends & Highlights

    High Purity Ultra Pure Ga Key Trends and Highlights

    • The market valuation is expected to increase from 750 USD Million in 2024 to 1500 USD Million by 2035.
    • A compound annual growth rate (CAGR) of 6.5 percent is anticipated from 2025 to 2035.
    • The demand for high purity ultra pure gallium is likely driven by advancements in semiconductor technology.
    • Growing adoption of semiconductor applications due to increasing electronic device production is a major market driver.

    Market Size & Forecast

    2024 Market Size 750 (USD Million)
    2035 Market Size 1500 (USD Million)
    CAGR (2025 - 2035) 6.5%

    Major Players

    Apple Inc (US), Microsoft Corp (US), Amazon.com Inc (US), Alphabet Inc (US), Berkshire Hathaway Inc (US), Tesla Inc (US), Meta Platforms Inc (US), Johnson & Johnson (US), Visa Inc (US), Procter & Gamble Co (US)

    High Purity Ultra Pure Ga Market Trends

    The High Purity Ultra Pure Ga Market is experiencing significant growth, driven by increasing demand from various industries. The electronics industry is a major consumer of high purity ultra pure Ga (HPUPG), primarily used in the production of III-V compound semiconductors for optoelectronic devices, lasers, and other applications. Additionally, HPUPG finds applications in the solar industry for manufacturing high-efficiency solar cells. The rising demand for these applications is fueling market growth.Another key market driver is the growing adoption of HPUPG in the semiconductor industry.

    The increasing miniaturization of electronic devices has led to a need for materials with high purity and low defect density. HPUPG meets these requirements, making it a preferred choice for the production of advanced semiconductors.Recent trends in the High Purity Ultra Pure Ga Market include the development of new purification techniques. These techniques are aimed at improving the purity and reducing the defect density of HPUPG, making it suitable for more demanding applications. Additionally, research and development efforts are focused on exploring new applications for HPUPG, such as in the medical and aerospace industries.

    The increasing demand for high purity gallium in advanced semiconductor applications is poised to drive substantial growth in the global market, reflecting a broader trend towards enhanced material quality in technology sectors.

    U.S. Geological Survey

    High Purity Ultra Pure Ga Market Drivers

    Market Growth Projections

    Rising Demand for Electronics

    The Global High Purity Ultra Pure Ga Market Industry is experiencing a surge in demand driven by the electronics sector. As technology advances, the need for high-purity gallium in semiconductor manufacturing becomes increasingly critical. In 2024, the market is projected to reach 750 USD Million, reflecting the growing reliance on gallium for high-performance electronic devices. This trend is expected to continue, with projections indicating that by 2035, the market could expand to 1500 USD Million. The compound annual growth rate (CAGR) from 2025 to 2035 is estimated at 6.5%, highlighting the robust growth potential within the electronics industry.

    Growth in LED Lighting Applications

    The Global High Purity Ultra Pure Ga Market Industry is also benefiting from the expansion of LED lighting applications. Gallium nitride, a compound derived from gallium, is a key material in the production of LEDs, which are favored for their energy efficiency and longevity. As urbanization accelerates and energy efficiency regulations tighten, the adoption of LED lighting solutions is expected to rise. This shift not only enhances energy savings but also drives demand for high-purity gallium. Consequently, the market is poised for growth, reflecting the increasing integration of gallium-based technologies in lighting solutions.

    Advancements in Renewable Energy Technologies

    The Global High Purity Ultra Pure Ga Market Industry is significantly influenced by advancements in renewable energy technologies. Gallium is increasingly utilized in the production of photovoltaic cells, which are essential for solar energy systems. As countries worldwide prioritize renewable energy sources, the demand for gallium is likely to rise. The integration of gallium into solar panels enhances their efficiency, thereby supporting the transition to sustainable energy. This trend aligns with global efforts to reduce carbon emissions and could further bolster the market's growth trajectory, contributing to the anticipated increase in market value over the next decade.

    Government Initiatives Supporting High Purity Materials

    The Global High Purity Ultra Pure Ga Market Industry is positively impacted by government initiatives aimed at promoting the use of high-purity materials. Various countries are implementing policies to support the development and utilization of advanced materials in key industries such as electronics and renewable energy. These initiatives often include funding for research and development, as well as incentives for companies to adopt high-purity materials in their production processes. Such support is likely to enhance the market landscape for high-purity gallium, fostering innovation and driving demand across multiple sectors.

    Technological Innovations in Semiconductor Manufacturing

    The Global High Purity Ultra Pure Ga Market Industry is propelled by ongoing technological innovations in semiconductor manufacturing. The increasing complexity of semiconductor devices necessitates the use of high-purity gallium to ensure optimal performance and reliability. As manufacturers strive to produce smaller, faster, and more efficient chips, the demand for ultra-pure gallium is likely to escalate. This trend is indicative of the broader shift towards advanced manufacturing techniques that prioritize quality and precision. The market's growth is expected to mirror these advancements, positioning gallium as a critical component in the future of semiconductor technology.

    Market Segment Insights

    High Purity Ultra Pure Ga Market Application Insights

    Application Segment Insight and Overview The High Purity Ultra Pure Ga Market is segmented into various applications, including Electronic Circuitry, Semiconductor Production, Medical Materials, Optical Components and Scientific Research. Each segment offers unique growth opportunities and challenges, shaping the overall market dynamics. Electronic Circuitry holds a significant share of the High Purity Ultra Pure Ga Market revenue, driven by the increasing demand for high-performance electronic devices. Ga is used as an interconnect material in advanced semiconductor packaging, providing superior electrical and thermal conductivity.The Semiconductor Production segment is another major contributor to the market.

    Ga is employed in the manufacturing of gallium arsenide (GaAs) semiconductors, which are crucial for applications in high-speed electronics, solar cells and light-emitting diodes (LEDs). Medical Materials is a growing segment of the High Purity Ultra Pure Ga Market. Ga is used in medical implants, such as stents and bone screws, due to its excellent biocompatibility and corrosion resistance. Furthermore, Ga-based alloys are gaining traction in the development of novel drug delivery systems and diagnostic imaging agents.Optical Components represent a niche segment of the market.

    Ga is incorporated into optical fibers and lenses, taking advantage of its high refractive index and low optical loss. This segment is expected to witness steady growth driven by the increasing demand for high-speed data transmission and optical devices. Scientific Research applications account for a portion of the High Purity Ultra Pure Ga Market. Ga is used in various research fields, including materials science, energy storage and catalysis.

    Its unique properties make it a valuable tool for fundamental research and the development of new technologies.Overall, the High Purity Ultra Pure Ga Market is expected to register a steady growth rate over the coming years, driven by advancements in electronics, semiconductors, and other application areas. Market participants are focusing on developing innovative Ga-based solutions to meet the evolving needs of various industries.

    Source: Primary Research, Secondary Research, Market Research Future Database and Analyst Review

    High Purity Ultra Pure Ga Market Purity Level (99.99% to 99.9999%) Insights

    The High Purity Ultra Pure Ga Market is divided on the premise of Purity Level (99.99% to 99.9999% ). The 99.99% section represented the largest market share in 2023 owing to the growing use in the industry of electronics. The 99.99%, 99.999%, and 99.9999% sections, on the other hand, are expected to experience the most rapid growth over the forecast period. As a result of the increased demand for electronics, the semiconductor industry is growing in adoption.

    High purity levels are used to manufacture high-performance electronic devices, such as smartphones, laptops, and tablets.As a result of the increasing adoption of these gadgets, demand for high-purity Ultra Pure Ga has increased. Government-backed programs to increase the semiconductor sector in several nations are projected to drive market growth even further.

    High Purity Ultra Pure Ga Market Form Insights

    The High Purity Ultra Pure Ga Market is segmented by Form into Gallium (Ga), Gallium Arsenide (GaAs) and Gallium Nitride (GaN). Gallium (Ga) is the most common form of High Purity Ultra Pure Ga and is used in a variety of applications, including semiconductors, solar cells, and LEDs. Gallium Arsenide (GaAs) is a compound semiconductor that is used in high-power and high-frequency electronic devices. Gallium Nitride (GaN) is a wide-band gap semiconductor that is used in high-power and high-efficiency electronic devices.

    The High Purity Ultra Pure Ga Market for Gallium (Ga) is expected to grow from USD 1.23 billion in 2023 to USD 1.87 billion by 2032, at a CAGR of 4.5%.The High Purity Ultra Pure Ga Market for Gallium Arsenide (GaAs) is expected to grow from USD 0.67 billion in 2023 to USD 1.02 billion by 2032, at a CAGR of 4.9%. The High Purity Ultra Pure Ga Market for Gallium Nitride (GaN) is expected to grow from USD 0.25 billion in 2023 to USD 0.38 billion by 2032, at a CAGR of 4.7%.

    High Purity Ultra Pure Ga Market Packaging Insights

    The Packaging segment of the High Purity Ultra Pure Ga Market is expected to witness significant growth in the coming years. Ingots, wafers, powder, and liquids are the primary packaging formats for high-purity ultra-pure Ga. Ingots are the most common packaging format, accounting for over 50% of the market share. They are preferred for their ease of handling and storage. Wafers are another popular packaging format, and they are used in various semiconductor applications.

    Powder and liquids are also used for specific applications, such as in the production of high-purity chemicals and pharmaceuticals.The growth of the market is attributed to the increasing demand for high purity ultra pure Ga in the electronics industry, particularly in the production of semiconductors and display panels.

    High Purity Ultra Pure Ga Market End-User Industry Insights

    The High Purity Ultra Pure Ga Market is segmented by end-user industry into Electronics Manufacturing, Semiconductor Industry, Medical and Healthcare, Aerospace and Defense, and Research and Development. The Electronics Manufacturing segment is the largest end-user industry, accounting for over 40% of the market revenue in 2023. The Semiconductor Industry is the second largest end-user industry, accounting for over 30% of the market revenue in 2023.

    The Medical and Healthcare segment is the third largest end-user industry, accounting for over 15% of the market revenue in 2023.The Aerospace and Defense segment is the fourth largest end-user industry, accounting for over 10% of the market revenue in 2023. The Research and Development segment is the fifth largest end-user industry, accounting for over 5% of the market revenue in 2023. The Electronics Manufacturing segment is expected to continue to be the largest end-user industry over the forecast period, driven by the increasing demand for electronic devices.

    The Semiconductor Industry is expected to be the second largest end-user industry over the forecast period, driven by the increasing demand for semiconductors for use in electronic devices.The Medical and Healthcare segment is expected to be the third largest end-user industry over the forecast period, driven by the increasing demand for medical devices and healthcare products. The Aerospace and Defense segment is expected to be the fourth largest end-user industry over the forecast period, driven by the increasing demand for aerospace and defense products.

    The Research and Development segment is expected to be the fifth largest end-user industry over the forecast period, driven by the increasing demand for research and development activities.

    Regional Insights

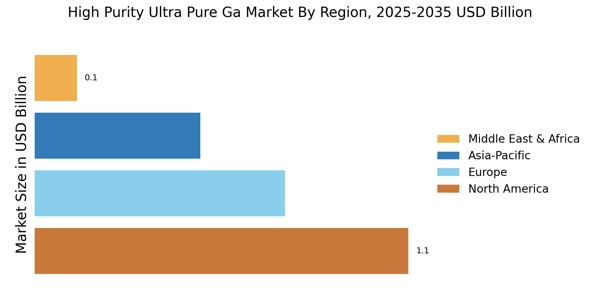
    The High Purity Ultra Pure Ga Market report provides insights into the regional segmentation of the market. The market is segmented into five key regions: North America, Europe, APAC, South America and MEA. North America holds the largest market share due to the presence of major semiconductor manufacturers and the increasing adoption of advanced technologies. Europe is the second-largest market, driven by the growing demand for high-purity gallium in various applications.

    APAC is expected to witness significant growth over the forecast period, owing to the rising demand from the electronics and semiconductor industries in countries such as China, India and South Korea.South America and MEA are expected to have a moderate growth rate due to the increasing investment in infrastructure and the development of new industries.

    Source: Primary Research, Secondary Research, Market Research Future Database and Analyst Review

    Key Players and Competitive Insights

    Major players in High Purity Ultra Pure Ga Market are consolidating their positions by entering into strategic partnerships and collaborations, expanding their geographical presence, and enhancing their product offerings. The competitive landscape is expected to remain fragmented in the coming years, with a few key players holding a majority of the market share. Leading High Purity Ultra Pure Ga Market players are investing heavily in research and development to introduce innovative products and technologies, stay ahead of the competition, and meet the evolving demands of customers.A prominent player in the High Purity Ultra Pure Ga Market industry is Umicore.

    Headquartered in Belgium, Umicore is a materials technology company that provides solutions for clean mobility, recycling, energy, and surface technologies. The company operates production facilities in various countries across the world and has a strong presence in the high-purity materials market. Umicore is committed to sustainable practices and has implemented measures to reduce its environmental impact. The company's commitment to innovation has led to the development of advanced products and technologies, enabling it to maintain a competitive position in the market.Another key competitor in the High Purity Ultra Pure Ga Market is Kanto Chemical.

    Headquartered in Japan, Kanto Chemical is a leading manufacturer of specialty chemicals and materials. The company offers a wide range of high-purity metals, including gallium and other related products. Kanto Chemical has a presence with operations in various countries and has established partnerships with several leading companies in the electronics and semiconductor industries. The company's focus on innovation has resulted in the development of high-performance materials that meet the demanding requirements of advanced technologies.

    Key Companies in the High Purity Ultra Pure Ga Market market include

    Industry Developments

    The High Purity Ultra Pure Ga Market is anticipated to exhibit steady growth in the coming years, with a projected market valuation of USD 3.27 billion by 2032, expanding at a CAGR of 4.79% during the forecast period of 2024-2032. The market growth is attributed to increasing demand from various end-use industries, particularly electronics and semiconductors. The growing adoption of gallium-based compounds in high-power and high-frequency electronic devices is driving market demand. Additionally, government initiatives and investments in renewable energy, such as solar cells, are expected to further contribute to market expansion.

    Recent developments in the Ga industry include strategic partnerships, mergers, and acquisitions among key players to strengthen their market position and expand their product offerings. Furthermore, ongoing research and development activities are focused on improving production processes and enhancing the purity of gallium, which is crucial for advanced applications.

    Future Outlook

    High Purity Ultra Pure Ga Market Future Outlook

    The High Purity Ultra Pure Ga Market is projected to grow at a 6.5% CAGR from 2024 to 2035, driven by advancements in semiconductor technology and increasing demand for high-performance electronics.

    New opportunities lie in:

    • Invest in R&D for innovative gallium-based materials to enhance semiconductor performance.
    • Expand production capabilities to meet rising demand in renewable energy applications.
    • Develop strategic partnerships with tech firms to integrate ultra-pure Ga in next-gen devices.

    By 2035, the market is expected to achieve substantial growth, reflecting robust demand and technological advancements.

    Market Segmentation

    High Purity Ultra Pure Ga Market Form Outlook

    • Gallium (GA)
    • Gallium Arsenide (GaAs)
    • Gallium Nitride (GaN)

    High Purity Ultra Pure Ga Market Regional Outlook

    • North America
    • Europe
    • South America
    • Asia Pacific
    • Middle East and Africa

    High Purity Ultra Pure Ga Market Packaging Outlook

    • Ingots
    • Wafers
    • Powder
    • Liquids

    High Purity Ultra Pure Ga Market Application Outlook

    • Electronic Circuitry
    • Semiconductor Production
    • Medical Materials
    • Optical Components
    • Scientific Research

    High Purity Ultra Pure Ga Market End-User Industry Outlook

    • Electronics Manufacturing
    • Semiconductor Industry
    • Medical and Healthcare
    • Aerospace and Defense
    • Research and Development

    High Purity Ultra Pure Ga Market Purity Level (99.99% to 99.9999%) Outlook

    • 99.99%
    • 99.999%
    • 99.9999%
    • 99.99999%

    Report Scope

    Report Attribute/Metric Details
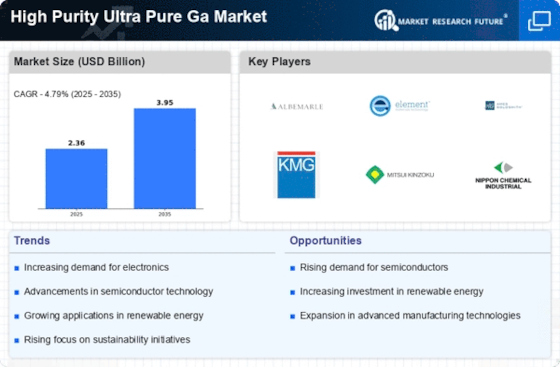
    Market Size 2024 2.36(USD Billion)
    Market Size 2025 2.47(USD Billion)
    Market Size 2034 3.77(USD Billion)
    Compound Annual Growth Rate (CAGR) 4.8% (2025 - 2034)
    Report Coverage Revenue Forecast, Competitive Landscape, Growth Factors, and Trends
    Base Year 2024
    Market Forecast Period 2025 - 2034
    Historical Data 2020 - 2024
    Market Forecast Units USD Billion
    Key Companies Profiled JX Nippon Mining Metals, Rika Denkin, Kyushu Metal Industry, Nippon Steel Sumitomo Metal, SK Siltron, Dowa Electronics, Samsung Electronics, Hoya Corporation, Umicore, Kojundong, LG Siltron, AGC, Tanaka Holdings, MCP Group, Sumitomo Metal Mining
    Segments Covered Application, Purity Level (99.99% to 99.9999%), Form, Packaging, End-User Industry, Regional
    Key Market Opportunities 1 Advanced semiconductor manufacturing technologies2 Increasing demand for GaNbased optoelectronic devices3 Rising adoption of ultrapure Ga in solar cells4 Growing need for Gadoped materials in high-power electronics5 Pharmaceutical and medical applications
    Key Market Dynamics Increasing demand for high-purity gallium in IIIV semiconductors Expanding application in various industries Technological advancements in manufacturing processes Growing adoption of GaNbased power devices Rising demand from emerging markets
    Countries Covered North America, Europe, APAC, South America, MEA

    Market Highlights

    Author
    Chitranshi Jaiswal
    Research Analyst Level I

    In her 3 years of experience in the market research field, she has handled critical cross-domain projects. She has an in-depth knowledge of market estimation & analysis, problem-solving, primary as well as secondary research, and team management.She holds an engineering degree and is an MBA professional from a well-known university, capable of evaluating the market and competitive conditions. An exceptional strategist with excellent communication skills and a passion for delivering cutting-edge & practical insights for the market. Proficient in multi-tasking, and can successfully deal with competing demands, while maintaining complete confidentiality. Generated business through active client and project development, networking, and high-quality responses. Her knowledge and skills have helped in making solid business decisions, securing funding from investors, and avoiding business failures.

    Leave a Comment

    FAQs

    What was the projected market size of the High Purity Ultra Pure Ga Market in 2024?

    The High Purity Ultra Pure Ga Market was estimated to be worth USD 2.36 billion in 2024.

    What is the projected CAGR of the High Purity Ultra Pure Ga Market from 2025 to 2034?

    The High Purity Ultra Pure Ga Market is projected to grow at a CAGR of 4.8% from 2025 to 2034.

    Which region is expected to hold the largest market share in the High Purity Ultra Pure Ga Market in 2032?

    Asia Pacific is expected to hold the largest market share in the High Purity Ultra Pure Ga Market in 2032.

    What are the key applications of High Purity Ultra Pure Ga?

    High Purity Ultra Pure Ga is primarily used in the manufacturing of semiconductors, solar cells, and light-emitting diodes (LEDs).

    Who are the key competitors in the High Purity Ultra Pure Ga Market?

    Some of the key competitors in the High Purity Ultra Pure Ga Market include Umicore, Ntronix Metal Company, and Indium Corporation.

    What are the factors driving the growth of the High Purity Ultra Pure Ga Market?

    The growth of the High Purity Ultra Pure Ga Market is being driven by the increasing demand for semiconductors and solar cells.

    What are the challenges faced by the High Purity Ultra Pure Ga Market?

    The High Purity Ultra Pure Ga Market faces challenges such as the volatility of raw material prices and stringent regulatory requirements.

    What are the opportunities for growth in the High Purity Ultra Pure Ga Market?

    The High Purity Ultra Pure Ga Market offers growth opportunities, such as the development of new applications and the expansion into emerging markets.

    What are the key trends shaping the High Purity Ultra Pure Ga Market?

    The key trends shaping the High Purity Ultra Pure Ga Market include the increasing adoption of advanced packaging technologies and the growing demand for miniaturized electronic devices.

    What is the expected market size of the High Purity Ultra Pure Ga Market in 2032?

    The High Purity Ultra Pure Ga Market is projected to reach USD 3.27 billion by 2032.

    1.   1. EXECUTIVE SUMMARY 
    2.         1.1. Market Overview 
    3.         1.2. Key Findings 
    4.   1.3. Market Segmentation 
    5.         1.4. Competitive Landscape 
    6.         1.5. Challenges and Opportunities 
    7.         1.6. Future Outlook 
    8.     2. MARKET INTRODUCTION 
    9.   2.1. Definition 
    10.         2.2. Scope of the study 
    11.             2.2.1. Research Objective 
    12.             2.2.2. Assumption 
    13.           2.2.3. Limitations 
    14. RESEARCH METHODOLOGY 
    15.         3.1. Overview 
    16.         3.2. Data Mining 
      1. Secondary Research 
    17.         3.4. Primary Research 
    18.             3.4.1. Primary Interviews and Information
    19. Gathering Process 
    20.             3.4.2. Breakdown
    21. of Primary Respondents 
    22.         3.5. Forecasting Model 
    23.         3.6. Market Size Estimation 
    24.         3.6.1. Bottom-Up Approach 
    25.       3.6.2. Top-Down Approach 
      1. Data Triangulation 
    26.         3.8. Validation 
    27.     4. MARKET DYNAMICS 
    28.         4.1. Overview 
      1. Drivers 
    29.         4.3. Restraints 
    30.       4.4. Opportunities 
    31.     5. MARKET FACTOR ANALYSIS 
    32.         5.1. Value chain Analysis 
    33.         5.2. Porter's Five Forces Analysis 
    34.           5.2.1. Bargaining Power of Suppliers 
    35.             5.2.2. Bargaining Power of Buyers 
    36.             5.2.3. Threat of New Entrants 
    37.             5.2.4. Threat of Substitutes 
    38.             5.2.5. Intensity of Rivalry 
    39.         5.3. COVID-19 Impact Analysis 
    40.         5.3.1. Market Impact Analysis 
    41.         5.3.2. Regional Impact 
    42.       5.3.3. Opportunity and Threat Analysis 
    43.     6. High Purity Ultra Pure Ga Market, BY
    44. Application (USD Billion) 
    45.         6.1. Electronic
    46. Circuitry 
    47.         6.2. Semiconductor Production 
    48.         6.3. Medical Materials 
    49.   6.4. Optical Components 
    50.         6.5. Scientific
    51. Research 
    52.     7. High Purity Ultra Pure Ga Market, BY Purity
    53. Level (99.99% to 99.9999%) (USD Billion) 
    54.     8. High Purity Ultra Pure Ga Market, BY Form (USD Billion) 
    55.         8.1. Gallium (GA) 
    56.   8.2. Gallium Arsenide (GaAs) 
    57. Gallium Nitride (GaN) 
    58.     9. High Purity Ultra Pure Ga Market,
    59. BY Packaging (USD Billion) 
    60.         9.1. Ingots 
    61.         9.2. Wafers 
      1. Powder 
    62.         9.4. Liquids 
    63.   10. High Purity Ultra Pure Ga Market, BY End-User Industry (USD Billion) 
    64.         10.1. Electronics Manufacturing 
    65.       10.2. Semiconductor Industry 
    66.   10.3. Medical and Healthcare 
    67. Aerospace and Defense 
    68.         10.5. Research and
    69. Development 
    70.     11. High Purity Ultra Pure Ga Market, BY Regional
    71. (USD Billion) 
    72.         11.1. North America 
    73.             11.1.1. US 
    74.         11.1.2. Canada 
      1. Europe 
    75.             11.2.1. Germany 
    76.             11.2.2. UK 
    77.         11.2.3. France 
    78.     11.2.4. Russia 
      1. Italy 
    79.             11.2.6. Spain 
    80.             11.2.7. Rest of Europe 
    81.       11.3. APAC 
      1. China 
    82.             11.3.2. India 
    83.             11.3.3. Japan 
    84.         11.3.4. South Korea 
    85.       11.3.5. Malaysia 
    86.   11.3.6. Thailand 
    87. Indonesia 
    88.             11.3.8. Rest of APAC 
    89.         11.4. South America 
    90.       11.4.1. Brazil 
    91.   11.4.2. Mexico 
    92. Argentina 
    93.             11.4.4. Rest of South
    94. America 
    95.         11.5. MEA 
    96.         11.5.1. GCC Countries 
    97.       11.5.2. South Africa 
    98.     11.5.3. Rest of MEA 
    99.   12. Competitive Landscape 
    100.         12.1. Overview 
    101.         12.2. Competitive Analysis 
    102.     12.3. Market share Analysis 
      1. Major Growth Strategy in the High Purity Ultra Pure Ga Market 
    103.       12.5. Competitive Benchmarking 
    104.   12.6. Leading Players in Terms of Number of Developments in the High Purity
    105. Ultra Pure Ga Market 
    106.         12.7. Key developments
    107. and growth strategies 
    108. New Product Launch/Service Deployment 
    109.   12.7.2. Merger & Acquisitions 
    110.     12.7.3. Joint Ventures 
    111. Major Players Financial Matrix 
      1. Sales and Operating Income 
    112.   12.8.2. Major Players R&D Expenditure. 2023 
    113. Company Profiles 
    114.         13.1. JX Nippon Mining
    115. Metals 
    116.             13.1.1. Financial Overview 
    117.             13.1.2. Products Offered 
    118.           13.1.3. Key Developments 
    119.         13.1.4. SWOT Analysis 
    120.       13.1.5. Key Strategies 
      1. Rika Denkin 
    121.             13.2.1. Financial
    122. Overview 
    123.             13.2.2. Products Offered 
    124.             13.2.3. Key Developments 
    125.           13.2.4. SWOT Analysis 
    126.         13.2.5. Key Strategies 
    127.   13.3. Kyushu Metal Industry 
    128.   13.3.1. Financial Overview 
    129.   13.3.2. Products Offered 
      1. Key Developments 
    130. SWOT Analysis 
    131.             13.3.5. Key Strategies 
    132.         13.4. Nippon Steel Sumitomo Metal 
    133.           13.4.1. Financial Overview 
    134.           13.4.2. Products Offered 
    135.         13.4.3. Key Developments 
    136.       13.4.4. SWOT Analysis 
    137.     13.4.5. Key Strategies 
    138. SK Siltron 
    139.             13.5.1. Financial
    140. Overview 
    141.             13.5.2. Products Offered 
    142.             13.5.3. Key Developments 
    143.           13.5.4. SWOT Analysis 
    144.         13.5.5. Key Strategies 
    145.   13.6. Dowa Electronics 
      1. Financial Overview 
        1. Products Offered 
    146. Key Developments 
    147.             13.6.4. SWOT
    148. Analysis 
    149.             13.6.5. Key Strategies 
    150.         13.7. Samsung Electronics 
    151.         13.7.1. Financial Overview 
    152.         13.7.2. Products Offered 
    153.       13.7.3. Key Developments 
    154.     13.7.4. SWOT Analysis 
    155.   13.7.5. Key Strategies 
    156.         13.8. Hoya
    157. Corporation 
    158.             13.8.1. Financial
    159. Overview 
    160.             13.8.2. Products Offered 
    161.             13.8.3. Key Developments 
    162.           13.8.4. SWOT Analysis 
    163.         13.8.5. Key Strategies 
    164.   13.9. Umicore 
    165. Financial Overview 
    166. Products Offered 
    167.             13.9.3. Key
    168. Developments 
    169.             13.9.4. SWOT Analysis 
    170.             13.9.5. Key Strategies 
    171.       13.10. Kojundong 
    172.   13.10.1. Financial Overview 
    173.   13.10.2. Products Offered 
      1. Key Developments 
    174. SWOT Analysis 
    175.             13.10.5. Key
    176. Strategies 
    177.         13.11. LG Siltron 
    178.           13.11.1. Financial Overview 
    179.           13.11.2. Products Offered 
    180.         13.11.3. Key Developments 
    181.       13.11.4. SWOT Analysis 
    182.     13.11.5. Key Strategies 
    183. AGC 
    184.             13.12.1. Financial Overview 
    185.             13.12.2. Products Offered 
    186.           13.12.3. Key Developments 
    187.         13.12.4. SWOT Analysis 
    188.       13.12.5. Key Strategies 
      1. Tanaka Holdings 
    189. Financial Overview 
    190. Products Offered 
    191.             13.13.3. Key
    192. Developments 
    193.             13.13.4. SWOT
    194. Analysis 
    195.             13.13.5. Key Strategies 
    196.         13.14. MCP Group 
    197.     13.14.1. Financial Overview 
    198.     13.14.2. Products Offered 
    199.   13.14.3. Key Developments 
      1. SWOT Analysis 
    200. Key Strategies 
    201.         13.15. Sumitomo Metal Mining 
    202.             13.15.1. Financial Overview 
    203.             13.15.2. Products Offered 
    204.           13.15.3. Key Developments 
    205.         13.15.4. SWOT Analysis 
    206.       13.15.5. Key Strategies 
    207.     14. Appendix 
    208.         14.1. References 
      1. Related Reports 
    209.     Table
    210. LIST OF ASSUMPTIONS 
    211.     Table 2. North America High Purity
    212. Ultra Pure Ga Market SIZE ESTIMATES & FORECAST, BY APPLICATION, 2025-2034 (USD
    213. Billions) 
    214.     Table 3. North America High Purity Ultra Pure
    215. Ga Market SIZE ESTIMATES & FORECAST, BY PURITY LEVEL (99.99% TO 99.9999%), 2025-2034
    216. (USD Billions) 
    217.     Table 4. North America High Purity Ultra
    218. Pure Ga Market SIZE ESTIMATES & FORECAST, BY FORM, 2025-2034 (USD Billions) 
    219.     Table 5. North America High Purity Ultra Pure Ga Market SIZE ESTIMATES
    220. & FORECAST, BY PACKAGING, 2025-2034 (USD Billions) 
    221. BY END-USER INDUSTRY, 2025-2034 (USD Billions) 
    222.     Table 7.
    223. North America High Purity Ultra Pure Ga Market SIZE ESTIMATES & FORECAST, BY
    224. REGIONAL, 2025-2034 (USD Billions) 
    225.     Table 8. US High Purity
    226. Ultra Pure Ga Market SIZE ESTIMATES & FORECAST, BY APPLICATION, 2025-2034 (USD
    227. Billions) 
    228.     Table 9. US High Purity Ultra Pure Ga Market
    229. SIZE ESTIMATES & FORECAST, BY PURITY LEVEL (99.99% TO 99.9999%), 2025-2034 (USD
    230. Billions) 
    231.     Table 10. US High Purity Ultra Pure Ga Market
    232. SIZE ESTIMATES & FORECAST, BY FORM, 2025-2034 (USD Billions) 
    233.   Table 11. US High Purity Ultra Pure Ga Market SIZE ESTIMATES & FORECAST,
    234. BY PACKAGING, 2025-2034 (USD Billions) 
    235.     Table 12. US High
    236. Purity Ultra Pure Ga Market SIZE ESTIMATES & FORECAST, BY END-USER INDUSTRY,
    237. 2034 (USD Billions) 
    238.     Table 13. US High Purity Ultra
    239. Pure Ga Market SIZE ESTIMATES & FORECAST, BY REGIONAL, 2025-2034 (USD Billions) 
    240.     Table 14. Canada High Purity Ultra Pure Ga Market SIZE ESTIMATES
    241. & FORECAST, BY APPLICATION, 2025-2034 (USD Billions) 
    242. BY PURITY LEVEL (99.99% TO 99.9999%), 2025-2034 (USD Billions) 
    243.   Table 16. Canada High Purity Ultra Pure Ga Market SIZE ESTIMATES & FORECAST,
    244. BY FORM, 2025-2034 (USD Billions) 
    245.     Table 17. Canada High
    246. Purity Ultra Pure Ga Market SIZE ESTIMATES & FORECAST, BY PACKAGING, 2025-2034
    247. (USD Billions) 
    248.     Table 18. Canada High Purity Ultra Pure
    249. Ga Market SIZE ESTIMATES & FORECAST, BY END-USER INDUSTRY, 2025-2034 (USD Billions) 
    250.     Table 19. Canada High Purity Ultra Pure Ga Market SIZE ESTIMATES
    251. & FORECAST, BY REGIONAL, 2025-2034 (USD Billions) 
    252.     Table
    253. Europe High Purity Ultra Pure Ga Market SIZE ESTIMATES & FORECAST, BY APPLICATION,
    254. 2034 (USD Billions) 
    255.     Table 21. Europe High Purity Ultra
    256. Pure Ga Market SIZE ESTIMATES & FORECAST, BY PURITY LEVEL (99.99% TO 99.9999%),
    257. 2034 (USD Billions) 
    258.     Table 22. Europe High Purity Ultra
    259. Pure Ga Market SIZE ESTIMATES & FORECAST, BY FORM, 2025-2034 (USD Billions) 
    260.     Table 23. Europe High Purity Ultra Pure Ga Market SIZE ESTIMATES
    261. & FORECAST, BY PACKAGING, 2025-2034 (USD Billions) 
    262. BY END-USER INDUSTRY, 2025-2034 (USD Billions) 
    263.     Table 25.
    264. Europe High Purity Ultra Pure Ga Market SIZE ESTIMATES & FORECAST, BY REGIONAL,
    265. 2034 (USD Billions) 
    266.     Table 26. Germany High Purity
    267. Ultra Pure Ga Market SIZE ESTIMATES & FORECAST, BY APPLICATION, 2025-2034 (USD
    268. Billions) 
    269.     Table 27. Germany High Purity Ultra Pure Ga Market
    270. SIZE ESTIMATES & FORECAST, BY PURITY LEVEL (99.99% TO 99.9999%), 2025-2034 (USD
    271. Billions) 
    272.     Table 28. Germany High Purity Ultra Pure Ga Market
    273. SIZE ESTIMATES & FORECAST, BY FORM, 2025-2034 (USD Billions) 
    274.   Table 29. Germany High Purity Ultra Pure Ga Market SIZE ESTIMATES & FORECAST,
    275. BY PACKAGING, 2025-2034 (USD Billions) 
    276.     Table 30. Germany
    277. High Purity Ultra Pure Ga Market SIZE ESTIMATES & FORECAST, BY END-USER INDUSTRY,
    278. 2034 (USD Billions) 
    279.     Table 31. Germany High Purity
    280. Ultra Pure Ga Market SIZE ESTIMATES & FORECAST, BY REGIONAL, 2025-2034 (USD
    281. Billions) 
    282.     Table 32. UK High Purity Ultra Pure Ga Market
    283. SIZE ESTIMATES & FORECAST, BY APPLICATION, 2025-2034 (USD Billions) 
    284.     Table 33. UK High Purity Ultra Pure Ga Market SIZE ESTIMATES &
    285. FORECAST, BY PURITY LEVEL (99.99% TO 99.9999%), 2025-2034 (USD Billions) 
    286.     Table 34. UK High Purity Ultra Pure Ga Market SIZE ESTIMATES &
    287. FORECAST, BY FORM, 2025-2034 (USD Billions) 
    288.     Table 35. UK
    289. High Purity Ultra Pure Ga Market SIZE ESTIMATES & FORECAST, BY PACKAGING, 2025-2034
    290. (USD Billions) 
    291.     Table 36. UK High Purity Ultra Pure Ga Market
    292. SIZE ESTIMATES & FORECAST, BY END-USER INDUSTRY, 2025-2034 (USD Billions) 
    293.     Table 37. UK High Purity Ultra Pure Ga Market SIZE ESTIMATES &
    294. FORECAST, BY REGIONAL, 2025-2034 (USD Billions) 
    295.     Table 38.
    296. France High Purity Ultra Pure Ga Market SIZE ESTIMATES & FORECAST, BY APPLICATION,
    297. 2034 (USD Billions) 
    298.     Table 39. France High Purity Ultra
    299. Pure Ga Market SIZE ESTIMATES & FORECAST, BY PURITY LEVEL (99.99% TO 99.9999%),
    300. 2034 (USD Billions) 
    301.     Table 40. France High Purity Ultra
    302. Pure Ga Market SIZE ESTIMATES & FORECAST, BY FORM, 2025-2034 (USD Billions) 
    303.     Table 41. France High Purity Ultra Pure Ga Market SIZE ESTIMATES
    304. & FORECAST, BY PACKAGING, 2025-2034 (USD Billions) 
    305. BY END-USER INDUSTRY, 2025-2034 (USD Billions) 
    306.     Table 43.
    307. France High Purity Ultra Pure Ga Market SIZE ESTIMATES & FORECAST, BY REGIONAL,
    308. 2034 (USD Billions) 
    309.     Table 44. Russia High Purity Ultra
    310. Pure Ga Market SIZE ESTIMATES & FORECAST, BY APPLICATION, 2025-2034 (USD Billions) 
    311.     Table 45. Russia High Purity Ultra Pure Ga Market SIZE ESTIMATES
    312. & FORECAST, BY PURITY LEVEL (99.99% TO 99.9999%), 2025-2034 (USD Billions) 
    313.     Table 46. Russia High Purity Ultra Pure Ga Market SIZE ESTIMATES
    314. & FORECAST, BY FORM, 2025-2034 (USD Billions) 
    315.     Table
    316. Russia High Purity Ultra Pure Ga Market SIZE ESTIMATES & FORECAST, BY PACKAGING,
    317. 2034 (USD Billions) 
    318.     Table 48. Russia High Purity Ultra
    319. Pure Ga Market SIZE ESTIMATES & FORECAST, BY END-USER INDUSTRY, 2025-2034 (USD
    320. Billions) 
    321.     Table 49. Russia High Purity Ultra Pure Ga Market
    322. SIZE ESTIMATES & FORECAST, BY REGIONAL, 2025-2034 (USD Billions) 
    323.   Table 50. Italy High Purity Ultra Pure Ga Market SIZE ESTIMATES & FORECAST,
    324. BY APPLICATION, 2025-2034 (USD Billions) 
    325.     Table 51. Italy
    326. High Purity Ultra Pure Ga Market SIZE ESTIMATES & FORECAST, BY PURITY LEVEL
    327. (99.99% TO 99.9999%), 2025-2034 (USD Billions) 
    328.     Table 52.
    329. Italy High Purity Ultra Pure Ga Market SIZE ESTIMATES & FORECAST, BY FORM, 2025-2034
    330. (USD Billions) 
    331.     Table 53. Italy High Purity Ultra Pure Ga
    332. Market SIZE ESTIMATES & FORECAST, BY PACKAGING, 2025-2034 (USD Billions) 
    333.     Table 54. Italy High Purity Ultra Pure Ga Market SIZE ESTIMATES
    334. & FORECAST, BY END-USER INDUSTRY, 2025-2034 (USD Billions) 
    335.   Table 55. Italy High Purity Ultra Pure Ga Market SIZE ESTIMATES & FORECAST,
    336. BY REGIONAL, 2025-2034 (USD Billions) 
    337.     Table 56. Spain High
    338. Purity Ultra Pure Ga Market SIZE ESTIMATES & FORECAST, BY APPLICATION, 2025-2034
    339. (USD Billions) 
    340.     Table 57. Spain High Purity Ultra Pure Ga
    341. Market SIZE ESTIMATES & FORECAST, BY PURITY LEVEL (99.99% TO 99.9999%), 2025-2034
    342. (USD Billions) 
    343.     Table 58. Spain High Purity Ultra Pure Ga
    344. Market SIZE ESTIMATES & FORECAST, BY FORM, 2025-2034 (USD Billions) 
    345.     Table 59. Spain High Purity Ultra Pure Ga Market SIZE ESTIMATES
    346. & FORECAST, BY PACKAGING, 2025-2034 (USD Billions) 
    347. BY END-USER INDUSTRY, 2025-2034 (USD Billions) 
    348.     Table 61.
    349. Spain High Purity Ultra Pure Ga Market SIZE ESTIMATES & FORECAST, BY REGIONAL,
    350. 2034 (USD Billions) 
    351.     Table 62. Rest of Europe High
    352. Purity Ultra Pure Ga Market SIZE ESTIMATES & FORECAST, BY APPLICATION, 2025-2034
    353. (USD Billions) 
    354.     Table 63. Rest of Europe High Purity Ultra
    355. Pure Ga Market SIZE ESTIMATES & FORECAST, BY PURITY LEVEL (99.99% TO 99.9999%),
    356. 2034 (USD Billions) 
    357.     Table 64. Rest of Europe High
    358. Purity Ultra Pure Ga Market SIZE ESTIMATES & FORECAST, BY FORM, 2025-2034 (USD
    359. Billions) 
    360.     Table 65. Rest of Europe High Purity Ultra Pure
    361. Ga Market SIZE ESTIMATES & FORECAST, BY PACKAGING, 2025-2034 (USD Billions) 
    362.     Table 66. Rest of Europe High Purity Ultra Pure Ga Market SIZE ESTIMATES
    363. & FORECAST, BY END-USER INDUSTRY, 2025-2034 (USD Billions) 
    364.   Table 67. Rest of Europe High Purity Ultra Pure Ga Market SIZE ESTIMATES
    365. & FORECAST, BY REGIONAL, 2025-2034 (USD Billions) 
    366.     Table
    367. APAC High Purity Ultra Pure Ga Market SIZE ESTIMATES & FORECAST, BY APPLICATION,
    368. 2034 (USD Billions) 
    369.     Table 69. APAC High Purity Ultra
    370. Pure Ga Market SIZE ESTIMATES & FORECAST, BY PURITY LEVEL (99.99% TO 99.9999%),
    371. 2034 (USD Billions) 
    372.     Table 70. APAC High Purity Ultra
    373. Pure Ga Market SIZE ESTIMATES & FORECAST, BY FORM, 2025-2034 (USD Billions) 
    374.     Table 71. APAC High Purity Ultra Pure Ga Market SIZE ESTIMATES &
    375. FORECAST, BY PACKAGING, 2025-2034 (USD Billions) 
    376.     Table
    377. APAC High Purity Ultra Pure Ga Market SIZE ESTIMATES & FORECAST, BY END-USER
    378. INDUSTRY, 2025-2034 (USD Billions) 
    379.     Table 73. APAC High
    380. Purity Ultra Pure Ga Market SIZE ESTIMATES & FORECAST, BY REGIONAL, 2025-2034
    381. (USD Billions) 
    382.     Table 74. China High Purity Ultra Pure Ga
    383. Market SIZE ESTIMATES & FORECAST, BY APPLICATION, 2025-2034 (USD Billions) 
    384.     Table 75. China High Purity Ultra Pure Ga Market SIZE ESTIMATES
    385. & FORECAST, BY PURITY LEVEL (99.99% TO 99.9999%), 2025-2034 (USD Billions) 
    386.     Table 76. China High Purity Ultra Pure Ga Market SIZE ESTIMATES
    387. & FORECAST, BY FORM, 2025-2034 (USD Billions) 
    388.     Table
    389. China High Purity Ultra Pure Ga Market SIZE ESTIMATES & FORECAST, BY PACKAGING,
    390. 2034 (USD Billions) 
    391.     Table 78. China High Purity Ultra
    392. Pure Ga Market SIZE ESTIMATES & FORECAST, BY END-USER INDUSTRY, 2025-2034 (USD
    393. Billions) 
    394.     Table 79. China High Purity Ultra Pure Ga Market
    395. SIZE ESTIMATES & FORECAST, BY REGIONAL, 2025-2034 (USD Billions) 
    396.   Table 80. India High Purity Ultra Pure Ga Market SIZE ESTIMATES & FORECAST,
    397. BY APPLICATION, 2025-2034 (USD Billions) 
    398.     Table 81. India
    399. High Purity Ultra Pure Ga Market SIZE ESTIMATES & FORECAST, BY PURITY LEVEL
    400. (99.99% TO 99.9999%), 2025-2034 (USD Billions) 
    401.     Table 82.
    402. India High Purity Ultra Pure Ga Market SIZE ESTIMATES & FORECAST, BY FORM, 2025-2034
    403. (USD Billions) 
    404.     Table 83. India High Purity Ultra Pure Ga
    405. Market SIZE ESTIMATES & FORECAST, BY PACKAGING, 2025-2034 (USD Billions) 
    406.     Table 84. India High Purity Ultra Pure Ga Market SIZE ESTIMATES
    407. & FORECAST, BY END-USER INDUSTRY, 2025-2034 (USD Billions) 
    408.   Table 85. India High Purity Ultra Pure Ga Market SIZE ESTIMATES & FORECAST,
    409. BY REGIONAL, 2025-2034 (USD Billions) 
    410.     Table 86. Japan High
    411. Purity Ultra Pure Ga Market SIZE ESTIMATES & FORECAST, BY APPLICATION, 2025-2034
    412. (USD Billions) 
    413.     Table 87. Japan High Purity Ultra Pure Ga
    414. Market SIZE ESTIMATES & FORECAST, BY PURITY LEVEL (99.99% TO 99.9999%), 2025-2034
    415. (USD Billions) 
    416.     Table 88. Japan High Purity Ultra Pure Ga
    417. Market SIZE ESTIMATES & FORECAST, BY FORM, 2025-2034 (USD Billions) 
    418.     Table 89. Japan High Purity Ultra Pure Ga Market SIZE ESTIMATES
    419. & FORECAST, BY PACKAGING, 2025-2034 (USD Billions) 
    420. BY END-USER INDUSTRY, 2025-2034 (USD Billions) 
    421.     Table 91.
    422. Japan High Purity Ultra Pure Ga Market SIZE ESTIMATES & FORECAST, BY REGIONAL,
    423. 2034 (USD Billions) 
    424.     Table 92. South Korea High Purity
    425. Ultra Pure Ga Market SIZE ESTIMATES & FORECAST, BY APPLICATION, 2025-2034 (USD
    426. Billions) 
    427.     Table 93. South Korea High Purity Ultra Pure
    428. Ga Market SIZE ESTIMATES & FORECAST, BY PURITY LEVEL (99.99% TO 99.9999%), 2025-2034
    429. (USD Billions) 
    430.     Table 94. South Korea High Purity Ultra
    431. Pure Ga Market SIZE ESTIMATES & FORECAST, BY FORM, 2025-2034 (USD Billions) 
    432.     Table 95. South Korea High Purity Ultra Pure Ga Market SIZE ESTIMATES
    433. & FORECAST, BY PACKAGING, 2025-2034 (USD Billions) 
    434. BY END-USER INDUSTRY, 2025-2034 (USD Billions) 
    435.     Table 97.
    436. South Korea High Purity Ultra Pure Ga Market SIZE ESTIMATES & FORECAST, BY REGIONAL,
    437. 2034 (USD Billions) 
    438.     Table 98. Malaysia High Purity
    439. Ultra Pure Ga Market SIZE ESTIMATES & FORECAST, BY APPLICATION, 2025-2034 (USD
    440. Billions) 
    441.     Table 99. Malaysia High Purity Ultra Pure Ga
    442. Market SIZE ESTIMATES & FORECAST, BY PURITY LEVEL (99.99% TO 99.9999%), 2025-2034
    443. (USD Billions) 
    444.     Table 100. Malaysia High Purity Ultra Pure
    445. Ga Market SIZE ESTIMATES & FORECAST, BY FORM, 2025-2034 (USD Billions) 
    446.     Table 101. Malaysia High Purity Ultra Pure Ga Market SIZE ESTIMATES
    447. & FORECAST, BY PACKAGING, 2025-2034 (USD Billions) 
    448. BY END-USER INDUSTRY, 2025-2034 (USD Billions) 
    449.     Table 103.
    450. Malaysia High Purity Ultra Pure Ga Market SIZE ESTIMATES & FORECAST, BY REGIONAL,
    451. 2034 (USD Billions) 
    452.     Table 104. Thailand High Purity
    453. Ultra Pure Ga Market SIZE ESTIMATES & FORECAST, BY APPLICATION, 2025-2034 (USD
    454. Billions) 
    455.     Table 105. Thailand High Purity Ultra Pure Ga
    456. Market SIZE ESTIMATES & FORECAST, BY PURITY LEVEL (99.99% TO 99.9999%), 2025-2034
    457. (USD Billions) 
    458.     Table 106. Thailand High Purity Ultra Pure
    459. Ga Market SIZE ESTIMATES & FORECAST, BY FORM, 2025-2034 (USD Billions) 
    460.     Table 107. Thailand High Purity Ultra Pure Ga Market SIZE ESTIMATES
    461. & FORECAST, BY PACKAGING, 2025-2034 (USD Billions) 
    462. BY END-USER INDUSTRY, 2025-2034 (USD Billions) 
    463.     Table 109.
    464. Thailand High Purity Ultra Pure Ga Market SIZE ESTIMATES & FORECAST, BY REGIONAL,
    465. 2034 (USD Billions) 
    466.     Table 110. Indonesia High Purity
    467. Ultra Pure Ga Market SIZE ESTIMATES & FORECAST, BY APPLICATION, 2025-2034 (USD
    468. Billions) 
    469.     Table 111. Indonesia High Purity Ultra Pure Ga
    470. Market SIZE ESTIMATES & FORECAST, BY PURITY LEVEL (99.99% TO 99.9999%), 2025-2034
    471. (USD Billions) 
    472.     Table 112. Indonesia High Purity Ultra Pure
    473. Ga Market SIZE ESTIMATES & FORECAST, BY FORM, 2025-2034 (USD Billions) 
    474.     Table 113. Indonesia High Purity Ultra Pure Ga Market SIZE ESTIMATES
    475. & FORECAST, BY PACKAGING, 2025-2034 (USD Billions) 
    476. BY END-USER INDUSTRY, 2025-2034 (USD Billions) 
    477.     Table 115.
    478. Indonesia High Purity Ultra Pure Ga Market SIZE ESTIMATES & FORECAST, BY REGIONAL,
    479. 2034 (USD Billions) 
    480.     Table 116. Rest of APAC High Purity
    481. Ultra Pure Ga Market SIZE ESTIMATES & FORECAST, BY APPLICATION, 2025-2034 (USD
    482. Billions) 
    483.     Table 117. Rest of APAC High Purity Ultra Pure
    484. Ga Market SIZE ESTIMATES & FORECAST, BY PURITY LEVEL (99.99% TO 99.9999%), 2025-2034
    485. (USD Billions) 
    486.     Table 118. Rest of APAC High Purity Ultra
    487. Pure Ga Market SIZE ESTIMATES & FORECAST, BY FORM, 2025-2034 (USD Billions) 
    488.     Table 119. Rest of APAC High Purity Ultra Pure Ga Market SIZE ESTIMATES
    489. & FORECAST, BY PACKAGING, 2025-2034 (USD Billions) 
    490. BY END-USER INDUSTRY, 2025-2034 (USD Billions) 
    491.     Table 121.
    492. Rest of APAC High Purity Ultra Pure Ga Market SIZE ESTIMATES & FORECAST, BY
    493. REGIONAL, 2025-2034 (USD Billions) 
    494.     Table 122. South America
    495. High Purity Ultra Pure Ga Market SIZE ESTIMATES & FORECAST, BY APPLICATION,
    496. 2034 (USD Billions) 
    497.     Table 123. South America High
    498. Purity Ultra Pure Ga Market SIZE ESTIMATES & FORECAST, BY PURITY LEVEL (99.99%
    499. TO 99.9999%), 2025-2034 (USD Billions) 
    500.     Table 124. South
    501. America High Purity Ultra Pure Ga Market SIZE ESTIMATES & FORECAST, BY FORM,
    502. 2034 (USD Billions) 
    503.     Table 125. South America High
    504. Purity Ultra Pure Ga Market SIZE ESTIMATES & FORECAST, BY PACKAGING, 2025-2034
    505. (USD Billions) 
    506.     Table 126. South America High Purity Ultra
    507. Pure Ga Market SIZE ESTIMATES & FORECAST, BY END-USER INDUSTRY, 2025-2034 (USD
    508. Billions) 
    509.     Table 127. South America High Purity Ultra Pure
    510. Ga Market SIZE ESTIMATES & FORECAST, BY REGIONAL, 2025-2034 (USD Billions) 
    511.     Table 128. Brazil High Purity Ultra Pure Ga Market SIZE ESTIMATES
    512. & FORECAST, BY APPLICATION, 2025-2034 (USD Billions) 
    513. BY PURITY LEVEL (99.99% TO 99.9999%), 2025-2034 (USD Billions) 
    514.   Table 130. Brazil High Purity Ultra Pure Ga Market SIZE ESTIMATES & FORECAST,
    515. BY FORM, 2025-2034 (USD Billions) 
    516.     Table 131. Brazil High
    517. Purity Ultra Pure Ga Market SIZE ESTIMATES & FORECAST, BY PACKAGING, 2025-2034
    518. (USD Billions) 
    519.     Table 132. Brazil High Purity Ultra Pure
    520. Ga Market SIZE ESTIMATES & FORECAST, BY END-USER INDUSTRY, 2025-2034 (USD Billions) 
    521.     Table 133. Brazil High Purity Ultra Pure Ga Market SIZE ESTIMATES
    522. & FORECAST, BY REGIONAL, 2025-2034 (USD Billions) 
    523.     Table
    524. Mexico High Purity Ultra Pure Ga Market SIZE ESTIMATES & FORECAST, BY APPLICATION,
    525. 2034 (USD Billions) 
    526.     Table 135. Mexico High Purity
    527. Ultra Pure Ga Market SIZE ESTIMATES & FORECAST, BY PURITY LEVEL (99.99% TO 99.9999%),
    528. 2034 (USD Billions) 
    529.     Table 136. Mexico High Purity
    530. Ultra Pure Ga Market SIZE ESTIMATES & FORECAST, BY FORM, 2025-2034 (USD Billions) 
    531.     Table 137. Mexico High Purity Ultra Pure Ga Market SIZE ESTIMATES
    532. & FORECAST, BY PACKAGING, 2025-2034 (USD Billions) 
    533. BY END-USER INDUSTRY, 2025-2034 (USD Billions) 
    534.     Table 139.
    535. Mexico High Purity Ultra Pure Ga Market SIZE ESTIMATES & FORECAST, BY REGIONAL,
    536. 2034 (USD Billions) 
    537.     Table 140. Argentina High Purity
    538. Ultra Pure Ga Market SIZE ESTIMATES & FORECAST, BY APPLICATION, 2025-2034 (USD
    539. Billions) 
    540.     Table 141. Argentina High Purity Ultra Pure Ga
    541. Market SIZE ESTIMATES & FORECAST, BY PURITY LEVEL (99.99% TO 99.9999%), 2025-2034
    542. (USD Billions) 
    543.     Table 142. Argentina High Purity Ultra Pure
    544. Ga Market SIZE ESTIMATES & FORECAST, BY FORM, 2025-2034 (USD Billions) 
    545.     Table 143. Argentina High Purity Ultra Pure Ga Market SIZE ESTIMATES
    546. & FORECAST, BY PACKAGING, 2025-2034 (USD Billions) 
    547. BY END-USER INDUSTRY, 2025-2034 (USD Billions) 
    548.     Table 145.
    549. Argentina High Purity Ultra Pure Ga Market SIZE ESTIMATES & FORECAST, BY REGIONAL,
    550. 2034 (USD Billions) 
    551.     Table 146. Rest of South America
    552. High Purity Ultra Pure Ga Market SIZE ESTIMATES & FORECAST, BY APPLICATION,
    553. 2034 (USD Billions) 
    554.     Table 147. Rest of South America
    555. High Purity Ultra Pure Ga Market SIZE ESTIMATES & FORECAST, BY PURITY LEVEL
    556. (99.99% TO 99.9999%), 2025-2034 (USD Billions) 
    557.     Table 148.
    558. Rest of South America High Purity Ultra Pure Ga Market SIZE ESTIMATES & FORECAST,
    559. BY FORM, 2025-2034 (USD Billions) 
    560.     Table 149. Rest of South
    561. America High Purity Ultra Pure Ga Market SIZE ESTIMATES & FORECAST, BY PACKAGING,
    562. 2034 (USD Billions) 
    563.     Table 150. Rest of South America
    564. High Purity Ultra Pure Ga Market SIZE ESTIMATES & FORECAST, BY END-USER INDUSTRY,
    565. 2034 (USD Billions) 
    566.     Table 151. Rest of South America
    567. High Purity Ultra Pure Ga Market SIZE ESTIMATES & FORECAST, BY REGIONAL, 2025-2034
    568. (USD Billions) 
    569.     Table 152. MEA High Purity Ultra Pure Ga
    570. Market SIZE ESTIMATES & FORECAST, BY APPLICATION, 2025-2034 (USD Billions) 
    571.     Table 153. MEA High Purity Ultra Pure Ga Market SIZE ESTIMATES &
    572. FORECAST, BY PURITY LEVEL (99.99% TO 99.9999%), 2025-2034 (USD Billions) 
    573.     Table 154. MEA High Purity Ultra Pure Ga Market SIZE ESTIMATES &
    574. FORECAST, BY FORM, 2025-2034 (USD Billions) 
    575.     Table 155.
    576. MEA High Purity Ultra Pure Ga Market SIZE ESTIMATES & FORECAST, BY PACKAGING,
    577. 2034 (USD Billions) 
    578.     Table 156. MEA High Purity Ultra
    579. Pure Ga Market SIZE ESTIMATES & FORECAST, BY END-USER INDUSTRY, 2025-2034 (USD
    580. Billions) 
    581.     Table 157. MEA High Purity Ultra Pure Ga Market
    582. SIZE ESTIMATES & FORECAST, BY REGIONAL, 2025-2034 (USD Billions) 
    583.   Table 158. GCC Countries High Purity Ultra Pure Ga Market SIZE ESTIMATES
    584. & FORECAST, BY APPLICATION, 2025-2034 (USD Billions) 
    585. BY PURITY LEVEL (99.99% TO 99.9999%), 2025-2034 (USD Billions) 
    586.   Table 160. GCC Countries High Purity Ultra Pure Ga Market SIZE ESTIMATES
    587. & FORECAST, BY FORM, 2025-2034 (USD Billions) 
    588.     Table
    589. GCC Countries High Purity Ultra Pure Ga Market SIZE ESTIMATES & FORECAST,
    590. BY PACKAGING, 2025-2034 (USD Billions) 
    591.     Table 162. GCC Countries
    592. High Purity Ultra Pure Ga Market SIZE ESTIMATES & FORECAST, BY END-USER INDUSTRY,
    593. 2034 (USD Billions) 
    594.     Table 163. GCC Countries High
    595. Purity Ultra Pure Ga Market SIZE ESTIMATES & FORECAST, BY REGIONAL, 2025-2034
    596. (USD Billions) 
    597.     Table 164. South Africa High Purity Ultra
    598. Pure Ga Market SIZE ESTIMATES & FORECAST, BY APPLICATION, 2025-2034 (USD Billions) 
    599.     Table 165. South Africa High Purity Ultra Pure Ga Market SIZE ESTIMATES
    600. & FORECAST, BY PURITY LEVEL (99.99% TO 99.9999%), 2025-2034 (USD Billions) 
    601.     Table 166. South Africa High Purity Ultra Pure Ga Market SIZE ESTIMATES
    602. & FORECAST, BY FORM, 2025-2034 (USD Billions) 
    603.     Table
    604. South Africa High Purity Ultra Pure Ga Market SIZE ESTIMATES & FORECAST,
    605. BY PACKAGING, 2025-2034 (USD Billions) 
    606.     Table 168. South
    607. Africa High Purity Ultra Pure Ga Market SIZE ESTIMATES & FORECAST, BY END-USER
    608. INDUSTRY, 2025-2034 (USD Billions) 
    609.     Table 169. South Africa
    610. High Purity Ultra Pure Ga Market SIZE ESTIMATES & FORECAST, BY REGIONAL, 2025-2034
    611. (USD Billions) 
    612.     Table 170. Rest of MEA High Purity Ultra
    613. Pure Ga Market SIZE ESTIMATES & FORECAST, BY APPLICATION, 2025-2034 (USD Billions) 
    614.     Table 171. Rest of MEA High Purity Ultra Pure Ga Market SIZE ESTIMATES
    615. & FORECAST, BY PURITY LEVEL (99.99% TO 99.9999%), 2025-2034 (USD Billions) 
    616.     Table 172. Rest of MEA High Purity Ultra Pure Ga Market SIZE ESTIMATES
    617. & FORECAST, BY FORM, 2025-2034 (USD Billions) 
    618.     Table
    619. Rest of MEA High Purity Ultra Pure Ga Market SIZE ESTIMATES & FORECAST,
    620. BY PACKAGING, 2025-2034 (USD Billions) 
    621.     Table 174. Rest
    622. of MEA High Purity Ultra Pure Ga Market SIZE ESTIMATES & FORECAST, BY END-USER
    623. INDUSTRY, 2025-2034 (USD Billions) 
    624.     Table 175. Rest of MEA
    625. High Purity Ultra Pure Ga Market SIZE ESTIMATES & FORECAST, BY REGIONAL, 2025-2034
    626. (USD Billions) 
    627.     Table 176. PRODUCT LAUNCH/PRODUCT DEVELOPMENT/APPROVAL 
    628.     Table 177. ACQUISITION/PARTNERSHIP 
    629.     Figure 1. MARKET SYNOPSIS 
    630.     Figure 2. NORTH AMERICA HIGH PURITY ULTRA PURE GA MARKET ANALYSIS 
    631.     Figure 3. US HIGH PURITY ULTRA PURE GA MARKET ANALYSIS BY APPLICATION 
    632.     Figure 4. US HIGH PURITY ULTRA PURE GA MARKET ANALYSIS BY PURITY
    633. LEVEL (99.99% TO 99.9999%) 
    634.     Figure 5. US HIGH PURITY ULTRA
    635. PURE GA MARKET ANALYSIS BY FORM 
    636.     Figure 6. US HIGH PURITY
    637. ULTRA PURE GA MARKET ANALYSIS BY PACKAGING 
    638.     Figure 7. US
    639. HIGH PURITY ULTRA PURE GA MARKET ANALYSIS BY END-USER INDUSTRY 
    640.   Figure 8. US HIGH PURITY ULTRA PURE GA MARKET ANALYSIS BY REGIONAL 
    641.     Figure 9. CANADA HIGH PURITY ULTRA PURE GA MARKET ANALYSIS BY APPLICATION 
    642.     Figure 10. CANADA HIGH PURITY ULTRA PURE GA MARKET ANALYSIS BY PURITY
    643. LEVEL (99.99% TO 99.9999%) 
    644.     Figure 11. CANADA HIGH PURITY
    645. ULTRA PURE GA MARKET ANALYSIS BY FORM 
    646.     Figure 12. CANADA
    647. HIGH PURITY ULTRA PURE GA MARKET ANALYSIS BY PACKAGING 
    648.     Figure 14. CANADA HIGH PURITY ULTRA PURE GA MARKET ANALYSIS BY REGIONAL 
    649.     Figure 15. EUROPE HIGH PURITY ULTRA PURE GA MARKET ANALYSIS 
    650.     Figure 16. GERMANY HIGH PURITY ULTRA PURE GA MARKET ANALYSIS BY
    651. APPLICATION 
    652.     Figure 17. GERMANY HIGH PURITY ULTRA PURE GA
    653. MARKET ANALYSIS BY PURITY LEVEL (99.99% TO 99.9999%) 
    654.     Figure
    655. GERMANY HIGH PURITY ULTRA PURE GA MARKET ANALYSIS BY FORM 
    656.   Figure 19. GERMANY HIGH PURITY ULTRA PURE GA MARKET ANALYSIS BY PACKAGING 
    657.     Figure 20. GERMANY HIGH PURITY ULTRA PURE GA MARKET ANALYSIS BY
    658. END-USER INDUSTRY 
    659.     Figure 21. GERMANY HIGH PURITY ULTRA
    660. PURE GA MARKET ANALYSIS BY REGIONAL 
    661.     Figure 22. UK HIGH
    662. PURITY ULTRA PURE GA MARKET ANALYSIS BY APPLICATION 
    663.     Figure
    664. UK HIGH PURITY ULTRA PURE GA MARKET ANALYSIS BY PURITY LEVEL (99.99% TO 99.9999%) 
    665.     Figure 24. UK HIGH PURITY ULTRA PURE GA MARKET ANALYSIS BY FORM 
    666.     Figure 25. UK HIGH PURITY ULTRA PURE GA MARKET ANALYSIS BY PACKAGING 
    667.     Figure 26. UK HIGH PURITY ULTRA PURE GA MARKET ANALYSIS BY END-USER
    668. INDUSTRY 
    669.     Figure 27. UK HIGH PURITY ULTRA PURE GA MARKET
    670. ANALYSIS BY REGIONAL 
    671.     Figure 28. FRANCE HIGH PURITY ULTRA
    672. PURE GA MARKET ANALYSIS BY APPLICATION 
    673.     Figure 29. FRANCE
    674. HIGH PURITY ULTRA PURE GA MARKET ANALYSIS BY PURITY LEVEL (99.99% TO 99.9999%) 
    675.     Figure 30. FRANCE HIGH PURITY ULTRA PURE GA MARKET ANALYSIS BY FORM 
    676.     Figure 31. FRANCE HIGH PURITY ULTRA PURE GA MARKET ANALYSIS BY PACKAGING 
    677.     Figure 32. FRANCE HIGH PURITY ULTRA PURE GA MARKET ANALYSIS BY END-USER
    678. INDUSTRY 
    679.     Figure 33. FRANCE HIGH PURITY ULTRA PURE GA MARKET
    680. ANALYSIS BY REGIONAL 
    681.     Figure 34. RUSSIA HIGH PURITY ULTRA
    682. PURE GA MARKET ANALYSIS BY APPLICATION 
    683.     Figure 35. RUSSIA
    684. HIGH PURITY ULTRA PURE GA MARKET ANALYSIS BY PURITY LEVEL (99.99% TO 99.9999%) 
    685.     Figure 36. RUSSIA HIGH PURITY ULTRA PURE GA MARKET ANALYSIS BY FORM 
    686.     Figure 37. RUSSIA HIGH PURITY ULTRA PURE GA MARKET ANALYSIS BY PACKAGING 
    687.     Figure 38. RUSSIA HIGH PURITY ULTRA PURE GA MARKET ANALYSIS BY END-USER
    688. INDUSTRY 
    689.     Figure 39. RUSSIA HIGH PURITY ULTRA PURE GA MARKET
    690. ANALYSIS BY REGIONAL 
    691.     Figure 40. ITALY HIGH PURITY ULTRA
    692. PURE GA MARKET ANALYSIS BY APPLICATION 
    693.     Figure 41. ITALY
    694. HIGH PURITY ULTRA PURE GA MARKET ANALYSIS BY PURITY LEVEL (99.99% TO 99.9999%) 
    695.     Figure 42. ITALY HIGH PURITY ULTRA PURE GA MARKET ANALYSIS BY FORM 
    696.     Figure 43. ITALY HIGH PURITY ULTRA PURE GA MARKET ANALYSIS BY PACKAGING 
    697.     Figure 44. ITALY HIGH PURITY ULTRA PURE GA MARKET ANALYSIS BY END-USER
    698. INDUSTRY 
    699.     Figure 45. ITALY HIGH PURITY ULTRA PURE GA MARKET
    700. ANALYSIS BY REGIONAL 
    701.     Figure 46. SPAIN HIGH PURITY ULTRA
    702. PURE GA MARKET ANALYSIS BY APPLICATION 
    703.     Figure 47. SPAIN
    704. HIGH PURITY ULTRA PURE GA MARKET ANALYSIS BY PURITY LEVEL (99.99% TO 99.9999%) 
    705.     Figure 48. SPAIN HIGH PURITY ULTRA PURE GA MARKET ANALYSIS BY FORM 
    706.     Figure 49. SPAIN HIGH PURITY ULTRA PURE GA MARKET ANALYSIS BY PACKAGING 
    707.     Figure 50. SPAIN HIGH PURITY ULTRA PURE GA MARKET ANALYSIS BY END-USER
    708. INDUSTRY 
    709.     Figure 51. SPAIN HIGH PURITY ULTRA PURE GA MARKET
    710. ANALYSIS BY REGIONAL 
    711.     Figure 52. REST OF EUROPE HIGH PURITY
    712. ULTRA PURE GA MARKET ANALYSIS BY APPLICATION 
    713.     Figure 53.
    714. REST OF EUROPE HIGH PURITY ULTRA PURE GA MARKET ANALYSIS BY PURITY LEVEL (99.99%
    715. TO 99.9999%) 
    716.     Figure 54. REST OF EUROPE HIGH PURITY ULTRA
    717. PURE GA MARKET ANALYSIS BY FORM 
    718.     Figure 55. REST OF EUROPE
    719. HIGH PURITY ULTRA PURE GA MARKET ANALYSIS BY PACKAGING 
    720. INDUSTRY 
    721.     Figure 57. REST OF EUROPE HIGH PURITY ULTRA PURE
    722. GA MARKET ANALYSIS BY REGIONAL 
    723.     Figure 58. APAC HIGH PURITY
    724. ULTRA PURE GA MARKET ANALYSIS 
    725.     Figure 59. CHINA HIGH PURITY
    726. ULTRA PURE GA MARKET ANALYSIS BY APPLICATION 
    727.     Figure 60.
    728. CHINA HIGH PURITY ULTRA PURE GA MARKET ANALYSIS BY PURITY LEVEL (99.99% TO 99.9999%) 
    729.     Figure 61. CHINA HIGH PURITY ULTRA PURE GA MARKET ANALYSIS BY FORM 
    730.     Figure 62. CHINA HIGH PURITY ULTRA PURE GA MARKET ANALYSIS BY PACKAGING 
    731.     Figure 63. CHINA HIGH PURITY ULTRA PURE GA MARKET ANALYSIS BY END-USER
    732. INDUSTRY 
    733.     Figure 64. CHINA HIGH PURITY ULTRA PURE GA MARKET
    734. ANALYSIS BY REGIONAL 
    735.     Figure 65. INDIA HIGH PURITY ULTRA
    736. PURE GA MARKET ANALYSIS BY APPLICATION 
    737.     Figure 66. INDIA
    738. HIGH PURITY ULTRA PURE GA MARKET ANALYSIS BY PURITY LEVEL (99.99% TO 99.9999%) 
    739.     Figure 67. INDIA HIGH PURITY ULTRA PURE GA MARKET ANALYSIS BY FORM 
    740.     Figure 68. INDIA HIGH PURITY ULTRA PURE GA MARKET ANALYSIS BY PACKAGING 
    741.     Figure 69. INDIA HIGH PURITY ULTRA PURE GA MARKET ANALYSIS BY END-USER
    742. INDUSTRY 
    743.     Figure 70. INDIA HIGH PURITY ULTRA PURE GA MARKET
    744. ANALYSIS BY REGIONAL 
    745.     Figure 71. JAPAN HIGH PURITY ULTRA
    746. PURE GA MARKET ANALYSIS BY APPLICATION 
    747.     Figure 72. JAPAN
    748. HIGH PURITY ULTRA PURE GA MARKET ANALYSIS BY PURITY LEVEL (99.99% TO 99.9999%) 
    749.     Figure 73. JAPAN HIGH PURITY ULTRA PURE GA MARKET ANALYSIS BY FORM 
    750.     Figure 74. JAPAN HIGH PURITY ULTRA PURE GA MARKET ANALYSIS BY PACKAGING 
    751.     Figure 75. JAPAN HIGH PURITY ULTRA PURE GA MARKET ANALYSIS BY END-USER
    752. INDUSTRY 
    753.     Figure 76. JAPAN HIGH PURITY ULTRA PURE GA MARKET
    754. ANALYSIS BY REGIONAL 
    755.     Figure 77. SOUTH KOREA HIGH PURITY
    756. ULTRA PURE GA MARKET ANALYSIS BY APPLICATION 
    757.     Figure 78.
    758. SOUTH KOREA HIGH PURITY ULTRA PURE GA MARKET ANALYSIS BY PURITY LEVEL (99.99% TO
    759.     Figure 79. SOUTH KOREA HIGH PURITY ULTRA PURE
    760. GA MARKET ANALYSIS BY FORM 
    761.     Figure 80. SOUTH KOREA HIGH
    762. PURITY ULTRA PURE GA MARKET ANALYSIS BY PACKAGING 
    763.     Figure
    764. SOUTH KOREA HIGH PURITY ULTRA PURE GA MARKET ANALYSIS BY END-USER INDUSTRY 
    765.     Figure 82. SOUTH KOREA HIGH PURITY ULTRA PURE GA MARKET ANALYSIS
    766. BY REGIONAL 
    767.     Figure 83. MALAYSIA HIGH PURITY ULTRA PURE
    768. GA MARKET ANALYSIS BY APPLICATION 
    769.     Figure 84. MALAYSIA HIGH
    770. PURITY ULTRA PURE GA MARKET ANALYSIS BY PURITY LEVEL (99.99% TO 99.9999%) 
    771.     Figure 85. MALAYSIA HIGH PURITY ULTRA PURE GA MARKET ANALYSIS BY
    772. FORM 
    773.     Figure 86. MALAYSIA HIGH PURITY ULTRA PURE GA MARKET
    774. ANALYSIS BY PACKAGING 
    775.     Figure 87. MALAYSIA HIGH PURITY ULTRA
    776. PURE GA MARKET ANALYSIS BY END-USER INDUSTRY 
    777.     Figure 88.
    778. MALAYSIA HIGH PURITY ULTRA PURE GA MARKET ANALYSIS BY REGIONAL 
    779.   Figure 89. THAILAND HIGH PURITY ULTRA PURE GA MARKET ANALYSIS BY APPLICATION 
    780.     Figure 90. THAILAND HIGH PURITY ULTRA PURE GA MARKET ANALYSIS BY
    781. PURITY LEVEL (99.99% TO 99.9999%) 
    782.     Figure 91. THAILAND HIGH
    783. PURITY ULTRA PURE GA MARKET ANALYSIS BY FORM 
    784.     Figure 92.
    785. THAILAND HIGH PURITY ULTRA PURE GA MARKET ANALYSIS BY PACKAGING 
    786.   Figure 93. THAILAND HIGH PURITY ULTRA PURE GA MARKET ANALYSIS BY END-USER
    787. INDUSTRY 
    788.     Figure 94. THAILAND HIGH PURITY ULTRA PURE GA
    789. MARKET ANALYSIS BY REGIONAL 
    790.     Figure 95. INDONESIA HIGH PURITY
    791. ULTRA PURE GA MARKET ANALYSIS BY APPLICATION 
    792.     Figure 96.
    793. INDONESIA HIGH PURITY ULTRA PURE GA MARKET ANALYSIS BY PURITY LEVEL (99.99% TO 99.9999%) 
    794.     Figure 97. INDONESIA HIGH PURITY ULTRA PURE GA MARKET ANALYSIS BY
    795. FORM 
    796.     Figure 98. INDONESIA HIGH PURITY ULTRA PURE GA MARKET
    797. ANALYSIS BY PACKAGING 
    798.     Figure 99. INDONESIA HIGH PURITY
    799. ULTRA PURE GA MARKET ANALYSIS BY END-USER INDUSTRY 
    800.     Figure
    801. INDONESIA HIGH PURITY ULTRA PURE GA MARKET ANALYSIS BY REGIONAL 
    802.   Figure 101. REST OF APAC HIGH PURITY ULTRA PURE GA MARKET ANALYSIS BY APPLICATION 
    803.     Figure 102. REST OF APAC HIGH PURITY ULTRA PURE GA MARKET ANALYSIS
    804. BY PURITY LEVEL (99.99% TO 99.9999%) 
    805.     Figure 103. REST OF
    806. APAC HIGH PURITY ULTRA PURE GA MARKET ANALYSIS BY FORM 
    807.     Figure 105. REST OF APAC HIGH PURITY ULTRA PURE GA MARKET ANALYSIS
    808. BY END-USER INDUSTRY 
    809.     Figure 106. REST OF APAC HIGH PURITY
    810. ULTRA PURE GA MARKET ANALYSIS BY REGIONAL 
    811.     Figure 107. SOUTH
    812. AMERICA HIGH PURITY ULTRA PURE GA MARKET ANALYSIS 
    813.     Figure
    814. BRAZIL HIGH PURITY ULTRA PURE GA MARKET ANALYSIS BY APPLICATION 
    815.   Figure 109. BRAZIL HIGH PURITY ULTRA PURE GA MARKET ANALYSIS BY PURITY LEVEL
    816. (99.99% TO 99.9999%) 
    817.     Figure 110. BRAZIL HIGH PURITY ULTRA
    818. PURE GA MARKET ANALYSIS BY FORM 
    819.     Figure 111. BRAZIL HIGH
    820. PURITY ULTRA PURE GA MARKET ANALYSIS BY PACKAGING 
    821.     Figure
    822. BRAZIL HIGH PURITY ULTRA PURE GA MARKET ANALYSIS BY END-USER INDUSTRY 
    823.     Figure 113. BRAZIL HIGH PURITY ULTRA PURE GA MARKET ANALYSIS BY
    824. REGIONAL 
    825.     Figure 114. MEXICO HIGH PURITY ULTRA PURE GA MARKET
    826. ANALYSIS BY APPLICATION 
    827.     Figure 115. MEXICO HIGH PURITY
    828. ULTRA PURE GA MARKET ANALYSIS BY PURITY LEVEL (99.99% TO 99.9999%) 
    829.   Figure 116. MEXICO HIGH PURITY ULTRA PURE GA MARKET ANALYSIS BY FORM 
    830.     Figure 117. MEXICO HIGH PURITY ULTRA PURE GA MARKET ANALYSIS BY
    831. PACKAGING 
    832.     Figure 118. MEXICO HIGH PURITY ULTRA PURE GA
    833. MARKET ANALYSIS BY END-USER INDUSTRY 
    834.     Figure 119. MEXICO
    835. HIGH PURITY ULTRA PURE GA MARKET ANALYSIS BY REGIONAL 
    836.     Figure
    837. ARGENTINA HIGH PURITY ULTRA PURE GA MARKET ANALYSIS BY APPLICATION 
    838.     Figure 121. ARGENTINA HIGH PURITY ULTRA PURE GA MARKET ANALYSIS
    839. BY PURITY LEVEL (99.99% TO 99.9999%) 
    840.     Figure 122. ARGENTINA
    841. HIGH PURITY ULTRA PURE GA MARKET ANALYSIS BY FORM 
    842.     Figure
    843. ARGENTINA HIGH PURITY ULTRA PURE GA MARKET ANALYSIS BY PACKAGING 
    844.   Figure 124. ARGENTINA HIGH PURITY ULTRA PURE GA MARKET ANALYSIS BY END-USER
    845. INDUSTRY 
    846.     Figure 125. ARGENTINA HIGH PURITY ULTRA PURE GA
    847. MARKET ANALYSIS BY REGIONAL 
    848.     Figure 126. REST OF SOUTH AMERICA
    849. HIGH PURITY ULTRA PURE GA MARKET ANALYSIS BY APPLICATION 
    850. LEVEL (99.99% TO 99.9999%) 
    851.     Figure 128. REST OF SOUTH AMERICA
    852. HIGH PURITY ULTRA PURE GA MARKET ANALYSIS BY FORM 
    853.     Figure
    854. REST OF SOUTH AMERICA HIGH PURITY ULTRA PURE GA MARKET ANALYSIS BY PACKAGING 
    855.     Figure 130. REST OF SOUTH AMERICA HIGH PURITY ULTRA PURE GA MARKET
    856. ANALYSIS BY END-USER INDUSTRY 
    857.     Figure 131. REST OF SOUTH
    858. AMERICA HIGH PURITY ULTRA PURE GA MARKET ANALYSIS BY REGIONAL 
    859.   Figure 132. MEA HIGH PURITY ULTRA PURE GA MARKET ANALYSIS 
    860.   Figure 133. GCC COUNTRIES HIGH PURITY ULTRA PURE GA MARKET ANALYSIS BY APPLICATION 
    861.     Figure 134. GCC COUNTRIES HIGH PURITY ULTRA PURE GA MARKET ANALYSIS
    862. BY PURITY LEVEL (99.99% TO 99.9999%) 
    863.     Figure 135. GCC COUNTRIES
    864. HIGH PURITY ULTRA PURE GA MARKET ANALYSIS BY FORM 
    865.     Figure
    866. GCC COUNTRIES HIGH PURITY ULTRA PURE GA MARKET ANALYSIS BY PACKAGING 
    867.     Figure 137. GCC COUNTRIES HIGH PURITY ULTRA PURE GA MARKET ANALYSIS
    868. BY END-USER INDUSTRY 
    869.     Figure 138. GCC COUNTRIES HIGH PURITY
    870. ULTRA PURE GA MARKET ANALYSIS BY REGIONAL 
    871.     Figure 139. SOUTH
    872. AFRICA HIGH PURITY ULTRA PURE GA MARKET ANALYSIS BY APPLICATION 
    873.   Figure 140. SOUTH AFRICA HIGH PURITY ULTRA PURE GA MARKET ANALYSIS BY PURITY
    874. LEVEL (99.99% TO 99.9999%) 
    875.     Figure 141. SOUTH AFRICA HIGH
    876. PURITY ULTRA PURE GA MARKET ANALYSIS BY FORM 
    877.     Figure 142.
    878. SOUTH AFRICA HIGH PURITY ULTRA PURE GA MARKET ANALYSIS BY PACKAGING 
    879.   Figure 143. SOUTH AFRICA HIGH PURITY ULTRA PURE GA MARKET ANALYSIS BY END-USER
    880. INDUSTRY 
    881.     Figure 144. SOUTH AFRICA HIGH PURITY ULTRA PURE
    882. GA MARKET ANALYSIS BY REGIONAL 
    883.     Figure 145. REST OF MEA
    884. HIGH PURITY ULTRA PURE GA MARKET ANALYSIS BY APPLICATION 
    885. (99.99% TO 99.9999%) 
    886.     Figure 147. REST OF MEA HIGH PURITY
    887. ULTRA PURE GA MARKET ANALYSIS BY FORM 
    888.     Figure 148. REST
    889. OF MEA HIGH PURITY ULTRA PURE GA MARKET ANALYSIS BY PACKAGING 
    890.   Figure 149. REST OF MEA HIGH PURITY ULTRA PURE GA MARKET ANALYSIS BY END-USER
    891. INDUSTRY 
    892.     Figure 150. REST OF MEA HIGH PURITY ULTRA PURE
    893. GA MARKET ANALYSIS BY REGIONAL 
    894.     Figure 151. KEY BUYING CRITERIA
    895. OF HIGH PURITY ULTRA PURE GA MARKET 
    896.     Figure 152. RESEARCH
    897. PROCESS OF MRFR 
    898.     Figure 153. DRO ANALYSIS OF HIGH PURITY
    899. ULTRA PURE GA MARKET 
    900.     Figure 154. DRIVERS IMPACT ANALYSIS:
    901. HIGH PURITY ULTRA PURE GA MARKET 
    902.     Figure 155. RESTRAINTS
    903. IMPACT ANALYSIS: HIGH PURITY ULTRA PURE GA MARKET 
    904.     Figure
    905. SUPPLY / VALUE CHAIN: HIGH PURITY ULTRA PURE GA MARKET 
    906.     Figure 158. HIGH PURITY ULTRA PURE GA MARKET, BY APPLICATION, 2025-2034
    907. (USD Billions) 
    908.     Figure 159. HIGH PURITY ULTRA PURE GA MARKET,
    909. BY PURITY LEVEL (99.99% TO 99.9999%), 2024 (% SHARE) 
    910.     Figure
    911. HIGH PURITY ULTRA PURE GA MARKET, BY PURITY LEVEL (99.99% TO 99.9999%), 2025-2034
    912. (USD Billions) 
    913.     Figure 161. HIGH PURITY ULTRA PURE GA MARKET,
    914. BY FORM, 2024 (% SHARE) 
    915.     Figure 162. HIGH PURITY ULTRA PURE
    916. GA MARKET, BY FORM, 2025-2034 (USD Billions) 
    917.     Figure 163.
    918. HIGH PURITY ULTRA PURE GA MARKET, BY PACKAGING, 2024 (% SHARE) 
    919.   Figure 164. HIGH PURITY ULTRA PURE GA MARKET, BY PACKAGING, 2025-2034 (USD
    920. Billions) 
    921.     Figure 165. HIGH PURITY ULTRA PURE GA MARKET,
    922. BY END-USER INDUSTRY, 2024 (% SHARE) 
    923.     Figure 166. HIGH PURITY
    924. ULTRA PURE GA MARKET, BY END-USER INDUSTRY, 2025-2034 (USD Billions) 
    925.   Figure 167. HIGH PURITY ULTRA PURE GA MARKET, BY REGIONAL, 2024 (% SHARE) 
    926.     Figure 168. HIGH PURITY ULTRA PURE GA MARKET, BY REGIONAL, 2025-2034
    927. (USD Billions) 
    928.     Figure 169. BENCHMARKING OF MAJOR COMPETITORS

    High Purity Ultra Pure Ga Market Segmentation

    High Purity Ultra Pure Ga Market By Application (USD Billion, 2019-2032)

    • Electronic Circuitry
    • Semiconductor Production
    • Medical Materials
    • Optical Components
    • Scientific Research

    High Purity Ultra Pure Ga Market By Purity Level (99.99% to 99.9999%) (USD Billion, 2019-2032)

    • 99.99%
    • 99.999%
    • 99.9999%
    • 99.99999%

    High Purity Ultra Pure Ga Market By Form (USD Billion, 2019-2032)

    • Gallium (GA)
    • Gallium Arsenide (GaAs)
    • Gallium Nitride (GaN)

    High Purity Ultra Pure Ga Market By Packaging (USD Billion, 2019-2032)

    • Ingots
    • Wafers
    • Powder
    • Liquids

    High Purity Ultra Pure Ga Market By End-User Industry (USD Billion, 2019-2032)

    • Electronics Manufacturing
    • Semiconductor Industry
    • Medical and Healthcare
    • Aerospace and Defense
    • Research and Development

    High Purity Ultra Pure Ga Market By Regional (USD Billion, 2019-2032)

    • North America
    • Europe
    • South America
    • Asia Pacific
    • Middle East and Africa

    High Purity Ultra Pure Ga Market Regional Outlook (USD Billion, 2019-2032)

    • North America Outlook (USD Billion, 2019-2032)

      • North America High Purity Ultra Pure Ga Market by Application Type

        • Electronic Circuitry
        • Semiconductor Production
        • Medical Materials
        • Optical Components
        • Scientific Research
      • North America High Purity Ultra Pure Ga Market by Purity Level (99.99% to 99.9999%) Type

        • 99.99%
        • 99.999%
        • 99.9999%
        • 99.99999%
      • North America High Purity Ultra Pure Ga Market by Form Type

        • Gallium (GA)
        • Gallium Arsenide (GaAs)
        • Gallium Nitride (GaN)
      • North America High Purity Ultra Pure Ga Market by Packaging Type

        • Ingots
        • Wafers
        • Powder
        • Liquids
      • North America High Purity Ultra Pure Ga Market by End-User Industry Type

        • Electronics Manufacturing
        • Semiconductor Industry
        • Medical and Healthcare
        • Aerospace and Defense
        • Research and Development
      • North America High Purity Ultra Pure Ga Market by Regional Type

        • US
        • Canada
      • US Outlook (USD Billion, 2019-2032)
      • US High Purity Ultra Pure Ga Market by Application Type

        • Electronic Circuitry
        • Semiconductor Production
        • Medical Materials
        • Optical Components
        • Scientific Research
      • US High Purity Ultra Pure Ga Market by Purity Level (99.99% to 99.9999%) Type

        • 99.99%
        • 99.999%
        • 99.9999%
        • 99.99999%
      • US High Purity Ultra Pure Ga Market by Form Type

        • Gallium (GA)
        • Gallium Arsenide (GaAs)
        • Gallium Nitride (GaN)
      • US High Purity Ultra Pure Ga Market by Packaging Type

        • Ingots
        • Wafers
        • Powder
        • Liquids
      • US High Purity Ultra Pure Ga Market by End-User Industry Type

        • Electronics Manufacturing
        • Semiconductor Industry
        • Medical and Healthcare
        • Aerospace and Defense
        • Research and Development
      • CANADA Outlook (USD Billion, 2019-2032)
      • CANADA High Purity Ultra Pure Ga Market by Application Type

        • Electronic Circuitry
        • Semiconductor Production
        • Medical Materials
        • Optical Components
        • Scientific Research
      • CANADA High Purity Ultra Pure Ga Market by Purity Level (99.99% to 99.9999%) Type

        • 99.99%
        • 99.999%
        • 99.9999%
        • 99.99999%
      • CANADA High Purity Ultra Pure Ga Market by Form Type

        • Gallium (GA)
        • Gallium Arsenide (GaAs)
        • Gallium Nitride (GaN)
      • CANADA High Purity Ultra Pure Ga Market by Packaging Type

        • Ingots
        • Wafers
        • Powder
        • Liquids
      • CANADA High Purity Ultra Pure Ga Market by End-User Industry Type

        • Electronics Manufacturing
        • Semiconductor Industry
        • Medical and Healthcare
        • Aerospace and Defense
        • Research and Development
    • Europe Outlook (USD Billion, 2019-2032)

      • Europe High Purity Ultra Pure Ga Market by Application Type

        • Electronic Circuitry
        • Semiconductor Production
        • Medical Materials
        • Optical Components
        • Scientific Research
      • Europe High Purity Ultra Pure Ga Market by Purity Level (99.99% to 99.9999%) Type

        • 99.99%
        • 99.999%
        • 99.9999%
        • 99.99999%
      • Europe High Purity Ultra Pure Ga Market by Form Type

        • Gallium (GA)
        • Gallium Arsenide (GaAs)
        • Gallium Nitride (GaN)
      • Europe High Purity Ultra Pure Ga Market by Packaging Type

        • Ingots
        • Wafers
        • Powder
        • Liquids
      • Europe High Purity Ultra Pure Ga Market by End-User Industry Type

        • Electronics Manufacturing
        • Semiconductor Industry
        • Medical and Healthcare
        • Aerospace and Defense
        • Research and Development
      • Europe High Purity Ultra Pure Ga Market by Regional Type

        • Germany
        • UK
        • France
        • Russia
        • Italy
        • Spain
        • Rest of Europe
      • GERMANY Outlook (USD Billion, 2019-2032)
      • GERMANY High Purity Ultra Pure Ga Market by Application Type

        • Electronic Circuitry
        • Semiconductor Production
        • Medical Materials
        • Optical Components
        • Scientific Research
      • GERMANY High Purity Ultra Pure Ga Market by Purity Level (99.99% to 99.9999%) Type

        • 99.99%
        • 99.999%
        • 99.9999%
        • 99.99999%
      • GERMANY High Purity Ultra Pure Ga Market by Form Type

        • Gallium (GA)
        • Gallium Arsenide (GaAs)
        • Gallium Nitride (GaN)
      • GERMANY High Purity Ultra Pure Ga Market by Packaging Type

        • Ingots
        • Wafers
        • Powder
        • Liquids
      • GERMANY High Purity Ultra Pure Ga Market by End-User Industry Type

        • Electronics Manufacturing
        • Semiconductor Industry
        • Medical and Healthcare
        • Aerospace and Defense
        • Research and Development
      • UK Outlook (USD Billion, 2019-2032)
      • UK High Purity Ultra Pure Ga Market by Application Type

        • Electronic Circuitry
        • Semiconductor Production
        • Medical Materials
        • Optical Components
        • Scientific Research
      • UK High Purity Ultra Pure Ga Market by Purity Level (99.99% to 99.9999%) Type

        • 99.99%
        • 99.999%
        • 99.9999%
        • 99.99999%
      • UK High Purity Ultra Pure Ga Market by Form Type

        • Gallium (GA)
        • Gallium Arsenide (GaAs)
        • Gallium Nitride (GaN)
      • UK High Purity Ultra Pure Ga Market by Packaging Type

        • Ingots
        • Wafers
        • Powder
        • Liquids
      • UK High Purity Ultra Pure Ga Market by End-User Industry Type

        • Electronics Manufacturing
        • Semiconductor Industry
        • Medical and Healthcare
        • Aerospace and Defense
        • Research and Development
      • FRANCE Outlook (USD Billion, 2019-2032)
      • FRANCE High Purity Ultra Pure Ga Market by Application Type

        • Electronic Circuitry
        • Semiconductor Production
        • Medical Materials
        • Optical Components
        • Scientific Research
      • FRANCE High Purity Ultra Pure Ga Market by Purity Level (99.99% to 99.9999%) Type

        • 99.99%
        • 99.999%
        • 99.9999%
        • 99.99999%
      • FRANCE High Purity Ultra Pure Ga Market by Form Type

        • Gallium (GA)
        • Gallium Arsenide (GaAs)
        • Gallium Nitride (GaN)
      • FRANCE High Purity Ultra Pure Ga Market by Packaging Type

        • Ingots
        • Wafers
        • Powder
        • Liquids
      • FRANCE High Purity Ultra Pure Ga Market by End-User Industry Type

        • Electronics Manufacturing
        • Semiconductor Industry
        • Medical and Healthcare
        • Aerospace and Defense
        • Research and Development
      • RUSSIA Outlook (USD Billion, 2019-2032)
      • RUSSIA High Purity Ultra Pure Ga Market by Application Type

        • Electronic Circuitry
        • Semiconductor Production
        • Medical Materials
        • Optical Components
        • Scientific Research
      • RUSSIA High Purity Ultra Pure Ga Market by Purity Level (99.99% to 99.9999%) Type

        • 99.99%
        • 99.999%
        • 99.9999%
        • 99.99999%
      • RUSSIA High Purity Ultra Pure Ga Market by Form Type

        • Gallium (GA)
        • Gallium Arsenide (GaAs)
        • Gallium Nitride (GaN)
      • RUSSIA High Purity Ultra Pure Ga Market by Packaging Type

        • Ingots
        • Wafers
        • Powder
        • Liquids
      • RUSSIA High Purity Ultra Pure Ga Market by End-User Industry Type

        • Electronics Manufacturing
        • Semiconductor Industry
        • Medical and Healthcare
        • Aerospace and Defense
        • Research and Development
      • ITALY Outlook (USD Billion, 2019-2032)
      • ITALY High Purity Ultra Pure Ga Market by Application Type

        • Electronic Circuitry
        • Semiconductor Production
        • Medical Materials
        • Optical Components
        • Scientific Research
      • ITALY High Purity Ultra Pure Ga Market by Purity Level (99.99% to 99.9999%) Type

        • 99.99%
        • 99.999%
        • 99.9999%
        • 99.99999%
      • ITALY High Purity Ultra Pure Ga Market by Form Type

        • Gallium (GA)
        • Gallium Arsenide (GaAs)
        • Gallium Nitride (GaN)
      • ITALY High Purity Ultra Pure Ga Market by Packaging Type

        • Ingots
        • Wafers
        • Powder
        • Liquids
      • ITALY High Purity Ultra Pure Ga Market by End-User Industry Type

        • Electronics Manufacturing
        • Semiconductor Industry
        • Medical and Healthcare
        • Aerospace and Defense
        • Research and Development
      • SPAIN Outlook (USD Billion, 2019-2032)
      • SPAIN High Purity Ultra Pure Ga Market by Application Type

        • Electronic Circuitry
        • Semiconductor Production
        • Medical Materials
        • Optical Components
        • Scientific Research
      • SPAIN High Purity Ultra Pure Ga Market by Purity Level (99.99% to 99.9999%) Type

        • 99.99%
        • 99.999%
        • 99.9999%
        • 99.99999%
      • SPAIN High Purity Ultra Pure Ga Market by Form Type

        • Gallium (GA)
        • Gallium Arsenide (GaAs)
        • Gallium Nitride (GaN)
      • SPAIN High Purity Ultra Pure Ga Market by Packaging Type

        • Ingots
        • Wafers
        • Powder
        • Liquids
      • SPAIN High Purity Ultra Pure Ga Market by End-User Industry Type

        • Electronics Manufacturing
        • Semiconductor Industry
        • Medical and Healthcare
        • Aerospace and Defense
        • Research and Development
      • REST OF EUROPE Outlook (USD Billion, 2019-2032)
      • REST OF EUROPE High Purity Ultra Pure Ga Market by Application Type

        • Electronic Circuitry
        • Semiconductor Production
        • Medical Materials
        • Optical Components
        • Scientific Research
      • REST OF EUROPE High Purity Ultra Pure Ga Market by Purity Level (99.99% to 99.9999%) Type

        • 99.99%
        • 99.999%
        • 99.9999%
        • 99.99999%
      • REST OF EUROPE High Purity Ultra Pure Ga Market by Form Type

        • Gallium (GA)
        • Gallium Arsenide (GaAs)
        • Gallium Nitride (GaN)
      • REST OF EUROPE High Purity Ultra Pure Ga Market by Packaging Type

        • Ingots
        • Wafers
        • Powder
        • Liquids
      • REST OF EUROPE High Purity Ultra Pure Ga Market by End-User Industry Type

        • Electronics Manufacturing
        • Semiconductor Industry
        • Medical and Healthcare
        • Aerospace and Defense
        • Research and Development
    • APAC Outlook (USD Billion, 2019-2032)

      • APAC High Purity Ultra Pure Ga Market by Application Type

        • Electronic Circuitry
        • Semiconductor Production
        • Medical Materials
        • Optical Components
        • Scientific Research
      • APAC High Purity Ultra Pure Ga Market by Purity Level (99.99% to 99.9999%) Type

        • 99.99%
        • 99.999%
        • 99.9999%
        • 99.99999%
      • APAC High Purity Ultra Pure Ga Market by Form Type

        • Gallium (GA)
        • Gallium Arsenide (GaAs)
        • Gallium Nitride (GaN)
      • APAC High Purity Ultra Pure Ga Market by Packaging Type

        • Ingots
        • Wafers
        • Powder
        • Liquids
      • APAC High Purity Ultra Pure Ga Market by End-User Industry Type

        • Electronics Manufacturing
        • Semiconductor Industry
        • Medical and Healthcare
        • Aerospace and Defense
        • Research and Development
      • APAC High Purity Ultra Pure Ga Market by Regional Type

        • China
        • India
        • Japan
        • South Korea
        • Malaysia
        • Thailand
        • Indonesia
        • Rest of APAC
      • CHINA Outlook (USD Billion, 2019-2032)
      • CHINA High Purity Ultra Pure Ga Market by Application Type

        • Electronic Circuitry
        • Semiconductor Production
        • Medical Materials
        • Optical Components
        • Scientific Research
      • CHINA High Purity Ultra Pure Ga Market by Purity Level (99.99% to 99.9999%) Type

        • 99.99%
        • 99.999%
        • 99.9999%
        • 99.99999%
      • CHINA High Purity Ultra Pure Ga Market by Form Type

        • Gallium (GA)
        • Gallium Arsenide (GaAs)
        • Gallium Nitride (GaN)
      • CHINA High Purity Ultra Pure Ga Market by Packaging Type

        • Ingots
        • Wafers
        • Powder
        • Liquids
      • CHINA High Purity Ultra Pure Ga Market by End-User Industry Type

        • Electronics Manufacturing
        • Semiconductor Industry
        • Medical and Healthcare
        • Aerospace and Defense
        • Research and Development
      • INDIA Outlook (USD Billion, 2019-2032)
      • INDIA High Purity Ultra Pure Ga Market by Application Type

        • Electronic Circuitry
        • Semiconductor Production
        • Medical Materials
        • Optical Components
        • Scientific Research
      • INDIA High Purity Ultra Pure Ga Market by Purity Level (99.99% to 99.9999%) Type

        • 99.99%
        • 99.999%
        • 99.9999%
        • 99.99999%
      • INDIA High Purity Ultra Pure Ga Market by Form Type

        • Gallium (GA)
        • Gallium Arsenide (GaAs)
        • Gallium Nitride (GaN)
      • INDIA High Purity Ultra Pure Ga Market by Packaging Type

        • Ingots
        • Wafers
        • Powder
        • Liquids
      • INDIA High Purity Ultra Pure Ga Market by End-User Industry Type

        • Electronics Manufacturing
        • Semiconductor Industry
        • Medical and Healthcare
        • Aerospace and Defense
        • Research and Development
      • JAPAN Outlook (USD Billion, 2019-2032)
      • JAPAN High Purity Ultra Pure Ga Market by Application Type

        • Electronic Circuitry
        • Semiconductor Production
        • Medical Materials
        • Optical Components
        • Scientific Research
      • JAPAN High Purity Ultra Pure Ga Market by Purity Level (99.99% to 99.9999%) Type

        • 99.99%
        • 99.999%
        • 99.9999%
        • 99.99999%
      • JAPAN High Purity Ultra Pure Ga Market by Form Type

        • Gallium (GA)
        • Gallium Arsenide (GaAs)
        • Gallium Nitride (GaN)
      • JAPAN High Purity Ultra Pure Ga Market by Packaging Type

        • Ingots
        • Wafers
        • Powder
        • Liquids
      • JAPAN High Purity Ultra Pure Ga Market by End-User Industry Type

        • Electronics Manufacturing
        • Semiconductor Industry
        • Medical and Healthcare
        • Aerospace and Defense
        • Research and Development
      • SOUTH KOREA Outlook (USD Billion, 2019-2032)
      • SOUTH KOREA High Purity Ultra Pure Ga Market by Application Type

        • Electronic Circuitry
        • Semiconductor Production
        • Medical Materials
        • Optical Components
        • Scientific Research
      • SOUTH KOREA High Purity Ultra Pure Ga Market by Purity Level (99.99% to 99.9999%) Type

        • 99.99%
        • 99.999%
        • 99.9999%
        • 99.99999%
      • SOUTH KOREA High Purity Ultra Pure Ga Market by Form Type

        • Gallium (GA)
        • Gallium Arsenide (GaAs)
        • Gallium Nitride (GaN)
      • SOUTH KOREA High Purity Ultra Pure Ga Market by Packaging Type

        • Ingots
        • Wafers
        • Powder
        • Liquids
      • SOUTH KOREA High Purity Ultra Pure Ga Market by End-User Industry Type

        • Electronics Manufacturing
        • Semiconductor Industry
        • Medical and Healthcare
        • Aerospace and Defense
        • Research and Development
      • MALAYSIA Outlook (USD Billion, 2019-2032)
      • MALAYSIA High Purity Ultra Pure Ga Market by Application Type

        • Electronic Circuitry
        • Semiconductor Production
        • Medical Materials
        • Optical Components
        • Scientific Research
      • MALAYSIA High Purity Ultra Pure Ga Market by Purity Level (99.99% to 99.9999%) Type

        • 99.99%
        • 99.999%
        • 99.9999%
        • 99.99999%
      • MALAYSIA High Purity Ultra Pure Ga Market by Form Type

        • Gallium (GA)
        • Gallium Arsenide (GaAs)
        • Gallium Nitride (GaN)
      • MALAYSIA High Purity Ultra Pure Ga Market by Packaging Type

        • Ingots
        • Wafers
        • Powder
        • Liquids
      • MALAYSIA High Purity Ultra Pure Ga Market by End-User Industry Type

        • Electronics Manufacturing
        • Semiconductor Industry
        • Medical and Healthcare
        • Aerospace and Defense
        • Research and Development
      • THAILAND Outlook (USD Billion, 2019-2032)
      • THAILAND High Purity Ultra Pure Ga Market by Application Type

        • Electronic Circuitry
        • Semiconductor Production
        • Medical Materials
        • Optical Components
        • Scientific Research
      • THAILAND High Purity Ultra Pure Ga Market by Purity Level (99.99% to 99.9999%) Type

        • 99.99%
        • 99.999%
        • 99.9999%
        • 99.99999%
      • THAILAND High Purity Ultra Pure Ga Market by Form Type

        • Gallium (GA)
        • Gallium Arsenide (GaAs)
        • Gallium Nitride (GaN)
      • THAILAND High Purity Ultra Pure Ga Market by Packaging Type

        • Ingots
        • Wafers
        • Powder
        • Liquids
      • THAILAND High Purity Ultra Pure Ga Market by End-User Industry Type

        • Electronics Manufacturing
        • Semiconductor Industry
        • Medical and Healthcare
        • Aerospace and Defense
        • Research and Development
      • INDONESIA Outlook (USD Billion, 2019-2032)
      • INDONESIA High Purity Ultra Pure Ga Market by Application Type

        • Electronic Circuitry
        • Semiconductor Production
        • Medical Materials
        • Optical Components
        • Scientific Research
      • INDONESIA High Purity Ultra Pure Ga Market by Purity Level (99.99% to 99.9999%) Type

        • 99.99%
        • 99.999%
        • 99.9999%
        • 99.99999%
      • INDONESIA High Purity Ultra Pure Ga Market by Form Type

        • Gallium (GA)
        • Gallium Arsenide (GaAs)
        • Gallium Nitride (GaN)
      • INDONESIA High Purity Ultra Pure Ga Market by Packaging Type

        • Ingots
        • Wafers
        • Powder
        • Liquids
      • INDONESIA High Purity Ultra Pure Ga Market by End-User Industry Type

        • Electronics Manufacturing
        • Semiconductor Industry
        • Medical and Healthcare
        • Aerospace and Defense
        • Research and Development
      • REST OF APAC Outlook (USD Billion, 2019-2032)
      • REST OF APAC High Purity Ultra Pure Ga Market by Application Type

        • Electronic Circuitry
        • Semiconductor Production
        • Medical Materials
        • Optical Components
        • Scientific Research
      • REST OF APAC High Purity Ultra Pure Ga Market by Purity Level (99.99% to 99.9999%) Type

        • 99.99%
        • 99.999%
        • 99.9999%
        • 99.99999%
      • REST OF APAC High Purity Ultra Pure Ga Market by Form Type

        • Gallium (GA)
        • Gallium Arsenide (GaAs)
        • Gallium Nitride (GaN)
      • REST OF APAC High Purity Ultra Pure Ga Market by Packaging Type

        • Ingots
        • Wafers
        • Powder
        • Liquids
      • REST OF APAC High Purity Ultra Pure Ga Market by End-User Industry Type

        • Electronics Manufacturing
        • Semiconductor Industry
        • Medical and Healthcare
        • Aerospace and Defense
        • Research and Development
    • South America Outlook (USD Billion, 2019-2032)

      • South America High Purity Ultra Pure Ga Market by Application Type

        • Electronic Circuitry
        • Semiconductor Production
        • Medical Materials
        • Optical Components
        • Scientific Research
      • South America High Purity Ultra Pure Ga Market by Purity Level (99.99% to 99.9999%) Type

        • 99.99%
        • 99.999%
        • 99.9999%
        • 99.99999%
      • South America High Purity Ultra Pure Ga Market by Form Type

        • Gallium (GA)
        • Gallium Arsenide (GaAs)
        • Gallium Nitride (GaN)
      • South America High Purity Ultra Pure Ga Market by Packaging Type

        • Ingots
        • Wafers
        • Powder
        • Liquids
      • South America High Purity Ultra Pure Ga Market by End-User Industry Type

        • Electronics Manufacturing
        • Semiconductor Industry
        • Medical and Healthcare
        • Aerospace and Defense
        • Research and Development
      • South America High Purity Ultra Pure Ga Market by Regional Type

        • Brazil
        • Mexico
        • Argentina
        • Rest of South America
      • BRAZIL Outlook (USD Billion, 2019-2032)
      • BRAZIL High Purity Ultra Pure Ga Market by Application Type

        • Electronic Circuitry
        • Semiconductor Production
        • Medical Materials
        • Optical Components
        • Scientific Research
      • BRAZIL High Purity Ultra Pure Ga Market by Purity Level (99.99% to 99.9999%) Type

        • 99.99%
        • 99.999%
        • 99.9999%
        • 99.99999%
      • BRAZIL High Purity Ultra Pure Ga Market by Form Type

        • Gallium (GA)
        • Gallium Arsenide (GaAs)
        • Gallium Nitride (GaN)
      • BRAZIL High Purity Ultra Pure Ga Market by Packaging Type

        • Ingots
        • Wafers
        • Powder
        • Liquids
      • BRAZIL High Purity Ultra Pure Ga Market by End-User Industry Type

        • Electronics Manufacturing
        • Semiconductor Industry
        • Medical and Healthcare
        • Aerospace and Defense
        • Research and Development
      • MEXICO Outlook (USD Billion, 2019-2032)
      • MEXICO High Purity Ultra Pure Ga Market by Application Type

        • Electronic Circuitry
        • Semiconductor Production
        • Medical Materials
        • Optical Components
        • Scientific Research
      • MEXICO High Purity Ultra Pure Ga Market by Purity Level (99.99% to 99.9999%) Type

        • 99.99%
        • 99.999%
        • 99.9999%
        • 99.99999%
      • MEXICO High Purity Ultra Pure Ga Market by Form Type

        • Gallium (GA)
        • Gallium Arsenide (GaAs)
        • Gallium Nitride (GaN)
      • MEXICO High Purity Ultra Pure Ga Market by Packaging Type

        • Ingots
        • Wafers
        • Powder
        • Liquids
      • MEXICO High Purity Ultra Pure Ga Market by End-User Industry Type

        • Electronics Manufacturing
        • Semiconductor Industry
        • Medical and Healthcare
        • Aerospace and Defense
        • Research and Development
      • ARGENTINA Outlook (USD Billion, 2019-2032)
      • ARGENTINA High Purity Ultra Pure Ga Market by Application Type

        • Electronic Circuitry
        • Semiconductor Production
        • Medical Materials
        • Optical Components
        • Scientific Research
      • ARGENTINA High Purity Ultra Pure Ga Market by Purity Level (99.99% to 99.9999%) Type

        • 99.99%
        • 99.999%
        • 99.9999%
        • 99.99999%
      • ARGENTINA High Purity Ultra Pure Ga Market by Form Type

        • Gallium (GA)
        • Gallium Arsenide (GaAs)
        • Gallium Nitride (GaN)
      • ARGENTINA High Purity Ultra Pure Ga Market by Packaging Type

        • Ingots
        • Wafers
        • Powder
        • Liquids
      • ARGENTINA High Purity Ultra Pure Ga Market by End-User Industry Type

        • Electronics Manufacturing
        • Semiconductor Industry
        • Medical and Healthcare
        • Aerospace and Defense
        • Research and Development
      • REST OF SOUTH AMERICA Outlook (USD Billion, 2019-2032)
      • REST OF SOUTH AMERICA High Purity Ultra Pure Ga Market by Application Type

        • Electronic Circuitry
        • Semiconductor Production
        • Medical Materials
        • Optical Components
        • Scientific Research
      • REST OF SOUTH AMERICA High Purity Ultra Pure Ga Market by Purity Level (99.99% to 99.9999%) Type

        • 99.99%
        • 99.999%
        • 99.9999%
        • 99.99999%
      • REST OF SOUTH AMERICA High Purity Ultra Pure Ga Market by Form Type

        • Gallium (GA)
        • Gallium Arsenide (GaAs)
        • Gallium Nitride (GaN)
      • REST OF SOUTH AMERICA High Purity Ultra Pure Ga Market by Packaging Type

        • Ingots
        • Wafers
        • Powder
        • Liquids
      • REST OF SOUTH AMERICA High Purity Ultra Pure Ga Market by End-User Industry Type

        • Electronics Manufacturing
        • Semiconductor Industry
        • Medical and Healthcare
        • Aerospace and Defense
        • Research and Development
    • MEA Outlook (USD Billion, 2019-2032)

      • MEA High Purity Ultra Pure Ga Market by Application Type

        • Electronic Circuitry
        • Semiconductor Production
        • Medical Materials
        • Optical Components
        • Scientific Research
      • MEA High Purity Ultra Pure Ga Market by Purity Level (99.99% to 99.9999%) Type

        • 99.99%
        • 99.999%
        • 99.9999%
        • 99.99999%
      • MEA High Purity Ultra Pure Ga Market by Form Type

        • Gallium (GA)
        • Gallium Arsenide (GaAs)
        • Gallium Nitride (GaN)
      • MEA High Purity Ultra Pure Ga Market by Packaging Type

        • Ingots
        • Wafers
        • Powder
        • Liquids
      • MEA High Purity Ultra Pure Ga Market by End-User Industry Type

        • Electronics Manufacturing
        • Semiconductor Industry
        • Medical and Healthcare
        • Aerospace and Defense
        • Research and Development
      • MEA High Purity Ultra Pure Ga Market by Regional Type

        • GCC Countries
        • South Africa
        • Rest of MEA
      • GCC COUNTRIES Outlook (USD Billion, 2019-2032)
      • GCC COUNTRIES High Purity Ultra Pure Ga Market by Application Type

        • Electronic Circuitry
        • Semiconductor Production
        • Medical Materials
        • Optical Components
        • Scientific Research
      • GCC COUNTRIES High Purity Ultra Pure Ga Market by Purity Level (99.99% to 99.9999%) Type

        • 99.99%
        • 99.999%
        • 99.9999%
        • 99.99999%
      • GCC COUNTRIES High Purity Ultra Pure Ga Market by Form Type

        • Gallium (GA)
        • Gallium Arsenide (GaAs)
        • Gallium Nitride (GaN)
      • GCC COUNTRIES High Purity Ultra Pure Ga Market by Packaging Type

        • Ingots
        • Wafers
        • Powder
        • Liquids
      • GCC COUNTRIES High Purity Ultra Pure Ga Market by End-User Industry Type

        • Electronics Manufacturing
        • Semiconductor Industry
        • Medical and Healthcare
        • Aerospace and Defense
        • Research and Development
      • SOUTH AFRICA Outlook (USD Billion, 2019-2032)
      • SOUTH AFRICA High Purity Ultra Pure Ga Market by Application Type

        • Electronic Circuitry
        • Semiconductor Production
        • Medical Materials
        • Optical Components
        • Scientific Research
      • SOUTH AFRICA High Purity Ultra Pure Ga Market by Purity Level (99.99% to 99.9999%) Type

        • 99.99%
        • 99.999%
        • 99.9999%
        • 99.99999%
      • SOUTH AFRICA High Purity Ultra Pure Ga Market by Form Type

        • Gallium (GA)
        • Gallium Arsenide (GaAs)
        • Gallium Nitride (GaN)
      • SOUTH AFRICA High Purity Ultra Pure Ga Market by Packaging Type

        • Ingots
        • Wafers
        • Powder
        • Liquids
      • SOUTH AFRICA High Purity Ultra Pure Ga Market by End-User Industry Type

        • Electronics Manufacturing
        • Semiconductor Industry
        • Medical and Healthcare
        • Aerospace and Defense
        • Research and Development
      • REST OF MEA Outlook (USD Billion, 2019-2032)
      • REST OF MEA High Purity Ultra Pure Ga Market by Application Type

        • Electronic Circuitry
        • Semiconductor Production
        • Medical Materials
        • Optical Components
        • Scientific Research
      • REST OF MEA High Purity Ultra Pure Ga Market by Purity Level (99.99% to 99.9999%) Type

        • 99.99%
        • 99.999%
        • 99.9999%
        • 99.99999%
      • REST OF MEA High Purity Ultra Pure Ga Market by Form Type

        • Gallium (GA)
        • Gallium Arsenide (GaAs)
        • Gallium Nitride (GaN)
      • REST OF MEA High Purity Ultra Pure Ga Market by Packaging Type

        • Ingots
        • Wafers
        • Powder
        • Liquids
      • REST OF MEA High Purity Ultra Pure Ga Market by End-User Industry Type

        • Electronics Manufacturing
        • Semiconductor Industry
        • Medical and Healthcare
        • Aerospace and Defense
        • Research and Development
    Report Infographic
    Free Sample Request

    Kindly complete the form below to receive a free sample of this Report

    Customer Strories

    “I am very pleased with how market segments have been defined in a relevant way for my purposes (such as "Portable Freezers & refrigerators" and "last-mile"). In general the report is well structured. Thanks very much for your efforts.”

    Victoria Milne Founder
    Case Study

    Chemicals and Materials