• Cat-intel
  • MedIntelliX
  • Resources
  • About Us
  • Hero Background
    English
    Chinese
    French
    Japanese
    Korean
    German
    Spanish

    High-Intensity Sweeteners Market Size

    ID: MRFR/F-B & N/10122-CR
    130 Pages
    Snehal Singh
    May 2023

    High-Intensity Sweeteners Market Research Report Information by Product (sucralose, stevioside, acesulfame K, aspartame, cyclamate, glycyrrhizin, saccharin, ), Form (dry and liquid), Category (artificial and natural), Application (bakery & confectionery, beverages, dairy products, dietary products, pharmaceuticals, tabletop sweeteners, and processed foods), End User (residential and commerc...

    Share:
    Download PDF ×

    We do not share your information with anyone. However, we may send you emails based on your report interest from time to time. You may contact us at any time to opt-out.

    High-Intensity Sweeteners Market Infographic
    Purchase Options

    High Intensity Sweeteners Size

    High-Intensity Sweeteners Market Growth Projections and Opportunities

    The High-Intensity Sweeteners Market is influenced by a myriad of factors that contribute to its dynamics and growth in the food and beverage industry. One of the primary drivers of this market is the increasing global demand for low-calorie and sugar-free alternatives. As consumers become more health-conscious and seek ways to reduce sugar intake, high-intensity sweeteners offer a viable solution for sweetening products without the associated caloric content. The rising prevalence of lifestyle-related health issues, such as obesity and diabetes, has heightened awareness about the impact of excessive sugar consumption, driving the demand for high-intensity sweeteners across a wide range of food and beverage applications.

    Consumer preferences for healthier alternatives and sugar reduction play a significant role in shaping the High-Intensity Sweeteners Market. The market has responded to this demand by offering a variety of high-intensity sweeteners, such as aspartame, sucralose, steviol glycosides (derived from the stevia plant), and others. These sweeteners provide the sweetness of sugar without the calories, making them attractive to consumers who are mindful of their dietary choices and sugar intake.

    Economic factors, including income levels and affordability, play a crucial role in the High-Intensity Sweeteners Market. The cost-effectiveness of high-intensity sweeteners compared to sugar can influence consumer purchasing decisions, especially during periods of economic uncertainty. Food and beverage manufacturers may opt for high-intensity sweeteners as a cost-effective ingredient to formulate low-calorie and sugar-free products, providing consumers with more affordable alternatives to traditional sugar-sweetened products.

    Supply chain dynamics and regulatory considerations are pivotal factors in the High-Intensity Sweeteners Market. The production and supply of high-intensity sweeteners involve adherence to strict quality standards and regulatory requirements to ensure product safety. Regulatory approvals and compliance with food safety regulations contribute to the market's stability and the confidence of consumers and industry stakeholders in the safety and efficacy of high-intensity sweeteners.

    Technological advancements in sweetener formulations and product applications contribute to the growth and innovation within the High-Intensity Sweeteners Market. Ongoing research and development efforts focus on improving the taste profile, solubility, and stability of high-intensity sweeteners, addressing some of the challenges associated with certain sweeteners' aftertastes. The application of high-intensity sweeteners in a variety of food and beverage products, including beverages, dairy, confectionery, and baked goods, reflects the industry's commitment to providing diverse options for consumers seeking reduced-sugar alternatives.

    Health and wellness considerations are critical influencers in the High-Intensity Sweeteners Market. With the increasing awareness of the health risks associated with excessive sugar consumption, high-intensity sweeteners serve as an integral component of the food industry's response to the demand for healthier alternatives. The market caters to consumers looking for options to manage weight, control blood sugar levels, and reduce the risk of dental issues associated with high sugar intake.

    Cultural preferences and global dietary trends contribute to the High-Intensity Sweeteners Market's dynamics. Different regions have unique culinary traditions and preferences for sweetness intensity, influencing the types of high-intensity sweeteners used in various markets. Cultural shifts toward healthier eating habits and the global trend of reducing sugar intake further drive the adoption of high-intensity sweeteners as a versatile and widely accepted sweetening solution.
    High-Intensity Sweeteners Market Size Graph
    Author
    Snehal Singh
    Assistant Manager - Research

    High acumen in analyzing complex macro & micro markets with more than 6 years of work experience in the field of market research. By implementing her analytical skills in forecasting and estimation into market research reports, she has expertise in Packaging, Construction, and Equipment domains. She handles a team size of 20-25 resources and ensures smooth running of the projects, associated marketing activities, and client servicing.

    Leave a Comment

    FAQs

    How much is the high-intensity sweeteners market worth?

    High-Intensity Sweeteners Market is pegged at USD 4.57 billion as of 2030.

    How Big is the U.S high-intensity sweeteners market?

    US high-intensity sweeteners market is poised to grow at 77.93% market share during 2021.

    What is the growth rate of the high-intensity sweeteners market?

    High-Intensity Sweeteners Market is poised to grow at 6.47% CAGR during 2025-2035.

    Which region held the largest market share in the high-intensity sweeteners market?

    Asia-Pacific region held the largest market share in the High-Intensity Sweeteners Market and market share of 50.08% in 2021.

    Who are the key players in the high-intensity sweeteners market?

    Tate and Lyle (UK), Cargill, Incorporated (US), International Flavors & Fragrances Inc. (US), Archer Daniels Midland Company (ADM) (US), Ingredion Inc. (US), Ajinomoto Co., Inc (Japan), HYET Sweet (Netherlands), Hermes Sweeteners Ltd (Switzerland), JK Sucralose Inc. (China), and Heartland Food Products Group (US) are some of the vital players operating in the high-intensity sweeteners market.

    Which product led the high-intensity sweeteners market?

    Usage of Sucralose is poised to drive the high-intensity sweeteners market, which is poised to grow at market share 1.72 bn during 2022-2030

    Which form had the largest market share in the high-intensity sweeteners market?

    Dry is poised to hold an upper hand when it comes to sales of high-intensity sweeteners across diverse geographies.

    Market Summary

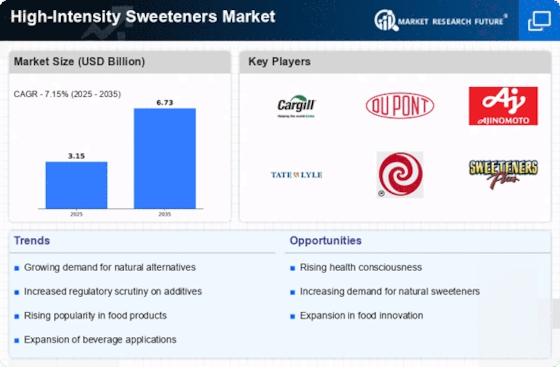
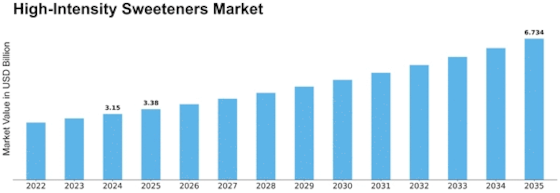
    As per MRFR analysis, the High-Intensity Sweeteners Market was estimated at 3.15 USD Billion in 2024. The High-Intensity Sweeteners industry is projected to grow from 3.375 USD Billion in 2025 to 6.734 USD Billion by 2035, exhibiting a compound annual growth rate (CAGR) of 7.15 during the forecast period 2025 - 2035.

    Key Market Trends & Highlights

    The High-Intensity Sweeteners Market is experiencing a dynamic shift towards health-conscious alternatives and natural products.

    • Health-conscious consumer trends are driving the demand for low-calorie sweeteners, particularly in North America.
    • The regulatory influence on product development is shaping the landscape of high-intensity sweeteners, fostering innovation.
    • Natural sweeteners, such as Stevioside, are gaining traction in the Asia-Pacific region, reflecting a shift towards organic options.
    • Health awareness and the rising demand for low-calorie options are key drivers propelling market growth, alongside regulatory support for sugar alternatives.

    Market Size & Forecast

    2024 Market Size 3.15 (USD Billion)
    2035 Market Size 6.734 (USD Billion)
    CAGR (2025 - 2035) 7.15%
    Largest Regional Market Share in 2024 Asia Pacific

    Major Players

    <p>Cargill (US), DuPont (US), Ajinomoto (JP), Tate & Lyle (GB), NutraSweet (US), Sweeteners Plus (US), Mitsubishi Corporation (JP), Südzucker AG (DE), Hawkins Watts (NZ)</p>

    Market Trends

    The High-Intensity Sweeteners Market is currently experiencing a notable transformation, driven by evolving consumer preferences and increasing health consciousness. As individuals become more aware of the implications of sugar consumption on health, there is a discernible shift towards alternatives that offer sweetness without the associated calories. This trend is further amplified by the growing demand for low-calorie and sugar-free products across various food and beverage categories. Manufacturers are responding to this shift by innovating and expanding their portfolios to include a diverse range of high-intensity sweeteners, catering to the needs of health-conscious consumers. Moreover, regulatory frameworks and safety assessments play a crucial role in shaping the High-Intensity Sweeteners Market. As governments and health organizations continue to evaluate the safety and efficacy of these sweeteners, the market landscape is likely to evolve. This scrutiny may lead to the introduction of new products that meet stringent safety standards, thereby enhancing consumer trust. Additionally, the rise of plant-based and natural sweeteners is influencing market dynamics, as consumers increasingly seek products derived from natural sources. Overall, the High-Intensity Sweeteners Market appears poised for growth, driven by innovation, regulatory developments, and changing consumer behaviors.

    Health-Conscious Consumer Trends

    The High-Intensity Sweeteners Market is witnessing a surge in demand from health-conscious consumers who are increasingly seeking alternatives to traditional sugars. This trend is characterized by a preference for products that offer sweetness without the caloric burden, reflecting a broader societal shift towards healthier eating habits. As a result, manufacturers are focusing on developing sweeteners that align with these preferences, leading to a diverse array of options in the market.

    Regulatory Influence on Product Development

    Regulatory bodies are playing a pivotal role in shaping the High-Intensity Sweeteners Market. Ongoing assessments of the safety and efficacy of various sweeteners are influencing product formulations and market entry strategies. Companies are adapting to these regulations by ensuring compliance and investing in research to develop new sweeteners that meet safety standards, thereby enhancing consumer confidence in their products.

    Rise of Natural Sweeteners

    There is a growing inclination towards natural sweeteners within the High-Intensity Sweeteners Market. Consumers are increasingly favoring products derived from natural sources, which are perceived as healthier alternatives to synthetic options. This trend is prompting manufacturers to explore and introduce sweeteners that are not only high in intensity but also align with the demand for clean label products, thereby reshaping the competitive landscape.

    <p>The increasing consumer preference for low-calorie and sugar-free products appears to drive the demand for high-intensity sweeteners, reflecting a broader trend towards healthier dietary choices.</p>

    U.S. Food and Drug Administration (FDA)

    High-Intensity Sweeteners Market Market Drivers

    Expansion of the Food Service Sector

    The expansion of the food service sector is a crucial driver for the High-Intensity Sweeteners Market. As dining establishments increasingly seek to offer healthier menu options, the incorporation of high-intensity sweeteners has become a strategic focus. Restaurants and cafes are adapting their offerings to include low-calorie beverages and desserts, catering to the growing number of health-conscious patrons. This trend is supported by Market Research Future indicating that a significant portion of consumers actively seeks out low-sugar options when dining out. Consequently, the food service sector's growth is likely to propel the demand for high-intensity sweeteners, as establishments strive to meet evolving consumer preferences.

    Innovation in Food and Beverage Products

    Innovation within the food and beverage sector is a significant catalyst for the High-Intensity Sweeteners Market. Companies are increasingly exploring novel formulations that incorporate high-intensity sweeteners to enhance flavor profiles while reducing caloric content. This trend is particularly pronounced in the development of functional foods and beverages, where the integration of these sweeteners can provide added health benefits. For instance, the introduction of new soft drink variants that utilize high-intensity sweeteners has been met with positive consumer reception, indicating a shift towards healthier options. The market is expected to witness a continuous influx of innovative products, further driving the demand for high-intensity sweeteners.

    Regulatory Support for Sugar Alternatives

    Regulatory frameworks that support the use of sugar alternatives are likely to bolster the High-Intensity Sweeteners Market. Various health organizations and government bodies have recognized the potential benefits of high-intensity sweeteners in combating obesity and related health issues. As a result, there has been a push for policies that encourage the use of these sweeteners in food products. For example, certain countries have implemented guidelines that promote the reduction of sugar intake, thereby creating a favorable environment for high-intensity sweeteners. This regulatory support not only enhances consumer confidence but also incentivizes manufacturers to adopt these alternatives, contributing to market growth.

    Rising Demand for Natural and Organic Products

    The rising consumer preference for natural and organic products is influencing the High-Intensity Sweeteners Market. As consumers become more discerning about ingredient sourcing, there is a notable shift towards sweeteners derived from natural sources. This trend is reflected in the increasing popularity of stevia and monk fruit extracts, which are perceived as healthier alternatives to synthetic sweeteners. Market data suggests that the demand for natural high-intensity sweeteners is expected to grow significantly, driven by consumer desire for transparency and clean labeling. Manufacturers are responding by reformulating products to include these natural sweeteners, thereby aligning with consumer expectations and enhancing market competitiveness.

    Health Awareness and Demand for Low-Calorie Options

    The increasing awareness regarding health and wellness among consumers appears to be a primary driver for the High-Intensity Sweeteners Market. As individuals become more conscious of their dietary choices, the demand for low-calorie and sugar-free products has surged. According to recent data, the market for low-calorie sweeteners is projected to grow at a compound annual growth rate of approximately 5.5% over the next few years. This trend is particularly evident in the beverage sector, where consumers are actively seeking alternatives to traditional sugars. Consequently, manufacturers are innovating and reformulating products to incorporate high-intensity sweeteners, thereby catering to the evolving preferences of health-conscious consumers.

    Market Segment Insights

    By Product: Sucralose (Largest) vs. Stevioside (Fastest-Growing)

    <p>In the high-intensity sweeteners market, products like Sucralose and Acesulfame K dominate with significant market share, thanks to their widespread acceptance and usage in various food and beverage applications. Sucralose, being a non-caloric sweetener, is preferred by many consumers looking to reduce sugar intake, leading it to capture the largest share among its peers. Other products, such as Aspartame and Saccharin, also have sizeable market positions but are facing increasing scrutiny and competition from more natural alternatives like Stevioside, which is gaining traction due to rising health consciousness.</p>

    <p>Sucralose (Dominant) vs. Stevioside (Emerging)</p>

    <p>Sucralose remains the dominant player in the high-intensity sweeteners market due to its easy adaptability in various formulations and its favorable safety profile. On the other hand, Stevioside is emerging as a popular option among health-conscious consumers, being derived from natural sources, thus appealing to those seeking organic and non-synthetic alternatives. This shift towards natural products is bolstering Stevioside’s market growth, as consumers are increasingly preferring sweeteners that align with their dietary preferences focused on health and wellness. In contrast, Acesulfame K and Aspartame still maintain considerable market share, but the trend towards the natural sweetener segment indicates a potential shift in consumer preference in the coming years.</p>

    By Form: Dry (Largest) vs. Liquid (Fastest-Growing)

    <p>The High-Intensity Sweeteners Market exhibits a notable distribution in the form segment, with dry sweeteners holding the largest market share. This dominance can be attributed to their widespread applicability in various industries, including food and beverage, where they are favored for their extended shelf life and convenience in storage. Liquid sweeteners, while currently smaller in market share, are gaining traction due to their ease of use in beverages and baked goods, tapping into a growing consumer preference for natural and liquid alternatives.</p>

    <p>Form: Dry (Dominant) vs. Liquid (Emerging)</p>

    <p>Dry sweeteners are characterized by their concentrated formulations and long shelf life, making them a preferred choice for manufacturers looking to reduce shipping costs while maintaining product quality. They cater largely to the baking and confectionery sectors, offering versatility in incorporation into various recipes. In contrast, liquid sweeteners are emerging rapidly, favored for their immediate dissolvability and seamless integration into liquid formulations. Their growing popularity reflects the trend towards convenience and natural product choices, as consumers increasingly seek to enhance flavor profiles without the need for artificial alternatives. This dichotomy between dry and liquid forms underscores shifting consumer preferences and industry innovations.</p>

    By Category: Natural (Largest) vs. Artificial (Fastest-Growing)

    <p>In the High-Intensity Sweeteners Market, the natural segment represents the largest share, driven by increasing consumer preferences for clean label products. Natural sweeteners such as stevia and monk fruit are becoming popular as consumers become more health-conscious and seek alternatives to synthetic options. In contrast, the artificial segment, which includes aspartame and sucralose, maintains a significant presence due to its cost-effectiveness and high sweetness levels, but is facing scrutiny regarding health impacts, which could hinder growth.</p>

    <p>Sweeteners: Natural (Dominant) vs. Artificial (Emerging)</p>

    <p>The natural sweeteners segment has solidified its position as a dominant force in the market. These products are derived from plants and are perceived as healthier options. Companies are increasingly launching various natural sweeteners to cater to rising consumer demand for organic and non-GMO ingredients. Conversely, artificial sweeteners, while emerging rapidly, face challenges regarding consumer perception due to past controversies surrounding safety. Nevertheless, they continue to grow, driven by demand for calorie-free sweetness, particularly in food and beverage applications targeting weight management.</p>

    By Application: Beverages (Largest) vs. Dairy Products (Fastest-Growing)

    <p>In the High-Intensity Sweeteners Market, the application segment is characterized by notable diversity, with beverages leading the market share. This segment benefits from the growing consumer preference for low-calorie and sugar-free options, which are increasingly prevalent in various beverage formulations. Additionally, the bakery and confectionery sector remains significant, catering to the demand for sweetening solutions that do not substantially alter traditional recipes. As health-conscious consumers prioritize natural and low-calorie products, the competition among these applications intensifies.</p>

    <p>Beverages: Dominant vs. Dairy Products: Emerging</p>

    <p>The beverages segment stands out as the dominant application within the High-Intensity Sweeteners Market, leveraging consumer trends towards healthier choices without sacrificing flavor. It encompasses a wide range of products such as soft drinks, flavored water, and energy drinks, reflecting an adaptation to reduce sugar content while maintaining taste satisfaction. Conversely, the dairy products sector is marked as an emerging category experiencing rapid growth. Innovations in dairy sweetening solutions cater to audience demands for lower-calorie options in yogurt, flavored milk, and ice creams, aligning with dietary trends favoring fitness and wellness.</p>

    By End User: Residential (Largest) vs. Commercial (Fastest-Growing)

    <p>In the high-intensity sweeteners market, the residential segment emerges as the largest consumer, significantly impacting overall demand. A shift in consumer preferences towards healthier lifestyle choices has notably increased the utilization of high-intensity sweeteners in household cooking and baking. Meanwhile, the commercial segment, comprising food service providers and manufacturers, displays rapid growth, fueled by a rising trend of incorporating functional ingredients into prepared foods and beverages.</p>

    <p>End User: Residential (Dominant) vs. Commercial (Emerging)</p>

    <p>The residential end-user segment is characterized by a strong preference for high-intensity sweeteners driven by health-conscious consumers looking to reduce sugar intake while maintaining sweetness in their diets. This trend has led to increased product variety in supermarkets and online platforms catering to home cooks. Conversely, the commercial segment is emerging rapidly as food manufacturers are increasingly incorporating high-intensity sweeteners to enhance product offerings, responding to consumer demands for lower-calorie and sugar-free options. The growth of this segment is further accelerated by the food service industry's innovations in product formulations, making high-intensity sweeteners a staple in many new recipes and menu items.</p>

    By Distribution Channel: Supermarkets & Hypermarkets (Largest) vs. Online (Fastest-Growing)

    <p>In the High-Intensity Sweeteners Market, distribution channels play a vital role in reaching consumers effectively. Supermarkets and hypermarkets remain the largest distribution channel, capturing a significant portion of the market share due to their widespread presence and convenience. These retail giants allow consumers to purchase high-intensity sweeteners alongside their regular groceries, making them the preferred choice for many. Specialty stores also hold a commendable share, catering to health-conscious consumers looking for niche products. The online distribution channel is emerging as the fastest-growing segment in the High-Intensity Sweeteners Market. The rise of e-commerce has transformed consumer shopping habits, providing convenience and a broader selection of products. Online retailers are capitalizing on this trend by offering competitive pricing and home delivery services, attracting a new demographic of health-conscious consumers seeking high-intensity sweeteners. As consumers increasingly prefer shopping from home, the online segment is anticipated to witness substantial growth in the coming years.</p>

    <p>Supermarkets & Hypermarkets (Dominant) vs. Online (Emerging)</p>

    <p>Supermarkets and hypermarkets dominate the High-Intensity Sweeteners Market due to their extensive reach and consumer trust. They provide a diverse range of high-intensity sweeteners, catering to various consumer preferences, and often bundle these products with promotions that enhance sales. These retail spaces create a convenient shopping experience, allowing consumers to explore and choose products in a one-stop shop environment. In contrast, the online distribution channel is rapidly emerging, appealing to tech-savvy shoppers and those who prefer the ease of online shopping. As consumers increasingly seek personalized shopping experiences and dietary products, online retailers are curating specialized selections, often supplemented by informative content, making the online channel a compelling alternative for high-intensity sweetener purchases.</p>

    Get more detailed insights about High-Intensity Sweeteners Market Size, Share, Growth, Report, 2035

    Regional Insights

    Key Companies in the High-Intensity Sweeteners Market market include

    Industry Developments

    March 2023 Ajinomoto Co., Inc. had made an investment in SARAH Inc., a provider of gourmet community and food big data services, with the goal of co-creating food and wellness services that are closely customized to each consumer.

    November 2022 Tate & Lyle announced the expansion of its product portfolio of reduced sugar alternatives as it launched Erytesse Erythritol – which contains 70% of the sweetness of sucrose and has zero calories

    June 2022 Ingredion Inc launches a new ad campaign in EMEA to create awareness regarding the product portfolio of texturizers and sweeteners to fulfill the surging demand of consumers for improved Nutri-Score and reduced-sugar products.

    May 2022 Tate & Lyle inaugurates a Customer Innovation & Collaboration Center in Chile. The company's growth in South America is aided by this expansion.

    Future Outlook

    High-Intensity Sweeteners Market Future Outlook

    <p>The High-Intensity Sweeteners Market is projected to grow at a 7.15% CAGR from 2024 to 2035, driven by rising health consciousness and demand for low-calorie products.</p>

    New opportunities lie in:

    • <p>Expansion into plant-based sweeteners for health-focused consumers.</p>
    • <p>Development of innovative sweetener blends for enhanced flavor profiles.</p>
    • <p>Strategic partnerships with food manufacturers for product integration.</p>

    <p>By 2035, the market is expected to solidify its position as a leader in the sweeteners industry.</p>

    Market Segmentation

    High-Intensity Sweeteners Market Form Outlook

    • Dry
    • Liquid

    High-Intensity Sweeteners Market Product Outlook

    • Sucralose
    • Stevioside
    • Acesulfame K
    • Aspartame
    • Cyclamate
    • Glycyrrhizin
    • Saccharin
    • Others

    High-Intensity Sweeteners Market Category Outlook

    • Artificial
    • Natural

    High-Intensity Sweeteners Market End User Outlook

    • Residential
    • Commercial

    High-Intensity Sweeteners Market Application Outlook

    • Bakery & Confectionery
    • Beverages
    • Dairy Products
    • Dietary Products
    • Pharmaceuticals
    • Tabletop Sweeteners
    • Processed Foods
    • Other

    High-Intensity Sweeteners Market Distribution Channel Outlook

    • Supermarkets & Hypermarkets
    • Specialty Stores
    • Online
    • Others

    Report Scope

    MARKET SIZE 20243.15(USD Billion)
    MARKET SIZE 20253.375(USD Billion)
    MARKET SIZE 20356.734(USD Billion)
    COMPOUND ANNUAL GROWTH RATE (CAGR)7.15% (2024 - 2035)
    REPORT COVERAGERevenue Forecast, Competitive Landscape, Growth Factors, and Trends
    BASE YEAR2024
    Market Forecast Period2025 - 2035
    Historical Data2019 - 2024
    Market Forecast UnitsUSD Billion
    Key Companies ProfiledMarket analysis in progress
    Segments CoveredMarket segmentation analysis in progress
    Key Market OpportunitiesGrowing consumer demand for low-calorie products drives innovation in the High-Intensity Sweeteners Market.
    Key Market DynamicsRising consumer demand for low-calorie products drives innovation and competition in the high-intensity sweeteners market.
    Countries CoveredNorth America, Europe, APAC, South America, MEA

    FAQs

    How much is the high-intensity sweeteners market worth?

    High-Intensity Sweeteners Market is pegged at USD 4.57 billion as of 2030.

    How Big is the U.S high-intensity sweeteners market?

    US high-intensity sweeteners market is poised to grow at 77.93% market share during 2021.

    What is the growth rate of the high-intensity sweeteners market?

    High-Intensity Sweeteners Market is poised to grow at 6.47% CAGR during 2025-2035.

    Which region held the largest market share in the high-intensity sweeteners market?

    Asia-Pacific region held the largest market share in the High-Intensity Sweeteners Market and market share of 50.08% in 2021.

    Who are the key players in the high-intensity sweeteners market?

    Tate and Lyle (UK), Cargill, Incorporated (US), International Flavors &amp; Fragrances Inc. (US), Archer Daniels Midland Company (ADM) (US), Ingredion Inc. (US), Ajinomoto Co., Inc (Japan), HYET Sweet (Netherlands), Hermes Sweeteners Ltd (Switzerland), JK Sucralose Inc. (China), and Heartland Food Products Group (US) are some of the vital players operating in the high-intensity sweeteners market.

    Which product led the high-intensity sweeteners market?

    Usage of Sucralose is poised to drive the high-intensity sweeteners market, which is poised to grow at market share 1.72 bn during 2022-2030

    Which form had the largest market share in the high-intensity sweeteners market?

    Dry is poised to hold an upper hand when it comes to sales of high-intensity sweeteners across diverse geographies.

    1. EXECUTIVE SUMMARY 27
      1. \r\n
      2. \r\n
      3. \r\n
      4. \r\n
      5. \r\n
      6. \r\n
      7. \r\n
      8. \r\n
    2. GLOBAL HIGH-INTENSITY SWEETENERS MARKET, BY PRODUCT 29
    3. GLOBAL HIGH-INTENSITY SWEETENERS MARKET, BY FORM 30
    4. GLOBAL HIGH-INTENSITY SWEETENERS MARKET, BY CATEGORY 31
    5. GLOBAL HIGH-INTENSITY SWEETENERS MARKET, BY APPLICATION 32
    6. GLOBAL HIGH-INTENSITY SWEETENERS MARKET, BY END USER 33
    7. GLOBAL HIGH-INTENSITY SWEETENERS MARKET, BY DISTRIBUTION CHANNEL 34
    8. GLOBAL HIGH-INTENSITY SWEETENERS MARKET, BY REGION 35
    9. MARKET INTRODUCTION 36
      1. \r\n
      2. DEFINITION 36
      3. \r\n
      4. SCOPE OF THE STUDY 36
      5. \r\n
      6. RESEARCH OBJECTIVE 36
      7. \r\n
      8. MARKET STRUCTURE 37
      9. \r\n
    10. RESEARCH METHODOLOGY 38
      1. \r\n
      2. RESEARCH PROCESS 38
      3. \r\n
      4. PRIMARY RESEARCH 39
      5. \r\n
      6. SECONDARY RESEARCH 40
      7. \r\n
      8. MARKET SIZE ESTIMATION 41
      9. \r\n
      10. FORECAST MODEL 42
      11. \r\n
      12. LIST OF ASSUMPTIONS & LIMITATIONS 43
      13. \r\n
    11. MARKET DYNAMICS 44
      1. \r\n
      2. INTRODUCTION 44
      3. \r\n
      4. DRIVERS 45
        1. LARGE POOL OF PEOPLE SUFFERING FROM DIABETES AND OBESITY 45
        2. INCREASED IMPOSITION OF TAXES BY GOVERNMNET BODIES ON SUGAR-SWEETENED BEVERAGES 46
        3. DRIVER IMPACT ANALYSIS 47
      5. \r\n
      6. \r\n
      7. \r\n
      8. \r\n
      9. RESTRAINTS 48
        1. SIDE-EFFECTS ASSOCIATED WITH THE CONSUMPTION OF HIGH-INTENSITY SWEETENERS PRODUCTS 48
        2. RESTRAINT IMPACT ANALYSIS 49
      10. \r\n
      11. \r\n
      12. \r\n
      13. OPPORTUNITIES 49
        1. WIDE USAGE OF HIGH-INTENSITY SWEETENERS IN VARIOUS APPLICATION 49
        2. GROWING EXPANSION POLICIES ADOPTED BY KEY PLAYERS 50
      14. \r\n
      15. \r\n
      16. \r\n
      17. CHALLENGES 51
        1. STRINGENT GOVERNMENT REGULATION 51
      18. \r\n
      19. \r\n
    12. MARKET FACTOR ANALYSIS 53
      1. \r\n
      2. VALUE CHAIN ANALYSIS 53
        1. RAW MATERIAL PROCUREMENT 54
        2. MANUFACTURING 54
        3. PACKAGING 55
      3. \r\n
      4. \r\n
      5. \r\n
      6. \r\n
      7. SUPPLY CHAIN ANALYSIS 56
        1. RAW MATERIALS SOURCING 56
        2. MANUFACTURING 57
        3. DISTRIBUTION 57
        4. END-USER 57
      8. \r\n
      9. \r\n
      10. \r\n
      11. \r\n
      12. \r\n
      13. PORTER'S FIVE FORCES MODEL 58
        1. BARGAINING POWER OF SUPPLIERS 58
        2. BARGAINING POWER OF BUYERS 59
        3. THREAT OF NEW ENTRANTS 59
        4. THREAT OF SUBSTITUTES 59
        5. INTENSITY OF RIVALRY 60
      14. \r\n
      15. \r\n
      16. \r\n
      17. \r\n
      18. \r\n
      19. \r\n
      20. IMPACT OF COVID-19 PANDEMIC ON GLOBAL HIGH-INTENSITY SWEETENERS MARKET 60
        1. IMPACT ON PRODUCTION 60
        2. IMPACT ON CONSUMER BUYING BEHAVIOUR 60
        3. IMPACT ON ONLINE VS OFFLINE SALES 61
        4. IMPACT ON PRICING 61
        5. IMPACT ON OVERALL GLOBAL HIGH-INTENSITY SWEETENERS MARKET 61
      21. \r\n
      22. \r\n
      23. \r\n
      24. \r\n
      25. \r\n
      26. \r\n
    13. CATEGORY INSIGHTS 62
      1. \r\n
      2. SUPPLY DEMAND OUTLOOK 62
      3. \r\n
      4. MARKET OVERVIEW 62
      5. \r\n
      6. SUPPLY- DEMAND ANALYSIS 64
        1. DEMAND ANALYSIS 64
        2. SUPPLY ANALYSIS 65
      7. \r\n
      8. \r\n
      9. \r\n
      10. CATEGORY TRENDS 66
        1. TRENDS 66
        2. MRFR POINT -OF- VIEW 66
      11. \r\n
      12. \r\n
      13. \r\n
      14. COST STRUCTURE ANALYSIS 67
        1. COST STRUCTURE BREAKDOWN 67
        2. COST COMPONENT & IMPACT ON OVERALL PRICING 68
        3. FACTORS EFFECTING COST OF RAW MATERIAL 68
      15. \r\n
      16. \r\n
      17. \r\n
      18. \r\n
      19. RUSSIA- UKRAINE WAR INSIGHTS 69
      20. \r\n
    14. GLOBAL HIGH-INTENSITY SWEETENERS MARKET, BY PRODUCT 70
      1. \r\n
      2. OVERVIEW 70
        1. GLOBAL HIGH-INTENSITY SWEETENERS MARKET ESTIMATES & FORECAST, BY PRODUCT, 2020–2030 71
      3. \r\n
      4. \r\n
      5. SUCRALOSE 72
        1. SUCRALOSE: MARKET ESTIMATES & FORECAST, BY REGION, 2020–2030 72
      6. \r\n
      7. \r\n
      8. STEVIOSIDE 73
        1. STEVIOSIDE: MARKET ESTIMATES & FORECAST, BY REGION, 2020–2030 73
      9. \r\n
      10. \r\n
      11. ACESULFAME K 74
        1. ACESULFAME K: MARKET ESTIMATES & FORECAST, BY REGION, 2020–2030 74
      12. \r\n
      13. \r\n
      14. ASPARTAME 75
        1. ASPARTAME: MARKET ESTIMATES & FORECAST, BY REGION, 2020–2030 75
      15. \r\n
      16. \r\n
      17. CYCLAMATE 76
        1. CYCLAMATE: MARKET ESTIMATES & FORECAST, BY REGION, 2020–2030 76
      18. \r\n
      19. \r\n
      20. GLYCYRRHIZIN 77
        1. GLYCYRRHIZIN: MARKET ESTIMATES & FORECAST, BY REGION, 2020–2030 77
      21. \r\n
      22. \r\n
      23. SACCHARIN 78
        1. SACCHARIN: MARKET ESTIMATES & FORECAST, BY REGION, 2020–2030 78
      24. \r\n
      25. \r\n
      26. OTHERS 79
        1. OTHERS: MARKET ESTIMATES & FORECAST, BY REGION, 2020–2030 79
      27. \r\n
      28. \r\n
    15. GLOBAL HIGH-INTENSITY SWEETENERS MARKET, BY FORM 80
      1. \r\n
      2. OVERVIEW 80
        1. GLOBAL HIGH-INTENSITY SWEETENERS MARKET ESTIMATES & FORECAST, BY FORM, 2020–2030 81
      3. \r\n
      4. \r\n
      5. DRY 82
        1. DRY: MARKET ESTIMATES & FORECAST, BY REGION, 2020–2030 82
      6. \r\n
      7. \r\n
      8. LIQUID 83
        1. LIQUID: MARKET ESTIMATES & FORECAST, BY REGION, 2020–2030 83
      9. \r\n
      10. \r\n
    16. GLOBAL HIGH-INTENSITY SWEETENERS MARKET, BY CATEGORY 84
      1. \r\n
      2. OVERVIEW 84
        1. GLOBAL HIGH-INTENSITY SWEETENERS MARKET ESTIMATES & FORECAST, BY CATEGORY, 2020–2030 85
      3. \r\n
      4. \r\n
      5. ARTIFICIAL 86
        1. ARTIFICIAL: MARKET ESTIMATES & FORECAST, BY REGION, 2020–2030 86
      6. \r\n
      7. \r\n
      8. NATURAL 87
        1. NATURAL: MARKET ESTIMATES & FORECAST, BY REGION, 2020–2030 87
      9. \r\n
      10. \r\n
    17. GLOBAL HIGH-INTENSITY SWEETENERS MARKET, BY APPLICATION 88
      1. \r\n
      2. OVERVIEW 88
        1. GLOBAL HIGH-INTENSITY SWEETENERS MARKET ESTIMATES & FORECAST, BY APPLICATION, 2020–2030 89
      3. \r\n
      4. \r\n
      5. BAKERY & CONFECTIONERY 90
        1. BAKERY & CONFECTIONERY: MARKET ESTIMATES & FORECAST, BY REGION, 2020–2030 90
      6. \r\n
      7. \r\n
      8. BEVERAGES 91
        1. BEVERAGES: MARKET ESTIMATES & FORECAST, BY REGION, 2020–2030 91
      9. \r\n
      10. \r\n
      11. DAIRY PRODUCTS 92
        1. DAIRY PRODUCTS: MARKET ESTIMATES & FORECAST, BY REGION, 2020–2030 92
      12. \r\n
      13. \r\n
      14. DIETARY PRODUCTS 93
        1. DIETARY PRODUCTS: MARKET ESTIMATES & FORECAST, BY REGION, 2020–2030 93
      15. \r\n
      16. \r\n
      17. PHARMACEUTICALS 94
        1. PHARMACEUTICALS: MARKET ESTIMATES & FORECAST, BY REGION, 2020–2030 94
      18. \r\n
      19. \r\n
      20. TABLETOP SWEETENERS 95
        1. TABLETOP SWEETENERS: MARKET ESTIMATES & FORECAST, BY REGION, 2020–2030 95
      21. \r\n
      22. \r\n
      23. PROCESSED FOODS 96
        1. PROCESSED FOODS: MARKET ESTIMATES & FORECAST, BY REGION, 2020–2030 96
      24. \r\n
      25. \r\n
      26. OTHERS 97
        1. OTHERS: MARKET ESTIMATES & FORECAST, BY REGION, 2020–2030 97
      27. \r\n
      28. \r\n
    18. GLOBAL HIGH-INTENSITY SWEETENERS MARKET, BY END USER 98
      1. \r\n
      2. OVERVIEW 98
        1. GLOBAL HIGH-INTENSITY SWEETENERS MARKET ESTIMATES & FORECAST, BY END USER, 2020–2030 99
      3. \r\n
      4. \r\n
      5. RESIDENTIAL 99
        1. RESIDENTIAL: MARKET ESTIMATES & FORECAST, BY REGION, 2020–2030 99
      6. \r\n
      7. \r\n
      8. COMMERCIAL 100
        1. COMMERCIAL: MARKET ESTIMATES & FORECAST, BY REGION, 2020–2030 100
      9. \r\n
      10. \r\n
    19. GLOBAL HIGH-INTENSITY SWEETENERS MARKET, BY DISTRIBUTION CHANNEL 101
      1. \r\n
      2. OVERVIEW 101
        1. GLOBAL HIGH-INTENSITY SWEETENERS MARKET ESTIMATES & FORECAST, BY DISTRIBUTION CHANNEL, 2020–2030 102
      3. \r\n
      4. \r\n
      5. SUPERMARKETS & HYPERMARKETS 103
        1. SUPERMARKETS & HYPERMARKETS: MARKET ESTIMATES & FORECAST, BY REGION, 2020–2030 103
      6. \r\n
      7. \r\n
      8. SPECIALTY STORES 104
        1. SPECIALTY STORES: MARKET ESTIMATES & FORECAST, BY REGION, 2020–2030 104
      9. \r\n
      10. \r\n
      11. ONLINE 105
        1. ONLINE: MARKET ESTIMATES & FORECAST, BY REGION, 2020–2030 105
      12. \r\n
      13. \r\n
      14. OTHERS 106
        1. OTHERS: MARKET ESTIMATES & FORECAST, BY REGION, 2020–2030 106
      15. \r\n
      16. \r\n
    20. GLOBAL HIGH-INTENSITY SWEETENERS MARKET, BY CATEGORY IN APPLICATION 107
      1. \r\n
      2. OVERVIEW 107
        1. HIGH-INTENSITY SWEETENER: MARKET ESTIMATES & FORECAST BY CATEGORY IN APPLICATION, 2020-2030 107
        2. HIGH-INTENSITY SWEETENER: MARKET ESTIMATES & FORECAST BY CATEGORY IN APPLICATION, 2020-2030 108
      3. \r\n
      4. \r\n
      5. \r\n
    21. GLOBAL HIGH-INTENSITY SWEETENERS MARKET, BY REGION 109
      1. \r\n
      2. OVERVIEW 109
        1. GLOBAL HIGH-INTENSITY SWEETENERS MARKET ESTIMATES & FORECAST, BY REGION, 2020–2030 110
      3. \r\n
      4. \r\n
      5. NORTH AMERICA 111
        1. NORTH AMERICA HIGH-INTENSITY SWEETENERS MARKET ESTIMATES & FORECAST, BY COUNTRY, 2020–2030 111
        2. NORTH AMERICA HIGH-INTENSITY SWEETENERS MARKET ESTIMATES & FORECAST, BY PRODUCT, 2020–2030 112
        3. NORTH AMERICA HIGH-INTENSITY SWEETENERS MARKET ESTIMATES & FORECAST, BY FORM, 2020–2030 113
        4. NORTH AMERICA HIGH-INTENSITY SWEETENERS MARKET ESTIMATES & FORECAST, BY CATEGORY, 2020–2030 113
        5. NORTH AMERICA HIGH-INTENSITY SWEETENERS MARKET ESTIMATES & FORECAST, BY APPLICATION, 2020–2030 114
        6. NORTH AMERICA: MARKET ESTIMATES & FORECAST BY CATEGORY IN APPLICATION, 2020-2030 115
        7. NORTH AMERICA HIGH-INTENSITY SWEETENERS MARKET ESTIMATES & FORECAST, BY END USER, 2020–2030 116
        8. NORTH AMERICA HIGH-INTENSITY SWEETENERS MARKET ESTIMATES & FORECAST, BY DISTRIBUTION CHANNEL, 2020–2030 117
        9. US 118
        10. CANADA 122
        11. MEXICO 128
      6. \r\n
      7. \r\n
      8. \r\n
      9. \r\n
      10. \r\n
      11. \r\n
      12. \r\n
      13. \r\n
      14. \r\n
      15. \r\n
      16. \r\n
      17. \r\n
      18. EUROPE 133
        1. EUROPE HIGH-INTENSITY SWEETENERS MARKET ESTIMATES & FORECAST, BY COUNTRY, 2020–2030 134
        2. EUROPE HIGH-INTENSITY SWEETENERS MARKET ESTIMATES & FORECAST, BY PRODUCT, 2020–2030 135
        3. EUROPE HIGH-INTENSITY SWEETENERS MARKET ESTIMATES & FORECAST, BY FORM, 2020–2030 135
        4. EUROPE HIGH-INTENSITY SWEETENERS MARKET ESTIMATES & FORECAST, BY CATEGORY, 2020–2030 136
        5. EUROPE HIGH-INTENSITY SWEETENERS MARKET ESTIMATES & FORECAST, BY APPLICATION, 2020–2030 137
        6. EUROPE HIGH-INTENSITY SWEETENERS MARKET ESTIMATES & FORECAST, BY CATEGORY IN APPLICATION, 2020–2030 138
        7. EUROPE HIGH-INTENSITY SWEETENERS MARKET ESTIMATES & FORECAST, BY END USER, 2020–2030 139
        8. EUROPE HIGH-INTENSITY SWEETENERS MARKET ESTIMATES & FORECAST, BY DISTRIBUTION CHANNEL, 2020–2030 140
        9. GERMANY 141
        10. ITALY 146
        11. SPAIN AND PORTUGAL 151
        12. AUSTRIA AND SWITZERLAND 156
        13. UK AND IRELAND 161
        14. FRANCE 166
        15. BENELUX 171
        16. NORDICS 176
        17. CENTRAL AND EASTERN EUROPE 181
        18. SOUTHERN EUROPE 186
      19. \r\n
      20. \r\n
      21. \r\n
      22. \r\n
      23. \r\n
      24. \r\n
      25. \r\n
      26. \r\n
      27. \r\n
      28. \r\n
      29. \r\n
      30. \r\n
      31. \r\n
      32. \r\n
      33. \r\n
      34. \r\n
      35. \r\n
      36. \r\n
      37. \r\n
      38. ASIA-PACIFIC 191
        1. ASIA-PACIFIC HIGH-INTENSITY SWEETENERS MARKET ESTIMATES & FORECAST, BY COUNTRY, 2020–2030 192
        2. ASIA-PACIFIC HIGH-INTENSITY SWEETENERS MARKET ESTIMATES & FORECAST, BY PRODUCT, 2020–2030 192
        3. ASIA-PACIFIC HIGH-INTENSITY SWEETENERS MARKET ESTIMATES & FORECAST, BY FORM, 2020–2030 193
        4. ASIA-PACIFIC HIGH-INTENSITY SWEETENERS MARKET ESTIMATES & FORECAST, BY CATEGORY, 2020–2030 194
        5. ASIA-PACIFIC HIGH-INTENSITY SWEETENERS MARKET ESTIMATES & FORECAST, BY APPLICATION, 2020–2030 194
        6. ASIA-PACIFIC HIGH-INTENSITY SWEETENERS MARKET ESTIMATES & FORECAST, BY CATEGORY IN APPLICATION, 2020–2030 195
        7. ASIA-PACIFIC HIGH-INTENSITY SWEETENERS MARKET ESTIMATES & FORECAST, BY END USER, 2020–2030 197
        8. ASIA-PACIFIC HIGH-INTENSITY SWEETENERS MARKET ESTIMATES & FORECAST, BY DISTRIBUTION CHANNEL, 2020–2030 197
        9. CHINA 198
        10. JAPAN 203
        11. INDIA 208
        12. AUSTRALIA AND NEW ZEALAND 213
        13. REST OF ASIA-PACIFIC 218
      39. \r\n
      40. \r\n
      41. \r\n
      42. \r\n
      43. \r\n
      44. \r\n
      45. \r\n
      46. \r\n
      47. \r\n
      48. \r\n
      49. \r\n
      50. \r\n
      51. \r\n
      52. \r\n
      53. REST OF THE WORLD 223
        1. REST OF THE WORLD HIGH-INTENSITY SWEETENERS MARKET ESTIMATES & FORECAST, BY COUNTRY, 2020–2030 223
        2. REST OF THE WORLD HIGH-INTENSITY SWEETENERS MARKET ESTIMATES & FORECAST, BY PRODUCT, 2020–2030 224
        3. REST OF THE WORLD HIGH-INTENSITY SWEETENERS MARKET ESTIMATES & FORECAST, BY FORM, 2020–2030 225
        4. REST OF THE WORLD HIGH-INTENSITY SWEETENERS MARKET ESTIMATES & FORECAST, BY CATEGORY, 2020–2030 225
        5. REST OF THE WORLD HIGH-INTENSITY SWEETENERS MARKET ESTIMATES & FORECAST, BY APPLICATION, 2020–2030 226
        6. REST OF THE WORLD HIGH-INTENSITY SWEETENERS MARKET ESTIMATES & FORECAST, BY CATEGORY IN APPLICATION, 2020–2030 227
        7. REST OF THE WORLD HIGH-INTENSITY SWEETENERS MARKET ESTIMATES & FORECAST, BY END USER, 2020–2030 228
        8. REST OF THE WORLD HIGH-INTENSITY SWEETENERS MARKET ESTIMATES & FORECAST, BY DISTRIBUTION CHANNEL, 2020–2030 229
        9. SOUTH AMERICA 230
        10. MIDDLE EAST 235
        11. AFRICA 240
      54. \r\n
      55. \r\n
      56. \r\n
      57. \r\n
      58. \r\n
      59. \r\n
      60. \r\n
      61. \r\n
      62. \r\n
      63. \r\n
      64. \r\n
      65. \r\n
    22. COMPETITIVE LANDSCAPE 245
      1. \r\n
      2. INTRODUCTION 245
        1. MARKET STRATEGY ANALYSIS 245
      3. \r\n
      4. \r\n
      5. COMPETITIVE BENCHMARKING 246
      6. \r\n
      7. KEY DEVELOPMENTS & GROWTH STRATEGIES 247
        1. PRODUCT LAUNCH 247
        2. ACQUISITION 247
        3. INVESTMENT 248
        4. EXPANSION 248
        5. MERGER 249
        6. AGREEMENT 249
        7. PARTNERSHIP 249
      8. \r\n
      9. \r\n
      10. \r\n
      11. \r\n
      12. \r\n
      13. \r\n
      14. \r\n
      15. \r\n
    23. COMPANY PROFILES 250
      1. \r\n
      2. TATE & LYLE 250
        1. COMPANY OVERVIEW 250
        2. FINANCIAL OVERVIEW 251
        3. PRODUCTS OFFERED 252
        4. KEY DEVELOPMENTS 252
        5. SWOT ANALYSIS 253
        6. KEY STRATEGIES 253
      3. \r\n
      4. \r\n
      5. \r\n
      6. \r\n
      7. \r\n
      8. \r\n
      9. \r\n
      10. CARGILL INCORPORATED 254
        1. COMPANY OVERVIEW 254
        2. FINANCIAL OVERVIEW 255
        3. PRODUCTS OFFERED 255
        4. KEY DEVELOPMENTS 255
        5. SWOT ANALYSIS 256
        6. KEY STRATEGIES 256
      11. \r\n
      12. \r\n
      13. \r\n
      14. \r\n
      15. \r\n
      16. \r\n
      17. \r\n
      18. INTERNATIONAL FLAVORS & FRAGRANCES INC. 257
        1. COMPANY OVERVIEW 257
        2. FINANCIAL OVERVIEW 258
        3. PRODUCTS OFFERED 258
        4. KEY DEVELOPMENTS 259
        5. SWOT ANALYSIS 259
        6. KEY STRATEGIES 260
      19. \r\n
      20. \r\n
      21. \r\n
      22. \r\n
      23. \r\n
      24. \r\n
      25. \r\n
      26. ARCHER-DANIELS-MIDLAND COMPANY (ADM) 261
        1. COMPANY OVERVIEW 261
        2. FINANCIAL OVERVIEW 262
        3. PRODUCTS OFFERED 263
        4. KEY DEVELOPMENTS 263
        5. SWOT ANALYSIS 264
        6. KEY STRATEGIES 264
      27. \r\n
      28. \r\n
      29. \r\n
      30. \r\n
      31. \r\n
      32. \r\n
      33. \r\n
      34. INGREDION INCORPORATED 265
        1. COMPANY OVERVIEW 265
        2. FINANCIAL OVERVIEW 266
        3. PRODUCTS OFFERED 266
        4. KEY DEVELOPMENTS 267
        5. SWOT ANALYSIS 268
        6. KEY STRATEGIES 268
      35. \r\n
      36. \r\n
      37. \r\n
      38. \r\n
      39. \r\n
      40. \r\n
      41. \r\n
      42. AJINOMOTO CO., INC. 269
        1. COMPANY OVERVIEW 269
        2. FINANCIAL OVERVIEW 270
        3. PRODUCTS OFFERED 270
        4. KEY DEVELOPMENTS 271
        5. KEY STRATEGIES 271
      43. \r\n
      44. \r\n
      45. \r\n
      46. \r\n
      47. \r\n
      48. \r\n
      49. HYET SWEET 272
        1. COMPANY OVERVIEW 272
        2. FINANCIAL OVERVIEW 272
        3. PRODUCTS OFFERED 272
        4. KEY DEVELOPMENTS 272
        5. KEY STRATEGIES 273
      50. \r\n
      51. \r\n
      52. \r\n
      53. \r\n
      54. \r\n
      55. \r\n
      56. HERMES SWEETENERS LTD 274
        1. COMPANY OVERVIEW 274
        2. FINANCIAL OVERVIEW 274
        3. PRODUCTS OFFERED 274
        4. KEY DEVELOPMENTS 274
        5. KEY STRATEGIES 275
      57. \r\n
      58. \r\n
      59. \r\n
      60. \r\n
      61. \r\n
      62. \r\n
      63. JK SUCRALOSE INC. 276
        1. COMPANY OVERVIEW 276
        2. FINANCIAL OVERVIEW 276
        3. PRODUCTS/SERVICES OFFERED 276
        4. KEY DEVELOPMENTS 276
        5. KEY STRATEGIES 276
      64. \r\n
      65. \r\n
      66. \r\n
      67. \r\n
      68. \r\n
      69. \r\n
      70. HEARTLAND FOOD PRODUCTS GROUP 277
        1. COMPANY OVERVIEW 277
        2. FINANCIAL OVERVIEW 277
        3. PRODUCTS OFFERED 278
        4. KEY DEVELOPMENTS 278
        5. KEY STRATEGIES 278
      71. \r\n
      72. \r\n
      73. \r\n
      74. \r\n
      75. \r\n
      76. \r\n
    24. APPENDIX 279
      1. \r\n
      2. REFERENCES 279
      3. \r\n
      4. RELATED REPORTS 280
      5. \r\n
      6. \r\n
    25. LIST OF TABLES
      1. \r\n
    26. PRIMARY INTERVIEWS 39
      1. \r\n
    27. LIST OF ASSUMPTIONS & LIMITATIONS 43
      1. \r\n
    28. GLOBAL HIGH-INTENSITY SWEETENERS MARKET, BY REGION, 2020–2030 (KILOTONS) 64
      1. \r\n
    29. GLOBAL HIGH-INTENSITY SWEETENERS MARKET ESTIMATES & FORECAST, BY PRODUCT, 2020–2030 (USD MILLION) 71
      1. \r\n
    30. GLOBAL HIGH-INTENSITY SWEETENERS MARKET ESTIMATES & FORECAST, BY PRODUCT, 2020–2030 (KILOTONS) 71
      1. \r\n
    31. SUCRALOSE: MARKET ESTIMATES & FORECAST, BY REGION, 2020–2030 (USD MILLION) 72
      1. \r\n
    32. SUCRALOSE: MARKET ESTIMATES & FORECAST, BY REGION, 2020–2030 (KILOTONS) 72
      1. \r\n
    33. STEVIOSIDE: MARKET ESTIMATES & FORECAST, BY REGION, 2020–2030 (USD MILLION) 73
      1. \r\n
    34. STEVIOSIDE: MARKET ESTIMATES & FORECAST, BY REGION, 2020–2030 (KILOTONS) 73
      1. \r\n
    35. ACESULFAME K: MARKET ESTIMATES & FORECAST, BY REGION, 2020–2030 (USD MILLION) 74
      1. \r\n
    36. ACESULFAME K: MARKET ESTIMATES & FORECAST, BY REGION, 2020–2030 (KILOTONS) 74
      1. \r\n
    37. ASPARTAME: MARKET ESTIMATES & FORECAST, BY REGION, 2020–2030 (USD MILLION) 75
      1. \r\n
    38. ASPARTAME: MARKET ESTIMATES & FORECAST, BY REGION, 2020–2030 (KILOTONS) 75
      1. \r\n
    39. CYCLAMATE: MARKET ESTIMATES & FORECAST, BY REGION, 2020–2030 (USD MILLION) 76
      1. \r\n
    40. CYCLAMATE: MARKET ESTIMATES & FORECAST, BY REGION, 2020–2030 (KILOTONS) 76
      1. \r\n
    41. GLYCYRRHIZIN: MARKET ESTIMATES & FORECAST, BY REGION, 2020–2030 (USD MILLION) 77
      1. \r\n
    42. GLYCYRRHIZIN: MARKET ESTIMATES & FORECAST, BY REGION, 2020–2030 (KILOTONS) 77
      1. \r\n
    43. SACCHARIN: MARKET ESTIMATES & FORECAST, BY REGION, 2020–2030 (USD MILLION) 78
      1. \r\n
    44. SACCHARIN: MARKET ESTIMATES & FORECAST, BY REGION, 2020–2030 (KILOTONS) 78
      1. \r\n
    45. OTHERS: MARKET ESTIMATES & FORECAST, BY REGION, 2020–2030 (USD MILLION) 79
      1. \r\n
    46. OTHERS: MARKET ESTIMATES & FORECAST, BY REGION, 2020–2030 (KILOTONS) 79
      1. \r\n
    47. GLOBAL HIGH-INTENSITY SWEETENERS MARKET ESTIMATES & FORECAST, BY FORM, 2020–2030 (USD MILLION) 81
      1. \r\n
    48. GLOBAL HIGH-INTENSITY SWEETENERS MARKET ESTIMATES & FORECAST, BY FORM, 2020–2030 (KILOTONS) 81
      1. \r\n
    49. DRY: MARKET ESTIMATES & FORECAST, BY REGION, 2020–2030 (USD MILLION) 82
      1. \r\n
    50. DRY: MARKET ESTIMATES & FORECAST, BY REGION, 2020–2030 (KILOTONS) 82
      1. \r\n
    51. LIQUID: MARKET ESTIMATES & FORECAST, BY REGION, 2020–2030 (USD MILLION) 83
      1. \r\n
    52. LIQUID: MARKET ESTIMATES & FORECAST, BY REGION, 2020–2030 (KILOTONS) 83
      1. \r\n
    53. GLOBAL HIGH-INTENSITY SWEETENERS MARKET ESTIMATES & FORECAST, BY CATEGORY, 2020–2030 (USD MILLION) 85
      1. \r\n
    54. GLOBAL HIGH-INTENSITY SWEETENERS MARKET ESTIMATES & FORECAST, BY CATEGORY, 2020–2030 (KILOTONS) 85
      1. \r\n
    55. ARTIFICIAL: MARKET ESTIMATES & FORECAST, BY REGION, 2020–2030 (USD MILLION) 86
      1. \r\n
    56. ARTIFICIAL: MARKET ESTIMATES & FORECAST, BY REGION, 2020–2030 (KILOTONS) 86
      1. \r\n
    57. NATURAL: MARKET ESTIMATES & FORECAST, BY REGION, 2020–2030 (USD MILLION) 87
      1. \r\n
    58. NATURAL: MARKET ESTIMATES & FORECAST, BY REGION, 2020–2030 (KILOTONS) 87
      1. \r\n
    59. GLOBAL HIGH-INTENSITY SWEETENERS MARKET ESTIMATES & FORECAST, BY APPLICATION, 2020–2030 (USD MILLION) 89
      1. \r\n
    60. GLOBAL HIGH-INTENSITY SWEETENERS MARKET ESTIMATES & FORECAST, BY APPLICATION, 2020–2030 (KILOTONS) 89
      1. \r\n
    61. BAKERY & CONFECTIONERY: MARKET ESTIMATES & FORECAST, BY REGION, 2020–2030 (USD MILLION) 90
      1. \r\n
    62. BAKERY & CONFECTIONERY: MARKET ESTIMATES & FORECAST, BY REGION, 2020–2030 (KILOTONS) 90
      1. \r\n
    63. BEVERAGES: MARKET ESTIMATES & FORECAST, BY REGION, 2020–2030 (USD MILLION) 91
      1. \r\n
    64. BEVERAGES: MARKET ESTIMATES & FORECAST, BY REGION, 2020–2030 (KILOTONS) 91
      1. \r\n
    65. DAIRY PRODUCTS: MARKET ESTIMATES & FORECAST, BY REGION, 2020–2030 (USD MILLION) 92
      1. \r\n
    66. DAIRY PRODUCTS: MARKET ESTIMATES & FORECAST, BY REGION, 2020–2030 (KILOTONS) 92
      1. \r\n
    67. DIETARY PRODUCTS: MARKET ESTIMATES & FORECAST, BY REGION, 2020–2030 (USD MILLION) 93
      1. \r\n
    68. DIETARY PRODUCTS: MARKET ESTIMATES & FORECAST, BY REGION, 2020–2030 (KILOTONS) 93
      1. \r\n
    69. PHARMACEUTICALS: MARKET ESTIMATES & FORECAST, BY REGION, 2020–2030 (USD MILLION) 94
      1. \r\n
    70. PHARMACEUTICALS: MARKET ESTIMATES & FORECAST, BY REGION, 2020–2030 (KILOTONS) 94
      1. \r\n
    71. TABLETOP SWEETENERS: MARKET ESTIMATES & FORECAST, BY REGION, 2020–2030 (USD MILLION) 95
      1. \r\n
    72. TABLETOP SWEETENERS: MARKET ESTIMATES & FORECAST, BY REGION, 2020–2030 (KILOTONS) 95
      1. \r\n
    73. PROCESSED FOODS: MARKET ESTIMATES & FORECAST, BY REGION, 2020–2030 (USD MILLION) 96
      1. \r\n
    74. PROCESSED FOODS: MARKET ESTIMATES & FORECAST, BY REGION, 2020–2030 (KILOTONS) 96
      1. \r\n
    75. OTHERS: MARKET ESTIMATES & FORECAST, BY REGION, 2020–2030 (USD MILLION) 97
      1. \r\n
    76. OTHERS: MARKET ESTIMATES & FORECAST, BY REGION, 2020–2030 (KILOTONS) 97
      1. \r\n
    77. GLOBAL HIGH-INTENSITY SWEETENERS MARKET ESTIMATES & FORECAST, BY END USER, 2020–2030 (USD MILLION) 99
      1. \r\n
    78. GLOBAL HIGH-INTENSITY SWEETENERS MARKET ESTIMATES & FORECAST, BY END USER, 2020–2030 (KILOTONS) 99
      1. \r\n
    79. RESIDENTIAL: MARKET ESTIMATES & FORECAST, BY REGION, 2020–2030 (USD MILLION) 99
      1. \r\n
    80. RESIDENTIAL: MARKET ESTIMATES & FORECAST, BY REGION, 2020–2030 (KILOTONS) 100
      1. \r\n
    81. COMMERCIAL: MARKET ESTIMATES & FORECAST, BY REGION, 2020–2030 (USD MILLION) 100
      1. \r\n
    82. COMMERCIAL: MARKET ESTIMATES & FORECAST, BY REGION, 2020–2030 (KILOTONS) 100
      1. \r\n
    83. GLOBAL HIGH-INTENSITY SWEETENERS MARKET ESTIMATES & FORECAST, BY DISTRIBUTION CHANNEL, 2020–2030 (USD MILLION) 102
      1. \r\n
    84. GLOBAL HIGH-INTENSITY SWEETENERS MARKET ESTIMATES & FORECAST, BY DISTRIBUTION CHANNEL, 2020–2030 (KILOTONS) 102
      1. \r\n
    85. SUPERMARKETS & HYPERMARKETS: MARKET ESTIMATES & FORECAST, BY REGION, 2020–2030 (USD MILLION) 103
      1. \r\n
    86. SUPERMARKETS & HYPERMARKETS: MARKET ESTIMATES & FORECAST, BY REGION, 2020–2030 (KILOTONS) 103
      1. \r\n
    87. SPECIALTY STORES: MARKET ESTIMATES & FORECAST, BY REGION, 2020–2030 (USD MILLION) 104
      1. \r\n
    88. SPECIALTY STORES: MARKET ESTIMATES & FORECAST, BY REGION, 2020–2030 (KILOTONS) 104
      1. \r\n
    89. ONLINE: MARKET ESTIMATES & FORECAST, BY REGION, 2020–2030 (USD MILLION) 105
      1. \r\n
    90. ONLINE: MARKET ESTIMATES & FORECAST, BY REGION, 2020–2030 (KILOTONS) 105
      1. \r\n
    91. OTHERS: MARKET ESTIMATES & FORECAST, BY REGION, 2020–2030 (USD MILLION) 106
      1. \r\n
    92. OTHERS: MARKET ESTIMATES & FORECAST, BY REGION, 2020–2030 (KILOTONS) 106
      1. \r\n
    93. HIGH-INTENSITY SWEETENER MARKET ESTIMATES & FORECAST, BY CATEGORY IN APPLICATION, 2020–2030 (USD MILLION) 107
      1. \r\n
    94. HIGH-INTENSITY SWEETENER MARKET ESTIMATES & FORECAST, BY CATEGORY IN APPLICATION, 2020–2030 (KILOTONS) 108
      1. \r\n
    95. GLOBAL HIGH-INTENSITY SWEETENERS MARKET ESTIMATES & FORECAST, BY REGION, 2020–2030 (USD MILLION) 110
      1. \r\n
    96. GLOBAL HIGH-INTENSITY SWEETENERS MARKET ESTIMATES & FORECAST, BY REGION, 2020–2030 (KILOTONS) 110
      1. \r\n
    97. NORTH AMERICA: MARKET ESTIMATES & FORECAST, BY COUNTRY, 2020–2030 (USD MILLION) 111
      1. \r\n
    98. NORTH AMERICA: MARKET ESTIMATES & FORECAST, BY COUNTRY, 2020–2030 (KILOTONS) 112
      1. \r\n
    99. NORTH AMERICA: MARKET ESTIMATES, BY PRODUCT, 2020–2030 (USD MILLION) 112
      1. \r\n
    100. NORTH AMERICA: MARKET ESTIMATES, BY PRODUCT, 2020–2030 (KILOTONS) 112
      1. \r\n
    101. NORTH AMERICA: MARKET ESTIMATES, BY FORM, 2020–2030 (USD MILLION) 113
      1. \r\n
    102. NORTH AMERICA: MARKET ESTIMATES, BY FORM, 2020–2030 (KILOTONS) 113
      1. \r\n
    103. NORTH AMERICA: MARKET ESTIMATES, BY CATEGORY, 2020–2030 (USD MILLION) 113
      1. \r\n
    104. NORTH AMERICA: MARKET ESTIMATES, BY CATEGORY, 2020–2030 (KILOTONS) 113
      1. \r\n
    105. NORTH AMERICA: MARKET ESTIMATES, BY APPLICATION, 2020–2030 (USD MILLION) 114
      1. \r\n
    106. NORTH AMERICA: MARKET ESTIMATES, BY APPLICATION, 2020–2030 (KILOTONS) 114
      1. \r\n
    107. NORTH AMERICA: MARKET ESTIMATES & FORECAST, BY CATEGORY IN APPLICATION, 2020–2030 (USD MILLION) 115
      1. \r\n
    108. NORTH AMERICA: MARKET ESTIMATES & FORECAST, BY CATEGORY IN APPLICATION, 2020–2030 (KILOTONS) 116
      1. \r\n
    109. NORTH AMERICA: MARKET ESTIMATES, BY END USER, 2020–2030 (USD MILLION) 116
      1. \r\n
    110. NORTH AMERICA: MARKET ESTIMATES, BY END USER, 2020–2030 (KILOTONS) 117
      1. \r\n
    111. NORTH AMERICA: MARKET ESTIMATES, BY DISTRIBUTION CHANNEL, 2020–2030 (USD MILLION) 117
      1. \r\n
    112. NORTH AMERICA: MARKET ESTIMATES, BY DISTRIBUTION CHANNEL, 2020–2030 (KILOTONS) 117
      1. \r\n
    113. US: MARKET ESTIMATES, BY PRODUCT, 2020–2030 (USD MILLION) 118
      1. \r\n
    114. US: MARKET ESTIMATES, BY PRODUCT, 2020–2030 (KILOTONS) 118
      1. \r\n
    115. US: MARKET ESTIMATES, BY FORM, 2020–2030 (USD MILLION) 118
      1. \r\n
    116. US: MARKET ESTIMATES, BY FORM, 2020–2030 (KILOTONS) 119
      1. \r\n
    117. US: MARKET ESTIMATES, BY CATEGORY, 2020–2030 (USD MILLION) 119
      1. \r\n
    118. US: MARKET ESTIMATES, BY CATEGORY, 2020–2030 (KILOTONS) 119
      1. \r\n
    119. US: MARKET ESTIMATES, BY APPLICATION, 2020–2030 (USD MILLION) 119
      1. \r\n
    120. US: MARKET ESTIMATES, BY APPLICATION, 2020–2030 (KILOTONS) 120
      1. \r\n
    121. US: MARKET ESTIMATES & FORECAST, BY CATEGORY IN APPLICATION, 2020–2030 (USD MILLION) 120
      1. \r\n
    122. US: MARKET ESTIMATES & FORECAST, BY CATEGORY IN APPLICATION, 2020–2030 (KILOTONS) 121
      1. \r\n
    123. US: MARKET ESTIMATES, BY END USER, 2020–2030 (USD MILLION) 121
      1. \r\n
    124. US: MARKET ESTIMATES, BY END USER, 2020–2030 (KILOTONS) 121
      1. \r\n
    125. US: MARKET ESTIMATES, BY DISTRIBUTION CHANNEL, 2020–2030 (USD MILLION) 122
      1. \r\n
    126. US: MARKET ESTIMATES, BY DISTRIBUTION CHANNEL, 2020–2030 (KILOTONS) 122
      1. \r\n
    127. CANADA: MARKET ESTIMATES, BY PRODUCT, 2020–2030 (USD MILLION) 122
      1. \r\n
    128. CANADA: MARKET ESTIMATES, BY PRODUCT, 2020–2030 (KILOTONS) 123
      1. \r\n
    129. CANADA: MARKET ESTIMATES, BY FORM, 2020–2030 (USD MILLION) 123
      1. \r\n
    130. CANADA: MARKET ESTIMATES, BY FORM, 2020–2030 (KILOTONS) 123
      1. \r\n
    131. CANADA: MARKET ESTIMATES, BY CATEGORY, 2020–2030 (USD MILLION) 123
      1. \r\n
    132. CANADA: MARKET ESTIMATES, BY CATEGORY, 2020–2030 (KILOTONS) 124
      1. \r\n
    133. CANADA: MARKET ESTIMATES, BY APPLICATION, 2020–2030 (USD MILLION) 124
      1. \r\n
    134. CANADA: MARKET ESTIMATES, BY APPLICATION, 2020–2030 (KILOTONS) 124
      1. \r\n
    135. CANADA: MARKET ESTIMATES & FORECAST, BY CATEGORY IN APPLICATION, 2020–2030 (USD MILLION) 125
      1. \r\n
    136. CANADA: MARKET ESTIMATES & FORECAST, BY CATEGORY IN APPLICATION, 2020–2030 (KILOTONS) 126
      1. \r\n
    137. CANADA: MARKET ESTIMATES, BY END USER, 2020–2030 (USD MILLION) 126
      1. \r\n
    138. CANADA: MARKET ESTIMATES, BY END USER, 2020–2030 (KILOTONS) 127
      1. \r\n
    139. CANADA: MARKET ESTIMATES, BY DISTRIBUTION CHANNEL, 2020–2030 (USD MILLION) 127
      1. \r\n
    140. CANADA: MARKET ESTIMATES, BY DISTRIBUTION CHANNEL, 2020–2030 (KILOTONS) 127
      1. \r\n
    141. MEXICO: MARKET ESTIMATES, BY PRODUCT, 2020–2030 (USD MILLION) 128
      1. \r\n
    142. MEXICO: MARKET ESTIMATES, BY PRODUCT, 2020–2030 (KILOTONS) 128
      1. \r\n
    143. MEXICO: MARKET ESTIMATES, BY FORM, 2020–2030 (USD MILLION) 128
      1. \r\n
    144. MEXICO: MARKET ESTIMATES, BY FORM, 2020–2030 (KILOTONS) 129
      1. \r\n
    145. MEXICO: MARKET ESTIMATES, BY CATEGORY, 2020–2030 (USD MILLION) 129
      1. \r\n
    146. MEXICO: MARKET ESTIMATES, BY CATEGORY, 2020–2030 (KILOTONS) 129
      1. \r\n
    147. MEXICO: MARKET ESTIMATES, BY APPLICATION, 2020–2030 (USD MILLION) 129
      1. \r\n
    148. MEXICO: MARKET ESTIMATES, BY APPLICATION, 2020–2030 (KILOTONS) 130
      1. \r\n
    149. MEXICO: MARKET ESTIMATES & FORECAST, BY CATEGORY IN APPLICATION, 2020–2030 (USD MILLION) 130
      1. \r\n
    150. MEXICO: MARKET ESTIMATES & FORECAST, BY CATEGORY IN APPLICATION, 2020–2030 (KILOTONS) 131
      1. \r\n
    151. MEXICO: MARKET ESTIMATES, BY END USER, 2020–2030 (USD MILLION) 131
      1. \r\n
    152. MEXICO: MARKET ESTIMATES, BY END USER, 2020–2030 (KILOTONS) 132
      1. \r\n
    153. MEXICO: MARKET ESTIMATES, BY DISTRIBUTION CHANNEL, 2020–2030 (USD MILLION) 132
      1. \r\n
    154. MEXICO: MARKET ESTIMATES, BY DISTRIBUTION CHANNEL, 2020–2030 (KILOTONS) 132
      1. \r\n
    155. EUROPE: MARKET ESTIMATES & FORECAST, BY COUNTRY, 2020–2030 (USD MILLION) 134
      1. \r\n
    156. EUROPE: MARKET ESTIMATES & FORECAST, BY COUNTRY, 2020–2030 (KILOTONS) 134
      1. \r\n
    157. EUROPE: MARKET ESTIMATES, BY PRODUCT, 2020–2030 (USD MILLION) 135
      1. \r\n
    158. EUROPE: MARKET ESTIMATES, BY PRODUCT, 2020–2030 (KILOTONS) 135
      1. \r\n
    159. EUROPE: MARKET ESTIMATES, BY FORM, 2020–2030 (USD MILLION) 135
      1. \r\n
    160. EUROPE: MARKET ESTIMATES, BY FORM, 2020–2030 (KILOTONS) 136
      1. \r\n
    161. EUROPE: MARKET ESTIMATES, BY CATEGORY, 2020–2030 (USD MILLION) 136
      1. \r\n
    162. EUROPE: MARKET ESTIMATES, BY CATEGORY, 2020–2030 (KILOTONS) 136
      1. \r\n
    163. EUROPE: MARKET ESTIMATES, BY APPLICATION, 2020–2030 (USD MILLION) 137
      1. \r\n
    164. EUROPE: MARKET ESTIMATES, BY APPLICATION, 2020–2030 (KILOTONS) 137
      1. \r\n
    165. EUROPE: MARKET ESTIMATES & FORECAST, BY CATEGORY IN APPLICATION, 2020–2030 (USD MILLION) 138
      1. \r\n
    166. EUROPE: MARKET ESTIMATES & FORECAST, BY CATEGORY IN APPLICATION, 2020–2030 (KILOTONS) 139
      1. \r\n
    167. EUROPE: MARKET ESTIMATES, BY END USER, 2020–2030 (USD MILLION) 139
      1. \r\n
    168. EUROPE: MARKET ESTIMATES, BY END USER, 2020–2030 (KILOTONS) 140
      1. \r\n
    169. EUROPE: MARKET ESTIMATES, BY DISTRIBUTION CHANNEL, 2020–2030 (USD MILLION) 140
      1. \r\n
    170. EUROPE: MARKET ESTIMATES, BY DISTRIBUTION CHANNEL, 2020–2030 (KILOTONS) 140
      1. \r\n
    171. GERMANY: MARKET ESTIMATES, BY PRODUCT, 2020–2030 (USD MILLION) 141
      1. \r\n
    172. GERMANY: MARKET ESTIMATES, BY PRODUCT, 2020–2030 (KILOTONS) 141
      1. \r\n
    173. GERMANY: MARKET ESTIMATES, BY FORM, 2020–2030 (USD MILLION) 141
      1. \r\n
    174. GERMANY: MARKET ESTIMATES, BY FORM, 2020–2030 (KILOTONS) 142
      1. \r\n
    175. GERMANY: MARKET ESTIMATES, BY CATEGORY, 2020–2030 (USD MILLION) 142
      1. \r\n
    176. GERMANY: MARKET ESTIMATES, BY CATEGORY, 2020–2030 (KILOTONS) 142
      1. \r\n
    177. GERMANY: MARKET ESTIMATES, BY APPLICATION, 2020–2030 (USD MILLION) 142
      1. \r\n
    178. GERMANY: MARKET ESTIMATES, BY APPLICATION, 2020–2030 (KILOTONS) 143
      1. \r\n
    179. GERMANY: MARKET ESTIMATES & FORECAST, BY CATEGORY IN APPLICATION, 2020–2030 (USD MILLION) 143
      1. \r\n
    180. GERMANY: MARKET ESTIMATES & FORECAST, BY CATEGORY IN APPLICATION, 2020–2030 (KILOTONS) 144
      1. \r\n
    181. GERMANY: MARKET ESTIMATES, BY END USER, 2020–2030 (USD MILLION) 144
      1. \r\n
    182. GERMANY: MARKET ESTIMATES, BY END USER, 2020–2030 (KILOTONS) 145
      1. \r\n
    183. GERMANY: MARKET ESTIMATES, BY DISTRIBUTION CHANNEL, 2020–2030 (USD MILLION) 145
      1. \r\n
    184. GERMANY: MARKET ESTIMATES, BY DISTRIBUTION CHANNEL, 2020–2030 (KILOTONS) 145
      1. \r\n
    185. ITALY: MARKET ESTIMATES, BY PRODUCT, 2020–2030 (USD MILLION) 146
      1. \r\n
    186. ITALY: MARKET ESTIMATES, BY PRODUCT, 2020–2030 (KILOTONS) 146
      1. \r\n
    187. ITALY: MARKET ESTIMATES, BY FORM, 2020–2030 (USD MILLION) 146
      1. \r\n
    188. ITALY: MARKET ESTIMATES, BY FORM, 2020–2030 (KILOTONS) 147
      1. \r\n
    189. ITALY: MARKET ESTIMATES, BY CATEGORY, 2020–2030 (USD MILLION) 147
      1. \r\n
    190. ITALY: MARKET ESTIMATES, BY CATEGORY, 2020–2030 (KILOTONS) 147
      1. \r\n
    191. ITALY: MARKET ESTIMATES, BY APPLICATION, 2020–2030 (USD MILLION) 147
      1. \r\n
    192. ITALY: MARKET ESTIMATES, BY APPLICATION, 2020–2030 (KILOTONS) 148
      1. \r\n
    193. ITALY: MARKET ESTIMATES & FORECAST, BY CATEGORY IN APPLICATION, 2020–2030 (USD MILLION) 148
      1. \r\n
    194. ITALY: MARKET ESTIMATES & FORECAST, BY CATEGORY IN APPLICATION, 2020–2030 (KILOTONS) 149
      1. \r\n
    195. ITALY: MARKET ESTIMATES, BY END USER, 2020–2030 (USD MILLION) 149
      1. \r\n
    196. ITALY: MARKET ESTIMATES, BY END USER, 2020–2030 (KILOTONS) 150
      1. \r\n
    197. ITALY: MARKET ESTIMATES, BY DISTRIBUTION CHANNEL, 2020–2030 (USD MILLION) 150
      1. \r\n
    198. ITALY: MARKET ESTIMATES, BY DISTRIBUTION CHANNEL, 2020–2030 (KILOTONS) 150
      1. \r\n
    199. SPAIN AND PORTUGAL: MARKET ESTIMATES, BY PRODUCT, 2020–2030 (USD MILLION) 151
      1. \r\n
    200. SPAIN AND PORTUGAL: MARKET ESTIMATES, BY PRODUCT, 2020–2030 (KILOTONS) 151
      1. \r\n
    201. SPAIN AND PORTUGAL: MARKET ESTIMATES, BY FORM, 2020–2030 (USD MILLION 151
      1. \r\n
    202. SPAIN AND PORTUGAL: MARKET ESTIMATES, BY FORM, 2020–2030 (KILOTONS) 152
      1. \r\n
    203. SPAIN AND PORTUGAL: MARKET ESTIMATES, BY CATEGORY, 2020–2030 (USD MILLION 152
      1. \r\n
    204. SPAIN AND PORTUGAL: MARKET ESTIMATES, BY CATEGORY, 2020–2030 (KILOTONS) 152
      1. \r\n
    205. SPAIN AND PORTUGAL: MARKET ESTIMATES, BY APPLICATION, 2020–2030 (USD MILLION 152
      1. \r\n
    206. SPAIN AND PORTUGAL: MARKET ESTIMATES, BY APPLICATION, 2020–2030 (KILOTONS) 153
      1. \r\n
    207. SPAIN & PORTUGAL: MARKET ESTIMATES & FORECAST, BY CATEGORY IN APPLICATION, 2020–2030 (USD MILLION) 153
      1. \r\n
    208. SPAIN & PORTUGAL: MARKET ESTIMATES & FORECAST, BY CATEGORY IN APPLICATION, 2020–2030 (KILOTONS) 154
      1. \r\n
    209. SPAIN AND PORTUGAL: MARKET ESTIMATES, BY END USER, 2020–2030 (USD MILLION 154
      1. \r\n
    210. SPAIN AND PORTUGAL: MARKET ESTIMATES, BY END USER, 2020–2030 (KILOTONS) 155
      1. \r\n
    211. SPAIN AND PORTUGAL: MARKET ESTIMATES, BY DISTRIBUTION CHANNEL, 2020–2030 (USD MILLION 155
      1. \r\n
    212. SPAIN AND PORTUGAL: MARKET ESTIMATES, BY DISTRIBUTION CHANNEL, 2020–2030 (KILOTONS) 155
      1. \r\n
    213. AUSTRIA AND SWITZERLAND: MARKET ESTIMATES, BY PRODUCT, 2020–2030 (USD MILLION) 156
      1. \r\n
    214. AUSTRIA AND SWITZERLAND: MARKET ESTIMATES, BY PRODUCT, 2020–2030 (KILOTONS) 156
      1. \r\n
    215. AUSTRIA AND SWITZERLAND: MARKET ESTIMATES, BY FORM, 2020–2030 (USD MILLION) 156
      1. \r\n
    216. AUSTRIA AND SWITZERLAND: MARKET ESTIMATES, BY FORM, 2020–2030 (KILOTONS) 157
      1. \r\n
    217. AUSTRIA AND SWITZERLAND: MARKET ESTIMATES, BY CATEGORY, 2020–2030 (USD MILLION) 157
      1. \r\n
    218. AUSTRIA AND SWITZERLAND: MARKET ESTIMATES, BY CATEGORY, 2020–2030 (KILOTONS) 157
      1. \r\n
    219. AUSTRIA AND SWITZERLAND: MARKET ESTIMATES, BY APPLICATION, 2020–2030 (USD MILLION) 157
      1. \r\n
    220. AUSTRIA AND SWITZERLAND: MARKET ESTIMATES, BY APPLICATION, 2020–2030 (KILOTONS) 158
      1. \r\n
    221. AUSTRIA & SWITZERLAND: MARKET ESTIMATES & FORECAST, BY CATEGORY IN APPLICATION, 2020–2030 (USD MILLION) 158
      1. \r\n
    222. AUSTRIA & SWITZERLAND: MARKET ESTIMATES & FORECAST, BY CATEGORY IN APPLICATION, 2020–2030 (KILOTONS) 159
      1. \r\n
    223. AUSTRIA AND SWITZERLAND: MARKET ESTIMATES, BY END USER, 2020–2030 (USD MILLION) 159
      1. \r\n
    224. AUSTRIA AND SWITZERLAND: MARKET ESTIMATES, BY END USER, 2020–2030 (KILOTONS) 160
      1. \r\n
    225. AUSTRIA AND SWITZERLAND: MARKET ESTIMATES, BY DISTRIBUTION CHANNEL, 2020–2030 (USD MILLION) 160
      1. \r\n
    226. AUSTRIA AND SWITZERLAND: MARKET ESTIMATES, BY DISTRIBUTION CHANNEL, 2020–2030 (KILOTONS) 160
      1. \r\n
    227. UK AND IRELAND: MARKET ESTIMATES, BY PRODUCT, 2020–2030 (USD MILLION) 161
      1. \r\n
    228. UK AND IRELAND: MARKET ESTIMATES, BY PRODUCT, 2020–2030 (KILOTONS) 161
      1. \r\n
    229. UK AND IRELAND: MARKET ESTIMATES, BY FORM, 2020–2030 (USD MILLION) 161
      1. \r\n
    230. UK AND IRELAND: MARKET ESTIMATES, BY FORM, 2020–2030 (KILOTONS) 162
      1. \r\n
    231. UK AND IRELAND: MARKET ESTIMATES, BY CATEGORY, 2020–2030 (USD MILLION) 162
      1. \r\n
    232. UK AND IRELAND: MARKET ESTIMATES, BY CATEGORY, 2020–2030 (KILOTONS) 162
      1. \r\n
    233. UK AND IRELAND: MARKET ESTIMATES, BY APPLICATION, 2020–2030 (USD MILLION) 162
      1. \r\n
    234. UK AND IRELAND: MARKET ESTIMATES, BY APPLICATION, 2020–2030 (KILOTONS) 163
      1. \r\n
    235. UK & IRELAND: MARKET ESTIMATES & FORECAST, BY CATEGORY IN APPLICATION, 2020–2030 (USD MILLION) 163
      1. \r\n
    236. UK & IRELAND: MARKET ESTIMATES & FORECAST, BY CATEGORY IN APPLICATION, 2020–2030 (KILOTONS) 164
      1. \r\n
    237. UK AND IRELAND: MARKET ESTIMATES, BY END USER, 2020–2030 (USD MILLION) 164
      1. \r\n
    238. UK AND IRELAND: MARKET ESTIMATES, BY END USER, 2020–2030 (KILOTONS) 165
      1. \r\n
    239. UK AND IRELAND: MARKET ESTIMATES, BY DISTRIBUTION CHANNEL, 2020–2030 (USD MILLION) 165
      1. \r\n
    240. UK AND IRELAND: MARKET ESTIMATES, BY DISTRIBUTION CHANNEL, 2020–2030 (KILOTONS) 165
      1. \r\n
    241. FRANCE: MARKET ESTIMATES, BY PRODUCT, 2020–2030 (USD MILLION) 166
      1. \r\n
    242. FRANCE: MARKET ESTIMATES, BY PRODUCT, 2020–2030 (KILOTONS) 166
      1. \r\n
    243. FRANCE: MARKET ESTIMATES, BY FORM, 2020–2030 (USD MILLION) 166
      1. \r\n
    244. FRANCE: MARKET ESTIMATES, BY FORM, 2020–2030 (KILOTONS) 167
      1. \r\n
    245. FRANCE: MARKET ESTIMATES, BY CATEGORY, 2020–2030 (USD MILLION) 167
      1. \r\n
    246. FRANCE: MARKET ESTIMATES, BY CATEGORY, 2020–2030 (KILOTONS) 167
      1. \r\n
    247. FRANCE: MARKET ESTIMATES, BY APPLICATION, 2020–2030 (USD MILLION) 167
      1. \r\n
    248. FRANCE: MARKET ESTIMATES, BY APPLICATION, 2020–2030 (KILOTONS) 168
      1. \r\n
    249. FRANCE: MARKET ESTIMATES & FORECAST, BY CATEGORY IN APPLICATION, 2020–2030 (USD MILLION) 168
      1. \r\n
    250. FRANCE: MARKET ESTIMATES & FORECAST, BY CATEGORY IN APPLICATION, 2020–2030 (KILOTONS) 169
      1. \r\n
    251. FRANCE: MARKET ESTIMATES, BY END USER, 2020–2030 (USD MILLION) 169
      1. \r\n
    252. FRANCE: MARKET ESTIMATES, BY END USER, 2020–2030 (KILOTONS) 170
      1. \r\n
    253. FRANCE: MARKET ESTIMATES, BY DISTRIBUTION CHANNEL, 2020–2030 (USD MILLION) 170
      1. \r\n
    254. FRANCE: MARKET ESTIMATES, BY DISTRIBUTION CHANNEL, 2020–2030 (KILOTONS) 170
      1. \r\n
    255. BENELUX: MARKET ESTIMATES, BY PRODUCT, 2020–2030 (USD MILLION) 171
      1. \r\n
    256. BENELUX: MARKET ESTIMATES, BY PRODUCT, 2020–2030 (KILOTONS) 171
      1. \r\n
    257. BENELUX: MARKET ESTIMATES, BY FORM, 2020–2030 (USD MILLION) 171
      1. \r\n
    258. BENELUX: MARKET ESTIMATES, BY FORM, 2020–2030 (KILOTONS) 172
      1. \r\n
    259. BENELUX: MARKET ESTIMATES, BY CATEGORY, 2020–2030 (USD MILLION) 172
      1. \r\n
    260. BENELUX: MARKET ESTIMATES, BY CATEGORY, 2020–2030 (KILOTONS) 172
      1. \r\n
    261. BENELUX: MARKET ESTIMATES, BY APPLICATION, 2020–2030 (USD MILLION) 172
      1. \r\n
    262. BENELUX: MARKET ESTIMATES, BY APPLICATION, 2020–2030 (KILOTONS) 173
      1. \r\n
    263. BENELUX: MARKET ESTIMATES & FORECAST, BY CATEGORY IN APPLICATION, 2020–2030 (USD MILLION) 173
      1. \r\n
    264. BENELUX: MARKET ESTIMATES & FORECAST, BY CATEGORY IN APPLICATION, 2020–2030 (KILOTONS) 174
      1. \r\n
    265. BENELUX: MARKET ESTIMATES, BY END USER, 2020–2030 (USD MILLION) 174
      1. \r\n
    266. BENELUX: MARKET ESTIMATES, BY END USER, 2020–2030 (KILOTONS) 175
      1. \r\n
    267. BENELUX: MARKET ESTIMATES, BY DISTRIBUTION CHANNEL, 2020–2030 (USD MILLION) 175
      1. \r\n
    268. BENELUX: MARKET ESTIMATES, BY DISTRIBUTION CHANNEL, 2020–2030 (KILOTONS) 175
      1. \r\n
    269. NORDICS: MARKET ESTIMATES, BY PRODUCT, 2020–2030 (USD MILLION) 176
      1. \r\n
    270. NORDICS: MARKET ESTIMATES, BY PRODUCT, 2020–2030 (KILOTONS) 176
      1. \r\n
    271. NORDICS: MARKET ESTIMATES, BY FORM, 2020–2030 (USD MILLION) 176
      1. \r\n
    272. NORDICS: MARKET ESTIMATES, BY FORM, 2020–2030 (KILOTONS) 177
      1. \r\n
    273. NORDICS: MARKET ESTIMATES, BY CATEGORY, 2020–2030 (USD MILLION) 177
      1. \r\n
    274. NORDICS: MARKET ESTIMATES, BY CATEGORY, 2020–2030 (KILOTONS) 177
      1. \r\n
    275. NORDICS: MARKET ESTIMATES, BY APPLICATION, 2020–2030 (USD MILLION) 177
      1. \r\n
    276. NORDICS: MARKET ESTIMATES, BY APPLICATION, 2020–2030 (KILOTONS) 178
      1. \r\n
    277. NORDICS: MARKET ESTIMATES & FORECAST, BY CATEGORY IN APPLICATION, 2020–2030 (USD MILLION) 178
      1. \r\n
    278. NORDICS: MARKET ESTIMATES & FORECAST, BY CATEGORY IN APPLICATION, 2020–2030 (KILOTONS) 179
      1. \r\n
    279. NORDICS: MARKET ESTIMATES, BY END USER, 2020–2030 (USD MILLION) 179
      1. \r\n
    280. NORDICS: MARKET ESTIMATES, BY END USER, 2020–2030 (KILOTONS) 180
      1. \r\n
    281. NORDICS: MARKET ESTIMATES, BY DISTRIBUTION CHANNEL, 2020–2030 (USD MILLION) 180
      1. \r\n
    282. NORDICS: MARKET ESTIMATES, BY DISTRIBUTION CHANNEL, 2020–2030 (KILOTONS) 180
      1. \r\n
    283. CENTRAL AND EASTERN EUROPE: MARKET ESTIMATES, BY PRODUCT, 2020–2030 (USD MILLION) 181
      1. \r\n
    284. CENTRAL AND EASTERN EUROPE: MARKET ESTIMATES, BY PRODUCT, 2020–2030 (KILOTONS) 181
      1. \r\n
    285. CENTRAL AND EASTERN EUROPE: MARKET ESTIMATES, BY FORM, 2020–2030 (USD MILLION) 181
      1. \r\n
    286. CENTRAL AND EASTERN EUROPE: MARKET ESTIMATES, BY FORM, 2020–2030 (KILOTONS) 182
      1. \r\n
    287. CENTRAL AND EASTERN EUROPE: MARKET ESTIMATES, BY CATEGORY, 2020–2030 (USD MILLION) 182
      1. \r\n
    288. CENTRAL AND EASTERN EUROPE: MARKET ESTIMATES, BY CATEGORY, 2020–2030 (KILOTONS) 182
      1. \r\n
    289. CENTRAL AND EASTERN EUROPE: MARKET ESTIMATES, BY APPLICATION, 2020–2030 (USD MILLION) 182
      1. \r\n
    290. CENTRAL AND EASTERN EUROPE: MARKET ESTIMATES, BY APPLICATION, 2020–2030 (KILOTONS) 183
      1. \r\n
    291. CENTRAL & EASTERN EUROPE: MARKET ESTIMATES & FORECAST, BY CATEGORY IN APPLICATION, 2020–2030 (USD MILLION) 183
      1. \r\n
    292. CENTRAL & EASTERN EUROPE: MARKET ESTIMATES & FORECAST, BY CATEGORY IN APPLICATION, 2020–2030 (KILOTONS) 184
      1. \r\n
    293. CENTRAL AND EASTERN EUROPE: MARKET ESTIMATES, BY END USER, 2020–2030 (USD MILLION) 184
      1. \r\n
    294. CENTRAL AND EASTERN EUROPE: MARKET ESTIMATES, BY END USER, 2020–2030 (KILOTONS) 185
      1. \r\n
    295. CENTRAL AND EASTERN EUROPE: MARKET ESTIMATES, BY DISTRIBUTION CHANNEL, 2020–2030 (USD MILLION) 185
      1. \r\n
    296. CENTRAL AND EASTERN EUROPE: MARKET ESTIMATES, BY DISTRIBUTION CHANNEL, 2020–2030 (KILOTONS) 185
      1. \r\n
    297. SOUTHERN EUROPE: MARKET ESTIMATES, BY PRODUCT, 2020–2030 (USD MILLION) 186
      1. \r\n
    298. SOUTHERN EUROPE: MARKET ESTIMATES, BY PRODUCT, 2020–2030 (KILOTONS) 186
      1. \r\n
    299. SOUTHERN EUROPE: MARKET ESTIMATES, BY FORM, 2020–2030 (USD MILLION) 186
      1. \r\n
    300. SOUTHERN EUROPE: MARKET ESTIMATES, BY FORM, 2020–2030 (KILOTONS) 187
      1. \r\n
    301. SOUTHERN EUROPE: MARKET ESTIMATES, BY CATEGORY, 2020–2030 (USD MILLION) 187
      1. \r\n
    302. SOUTHERN EUROPE: MARKET ESTIMATES, BY CATEGORY, 2020–2030 (KILOTONS) 187
      1. \r\n
    303. SOUTHERN EUROPE: MARKET ESTIMATES, BY APPLICATION, 2020–2030 (USD MILLION) 187
      1. \r\n
    304. SOUTHERN EUROPE: MARKET ESTIMATES, BY APPLICATION, 2020–2030 (KILOTONS) 188
      1. \r\n
    305. SOUTHERN EUROPE: MARKET ESTIMATES & FORECAST, BY CATEGORY IN APPLICATION, 2020–2030 (USD MILLION) 188
      1. \r\n
    306. SOUTHERN EUROPE: MARKET ESTIMATES & FORECAST, BY CATEGORY IN APPLICATION, 2020–2030 (KILOTONS) 189
      1. \r\n
    307. SOUTHERN EUROPE: MARKET ESTIMATES, BY END USER, 2020–2030 (USD MILLION) 189
      1. \r\n
    308. SOUTHERN EUROPE: MARKET ESTIMATES, BY END USER, 2020–2030 (KILOTONS) 190
      1. \r\n
    309. SOUTHERN EUROPE: MARKET ESTIMATES, BY DISTRIBUTION CHANNEL, 2020–2030 (USD MILLION) 190
      1. \r\n
    310. SOUTHERN EUROPE: MARKET ESTIMATES, BY DISTRIBUTION CHANNEL, 2020–2030 (KILOTONS) 190
      1. \r\n
    311. ASIA-PACIFIC: MARKET ESTIMATES & FORECAST, BY COUNTRY, 2020–2030 (USD MILLION) 192
      1. \r\n
    312. ASIA-PACIFIC: MARKET ESTIMATES & FORECAST, BY COUNTRY, 2020–2030 (KILOTONS) 192
      1. \r\n
    313. ASIA-PACIFIC: MARKET ESTIMATES, BY PRODUCT, 2020–2030 (USD MILLION) 192
      1. \r\n
    314. ASIA-PACIFIC: MARKET ESTIMATES, BY PRODUCT, 2020–2030 (KILOTONS) 193
      1. \r\n
    315. ASIA-PACIFIC: MARKET ESTIMATES, BY FORM, 2020–2030 (USD MILLION) 193
      1. \r\n
    316. ASIA-PACIFIC: MARKET ESTIMATES, BY FORM, 2020–2030 (KILOTONS) 193
      1. \r\n
    317. ASIA-PACIFIC: MARKET ESTIMATES, BY CATEGORY, 2020–2030 (USD MILLION) 194
      1. \r\n
    318. ASIA-PACIFIC: MARKET ESTIMATES, BY CATEGORY, 2020–2030 (KILOTONS) 194
      1. \r\n
    319. ASIA-PACIFIC: MARKET ESTIMATES, BY APPLICATION, 2020–2030 (USD MILLION) 194
      1. \r\n
    320. ASIA-PACIFIC: MARKET ESTIMATES, BY APPLICATION, 2020–2030 (KILOTONS) 195
      1. \r\n
    321. ASIA PACIFIC: MARKET ESTIMATES & FORECAST, BY CATEGORY IN APPLICATION, 2020–2030 (USD MILLION) 195
      1. \r\n
    322. ASIA PACIFIC: MARKET ESTIMATES & FORECAST, BY CATEGORY IN APPLICATION, 2020–2030 (KILOTONS) 196
      1. \r\n
    323. ASIA-PACIFIC: MARKET ESTIMATES, BY END USER, 2020–2030 (USD MILLION) 197
      1. \r\n
    324. ASIA-PACIFIC: MARKET ESTIMATES, BY END USER, 2020–2030 (KILOTONS) 197
      1. \r\n
    325. ASIA-PACIFIC: MARKET ESTIMATES, BY DISTRIBUTION CHANNEL, 2020–2030 (USD MILLION) 197
      1. \r\n
    326. ASIA-PACIFIC: MARKET ESTIMATES, BY DISTRIBUTION CHANNEL, 2020–2030 (KILOTONS) 197
      1. \r\n
    327. CHINA: MARKET ESTIMATES, BY PRODUCT, 2020–2030 (USD MILLION) 198
      1. \r\n
    328. CHINA: MARKET ESTIMATES, BY PRODUCT, 2020–2030 (KILOTONS) 198
      1. \r\n
    329. CHINA: MARKET ESTIMATES, BY FORM, 2020–2030 (USD MILLION) 198
      1. \r\n
    330. CHINA: MARKET ESTIMATES, BY FORM, 2020–2030 (KILOTONS) 199
      1. \r\n
    331. CHINA: MARKET ESTIMATES, BY CATEGORY, 2020–2030 (USD MILLION) 199
      1. \r\n
    332. CHINA: MARKET ESTIMATES, BY CATEGORY, 2020–2030 (KILOTONS) 199
      1. \r\n
    333. CHINA: MARKET ESTIMATES, BY APPLICATION, 2020–2030 (USD MILLION) 199
      1. \r\n
    334. CHINA: MARKET ESTIMATES, BY APPLICATION, 2020–2030 (KILOTONS) 200
      1. \r\n
    335. CHINA: MARKET ESTIMATES & FORECAST, BY CATEGORY IN APPLICATION, 2020–2030 (USD MILLION) 200
      1. \r\n
    336. CHINA: MARKET ESTIMATES & FORECAST, BY CATEGORY IN APPLICATION, 2020–2030 (KILOTONS) 201
      1. \r\n
    337. CHINA: MARKET ESTIMATES, BY END USER, 2020–2030 (USD MILLION) 201
      1. \r\n
    338. CHINA: MARKET ESTIMATES, BY END USER, 2020–2030 (KILOTONS) 202
      1. \r\n
    339. CHINA: MARKET ESTIMATES, BY DISTRIBUTION CHANNEL, 2020–2030 (USD MILLION) 202
      1. \r\n
    340. CHINA: MARKET ESTIMATES, BY DISTRIBUTION CHANNEL, 2020–2030 (KILOTONS) 202
      1. \r\n
    341. JAPAN: MARKET ESTIMATES, BY PRODUCT, 2020–2030 (USD MILLION) 203
      1. \r\n
    342. JAPAN: MARKET ESTIMATES, BY PRODUCT, 2020–2030 (KILOTONS) 203
      1. \r\n
    343. JAPAN: MARKET ESTIMATES, BY FORM, 2020–2030 (USD MILLION) 203
      1. \r\n
    344. JAPAN: MARKET ESTIMATES, BY FORM, 2020–2030 (KILOTONS) 204
      1. \r\n
    345. JAPAN: MARKET ESTIMATES, BY CATEGORY, 2020–2030 (USD MILLION) 204
      1. \r\n
    346. JAPAN: MARKET ESTIMATES, BY CATEGORY, 2020–2030 (KILOTONS) 204
      1. \r\n
    347. JAPAN: MARKET ESTIMATES, BY APPLICATION, 2020–2030 (USD MILLION) 204
      1. \r\n
    348. JAPAN: MARKET ESTIMATES, BY APPLICATION, 2020–2030 (KILOTONS) 205
      1. \r\n
    349. JAPAN: MARKET ESTIMATES & FORECAST, BY CATEGORY IN APPLICATION, 2020–2030 (USD MILLION) 205
      1. \r\n
    350. JAPAN: MARKET ESTIMATES & FORECAST, BY CATEGORY IN APPLICATION, 2020–2030 (KILOTONS) 206
      1. \r\n
    351. JAPAN: MARKET ESTIMATES, BY END USER, 2020–2030 (USD MILLION) 206
      1. \r\n
    352. JAPAN: MARKET ESTIMATES, BY END USER, 2020–2030 (KILOTONS) 207
      1. \r\n
    353. JAPAN: MARKET ESTIMATES, BY DISTRIBUTION CHANNEL, 2020–2030 (USD MILLION) 207
      1. \r\n
    354. JAPAN: MARKET ESTIMATES, BY DISTRIBUTION CHANNEL, 2020–2030 (KILOTONS) 207
      1. \r\n
    355. INDIA: MARKET ESTIMATES, BY PRODUCT, 2020–2030 (USD MILLION) 208
      1. \r\n
    356. INDIA: MARKET ESTIMATES, BY PRODUCT, 2020–2030 (KILOTONS) 208
      1. \r\n
    357. INDIA: MARKET ESTIMATES, BY FORM, 2020–2030 (USD MILLION) 208
      1. \r\n
    358. INDIA: MARKET ESTIMATES, BY FORM, 2020–2030 (KILOTONS) 209
      1. \r\n
    359. INDIA: MARKET ESTIMATES, BY CATEGORY, 2020–2030 (USD MILLION) 209
      1. \r\n
    360. INDIA: MARKET ESTIMATES, BY CATEGORY, 2020–2030 (KILOTONS) 209
      1. \r\n
    361. INDIA: MARKET ESTIMATES, BY APPLICATION, 2020–2030 (USD MILLION) 209
      1. \r\n
    362. INDIA: MARKET ESTIMATES, BY APPLICATION, 2020–2030 (KILOTONS) 210
      1. \r\n
    363. INDIA: MARKET ESTIMATES & FORECAST, BY CATEGORY IN APPLICATION, 2020–2030 (USD MILLION) 210
      1. \r\n
    364. INDIA: MARKET ESTIMATES & FORECAST, BY CATEGORY IN APPLICATION, 2020–2030 (KILOTONS) 211
      1. \r\n
    365. INDIA: MARKET ESTIMATES, BY END USER, 2020–2030 (USD MILLION) 211
      1. \r\n
    366. INDIA: MARKET ESTIMATES, BY END USER, 2020–2030 (KILOTONS) 212
      1. \r\n
    367. INDIA: MARKET ESTIMATES, BY DISTRIBUTION CHANNEL, 2020–2030 (USD MILLION) 212
      1. \r\n
    368. INDIA: MARKET ESTIMATES, BY DISTRIBUTION CHANNEL, 2020–2030 (KILOTONS) 212
      1. \r\n
    369. AUSTRALIA AND NEW ZEALAND: MARKET ESTIMATES, BY PRODUCT, 2020–2030 (USD MILLION) 213
      1. \r\n
    370. AUSTRALIA AND NEW ZEALAND: MARKET ESTIMATES, BY PRODUCT, 2020–2030 (KILOTONS) 213
      1. \r\n
    371. AUSTRALIA AND NEW ZEALAND: MARKET ESTIMATES, BY FORM, 2020–2030 (USD MILLION) 213
      1. \r\n
    372. AUSTRALIA AND NEW ZEALAND: MARKET ESTIMATES, BY FORM, 2020–2030 (KILOTONS) 214
      1. \r\n
    373. AUSTRALIA AND NEW ZEALAND: MARKET ESTIMATES, BY CATEGORY, 2020–2030 (USD MILLION) 214
      1. \r\n
    374. AUSTRALIA AND NEW ZEALAND: MARKET ESTIMATES, BY CATEGORY, 2020–2030 (KILOTONS) 214
      1. \r\n
    375. AUSTRALIA AND NEW ZEALAND: MARKET ESTIMATES, BY APPLICATION, 2020–2030 (USD MILLION) 214
      1. \r\n
    376. AUSTRALIA AND NEW ZEALAND: MARKET ESTIMATES, BY APPLICATION, 2020–2030 (KILOTONS) 215
      1. \r\n
    377. AUSTRALIA & NEW ZEALAND: MARKET ESTIMATES & FORECAST, BY CATEGORY IN APPLICATION, 2020–2030 (USD MILLION) 215
      1. \r\n
    378. AUSTRALIA & NEW ZEALAND: MARKET ESTIMATES & FORECAST, BY CATEGORY IN APPLICATION, 2020–2030 (KILOTONS) 216
      1. \r\n
    379. AUSTRALIA AND NEW ZEALAND: MARKET ESTIMATES, BY END USER, 2020–2030 (USD MILLION) 216
      1. \r\n
    380. AUSTRALIA AND NEW ZEALAND: MARKET ESTIMATES, BY END USER, 2020–2030 (KILOTONS) 217
      1. \r\n
    381. AUSTRALIA AND NEW ZEALAND: MARKET ESTIMATES, BY DISTRIBUTION CHANNEL, 2020–2030 (USD MILLION) 217
      1. \r\n
    382. AUSTRALIA AND NEW ZEALAND: MARKET ESTIMATES, BY DISTRIBUTION CHANNEL, 2020–2030 (KILOTONS) 217
      1. \r\n
    383. REST OF ASIA-PACIFIC: MARKET ESTIMATES, BY PRODUCT, 2020–2030 (USD MILLION) 218
      1. \r\n
    384. REST OF ASIA-PACIFIC: MARKET ESTIMATES, BY PRODUCT, 2020–2030 (KILOTONS) 218
      1. \r\n
    385. REST OF ASIA-PACIFIC: MARKET ESTIMATES, BY FORM, 2020–2030 (USD MILLION) 218
      1. \r\n
    386. REST OF ASIA-PACIFIC: MARKET ESTIMATES, BY FORM, 2020–2030 (KILOTONS) 219
      1. \r\n
    387. REST OF ASIA-PACIFIC: MARKET ESTIMATES, BY CATEGORY, 2020–2030 (USD MILLION) 219
      1. \r\n
    388. REST OF ASIA-PACIFIC: MARKET ESTIMATES, BY CATEGORY, 2020–2030 (KILOTONS) 219
      1. \r\n
    389. REST OF ASIA-PACIFIC: MARKET ESTIMATES, BY APPLICATION, 2020–2030 (USD MILLION) 219
      1. \r\n
    390. REST OF ASIA-PACIFIC: MARKET ESTIMATES, BY APPLICATION, 2020–2030 (KILOTONS) 220
      1. \r\n
    391. REST OF ASIA PACIFIC: MARKET ESTIMATES & FORECAST, BY CATEGORY IN APPLICATION, 2020–2030 (USD MILLION) 220
      1. \r\n
    392. REST OF ASIA PACIFIC: MARKET ESTIMATES & FORECAST, BY CATEGORY IN APPLICATION, 2020–2030 (KILOTONS) 221
      1. \r\n
    393. REST OF ASIA-PACIFIC: MARKET ESTIMATES, BY END USER, 2020–2030 (USD MILLION) 221
      1. \r\n
    394. REST OF ASIA-PACIFIC: MARKET ESTIMATES, BY END USER, 2020–2030 (KILOTONS) 222
      1. \r\n
    395. REST OF ASIA-PACIFIC: MARKET ESTIMATES, BY DISTRIBUTION CHANNEL, 2020–2030 (USD MILLION) 222
      1. \r\n
    396. REST OF ASIA-PACIFIC: MARKET ESTIMATES, BY DISTRIBUTION CHANNEL, 2020–2030 (KILOTONS) 222
      1. \r\n
    397. REST OF THE WORLD: MARKET ESTIMATES & FORECAST, BY REGION, 2020–2030 (USD MILLION) 223
      1. \r\n
    398. REST OF THE WORLD: MARKET ESTIMATES & FORECAST, BY REGION, 2020–2030 (KILOTONS) 224
      1. \r\n
    399. REST OF THE WORLD: MARKET ESTIMATES, BY PRODUCT, 2020–2030 (USD MILLION) 224
      1. \r\n
    400. REST OF THE WORLD: MARKET ESTIMATES, BY PRODUCT, 2020–2030 (KILOTONS) 224
      1. \r\n
    401. REST OF THE WORLD: MARKET ESTIMATES, BY FORM, 2020–2030 (USD MILLION) 225
      1. \r\n
    402. REST OF THE WORLD: MARKET ESTIMATES, BY FORM, 2020–2030 (KILOTONS) 225
      1. \r\n
    403. REST OF THE WORLD: MARKET ESTIMATES, BY CATEGORY, 2020–2030 (USD MILLION) 225
      1. \r\n
    404. REST OF THE WORLD: MARKET ESTIMATES, BY CATEGORY, 2020–2030 (KILOTONS) 225
      1. \r\n
    405. REST OF THE WORLD: MARKET ESTIMATES, BY APPLICATION, 2020–2030 (USD MILLION) 226
      1. \r\n
    406. REST OF THE WORLD: MARKET ESTIMATES, BY APPLICATION, 2020–2030 (KILOTONS) 226
      1. \r\n
    407. REST OF THE WORLD: MARKET ESTIMATES & FORECAST, BY CATEGORY IN APPLICATION, 2020–2030 (USD MILLION) 227
      1. \r\n
    408. REST OF THE WORLD: MARKET ESTIMATES & FORECAST, BY CATEGORY IN APPLICATION, 2020–2030 (KILOTONS) 228
      1. \r\n
    409. REST OF THE WORLD: MARKET ESTIMATES, BY END USER, 2020–2030 (USD MILLION) 228
      1. \r\n
    410. REST OF THE WORLD: MARKET ESTIMATES, BY END USER, 2020–2030 (KILOTONS) 229
      1. \r\n
    411. REST OF THE WORLD: MARKET ESTIMATES, BY DISTRIBUTION CHANNEL, 2020–2030 (USD MILLION) 229
      1. \r\n
    412. REST OF THE WORLD: MARKET ESTIMATES, BY DISTRIBUTION CHANNEL, 2020–2030 (KILOTONS) 229
      1. \r\n
    413. SOUTH AMERICA: MARKET ESTIMATES, BY PRODUCT, 2020–2030 (USD MILLION) 230
      1. \r\n
    414. SOUTH AMERICA: MARKET ESTIMATES, BY PRODUCT, 2020–2030 (KILOTONS) 230
      1. \r\n
    415. SOUTH AMERICA: MARKET ESTIMATES, BY FORM, 2020–2030 (USD MILLION) 230
      1. \r\n
    416. SOUTH AMERICA: MARKET ESTIMATES, BY FORM, 2020–2030 (KILOTONS) 231
      1. \r\n
    417. SOUTH AMERICA: MARKET ESTIMATES, BY CATEGORY, 2020–2030 (USD MILLION) 231
      1. \r\n
    418. SOUTH AMERICA: MARKET ESTIMATES, BY CATEGORY, 2020–2030 (KILOTONS) 231
      1. \r\n
    419. SOUTH AMERICA: MARKET ESTIMATES, BY APPLICATION, 2020–2030 (USD MILLION) 231
      1. \r\n
    420. SOUTH AMERICA: MARKET ESTIMATES, BY APPLICATION, 2020–2030 (KILOTONS) 232
      1. \r\n
    421. SOUTH AMERICA: MARKET ESTIMATES & FORECAST, BY CATEGORY IN APPLICATION, 2020–2030 (USD MILLION) 232
      1. \r\n
    422. SOUTH AMERICA: MARKET ESTIMATES & FORECAST, BY CATEGORY IN APPLICATION, 2020–2030 (KILOTONS) 233
      1. \r\n
    423. SOUTH AMERICA: MARKET ESTIMATES, BY END USER, 2020–2030 (USD MILLION) 233
      1. \r\n
    424. SOUTH AMERICA: MARKET ESTIMATES, BY END USER, 2020–2030 (KILOTONS) 234
      1. \r\n
    425. SOUTH AMERICA: MARKET ESTIMATES, BY DISTRIBUTION CHANNEL, 2020–2030 (USD MILLION) 234
      1. \r\n
    426. SOUTH AMERICA: MARKET ESTIMATES, BY DISTRIBUTION CHANNEL, 2020–2030 (KILOTONS) 234
      1. \r\n
    427. MIDDLE EAST: MARKET ESTIMATES, BY PRODUCT, 2020–2030 (USD MILLION) 235
      1. \r\n
    428. MIDDLE EAST: MARKET ESTIMATES, BY PRODUCT, 2020–2030 (KILOTONS) 235
      1. \r\n
    429. MIDDLE EAST: MARKET ESTIMATES, BY FORM, 2020–2030 (USD MILLION) 235
      1. \r\n
    430. MIDDLE EAST: MARKET ESTIMATES, BY FORM, 2020–2030 (KILOTONS) 236
      1. \r\n
    431. MIDDLE EAST: MARKET ESTIMATES, BY CATEGORY, 2020–2030 (USD MILLION) 236
      1. \r\n
    432. MIDDLE EAST: MARKET ESTIMATES, BY CATEGORY, 2020–2030 (KILOTONS) 236
      1. \r\n
    433. MIDDLE EAST: MARKET ESTIMATES, BY APPLICATION, 2020–2030 (USD MILLION) 236
      1. \r\n
    434. MIDDLE EAST: MARKET ESTIMATES, BY APPLICATION, 2020–2030 (KILOTONS) 237
      1. \r\n
    435. MIDDLE EAST: MARKET ESTIMATES & FORECAST, BY CATEGORY IN APPLICATION, 2020–2030 (USD MILLION) 237
      1. \r\n
    436. MIDDLE EAST: MARKET ESTIMATES & FORECAST, BY CATEGORY IN APPLICATION, 2020–2030 (KILOTONS) 238
      1. \r\n
    437. MIDDLE EAST: MARKET ESTIMATES, BY END USER, 2020–2030 (USD MILLION) 238
      1. \r\n
    438. MIDDLE EAST: MARKET ESTIMATES, BY END USER, 2020–2030 (KILOTONS) 239
      1. \r\n
    439. MIDDLE EAST: MARKET ESTIMATES, BY DISTRIBUTION CHANNEL, 2020–2030 (USD MILLION) 239
      1. \r\n
    440. MIDDLE EAST: MARKET ESTIMATES, BY DISTRIBUTION CHANNEL, 2020–2030 (KILOTONS) 239
      1. \r\n
    441. AFRICA: MARKET ESTIMATES, BY PRODUCT, 2020–2030 (USD MILLION) 240
      1. \r\n
    442. AFRICA: MARKET ESTIMATES, BY PRODUCT, 2020–2030 (KILOTONS) 240
      1. \r\n
    443. AFRICA: MARKET ESTIMATES, BY FORM, 2020–2030 (USD MILLION) 240
      1. \r\n
    444. AFRICA: MARKET ESTIMATES, BY FORM, 2020–2030 (KILOTONS) 241
      1. \r\n
    445. AFRICA: MARKET ESTIMATES, BY CATEGORY, 2020–2030 (USD MILLION) 241
      1. \r\n
    446. AFRICA: MARKET ESTIMATES, BY CATEGORY, 2020–2030 (KILOTONS) 241
      1. \r\n
    447. AFRICA: MARKET ESTIMATES, BY APPLICATION, 2020–2030 (USD MILLION) 241
      1. \r\n
    448. AFRICA: MARKET ESTIMATES, BY APPLICATION, 2020–2030 (KILOTONS) 242
      1. \r\n
    449. AFRICA: MARKET ESTIMATES & FORECAST, BY CATEGORY IN APPLICATION, 2020–2030 (USD MILLION) 242
      1. \r\n
    450. AFRICA: MARKET ESTIMATES & FORECAST, BY CATEGORY IN APPLICATION, 2020–2030 (KILOTONS) 243
      1. \r\n
    451. AFRICA: MARKET ESTIMATES, BY END USER, 2020–2030 (USD MILLION) 243
      1. \r\n
    452. AFRICA: MARKET ESTIMATES, BY END USER, 2020–2030 (KILOTONS) 244
      1. \r\n
    453. AFRICA: MARKET ESTIMATES, BY DISTRIBUTION CHANNEL, 2020–2030 (USD MILLION) 244
      1. \r\n
    454. AFRICA: MARKET ESTIMATES, BY DISTRIBUTION CHANNEL, 2020–2030 (KILOTONS) 244
      1. \r\n
    455. PRODUCT LAUNCH 247
      1. \r\n
    456. ACQUISITION 247
      1. \r\n
    457. INVESTMENT 248
      1. \r\n
    458. EXPANSION 248
      1. \r\n
    459. MERGER 249
      1. \r\n
    460. AGREEMENT 249
      1. \r\n
    461. PARTNERSHIP 249
      1. \r\n
    462. TATE & LYLE: PRODUCTS OFFERED 252
      1. \r\n
    463. TATE & LYLE: KEY DEVELOPMENTS 252
      1. \r\n
    464. CARGILL INCORPORATED.: PRODUCTS OFFERED 255
      1. \r\n
    465. CARGILL INCORPORATED.: KEY DEVELOPMENTS 255
      1. \r\n
    466. INTERNATIONAL FLAVORS & FRAGRANCES INC.: PRODUCTS OFFERED 258
      1. \r\n
    467. INTERNATIONAL FLAVORS & FRAGRANCES INC.: KEY DEVELOPMENTS 259
      1. \r\n
    468. ARCHER-DANIELS-MIDLAND COMPANY (ADM): PRODUCTS OFFERED 263
      1. \r\n
    469. ARCHER-DANIELS-MIDLAND COMPANY (ADM): KEY DEVELOPMENTS 263
      1. \r\n
    470. INGREDION INCORPORATED: PRODUCTS OFFERED 266
      1. \r\n
    471. INGREDION INCORPORATED: KEY DEVELOPMENTS 267
      1. \r\n
    472. AJINOMOTO CO., INC.: PRODUCTS OFFERED 270
      1. \r\n
    473. AJINOMOTO CO., INC.: KEY DEVELOPMENTS 271
      1. \r\n
    474. HYET SWEET: PRODUCTS OFFERED 272
      1. \r\n
    475. HERMES SWEETENERS LTD: PRODUCTS OFFERED 274
      1. \r\n
    476. JK SUCRALOSE INC.: PRODUCTS OFFERED 276
      1. \r\n
    477. HEARTLAND FOOD PRODUCTS GROUP: PRODUCTS OFFERED 278
      1. \r\n
      2. \r\n
    478. LIST OF FIGURES
      1. \r\n
    479. MARKET SYNOPSIS 28
      1. \r\n
    480. GLOBAL HIGH-INTENSITY SWEETENERS MARKET ANALYSIS BY PRODUCT 29
      1. \r\n
    481. GLOBAL HIGH-INTENSITY SWEETENERS MARKET ANALYSIS BY FORM 30
      1. \r\n
    482. GLOBAL HIGH-INTENSITY SWEETENERS MARKET ANALYSIS BY CATEGORY 31
      1. \r\n
    483. GLOBAL HIGH-INTENSITY SWEETENERS MARKET ANALYSIS BY APPLICATION 32
      1. \r\n
    484. GLOBAL HIGH-INTENSITY SWEETENERS MARKET ANALYSIS BY END USER 33
      1. \r\n
    485. GLOBAL HIGH-INTENSITY SWEETENERS MARKET ANALYSIS BY DISTRIBUTION CHANNEL 34
      1. \r\n
    486. GLOBAL HIGH-INTENSITY SWEETENERS MARKET ANALYSIS BY REGION 35
      1. \r\n
    487. GLOBAL HIGH-INTENSITY SWEETENERS MARKET: STRUCTURE 37
      1. \r\n
    488. RESEARCH PROCESS 38
      1. \r\n
    489. TOP-DOWN & BOTTOM-UP APPROACHES 41
      1. \r\n
    490. MARKET DYNAMIC ANALYSIS OF THE GLOBAL HIGH-INTENSITY SWEETENERS MARKET 44
      1. \r\n
    491. VALUE CHAIN: GLOBAL HIGH-INTENSITY SWEETENERS MARKET 53
      1. \r\n
    492. GLOBAL HIGH-INTENSITY SWEETENERS FOOD MARKET: SUPPLY CHAIN ANALYSIS 56
      1. \r\n
    493. PORTER'S FIVE FORCES ANALYSIS OF THE GLOBAL HIGH-INTENSITY SWEETENERS MARKET 58
      1. \r\n
    494. GLOBAL HIGH-INTENSITY SWEETENERS DEMAND, BY REGION, 2020-2030 (KILOTONS) 64
      1. \r\n
    495. GLOBAL HIGH-INTENSITY SWEETENERS PRODUCTION ANALYSIS, BY REGION, 2021 65
      1. \r\n
    496. GLOBAL HIGH-INTENSITY SWEETENERS MARKET, BY PRODUCT, 2021 (% SHARE) 70
      1. \r\n
    497. GLOBAL HIGH-INTENSITY SWEETENERS MARKET, BY PRODUCT, 2020–2030 (USD MILLION) 70
      1. \r\n
    498. GLOBAL HIGH-INTENSITY SWEETENERS MARKET, BY FORM, 2021 (% SHARE) 80
      1. \r\n
    499. GLOBAL HIGH-INTENSITY SWEETENERS MARKET, BY FORM, 2020–2030 (USD MILLION) 80
      1. \r\n
    500. GLOBAL HIGH-INTENSITY SWEETENERS MARKET, BY CATEGORY, 2021 (% SHARE) 84
      1. \r\n
    501. GLOBAL HIGH-INTENSITY SWEETENERS MARKET, BY CATEGORY, 2020–2030 (USD MILLION) 84
      1. \r\n
    502. GLOBAL HIGH-INTENSITY SWEETENERS MARKET, BY APPLICATION, 2021 (% SHARE) 88
      1. \r\n
    503. GLOBAL HIGH-INTENSITY SWEETENERS MARKET, BY APPLICATION, 2020–2030 (USD MILLION) 88
      1. \r\n
    504. GLOBAL HIGH-INTENSITY SWEETENERS MARKET, BY END USER, 2021 (% SHARE) 98
      1. \r\n
    505. GLOBAL HIGH-INTENSITY SWEETENERS MARKET, BY END USER, 2020–2030 (USD MILLION) 98
      1. \r\n
    506. GLOBAL HIGH-INTENSITY SWEETENERS MARKET, BY DISTRIBUTION CHANNEL, 2021 (% SHARE) 101
      1. \r\n
    507. GLOBAL HIGH-INTENSITY SWEETENERS MARKET, BY DISTRIBUTION CHANNEL, 2020–2030 (USD MILLION) 102
      1. \r\n
    508. GLOBAL HIGH-INTENSITY SWEETENERS MARKET, BY REGION, 2021 (% SHARE) 109
      1. \r\n
    509. GLOBAL HIGH-INTENSITY SWEETENERS MARKET, BY REGION, 2020–2030 (USD MILLION) 109
      1. \r\n
    510. NORTH AMERICA: HIGH-INTENSITY SWEETENERS MARKET SHARE, BY COUNTRY, 2021 (% SHARE) 111
      1. \r\n
    511. EUROPE: HIGH-INTENSITY SWEETENERS MARKET SHARE, BY COUNTRY, 2021 (% SHARE) 133
      1. \r\n
    512. ASIA-PACIFIC: HIGH-INTENSITY SWEETENERS MARKET SHARE, BY COUNTRY, 2021 (% SHARE) 191
      1. \r\n
    513. REST OF THE WORLD: HIGH-INTENSITY SWEETENERS MARKET SHARE, BY COUNTRY, 2021 (% SHARE) 223
      1. \r\n
    514. TATE & LYLE: FINANCIAL OVERVIEW SNAPSHOT 251
      1. \r\n
    515. TATE & LYLE: SWOT ANALYSIS 253
      1. \r\n
    516. CARGILL INCORPORATED.: FINANCIAL OVERVIEW 255
      1. \r\n
    517. CARGILL INCORPORATED: SWOT ANALYSIS 256
      1. \r\n
    518. INTERNATIONAL FLAVORS & FRAGRANCES INC.: FINANCIAL OVERVIEW SNAPSHOT 258
      1. \r\n
    519. INTERNATIONAL FLAVORS & FRAGRANCES INC.: SWOT ANALYSIS 259
      1. \r\n
    520. ARCHER-DANIELS-MIDLAND COMPANY (ADM): FINANCIAL OVERVIEW SNAPSHOT 262
      1. \r\n
    521. ARCHER-DANIELS-MIDLAND COMPANY (ADM): SWOT ANALYSIS 264
      1. \r\n
    522. INGREDION INCORPORATED: FINANCIAL OVERVIEW SNAPSHOT 266
      1. \r\n
    523. INGREDION INCORPORATED: SWOT ANALYSIS 268
      1. \r\n
    524. AJINOMOTO CO., INC.: FINANCIAL OVERVIEW SNAPSHOT 270

    High-Intensity Sweeteners Market Segmentation

    High-Intensity Sweeteners Product Outlook (USD Million, 2019-2030)

    • Sucralose
    • Stevioside
    • Acesulfame K
    • Aspartame
    • Cyclamate
    • Glycyrrhizin
    • Saccharin
    • Others

    High-Intensity Sweeteners Form Outlook (USD Million, 2019-2030)

    • Dry
    • Liquid

    High-Intensity Sweeteners Category Outlook (USD Million, 2019-2030)

    • Artificial
    • Natural

    High-Intensity Sweeteners Application Outlook (USD Million, 2019-2030)

    • Bakery & Confectionery
    • Beverages
    • Dairy Products
    • Dietary Products
    • Pharmaceuticals
    • Tabletop Sweeteners
    • Processed Foods
    • Other

    High-Intensity Sweeteners End User Outlook (USD Million, 2019-2030)

    • Residential
    • Commercial

    High-Intensity Sweeteners Distribution Channel Outlook (USD Million, 2019-2030)

    • Supermarkets & Hypermarkets
    • Specialty Stores
    • Online
    • Others

    High-Intensity Sweeteners Regional Outlook (USD Million, 2019-2030)

    North America Outlook (USD Million, 2019-2030)

    • North America High-Intensity Sweeteners by Product
      • Sucralose
      • Stevioside
      • Acesulfame K
      • Aspartame
      • Cyclamate
      • Glycyrrhizin
      • Saccharin
      • Others
    • North America High-Intensity Sweeteners by Form
      • Dry
      • Liquid
    • North America High-Intensity Sweeteners by Category
      • Artificial
      • Natural
    • North America High-Intensity Sweeteners by Application
      • Bakery & Confectionery
      • Beverages
      • Dairy Products
      • Dietary Products
      • Pharmaceuticals
      • Tabletop Sweeteners
      • Processed Foods
      • Other
    • North America High-Intensity Sweeteners by End User
      • Residential
      • Commercial
    • North America High-Intensity Sweeteners by Distribution Channel
      • Supermarkets & Hypermarkets
      • Specialty Stores
      • Online
      • Others
    • US Outlook (USD Million, 2019-2030)
    • US High-Intensity Sweeteners by Product
      • Sucralose
      • Stevioside
      • Acesulfame K
      • Aspartame
      • Cyclamate
      • Glycyrrhizin
      • Saccharin
      • Others
    • US High-Intensity Sweeteners by Form
      • Dry
      • Liquid
    • US High-Intensity Sweeteners by Category
      • Artificial
      • Natural
    • US High-Intensity Sweeteners by Application
      • Bakery & Confectionery
      • Beverages
      • Dairy Products
      • Dietary Products
      • Pharmaceuticals
      • Tabletop Sweeteners
      • Processed Foods
      • Other
    • US High-Intensity Sweeteners by End User
      • Residential
      • Commercial
    • US High-Intensity Sweeteners by Distribution Channel
      • Supermarkets & Hypermarkets
      • Specialty Stores
      • Online
      • Others
    • Canada Outlook (USD Million, 2019-2030)
    • Canada High-Intensity Sweeteners by Product
      • Sucralose
      • Stevioside
      • Acesulfame K
      • Aspartame
      • Cyclamate
      • Glycyrrhizin
      • Saccharin
      • Others
    • Canada High-Intensity Sweeteners by Form
      • Dry
      • Liquid
    • Canada High-Intensity Sweeteners by Category
      • Artificial
      • Natural
    • Canada High-Intensity Sweeteners by Application
      • Bakery & Confectionery
      • Beverages
      • Dairy Products
      • Dietary Products
      • Pharmaceuticals
      • Tabletop Sweeteners
      • Processed Foods
      • Other
    • Canada High-Intensity Sweeteners by End User
      • Residential
      • Commercial
    • Canada High-Intensity Sweeteners by Distribution Channel
      • Supermarkets & Hypermarkets
      • Specialty Stores
      • Online
      • Others
    • Mexico Outlook (USD Million, 2019-2030)
    • Mexico High-Intensity Sweeteners by Product
      • Sucralose
      • Stevioside
      • Acesulfame K
      • Aspartame
      • Cyclamate
      • Glycyrrhizin
      • Saccharin
      • Others
    • Mexico High-Intensity Sweeteners by Form
      • Dry
      • Liquid
    • Mexico High-Intensity Sweeteners by Category
      • Artificial
      • Natural
    • Mexico High-Intensity Sweeteners by Application
      • Bakery & Confectionery
      • Beverages
      • Dairy Products
      • Dietary Products
      • Pharmaceuticals
      • Tabletop Sweeteners
      • Processed Foods
      • Other
    • Mexico High-Intensity Sweeteners by End User
      • Residential
      • Commercial
    • Mexico High-Intensity Sweeteners by Distribution Channel
      • Supermarkets & Hypermarkets
      • Specialty Stores
      • Online
      • Others

    Europe Outlook (USD Million, 2019-2030)

    • Europe High-Intensity Sweeteners by Product
      • Sucralose
      • Stevioside
      • Acesulfame K
      • Aspartame
      • Cyclamate
      • Glycyrrhizin
      • Saccharin
      • Others
    • Europe High-Intensity Sweeteners by Form
      • Dry
      • Liquid
    • Europe High-Intensity Sweeteners by Category
      • Artificial
      • Natural
    • Europe High-Intensity Sweeteners by Application
      • Bakery & Confectionery
      • Beverages
      • Dairy Products
      • Dietary Products
      • Pharmaceuticals
      • Tabletop Sweeteners
      • Processed Foods
      • Other
    • Europe High-Intensity Sweeteners by End User
      • Residential
      • Commercial
    • Europe High-Intensity Sweeteners by Distribution Channel
      • Supermarkets & Hypermarkets
      • Specialty Stores
      • Online
      • Others
    • Germany Outlook (USD Million, 2019-2030)
    • Germany High-Intensity Sweeteners by Product
      • Sucralose
      • Stevioside
      • Acesulfame K
      • Aspartame
      • Cyclamate
      • Glycyrrhizin
      • Saccharin
      • Others
    • Germany High-Intensity Sweeteners by Form
      • Dry
      • Liquid
    • Germany High-Intensity Sweeteners by Category
      • Artificial
      • Natural
    • Germany High-Intensity Sweeteners by Application
      • Bakery & Confectionery
      • Beverages
      • Dairy Products
      • Dietary Products
      • Pharmaceuticals
      • Tabletop Sweeteners
      • Processed Foods
      • Other
    • Germany High-Intensity Sweeteners by End User
      • Residential
      • Commercial
    • Germany High-Intensity Sweeteners by Distribution Channel
      • Supermarkets & Hypermarkets
      • Specialty Stores
      • Online
      • Others
    • Italy Outlook (USD Million, 2019-2030)
    • Italy High-Intensity Sweeteners by Product
      • Sucralose
      • Stevioside
      • Acesulfame K
      • Aspartame
      • Cyclamate
      • Glycyrrhizin
      • Saccharin
      • Others
    • Italy High-Intensity Sweeteners by Form
      • Dry
      • Liquid
    • Italy High-Intensity Sweeteners by Category
      • Artificial
      • Natural
    • Italy High-Intensity Sweeteners by Application
      • Bakery & Confectionery
      • Beverages
      • Dairy Products
      • Dietary Products
      • Pharmaceuticals
      • Tabletop Sweeteners
      • Processed Foods
      • Other
    • Italy High-Intensity Sweeteners by End User
      • Residential
      • Commercial
    • Italy High-Intensity Sweeteners by Distribution Channel
      • Supermarkets & Hypermarkets
      • Specialty Stores
      • Online
      • Others
    • Spain and Portugal Outlook (USD Million, 2019-2030)
    • Spain and Portugal High-Intensity Sweeteners by Product
      • Sucralose
      • Stevioside
      • Acesulfame K
      • Aspartame
      • Cyclamate
      • Glycyrrhizin
      • Saccharin
      • Others
    • Spain and Portugal High-Intensity Sweeteners by Form
      • Dry
      • Liquid
    • Spain and Portugal High-Intensity Sweeteners by Category
      • Artificial
      • Natural
    • Spain and Portugal High-Intensity Sweeteners by Application
      • Bakery & Confectionery
      • Beverages
      • Dairy Products
      • Dietary Products
      • Pharmaceuticals
      • Tabletop Sweeteners
      • Processed Foods
      • Other
    • Spain and Portugal High-Intensity Sweeteners by End User
      • Residential
      • Commercial
    • Spain and Portugal High-Intensity Sweeteners by Distribution Channel
      • Supermarkets & Hypermarkets
      • Specialty Stores
      • Online
      • Others
    • Austria and Switzerland Outlook (USD Million, 2019-2030)
    • Austria and Switzerland High-Intensity Sweeteners by Product
      • Sucralose
      • Stevioside
      • Acesulfame K
      • Aspartame
      • Cyclamate
      • Glycyrrhizin
      • Saccharin
      • Others
    • Austria and Switzerland High-Intensity Sweeteners by Form
      • Dry
      • Liquid
    • Austria and Switzerland High-Intensity Sweeteners by Category
      • Artificial
      • Natural
    • Austria and Switzerland High-Intensity Sweeteners by Application
      • Bakery & Confectionery
      • Beverages
      • Dairy Products
      • Dietary Products
      • Pharmaceuticals
      • Tabletop Sweeteners
      • Processed Foods
      • Other
    • Austria and Switzerland High-Intensity Sweeteners by End User
      • Residential
      • Commercial
    • Austria and Switzerland High-Intensity Sweeteners by Distribution Channel
      • Supermarkets & Hypermarkets
      • Specialty Stores
      • Online
      • Others
    • UK and Ireland Outlook (USD Million, 2019-2030)
    • UK & Ireland High-Intensity Sweeteners by Product
      • Sucralose
      • Stevioside
      • Acesulfame K
      • Aspartame
      • Cyclamate
      • Glycyrrhizin
      • Saccharin
      • Others
    • UK & Ireland High-Intensity Sweeteners by Form
      • Dry
      • Liquid
    • UK & Ireland High-Intensity Sweeteners by Category
      • Artificial
      • Natural
    • UK & Ireland High-Intensity Sweeteners by Application
      • Bakery & Confectionery
      • Beverages
      • Dairy Products
      • Dietary Products
      • Pharmaceuticals
      • Tabletop Sweeteners
      • Processed Foods
      • Other
    • UK & Ireland High-Intensity Sweeteners by End User
      • Residential
      • Commercial
    • UK & Ireland High-Intensity Sweeteners by Distribution Channel
      • Supermarkets & Hypermarkets
      • Specialty Stores
      • Online
      • Others
    • France Outlook (USD Million, 2019-2030)
    • France High-Intensity Sweeteners by Product
      • Sucralose
      • Stevioside
      • Acesulfame K
      • Aspartame
      • Cyclamate
      • Glycyrrhizin
      • Saccharin
      • Others
    • France High-Intensity Sweeteners by Form
      • Dry
      • Liquid
    • France High-Intensity Sweeteners by Category
      • Artificial
      • Natural
    • France High-Intensity Sweeteners by Application
      • Bakery & Confectionery
      • Beverages
      • Dairy Products
      • Dietary Products
      • Pharmaceuticals
      • Tabletop Sweeteners
      • Processed Foods
      • Other
    • France High-Intensity Sweeteners by End User
      • Residential
      • Commercial
    • France High-Intensity Sweeteners by Distribution Channel
      • Supermarkets & Hypermarkets
      • Specialty Stores
      • Online
      • Others
    • Benelux Outlook (USD Million, 2019-2030)
    • Benelux High-Intensity Sweeteners by Product
      • Sucralose
      • Stevioside
      • Acesulfame K
      • Aspartame
      • Cyclamate
      • Glycyrrhizin
      • Saccharin
      • Others
    • Benelux High-Intensity Sweeteners by Form
      • Dry
      • Liquid
    • Benelux High-Intensity Sweeteners by Category
      • Artificial
      • Natural
    • Benelux High-Intensity Sweeteners by Application
      • Bakery & Confectionery
      • Beverages
      • Dairy Products
      • Dietary Products
      • Pharmaceuticals
      • Tabletop Sweeteners
      • Processed Foods
      • Other
    • Benelux High-Intensity Sweeteners by End User
      • Residential
      • Commercial
    • Benelux High-Intensity Sweeteners by Distribution Channel
      • Supermarkets & Hypermarkets
      • Specialty Stores
      • Online
      • Others
    • Nordics Outlook (USD Million, 2019-2030)
    • Nordics High-Intensity Sweeteners by Product
      • Sucralose
      • Stevioside
      • Acesulfame K
      • Aspartame
      • Cyclamate
      • Glycyrrhizin
      • Saccharin
      • Others
    • Nordics High-Intensity Sweeteners by Form
      • Dry
      • Liquid
    • Nordics High-Intensity Sweeteners by Category
      • Artificial
      • Natural
    • Nordics High-Intensity Sweeteners by Application
      • Bakery & Confectionery
      • Beverages
      • Dairy Products
      • Dietary Products
      • Pharmaceuticals
      • Tabletop Sweeteners
      • Processed Foods
      • Other
    • Nordics High-Intensity Sweeteners by End User
      • Residential
      • Commercial
    • Nordics High-Intensity Sweeteners by Distribution Channel
      • Supermarkets & Hypermarkets
      • Specialty Stores
      • Online
      • Others
    • Central & Eastern Europe Outlook (USD Million, 2019-2030)
    • Central & Eastern Europe High-Intensity Sweeteners by Product
      • Sucralose
      • Stevioside
      • Acesulfame K
      • Aspartame
      • Cyclamate
      • Glycyrrhizin
      • Saccharin
      • Others
    • Central & Eastern Europe High-Intensity Sweeteners by Form
      • Dry
      • Liquid
    • Central & Eastern Europe High-Intensity Sweeteners by Category
      • Artificial
      • Natural
    • Central & Eastern Europe High-Intensity Sweeteners by Application
      • Bakery & Confectionery
      • Beverages
      • Dairy Products
      • Dietary Products
      • Pharmaceuticals
      • Tabletop Sweeteners
      • Processed Foods
      • Other
    • Central & Eastern Europe High-Intensity Sweeteners by End User
      • Residential
      • Commercial
    • Central & Eastern Europe High-Intensity Sweeteners by Distribution Channel
      • Supermarkets & Hypermarkets
      • Specialty Stores
      • Online
      • Others
    • Southern Europe Outlook (USD Million, 2019-2030)
    • Southern Europe High-Intensity Sweeteners by Product
      • Sucralose
      • Stevioside
      • Acesulfame K
      • Aspartame
      • Cyclamate
      • Glycyrrhizin
      • Saccharin
      • Others
    • Southern Europe High-Intensity Sweeteners by Form
      • Dry
      • Liquid
    • Southern Europe High-Intensity Sweeteners by Category
      • Artificial
      • Natural
    • Southern Europe High-Intensity Sweeteners by Application
      • Bakery & Confectionery
      • Beverages
      • Dairy Products
      • Dietary Products
      • Pharmaceuticals
      • Tabletop Sweeteners
      • Processed Foods
      • Other
    • Southern Europe High-Intensity Sweeteners by End User
      • Residential
      • Commercial
    • Southern Europe High-Intensity Sweeteners by Distribution Channel
      • Supermarkets & Hypermarkets
      • Specialty Stores
      • Online
      • Others

    Asia-Pacific Outlook (USD Million, 2019-2030)

    • Asia-Pacific High-Intensity Sweeteners by Product
      • Sucralose
      • Stevioside
      • Acesulfame K
      • Aspartame
      • Cyclamate
      • Glycyrrhizin
      • Saccharin
      • Others
    • Asia-Pacific High-Intensity Sweeteners by Form
      • Dry
      • Liquid
    • Asia-Pacific High-Intensity Sweeteners by Category
      • Artificial
      • Natural
    • Asia-Pacific High-Intensity Sweeteners by Application
      • Bakery & Confectionery
      • Beverages
      • Dairy Products
      • Dietary Products
      • Pharmaceuticals
      • Tabletop Sweeteners
      • Processed Foods
      • Other
    • Asia-Pacific High-Intensity Sweeteners by End User
      • Residential
      • Commercial
    • Asia-Pacific High-Intensity Sweeteners by Distribution Channel
      • Supermarkets & Hypermarkets
      • Specialty Stores
      • Online
      • Others
    • China Outlook (USD Million, 2019-2030)
    • China High-Intensity Sweeteners by Product
      • Sucralose
      • Stevioside
      • Acesulfame K
      • Aspartame
      • Cyclamate
      • Glycyrrhizin
      • Saccharin
      • Others
    • China High-Intensity Sweeteners by Form
      • Dry
      • Liquid
    • China High-Intensity Sweeteners by Category
      • Artificial
      • Natural
    • China High-Intensity Sweeteners by Application
      • Bakery & Confectionery
      • Beverages
      • Dairy Products
      • Dietary Products
      • Pharmaceuticals
      • Tabletop Sweeteners
      • Processed Foods
      • Other
    • China High-Intensity Sweeteners by End User
      • Residential
      • Commercial
    • China High-Intensity Sweeteners by Distribution Channel
      • Supermarkets & Hypermarkets
      • Specialty Stores
      • Online
      • Others
    • Japan Outlook (USD Million, 2019-2030)
    • Japan High-Intensity Sweeteners by Product
      • Sucralose
      • Stevioside
      • Acesulfame K
      • Aspartame
      • Cyclamate
      • Glycyrrhizin
      • Saccharin
      • Others
    • Japan High-Intensity Sweeteners by Form
      • Dry
      • Liquid
    • Japan High-Intensity Sweeteners by Category
      • Artificial
      • Natural
    • Japan High-Intensity Sweeteners by Application
      • Bakery & Confectionery
      • Beverages
      • Dairy Products
      • Dietary Products
      • Pharmaceuticals
      • Tabletop Sweeteners
      • Processed Foods
      • Other
    • Japan High-Intensity Sweeteners by End User
      • Residential
      • Commercial
    • Japan High-Intensity Sweeteners by Distribution Channel
      • Supermarkets & Hypermarkets
      • Specialty Stores
      • Online
      • Others
    • India Outlook (USD Million, 2019-2030)
    • India High-Intensity Sweeteners by Product
      • Sucralose
      • Stevioside
      • Acesulfame K
      • Aspartame
      • Cyclamate
      • Glycyrrhizin
      • Saccharin
      • Others
    • India High-Intensity Sweeteners by Form
      • Dry
      • Liquid
    • India High-Intensity Sweeteners by Category
      • Artificial
      • Natural
    • India High-Intensity Sweeteners by Application
      • Bakery & Confectionery
      • Beverages
      • Dairy Products
      • Dietary Products
      • Pharmaceuticals
      • Tabletop Sweeteners
      • Processed Foods
      • Other
    • India High-Intensity Sweeteners by End User
      • Residential
      • Commercial
    • India High-Intensity Sweeteners by Distribution Channel
      • Supermarkets & Hypermarkets
      • Specialty Stores
      • Online
      • Others
    • Australia & New Zealand Outlook (USD Million, 2019-2030)
    • Australia & New Zealand High-Intensity Sweeteners by Product
      • Sucralose
      • Stevioside
      • Acesulfame K
      • Aspartame
      • Cyclamate
      • Glycyrrhizin
      • Saccharin
      • Others
    • Australia & New Zealand High-Intensity Sweeteners by Form
      • Dry
      • Liquid
    • Australia & New Zealand High-Intensity Sweeteners by Category
      • Artificial
      • Natural
    • Australia & New Zealand High-Intensity Sweeteners by Application
      • Bakery & Confectionery
      • Beverages
      • Dairy Products
      • Dietary Products
      • Pharmaceuticals
      • Tabletop Sweeteners
      • Processed Foods
      • Other
    • Australia & New Zealand High-Intensity Sweeteners by End User
      • Residential
      • Commercial
    • Australia & New Zealand High-Intensity Sweeteners by Distribution Channel
      • Supermarkets & Hypermarkets
      • Specialty Stores
      • Online
      • Others
    • Rest of Asia-Pacific Outlook (USD Million, 2019-2030)
    • Rest of Asia-Pacific High-Intensity Sweeteners by Product
      • Sucralose
      • Stevioside
      • Acesulfame K
      • Aspartame
      • Cyclamate
      • Glycyrrhizin
      • Saccharin
      • Others
    • Rest of Asia-Pacific High-Intensity Sweeteners by Form
      • Dry
      • Liquid
    • Rest of Asia-Pacific High-Intensity Sweeteners by Category
      • Artificial
      • Natural
    • Rest of Asia-Pacific High-Intensity Sweeteners by Application
      • Bakery & Confectionery
      • Beverages
      • Dairy Products
      • Dietary Products
      • Pharmaceuticals
      • Tabletop Sweeteners
      • Processed Foods
      • Other
    • Rest of Asia-Pacific High-Intensity Sweeteners by End User
      • Residential
      • Commercial
    • Rest of Asia-Pacific High-Intensity Sweeteners by Distribution Channel
      • Supermarkets & Hypermarkets
      • Specialty Stores
      • Online
      • Others

    Rest of the World Outlook (USD Million, 2019-2030)

    Rest of the World High-Intensity Sweeteners by Product

    • Sucralose
    • Stevioside
    • Acesulfame K
    • Aspartame
    • Cyclamate
    • Glycyrrhizin
    • Saccharin
    • Others

    Rest of the World High-Intensity Sweeteners by Form

    • Dry
    • Liquid
    Rest of the World High-Intensity Sweeteners by Category
    • Artificial
    • Natural
    Rest of the World High-Intensity Sweeteners by Application
    • Bakery & Confectionery
    • Beverages
    • Dairy Products
    • Dietary Products
    • Pharmaceuticals
    • Tabletop Sweeteners
    • Processed Foods
    • Other
    Rest of the World High-Intensity Sweeteners by End User
    • Residential
    • Commercial
    Rest of the World High-Intensity Sweeteners by Distribution Channel
    • Supermarkets & Hypermarkets
    • Specialty Stores
    • Online
    • Others

    South America Outlook (USD Million, 2019-2030)

    South America High-Intensity Sweeteners by Product

    • Sucralose
    • Stevioside
    • Acesulfame K
    • Aspartame
    • Cyclamate
    • Glycyrrhizin
    • Saccharin
    • Others

    South America High-Intensity Sweeteners by Form

    • Dry
    • Liquid
    South America High-Intensity Sweeteners by Category
    • Artificial
    • Natural
    South America High-Intensity Sweeteners by Application
    • Bakery & Confectionery
    • Beverages
    • Dairy Products
    • Dietary Products
    • Pharmaceuticals
    • Tabletop Sweeteners
    • Processed Foods
    • Other
    South America High-Intensity Sweeteners by End User
    • Residential
    • Commercial
    South America High-Intensity Sweeteners by Distribution Channel
    • Supermarkets & Hypermarkets
    • Specialty Stores
    • Online
    • Others

    Middle East Outlook (USD Million, 2019-2030)

    Middle East High-Intensity Sweeteners by Product

    • Sucralose
    • Stevioside
    • Acesulfame K
    • Aspartame
    • Cyclamate
    • Glycyrrhizin
    • Saccharin
    • Others

    Middle East High-Intensity Sweeteners by Form

    • Dry
    • Liquid
    Middle East High-Intensity Sweeteners by Category
    • Artificial
    • Natural
    Middle East High-Intensity Sweeteners by Application
    • Bakery & Confectionery
    • Beverages
    • Dairy Products
    • Dietary Products
    • Pharmaceuticals
    • Tabletop Sweeteners
    • Processed Foods
    • Other
    Middle East High-Intensity Sweeteners by End User
    • Residential
    • Commercial
    Middle East High-Intensity Sweeteners by Distribution Channel
    • Supermarkets & Hypermarkets
    • Specialty Stores
    • Online
    • Others

    Africa Outlook (USD Million, 2019-2030)

    Africa High-Intensity Sweeteners by Product

    • Sucralose
    • Stevioside
    • Acesulfame K
    • Aspartame
    • Cyclamate
    • Glycyrrhizin
    • Saccharin
    • Others

    Africa High-Intensity Sweeteners by Form

    • Dry
    • Liquid
    Africa High-Intensity Sweeteners by Category
    • Artificial
    • Natural
    Africa High-Intensity Sweeteners by Application
    • Bakery & Confectionery
    • Beverages
    • Dairy Products
    • Dietary Products
    • Pharmaceuticals
    • Tabletop Sweeteners
    • Processed Foods
    • Other
    Africa High-Intensity Sweeteners by End User
    • Residential
    • Commercial
    Africa High-Intensity Sweeteners by Distribution Channel

    Supermarkets & Hypermarkets

    Specialty Stores

    Online

    Others

    Infographic

    Free Sample Request

    Kindly complete the form below to receive a free sample of this Report

    Get Free Sample

    Customer Strories

    “I am very pleased with how market segments have been defined in a relevant way for my purposes (such as "Portable Freezers & refrigerators" and "last-mile"). In general the report is well structured. Thanks very much for your efforts.”

    Victoria Milne

    Founder
    Case Study
    Chemicals and Materials

    Compare Licence

    ×
    Features License Type
    Single User Multiuser License Enterprise User
    Price $4,950 $5,950 $7,250
    Maximum User Access Limit 1 User Upto 10 Users Unrestricted Access Throughout the Organization
    Free Customization
    Direct Access to Analyst
    Deliverable Format
    Platform Access
    Discount on Next Purchase 10% 15% 15%
    Printable Versions