• Cat-intel
  • MedIntelliX
  • Resources
  • About Us
  • Request Free Sample ×

    Kindly complete the form below to receive a free sample of this Report

    Leading companies partner with us for data-driven Insights

    clients tt-cursor
    Hero Background

    Graphing Calculator Market

    ID: MRFR/SEM/38401-HCR
    128 Pages
    Aarti Dhapte
    October 2025

    Graphing Calculator Market Research Report By Application (Education, Engineering, Finance, Scientific Research), By End Use (Schools, Colleges, Universities, Corporate), By Type (Traditional Graphing Calculators, Smart Graphing Calculators, Online Graphing Calculators), By Distribution Channel (Online Retail, Specialty Stores, Department Stores) and By Regional (North America, Europe, South America, Asia Pacific, Middle East and Africa) - Forecast to 2035

    Share:
    Download PDF ×

    We do not share your information with anyone. However, we may send you emails based on your report interest from time to time. You may contact us at any time to opt-out.

    Graphing Calculator Market Infographic
    Purchase Options

    Graphing Calculator Market Summary

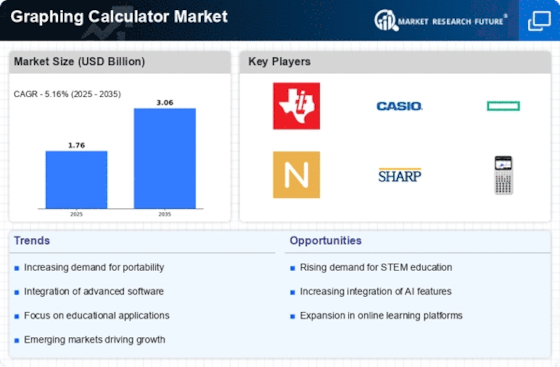
    As per MRFR analysis, the Graphing Calculator Market Size was estimated at 1.756 USD Billion in 2024. The Graphing Calculator industry is projected to grow from 1.847 in 2025 to 3.055 by 2035, exhibiting a compound annual growth rate (CAGR) of 5.16 during the forecast period 2025 - 2035.

    Key Market Trends & Highlights

    The Graphing Calculator Market is experiencing a dynamic shift driven by technological advancements and educational demands.

    • Technological integration is reshaping the functionality of graphing calculators, enhancing their capabilities for users.
    • Mobile compatibility is becoming increasingly essential, allowing for greater accessibility and convenience in various educational settings.
    • User experience is a focal point, with manufacturers prioritizing intuitive designs to cater to diverse user needs.
    • Rising demand for STEM education and technological advancements in graphing calculators are key drivers propelling growth in North America and Asia-Pacific, particularly within the education and engineering segments.

    Market Size & Forecast

    2024 Market Size 1.756 (USD Billion)
    2035 Market Size 3.055 (USD Billion)
    CAGR (2025 - 2035) 5.16%

    Major Players

    Texas Instruments (US), Casio (JP), Hewlett-Packard (US), NumWorks (FR), Sharp (JP), Graphing Calculator Company (US), Emerson (US), Wolfram Research (US)

    Graphing Calculator Market Trends

    The Graphing Calculator Market is currently experiencing a dynamic evolution, driven by advancements in technology and the increasing integration of digital tools in educational settings. As educational institutions emphasize the importance of STEM (Science, Technology, Engineering, and Mathematics) education, the demand for graphing calculators appears to be on the rise. These devices are not only utilized in classrooms but also in various professional fields, suggesting a broadening of their application beyond traditional academic use. Furthermore, the growing trend of remote learning and online education platforms may influence the market, as students seek versatile tools that can enhance their learning experience. In addition, the Graphing Calculator Market seems to be influenced by the ongoing development of software applications that complement these devices. The integration of mobile applications and cloud-based solutions indicates a shift towards more interactive and user-friendly experiences. This trend may lead to increased competition among manufacturers, as they strive to offer innovative features that cater to the evolving needs of users. Overall, the Graphing Calculator Market is poised for growth, with potential opportunities arising from technological advancements and changing educational paradigms.

    Technological Integration

    The Graphing Calculator Market is witnessing a trend towards the integration of advanced technologies, such as artificial intelligence and machine learning. These innovations enhance the functionality of graphing calculators, allowing for more complex calculations and data analysis. As educational institutions adopt these technologies, the demand for sophisticated devices is likely to increase.

    Mobile Compatibility

    There is a growing emphasis on mobile compatibility within the Graphing Calculator Market. Many users prefer devices that can seamlessly connect with smartphones and tablets, enabling them to access additional resources and applications. This trend suggests that manufacturers may focus on developing graphing calculators that offer enhanced connectivity features.

    Focus on User Experience

    The Graphing Calculator Market is increasingly prioritizing user experience, with manufacturers striving to create intuitive interfaces and engaging designs. This focus on usability may attract a broader audience, including younger students and professionals who seek efficient tools for their mathematical needs.

    The increasing integration of technology in education suggests a rising demand for advanced graphing calculators that facilitate interactive learning experiences.

    U.S. Department of Education

    Graphing Calculator Market Drivers

    Competitive Pricing Strategies

    Competitive pricing strategies adopted by manufacturers are playing a crucial role in shaping the Graphing Calculator Market. As the market becomes more saturated with various brands and models, companies are increasingly focusing on pricing to attract consumers. This trend is particularly evident among educational institutions that often operate under budget constraints. By offering affordable yet feature-rich graphing calculators, manufacturers can capture a larger share of the market. Additionally, promotional campaigns and discounts during back-to-school seasons are likely to further stimulate sales. Market data suggests that price sensitivity among consumers is high, especially in the education sector, indicating that effective pricing strategies could significantly influence purchasing decisions and overall market dynamics.

    Rising Demand for STEM Education

    The increasing emphasis on STEM education across various educational institutions appears to be a primary driver for the Graphing Calculator Market. As schools and universities integrate advanced mathematics and science curricula, the necessity for tools that facilitate complex calculations and graphing becomes evident. Reports indicate that the market for educational technology, including graphing calculators, is projected to grow at a compound annual growth rate of approximately 6.5% over the next few years. This trend suggests that educational institutions are investing more in resources that enhance learning outcomes, thereby boosting the demand for graphing calculators. Furthermore, as students prepare for standardized tests that require the use of such calculators, the market is likely to see sustained growth.

    Growing Emphasis on Data Visualization

    The growing emphasis on data visualization in both educational and professional settings is likely to drive the Graphing Calculator Market. As data analysis becomes increasingly critical in various fields, the ability to visualize complex data sets through graphing calculators is becoming more valued. Educational institutions are recognizing the importance of teaching students how to interpret and present data effectively, which in turn boosts the demand for graphing calculators equipped with advanced graphing capabilities. Market analysis indicates that sectors such as finance, engineering, and scientific research are increasingly relying on data visualization tools, suggesting a potential increase in the adoption of graphing calculators in these areas. This trend may lead to a broader acceptance and utilization of graphing calculators beyond traditional educational settings.

    Increased Adoption of Online Learning Platforms

    The rise of online learning platforms has emerged as a notable driver for the Graphing Calculator Market. As educational institutions and learners increasingly turn to digital platforms for instruction, the demand for tools that facilitate remote learning has surged. Graphing calculators, which are essential for subjects such as calculus and statistics, are being integrated into these platforms to enhance the learning experience. Data suggests that the online education market is expected to reach a valuation of over 300 billion dollars by 2025, indicating a substantial opportunity for graphing calculator manufacturers to align their products with the needs of online learners. This trend may lead to innovative partnerships between educational technology companies and graphing calculator producers, further propelling market growth.

    Technological Advancements in Graphing Calculators

    Technological advancements in the design and functionality of graphing calculators are significantly influencing the Graphing Calculator Market. Manufacturers are increasingly incorporating features such as touch screens, programmable functions, and connectivity options that allow for integration with other devices. These innovations not only enhance user experience but also expand the capabilities of graphing calculators, making them indispensable tools for students and professionals alike. The introduction of software that allows for real-time data analysis and visualization is particularly noteworthy. As a result, the market is witnessing a shift towards more sophisticated models that cater to the evolving needs of users, potentially leading to an increase in sales and market penetration.

    Market Segment Insights

    By Application: Education (Largest) vs. Engineering (Fastest-Growing)

    The Graphing Calculator Market exhibits a diverse application segmentation, with Education leading in market share. Educational institutions widely adopt graphing calculators as essential tools for teaching complex mathematical concepts, ensuring this segment remains dominant. Following Education, the Engineering application is rapidly gaining traction due to its growing integration in engineering courses and fields. This rise is fueled by the increasing insistence on advanced technological tools in academic settings, making educational institutions prioritize graphing calculators for enhancing students' learning experiences. In recent years, the Engineering application segment has witnessed the fastest growth rate. As the demand for STEM education rises, more engineering programs are incorporating graphing calculators into their curricula. This trend is driven by a need for sophisticated calculators that can handle complex calculations and graphic representations. Consequently, manufacturers are innovating features tailored to engineers, further propelling growth in this segment.

    Education: Dominant vs. Engineering: Emerging

    The Education segment remains the cornerstone of the Graphing Calculator Market, characterized by its significant adoption across various educational levels. Schools and colleges utilize graphing calculators extensively to facilitate learning in mathematics and science subjects. This segment's dominance is attributed to the essential role these calculators play in helping students visualize mathematical functions and solve complex problems. Meanwhile, the Engineering segment, while still emerging, holds substantial promise as it evolves to meet the sophisticated needs of engineering disciplines. This segment focuses on innovative functionalities, allowing users to perform advanced calculations and simulations crucial for engineering applications. As academic institutions continue to emphasize practical skills, both segments are poised for prominent growth, although Education currently leads in market share.

    By End Use: Schools (Largest) vs. Colleges (Fastest-Growing)

    The Graphing Calculator Market exhibits a varied distribution across different end-use segments. Schools currently represent the largest market share, driven primarily by the considerable demand for these devices in educational settings. With institutions increasingly integrating technology into the curriculum, schools are investing in graphing calculators that enhance students' learning experiences in mathematics and science. Conversely, colleges are emerging as a fast-growing segment within the market, reflecting the rising enrollment numbers and the growing emphasis on STEM education.

    Schools: Dominant vs. Colleges: Emerging

    Schools are the dominant end-use segment in the Graphing Calculator Market, reflecting their extensive use in K-12 education where standardized testing often requires advanced calculation tools. These institutions are prioritizing technological advancements to keep pace with educational standards, leading to steady purchases of graphing calculators for students. On the other hand, colleges represent the emerging segment, actively adopting graphing calculators as part of their teaching methodologies. As academic curricula become more sophisticated and focused on analytical skills, the demand from colleges is surging, indicating a pivotal shift towards modern education and an opportunity for growth in this segment.

    By Type: Traditional Graphing Calculators (Largest) vs. Smart Graphing Calculators (Fastest-Growing)

    In the Graphing Calculator Market, Traditional Graphing Calculators hold the largest share, primarily favored by educational institutions for their reliability and straightforward functionality. This segment continues to cater to a wide audience, including high school and college students who prioritize ease of use and familiar interfaces compared to newer technologies. Conversely, Smart Graphing Calculators are rapidly gaining attraction, driven by their advanced features such as connectivity, enhanced computational abilities, and user-friendly interfaces that appeal to tech-savvy learners.

    Traditional Graphing Calculators (Dominant) vs. Smart Graphing Calculators (Emerging)

    Traditional Graphing Calculators have established themselves as the dominant choice in the educational sector due to their proven effectiveness and adherence to traditional math curricula. Despite the emergence of Smart Graphing Calculators, this segment remains significant, reflecting a robust base of loyal users. On the other hand, Smart Graphing Calculators represent an emerging trend characterized by their integration of advanced technology, including app functionalities and real-time data sharing capabilities. This adaptability makes them particularly appealing for higher education and professional uses, as they align with the evolving needs of today's learners who seek more interactive and versatile learning tools.

    By Distribution Channel: Online Retail (Largest) vs. Specialty Stores (Fastest-Growing)

    In the Graphing Calculator Market, distribution channels play a crucial role in reaching varied customer segments. Online Retail currently holds the largest market share, benefiting from the convenience of e-commerce and the increasing trend of online shopping. Meanwhile, Specialty Stores, while smaller in share, are witnessing rapid growth due to their focused offerings and personalized customer service, catering specifically to educators and students. The growth in Specialty Stores is driven by the rising endorsement of educational institutions for in-person sales experiences. As students and professionals prefer to test and comprehend devices before purchase, these stores are evolving into essential distribution points, capitalizing on expert staff assistance and product demonstrations. This trend indicates that while online retail dominates, specialty outlets are quickly becoming essential in this market landscape.

    Online Retail: Dominant vs. Specialty Stores: Emerging

    Online Retail remains the dominant force in the Graphing Calculator Market, capitalizing on the growing trend of e-commerce, where customers appreciate the convenience of 24/7 shopping and home delivery. Retailers in this space often offer competitive pricing, diverse selection, and extensive product information which attract a broad audience. In contrast, Specialty Stores are emerging as significant players, providing tailored services, demonstrations, and expert guidance, particularly appealing to students and educators. This personal touch addresses the needs of buyers who seek more than just transactions and value insightful help when choosing complex products like graphing calculators, ultimately fostering brand loyalty within the niche.

    Get more detailed insights about Graphing Calculator Market

    Regional Insights

    North America : Innovation and Education Hub

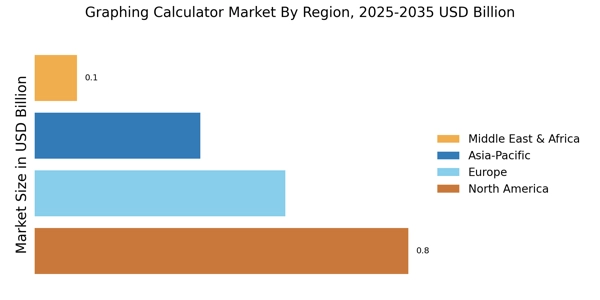
    North America is the largest market for graphing calculators, holding approximately 45% of the global share. The region's growth is driven by the increasing adoption of technology in education, particularly in STEM fields. Regulatory support for educational technology and initiatives to enhance digital learning environments further catalyze demand. The U.S. and Canada are the primary contributors to this market, with a strong emphasis on integrating advanced calculators into curricula. The competitive landscape in North America is dominated by key players such as Texas Instruments and Hewlett-Packard, which are renowned for their innovative products. The presence of educational institutions that prioritize technology in learning creates a robust market for graphing calculators. Additionally, companies like NumWorks and Graphing Calculator Company are emerging, offering unique features that cater to modern educational needs.

    Europe : Emerging Market with Growth Potential

    Europe is witnessing a growing demand for graphing calculators, holding around 30% of the global market share. The region's growth is fueled by educational reforms that emphasize technology integration in classrooms. Countries like Germany and France are leading this trend, supported by government initiatives aimed at enhancing digital literacy among students. The European Union's focus on educational technology further propels market expansion, creating a favorable regulatory environment. Leading countries in Europe include Germany, France, and the UK, where major players like Casio and NumWorks are actively competing. The competitive landscape is characterized by innovation, with companies investing in research and development to meet the evolving needs of educators and students. The presence of diverse educational systems across Europe also encourages tailored solutions, enhancing market opportunities.

    Asia-Pacific : Rapid Growth and Adoption

    Asia-Pacific is rapidly emerging as a significant market for graphing calculators, accounting for approximately 20% of the global share. The region's growth is driven by increasing educational investments and a rising emphasis on STEM education. Countries like China and India are at the forefront, with government initiatives promoting technology in education. The demand for graphing calculators is further supported by the growing middle class and their willingness to invest in educational tools for their children. In Asia-Pacific, the competitive landscape is diverse, with key players like Sharp and Casio leading the market. The presence of local manufacturers is also notable, as they offer cost-effective solutions tailored to regional needs. The increasing collaboration between educational institutions and technology providers is fostering innovation, making this region a dynamic player in The Graphing Calculator.

    Middle East and Africa : Untapped Market with Potential

    The Middle East and Africa region is gradually emerging in the graphing calculator market, holding about 5% of the global share. The growth is primarily driven by increasing investments in education and a rising awareness of the importance of technology in learning. Countries like South Africa and the UAE are leading this trend, with government initiatives aimed at enhancing educational resources and technology access for students. The region's potential is significant, as more schools adopt digital tools to improve learning outcomes. The competitive landscape in this region is still developing, with a mix of international and local players. Companies like Texas Instruments and local distributors are working to increase market penetration. The presence of educational reforms and a growing emphasis on STEM education are expected to drive demand for graphing calculators, making this an attractive market for future investments.

    Key Players and Competitive Insights

    The Graphing Calculator Market is currently characterized by a dynamic competitive landscape, driven by technological advancements and an increasing demand for educational tools that facilitate complex mathematical computations. Key players such as Texas Instruments (US), Casio (JP), and NumWorks (FR) are at the forefront, each adopting distinct strategies to enhance their market positioning. Texas Instruments (US) continues to focus on innovation, particularly in integrating advanced software capabilities into their calculators, thereby appealing to both educational institutions and individual users. Meanwhile, Casio (JP) emphasizes regional expansion, particularly in Asia, where they are enhancing their distribution networks to capture a larger share of the growing student population. NumWorks (FR), on the other hand, is leveraging partnerships with educational platforms to promote their user-friendly graphing calculators, which are designed to simplify learning and engagement in mathematics.

    In terms of business tactics, companies are increasingly localizing manufacturing to reduce costs and improve supply chain efficiency. This trend is particularly evident in the operations of Hewlett-Packard (US), which has optimized its supply chain by establishing production facilities closer to key markets. The competitive structure of the market appears moderately fragmented, with several players vying for market share, yet the influence of major companies remains substantial, shaping pricing strategies and product offerings across the board.

    In August 2025, Texas Instruments (US) announced a collaboration with leading educational institutions to develop a new line of graphing calculators that incorporate artificial intelligence features. This strategic move is likely to enhance the learning experience by providing personalized feedback to students, thereby positioning Texas Instruments as a leader in educational technology. The integration of AI into their products may not only attract new customers but also reinforce their existing user base, as educators increasingly seek tools that can adapt to diverse learning styles.

    In September 2025, Casio (JP) launched a new series of graphing calculators specifically designed for the Asian market, featuring localized content and language support. This initiative underscores Casio's commitment to catering to regional needs and preferences, potentially increasing their market penetration in a highly competitive environment. By aligning their product offerings with local educational standards, Casio may enhance its appeal among students and educators alike, thereby solidifying its market position.

    In October 2025, NumWorks (FR) unveiled a partnership with a prominent online learning platform to provide integrated solutions that combine their graphing calculators with digital learning resources. This collaboration is indicative of a broader trend towards digitalization in education, where traditional tools are increasingly being integrated with online platforms. Such strategic alliances may not only enhance the functionality of NumWorks' products but also expand their reach within the educational sector, positioning them favorably against competitors.

    As of October 2025, the Graphing Calculator Market is witnessing significant trends towards digitalization, sustainability, and the integration of artificial intelligence. These trends are reshaping competitive dynamics, as companies increasingly seek to differentiate themselves through innovative product offerings rather than solely competing on price. Strategic alliances are becoming more prevalent, enabling companies to leverage complementary strengths and enhance their market presence. Looking ahead, it appears that competitive differentiation will increasingly hinge on technological advancements, user experience, and the reliability of supply chains, marking a shift towards a more innovation-driven market landscape.

    Key Companies in the Graphing Calculator Market market include

    Industry Developments

    Recent developments in the Graphing Calculator Market have centered around technological advancements and educational integration, particularly with companies like Texas Instruments and Casio enhancing their product lines. Key innovations include improved user interfaces and functionality aimed at simplifying complex calculations for students. Furthermore, the rise of software-based graphing calculators, such as those offered by Desmos and Wolfram Research, reflects a growing trend toward digital solutions in educational environments. Current affairs indicate a notable focus on sustainability and eco-friendliness, with several companies exploring energy-efficient components for their calculators.

    In terms of market dynamics, Texas Instruments has maintained a significant portion of the market share, while newcomers like NumWorks are becoming increasingly competitive by targeting tech-savvy students with customizable experiences. In the realm of mergers and acquisitions, there have been no recent notable deals involving key players such as Hewlett-Packard or Embarcadero Technologies that have been publicly reported. This stability among established entities contrasts with the influx of startups, contributing to a diverse and evolving market landscape. Overall, growth trajectories for companies in this sector underscore the pivotal role of educational technology in shaping future learning methodologies.

    .webp

    Future Outlook

    Graphing Calculator Market Future Outlook

    The Graphing Calculator Market is projected to grow at a 5.16% CAGR from 2024 to 2035, driven by technological advancements, educational demand, and increased adoption in STEM fields.

    New opportunities lie in:

    • Develop cloud-based graphing calculator applications for remote learning environments.
    • Create specialized calculators for advanced STEM courses and professional certifications.
    • Implement subscription models for software updates and premium features in graphing calculators.

    By 2035, the market is expected to achieve robust growth, reflecting evolving educational needs and technological integration.

    Market Segmentation

    Graphing Calculator Market Type Outlook

    • Traditional Graphing Calculators
    • Smart Graphing Calculators
    • Online Graphing Calculators

    Graphing Calculator Market End Use Outlook

    • Schools
    • Colleges
    • Universities
    • Corporate

    Graphing Calculator Market Application Outlook

    • Education
    • Engineering
    • Finance
    • Scientific Research

    Graphing Calculator Market Distribution Channel Outlook

    • Online Retail
    • Specialty Stores
    • Department Stores

    Report Scope

    MARKET SIZE 20241.756(USD Billion)
    MARKET SIZE 20251.847(USD Billion)
    MARKET SIZE 20353.055(USD Billion)
    COMPOUND ANNUAL GROWTH RATE (CAGR)5.16% (2024 - 2035)
    REPORT COVERAGERevenue Forecast, Competitive Landscape, Growth Factors, and Trends
    BASE YEAR2024
    Market Forecast Period2025 - 2035
    Historical Data2019 - 2024
    Market Forecast UnitsUSD Billion
    Key Companies ProfiledMarket analysis in progress
    Segments CoveredMarket segmentation analysis in progress
    Key Market OpportunitiesIntegration of advanced software features enhances user experience in the Graphing Calculator Market.
    Key Market DynamicsTechnological advancements and evolving educational standards drive demand for innovative graphing calculators in diverse learning environments.
    Countries CoveredNorth America, Europe, APAC, South America, MEA

    Leave a Comment

    FAQs

    What is the projected market valuation of the Graphing Calculator Market by 2035?

    The Graphing Calculator Market is projected to reach a valuation of 3.055 USD Billion by 2035.

    What was the market valuation of the Graphing Calculator Market in 2024?

    In 2024, the Graphing Calculator Market was valued at 1.756 USD Billion.

    What is the expected CAGR for the Graphing Calculator Market during the forecast period 2025 - 2035?

    The expected CAGR for the Graphing Calculator Market during the forecast period 2025 - 2035 is 5.16%.

    Which companies are considered key players in the Graphing Calculator Market?

    Key players in the Graphing Calculator Market include Texas Instruments, Casio, Hewlett-Packard, NumWorks, Sharp, Graphing Calculator Company, Emerson, and Wolfram Research.

    What are the main application segments of the Graphing Calculator Market?

    The main application segments include Education, Engineering, Finance, and Scientific Research.

    How did the Education segment perform in terms of market valuation from 2024 to 2035?

    The Education segment's market valuation increased from 0.8 USD Billion in 2024 to a projected 1.3 USD Billion by 2035.

    What is the market valuation for Smart Graphing Calculators in 2024?

    In 2024, the market valuation for Smart Graphing Calculators was 0.703 USD Billion.

    What distribution channels are utilized in the Graphing Calculator Market?

    Distribution channels in the Graphing Calculator Market include Online Retail, Specialty Stores, and Department Stores.

    What is the projected market size for Online Graphing Calculators by 2035?

    The market size for Online Graphing Calculators is projected to reach 0.745 USD Billion by 2035.

    How does the market valuation for Corporate end-use compare to other segments in 2024?

    In 2024, the market valuation for Corporate end-use was 0.211 USD Billion, which is lower compared to Schools, Colleges, and Universities.

    Download Free Sample

    Kindly complete the form below to receive a free sample of this Report

    Case Study
    Chemicals and Materials

    Compare Licence

    ×
    Features License Type
    Single User Multiuser License Enterprise User
    Price $4,950 $5,950 $7,250
    Maximum User Access Limit 1 User Upto 10 Users Unrestricted Access Throughout the Organization
    Free Customization
    Direct Access to Analyst
    Deliverable Format
    Platform Access
    Discount on Next Purchase 10% 15% 15%
    Printable Versions