• Cat-intel
  • MedIntelliX
  • Resources
  • About Us
  • Hero Background
    English
    Chinese
    French
    Japanese
    Korean
    German
    Spanish

    Global Breast cancer Market Trends

    ID: MRFR/HC/0870-HCR
    200 Pages
    Rahul Gotadki
    October 2025

    Breast Cancer Market Research Report By Type of Treatment (Chemotherapy, Radiation Therapy, Targeted Therapy, Immunotherapy, Hormonal Therapy), By Disease Stage (Stage 0, Stage I, Stage II, Stage III, Stage IV), By End-User (Hospitals, Outpatient Clinics, Homecare Settings, Research Institutes), By Drug Class (Taxanes, Anthracyclines, Hormonal Agents, Monoclonal Antibodies) and By Regional (Nor...

    Share:
    Download PDF ×

    We do not share your information with anyone. However, we may send you emails based on your report interest from time to time. You may contact us at any time to opt-out.

    Global Breast cancer Market Infographic
    $ 4,950.0
    $ 5,950.0
    $ 7,250.0

    Market Trends

    Introduction

    The breast cancer market is experiencing a major change as we enter the year 2024, driven by a number of macro-economic factors. The technological developments in the field of precision medicine and immunotherapy are reshaping the treatment models, enabling more effective and individualised therapies. At the same time, the regulatory pressures are increasing, and the regulatory authorities are pushing for faster approval of new therapies, thus accelerating the introduction of new treatments. The consumers’ behaviour, with the increased awareness of and advocacy for early detection and treatment, also has an effect on the demand. These trends are strategically important for the companies as they not only highlight the changing landscape of breast cancer treatment, but also highlight the need for adaptation strategies to stay in a rapidly changing market.

    Top Trends

    1. Personalized Medicine Advancements
      The shift towards a more individualized medicine is transforming the treatment of breast cancer. Earlier, chemoradiation was the main treatment, but now the trend is towards targeted therapy. In 2023, for example, the Food and Drug Administration approved several new targeted therapies, which have led to improved survival. According to research, a targeted therapy can increase survival by as much as 30 per cent. The trend is leading the pharmaceutical industry to increase its investment in biomarker research, which in turn is strengthening their product portfolios and market position.
    2. Increased Focus on Early Detection
      Governments and health organisations are promoting early detection of breast cancer through initiatives such as National Breast Cancer Awareness Month. Early detection can reduce the risk of death by up to a quarter. The development of advanced screening technology and AI-driven diagnostic tools is expected to improve the screening efficiency and accuracy and consequently the market opportunities.
    3. Integration of Digital Health Solutions
      INTEGRATION OF DIGITAL HEALTH SOLUTIONS, i.e. telemedicine and mobile applications, is transforming patient management in breast cancer. A survey revealed that seventy per cent of patients prefer telehealth consultations. Consequently, the companies are developing digital platforms to facilitate remote monitoring and support, to improve patient engagement and adherence to treatment.
    4. Emergence of Immunotherapy
      Immunotherapy is being considered as a possible treatment for breast cancer. A number of clinical trials have been carried out with encouraging results. In particular, recent studies have shown that the response rate to the treatment of triple-negative breast cancer is improved by 40 per cent by immunotherapy. This is encouraging pharmaceutical companies to invest in research and development, which could lead to new products and market growth.
    5. Regulatory Support for Innovative Therapies
      The approval of the regulating authorities has tended to be more and more favorable towards innovation. The breakthrough therapy status of the FDA has accelerated the approval of several new treatments for breast cancer. In this regulatory environment, there is a new wave of R & D from the major players, which may lead to a wider range of treatments on the market.
    6. Focus on Patient-Centric Care
      The patient-centered care model is becoming increasingly popular, and patient preferences and experiences are given priority. Patients’ satisfaction with their care is associated with better adherence to treatment and outcomes. Product development is being adapted to include patient input, which may lead to greater patient loyalty and market share.
    7. Collaborative Research Initiatives
      It is increasingly common for universities and industry to work together on research, which is driving the development of new therapies for breast cancer. For example, it is such collaborations that have made it possible to develop combinations of drugs that are more effective. This trend is creating a culture of sharing knowledge and resources, which can speed up the development of new treatments and make them more competitive.
    8. Sustainability in Drug Development
      In recent years, the development of new drugs has been accompanied by an increased interest in the environment, with companies adopting sustainable practices. According to a survey, some 60 per cent of pharmaceutical companies are investing in sustainable practices. This trend not only increases the companies’ CSR profile but also makes them more attractive to consumers who are concerned about the environment, which could influence their buying decisions.
    9. Global Market Expansion
      The breast cancer market is growing significantly in emerging economies, driven by increasing awareness and access to health care. The number of women affected by breast cancer is rising in regions such as Asia and Africa. Strategically entering these markets could lead to increased competition and the introduction of affordable treatment options that are more suited to local needs.
    10. Advancements in Genetic Testing
      And now, in the era of genetics, the assessment of breast cancer risk is revolutionized. Genes can be used to identify high-risk individuals and to take preventive measures to reduce the risk of cancer. This is leading to a comprehensive genetic test, which will benefit patients and create new business opportunities.

    Conclusion: Navigating the Competitive Breast Cancer Landscape

    The breast cancer market in 2024 is characterised by high competition and a large number of participants, with both established and new entrants competing for market share. Regional trends indicate a growing focus on personalised medicine and new treatment modalities, especially in North America and Europe where regulatory environments are increasingly supportive of new therapies. The strategic positioning of vendors is increasingly reliant on advanced capabilities such as artificial intelligence for predictive analytics, automation for operational efficiency and sustainable practices to meet evolving patient expectations. The ability to respond quickly to new trends and the needs of patients will be the most important differentiating factors for market leaders.

    Market Summary

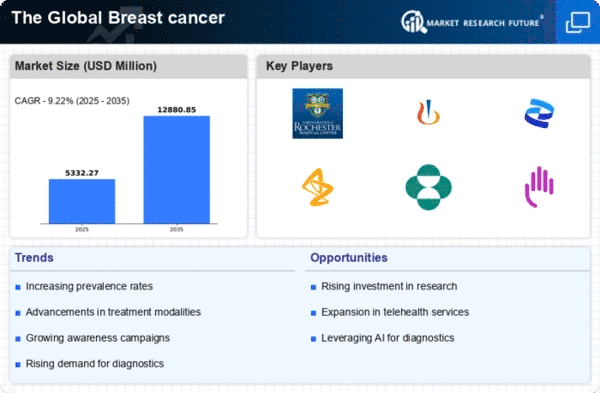
    As per Market Research Future analysis, the Breast Cancer Market was valued at 4.88 USD Billion in 2025 and is projected to grow to 12.88 USD Billion by 2035, with a CAGR of 9.22% from 2025 to 2035. The market is driven by the increasing incidence of breast cancer, advancements in diagnostic technologies, and a growing focus on personalized medicine. Key players are investing in innovative treatment options, enhancing patient outcomes and market dynamics.

    Key Market Trends & Highlights

    The Breast Cancer Market is witnessing transformative trends driven by technological advancements and increased awareness.

    • The incidence of breast cancer has increased by 20% over the last decade, with approximately 2.3 million new cases reported in 2020. 3D mammography has improved early detection rates by up to 40% compared to traditional methods. Approximately 70% of breast cancer patients are now receiving treatments based on specific biomarker identification. Breast cancer awareness programs have driven a 25% increase in regular screenings over the past five years.

    Market Size & Forecast

    2025 Market Size USD 4.88 Billion
    2035 Market Size USD 12.88 Billion
    CAGR (2025-2035) 9.22%
    Largest Regional Market Share in 2024 North America.

    Major Players

    <p>Key companies include Genentech, Pfizer, Roche, Gilead Sciences, Eli Lilly, Bristol Myers Squibb, Johnson and Johnson, AbbVie, Novartis, Mylan, Bayer, Merck, AstraZeneca, Amgen, and Sanofi.</p>

    Market Trends

    Current technological developments and shifting treatment philosophies are causing major changes in the Breast Cancer Market. The rising incidence of breast cancer, which has increased awareness and led governments around the world to fund screening programs and research projects targeted at both prevention and treatment, is one of the major factors propelling the market.

    The market is expanding as a result of the growing need for cutting-edge treatments and diagnostics. Furthermore, the development of personalized medicine is improving patient outcomes and encouraging further research and development expenditures by tailoring treatment regimens to each patient's unique genetic profile. The Breast Cancer Market offers a number of chances for investigation. Businesses that are ready to innovate may find opportunities as the importance of early diagnosis through genetic testing and sophisticated imaging techniques increases.

    Furthermore, the growing trend of pharmaceutical and biotech businesses working together is encouraging the creation of novel treatments and increasing the effectiveness of existing ones. Additionally, there is a greater emphasis on patient-centric strategies, which not only enhance treatment compliance but also encourage patient loyalty to specific companies. Digital health technologies are becoming more prevalent, according to recent developments in the Breast Cancer Market.

    To improve patient participation and expedite the course of therapy, telemedicine, smartphone health apps, and online support platforms are being used more and more. Big data analytics is increasingly being used into clinical studies and treatment plans, enabling better methods of meeting patient demands. These patterns highlight a shift toward more effective, patient-centered treatment that is consistent with the changing global healthcare service environment. Stakeholders are urged to adjust and welcome these developments as the market develops in order to improve health outcomes.


    <p>The increasing prevalence of breast cancer and advancements in early detection technologies are likely to drive substantial growth in the global breast cancer market, reflecting a critical need for innovative treatment options and comprehensive patient care.</p>

    National Cancer Institute

    Global Breast cancer Market Market Drivers

    Market Growth Charts

    Growing Geriatric Population

    The increasing geriatric population is a notable factor influencing the Global Breast Cancer Market Industry. As the global population ages, the incidence of breast cancer is expected to rise, given that age is a significant risk factor. By 2030, it is projected that the number of individuals aged 60 and older will surpass 1.4 billion. This demographic shift necessitates enhanced healthcare services and treatment options tailored to older patients. Consequently, the market is anticipated to experience robust growth, as healthcare systems adapt to meet the needs of this expanding population segment.

    Government Support and Funding

    Government initiatives and funding play a crucial role in shaping the Global Breast Cancer Market Industry. Various countries have implemented national cancer control programs aimed at reducing breast cancer mortality rates through improved access to screening and treatment. For instance, the National Breast Cancer Awareness Month in the United States has garnered significant funding for research and patient support. Such governmental support not only enhances public awareness but also fosters innovation in treatment options. As a result, the market is likely to benefit from sustained investments and policy support, further driving its expansion.

    Increasing Incidence of Breast Cancer

    The Global Breast Cancer Market Industry is experiencing growth driven by the rising incidence of breast cancer worldwide. Statistics indicate that breast cancer remains the most commonly diagnosed cancer among women, with an estimated 2.3 million new cases reported in 2020. This alarming trend suggests that the demand for effective treatment options and early detection methods is likely to escalate. As awareness campaigns and screening programs expand, the market is projected to reach 25.1 USD Billion in 2024, reflecting a heightened focus on addressing this pressing health issue.

    Advancements in Treatment Technologies

    Innovations in treatment technologies are propelling the Global Breast Cancer Market Industry forward. The development of targeted therapies, immunotherapies, and personalized medicine has transformed the treatment landscape, offering patients more effective and less invasive options. For instance, the introduction of CDK4/6 inhibitors has shown promising results in improving patient outcomes. As these advancements continue to evolve, they are expected to contribute significantly to the market's growth, with projections indicating a market value of 40 USD Billion by 2035. This evolution in treatment modalities underscores the importance of ongoing research and development.

    Rising Awareness and Screening Initiatives

    Heightened awareness regarding breast cancer and the importance of early detection is a key driver for the Global Breast Cancer Market Industry. Public health campaigns and educational programs have successfully increased the number of women participating in regular screenings. For example, mammography rates have improved significantly in many regions, leading to earlier diagnoses and better survival rates. This increased awareness is likely to sustain the market's growth trajectory, as more women seek preventive measures and treatment options. Consequently, the industry is poised for a compound annual growth rate of 4.33% from 2025 to 2035.

    Market Segment Insights

    Breast Cancer Market Type of Treatment Insights

    <p>The Breast Cancer Market was characterized by a diverse array of treatment options, significantly influencing the market dynamics and its projected growth. This sector was primarily segmented into various treatment types including Chemotherapy, Radiation Therapy, Targeted Therapy, Immunotherapy, and Hormonal Therapy.</p>

    <p>In 2024, Chemotherapy represented a major segment with a market valuation of 8.0 USD Billion, expected to grow to 12.5 USD Billion by 2035. This segment remained dominant due to its widespread use as a primary treatment for its effectiveness in targeting rapidly dividing cancer cells.</p>

    <p>Radiation Therapy, valued at 5.0 USD Billion in 2024 and anticipated to rise to 8.0 USD Billion in 2035, played a significant role in localized treatment, often utilized post-surgery to eliminate residual cancer cells, making it critical for patient management.</p>

    Breast Cancer Market Disease Stage Insights

    <p>The Breast Cancer Market, segmented by Disease Stage, showcases a diverse landscape essential for effective diagnosis and treatment strategies. The various stages, including Stage 0 through Stage IV, represent critical phases in illness progression, influencing treatment options and patient outcomes.</p>

    <p>Early stages, particularly Stage 0 and Stage I, typically involve localized disease and present opportunities for less invasive treatments, thereby enhancing survival rates. Conversely, advanced stages like Stage III and Stage IV involve metastatic disease, necessitating more aggressive therapies and supportive care, leading to heightened healthcare expenditure.</p>

    <p>This segmentation reveals that as awareness and screenings improve globally, earlier detection is likely to dominate market growth. The Breast Cancer Market data signifies a growing need for innovative therapies addressing the complexities associated with late-stage cancers while including more advanced diagnostics tailored to specific stages.</p>

    Breast Cancer Market End-User Insights

    <p>The Breast Cancer Market has seen significant dynamics in recent years, particularly in the End-User segment, which includes various healthcare settings such as hospitals, outpatient clinics, homecare settings, and research institutes. Hospitals typically account for a substantial share of this segment, as they provide specialized care and advanced diagnostic tools essential for effective treatment.</p>

    <p>Outpatient clinics play a crucial role in facilitating easier access to healthcare services, offering patients the convenience of receiving care without the need for hospitalization. Homecare settings have gained traction, reflecting a growing trend where patients prefer receiving treatment in the comfort of their homes, improving their quality of life.</p>

    <p>Furthermore, research institutes contribute to innovation and development within the industry, driving advancements in treatment methodologies and technologies. The Breast Cancer Market statistics suggest that the collaboration among these various end-users offers numerous opportunities for enhancing patient outcomes and shaping the future landscape of breast cancer care.</p>

    Breast Cancer Market Drug Class Insights

    <p>The Breast Cancer Market, particularly within the Drug Class segment plays a crucial role in treatment strategies. Taxanes, Anthracyclines, Hormonal Agents, and Monoclonal Antibodies, each contributing uniquely to treatment efficacy.</p>

    <p>Taxanes are known for their effectiveness in disrupting cancer cell division, making them critical in therapeutic protocols. Anthracyclines play a significant role due to their capacity to target a range of breast cancer subtypes, thus dominating a significant portion of treatment regimens.</p>

    <p>Hormonal Agents are essential for hormone receptor-positive breast cancer types, thereby improving outcomes for many patients. Furthermore, Monoclonal Antibodies have emerged as a critical innovation, providing advanced options that improve survival rates and reduced side effects.</p>

    Get more detailed insights about Breast Cancer Market Research Report - Forecast To 2035

    Regional Insights

    The Breast Cancer Market experienced notable dynamics across various regional segments, North America holds the market with a valuation of 10.5 USD Billion in 2024, reflecting its significant growth is attributed to advanced healthcare systems and a strong focus on Research and Development in treatment methodologies.

    Europe followed closely, valued at 7.5 USD Billion in 2024 and expected to reach 11.75 USD Billion in 2035, driven by increasing awareness and screening programs which are vital in early detection.

    In the Asia-Pacific (APAC) region, the market stood at 5.0 USD Billion in 2024, anticipated to increase to 8.0 USD Billion by 2035, showcasing a rising investment in healthcare infrastructure, which is crucial for market growth.

    South America, valued at 2.0 USD Billion by 2035, represented an important emerging market where awareness and access to treatment are gradually improving.

    The Asia Pacific region had a modest valuation of 0.59 USD Billion in 2024, presents emerging opportunities supported by increasing healthcare initiatives. Overall, the North America segment held a majority share, making it a key focal point for trends and developments in the Breast Cancer Market.

    Breast Cancer Market Regional Insights

    Source: Primary Research, Secondary Research, Market Research Future Database and Analyst Review

    Key Players and Competitive Insights

    The Breast Cancer Market has seen significant advancements and changes over the years, driven primarily by the increasing prevalence of breast cancer and the growing demand for innovative treatment options. The competitive landscape is characterized by a mix of established pharmaceutical giants and emerging biotech firms.

    These companies continuously invest in research and development to introduce novel therapies and improve existing treatment protocols.

    The market is shaped by collaborations, partnerships, and strategic mergers, enabling firms to enhance their product pipelines and expand their market reach. With a focus on precision medicine, personalized therapies, and patient-centric approaches, the competitive insights in this market reflect a dynamic environment where innovation is critical for success.

    Genentech is a prominent player in the Breast Cancer Market, known for its commitment to biotechnology and innovative treatment solutions. The company has established a strong market presence through its robust Pipeline Review Of Glioblastoma Treatment and successful product launches that address various breast cancer subtypes. Genentech's strengths lie in its investment in research focused on monoclonal antibodies and targeted therapies, which are pivotal in advancing breast cancer management.

    Their dedication to patient outcomes and collaboration with healthcare professionals enhances their reputation in the market. Additionally, Genentech's strong focus on clinical trials and post-marketing studies contributes to their credibility, making them a formidable competitor in the global landscape of breast cancer treatment.

    Pfizer stands out in the Breast Cancer Market with a diverse portfolio of treatment options and a strong emphasis on research and development. The company's key products include targeted therapies and hormonal treatments, which have collectively carved a significant portion of market share. Pfizer's presence in the global arena is bolstered by its strategic mergers and acquisitions, allowing it to integrate new technologies and expand its capabilities within the oncology sector.

    The company excels in developing innovative solutions for breast cancer patients, addressing unmet needs in various subtypes of the disease. Pfizer's robust marketing strategies and collaboration with healthcare providers further solidify its foothold in the market, enabling the company to remain competitive on a global scale while continuously exploring opportunities for growth and enhancement in patient care.

    Key Companies in the Global Breast cancer Market market include

    Industry Developments

    • Q1 2025: 2025 starts strong for Eli Lilly with major M&A and partnerships Eli Lilly acquired Scorpion Therapeutics' PI3Kα inhibitor drug, a targeted therapy candidate for breast cancer, expanding its oncology pipeline with a focus on precision medicine.
    • Q2 2025: Top biotech deals of April 2025 Ollin Biosciences entered a licensing agreement with VelaVigo Bio to acquire global rights (excluding China) to the antibody candidate VBS-102, which is being developed for oncology indications including breast cancer.
    • Q2 2025: Top 10 Companies Leading the Breast Cancer Market in 2025: Key Players, Statistics and Future Trends (2024–2035) Eisai and AstraZeneca continued their partnership to produce and commercialize Enhertu, an antibody-drug conjugate (ADC) for breast cancer, with sales surpassing ¥200 billion ($1.4 billion) in 2023 and ongoing development of next-generation ADCs for HER2-low and HER3 breast cancer subtypes.
    • Q2 2024: Top 10 Companies Leading the Breast Cancer Market in 2025: Key Players, Statistics and Future Trends (2024–2035) GlaxoSmithKline (GSK) advanced its breast cancer portfolio by investing over £2 billion annually in oncology R&D, supporting phase II/III clinical studies of monoclonal antibodies and antibody-drug conjugates, including new ADC structures and immune conjugates for breast cancer.

    Future Outlook

    Global Breast cancer Market Future Outlook

    <p>The Global Breast Cancer Market is projected to grow at a 9.22% CAGR from 2025 to 2035, driven by advancements in treatment modalities, early detection technologies, and increasing awareness.</p>

    New opportunities lie in:

    • <p>Invest in personalized medicine to enhance treatment efficacy and patient outcomes. Develop innovative screening technologies to improve early detection rates. Expand telehealth services to increase access to care and follow-up for patients.</p>

    <p>By 2035, the market is expected to demonstrate robust growth, reflecting advancements in treatment and patient care.</p>

    Market Segmentation

    Breast Cancer Market End-User Outlook

    • Hospitals
    • Outpatient Clinics
    • Homecare Settings
    • Research Institutes

    Breast Cancer Market Regional Outlook

    • North America
    • Europe
    • South America
    • Asia Pacific
    • Middle East and Africa

    Breast Cancer Market Drug Class Outlook

    • Taxanes
    • Anthracyclines
    • Hormonal Agents
    • Monoclonal Antibodies

    Breast Cancer Market Disease Stage Outlook

    • Stage 0
    • Stage I
    • Stage II
    • Stage III
    • Stage IV

    Breast Cancer Market Type of Treatment Outlook

    • Chemotherapy
    • Radiation Therapy
    • Targeted Therapy
    • Immunotherapy
    • Hormonal Therapy

    Report Scope

    Report Attribute/MetricDetails
    Market Size 202425.09(USD Billion)
    Market Size 203512.88 (USD Billion)
    Compound Annual Growth Rate (CAGR)9.22% (2025 - 2035)
    Report CoverageRevenue Forecast, Competitive Landscape, Growth Factors, and Trends
    Base Year2024
    Market Forecast Period2025 - 2035
    Historical Data2019 - 2024
    Market Forecast UnitsUSD Billion
    Key Companies ProfiledGenentech, Pfizer, Gilead Sciences, Eli Lilly, Bristol Myers Squibb, Johnson and Johnson, AbbVie, Novartis, Mylan, Bayer, Merck, AstraZeneca, Amgen, Sanofi
    Segments CoveredType of Treatment, Disease Stage, End-User, Drug Class, Regional
    Key Market OpportunitiesPersonalized medicine advancements, Early detection technologies, Rising focus on preventive care initiatives, Expanding telemedicine services
    Key Market DynamicsRising incidence rates, advancements in treatment options, growing awareness and development
    Countries CoveredNorth America, Europe, APAC, South America, MEA
    Market Size 20255.33 (USD Billion)

    Market Highlights

    Author

    Rahul Gotadki
    Assistant Manager

    She holds an experience of about 6+ years in market research and business consulting, working under the spectrum of information communication technology, telecommunications and semiconductor domains. aarti conceptualizes and implements a scalable business strategy and provides strategic leadership to the clients. her expertise lies in market estimation, competitive intelligence, pipeline analysis, customer assessment, etc.

    Leave a Comment

    Latest Comments

    John Doe
    john@example.com

    This is a great article! Really helped me understand the topic better.

    Posted on July 23, 2025, 10:15 AM
    Jane Smith
    jane@domain.com

    Thanks for sharing this. I’ve bookmarked it for later reference.

    Posted on July 22, 2025, 7:45 PM

    FAQs

    What is the projected growth of the Breast Cancer market?

    The Breast Cancer market is the expected increase in total market value of 12.88 USD billion over a defined forecast period 2025–2035. It is driven by factors such as demand trends, technological advances, regulatory changes, and geographic expansion.

    What is the size of the Breast Cancer market?

    Breast Cancer market size was valued at approximately 4.88 billion USD in 2024. This figure will reach 12.88 billion USD covering all regions (America, Europe, Asia, MEA and ROW), focusing its segments / services / distribution channels till 2035.

    What is the CAGR of the Breast Cancer market?

    Breast Cancer market is expected to grow at a CAGR of 9.22% between 2025 and 2035.

    How much will the Breast Cancer market be worth by 2035?

    Breast Cancer market is expected to be worth of 12.88 billion USD, reflecting growth driven by usage, technology and global demands by the end of 2035.

    How will the Breast Cancer market perform over the next 10 years?

    Over the next 10 years the Breast Cancer market is expected to shift from usd billion 4.88 to 12.88 billion USD, led by adoption of advanced tech, demographic trends, regulatory approvals, with potential headwinds from 2025 to 2035.

    Which region dominated the Breast Cancer Market in 2024?

    North America dominated the Breast Cancer Market with a value of 10.5 USD in 2024.

    How much was the Breast Cancer Market valued in Europe for the year 2024?

    The Breast Cancer Market in Europe was valued at 7.5 USD Billion in 2024.

    What was the market size for Radiation Therapy in 2035?

    Chemotherapy was valued at 8.0 USD Billion within the Breast Cancer Market in 2024.

    Which key players in the Breast Cancer Market?

    Major players include Novartis, Merck, Pfizer, Gilead Sciences, and Roche.

    What is the projected market value for Chemotherapy in 2024?

    The market value for Chemotherapy is expected to be 8.0 billion USD in 2024.

    How is the market for Targeted Therapy expected to grow by 2035?

    The market for Targeted Therapy is projected to grow to 10.0 billion USD Billion in 2024 to 8.0 USD Billion in 2035.

    1. . EXECUTIVE SUMMARY
    2. . Market Overview
    3. . Key Findings
    4. . Market Segmentation
    5. . Competitive Landscape
    6. . Challenges and Opportunities
    7. . Future Outlook
    8. . MARKET INTRODUCTION
    9. . Definition
    10. . Scope of the study
    11. . Research Objective
    12. . Assumption
    13. . Limitations
    14. . RESEARCH METHODOLOGY
    15. . Overview
    16. . Data Mining
    17. . Secondary Research
    18. . Primary Research
    19. . Primary Interviews and Information Gathering Process
    20. . Breakdown of Primary Respondents
    21. . Forecasting Model
    22. . Market Size Estimation
    23. . Bottom-Up Approach
    24. . Top-Down Approach
    25. . Data Triangulation
    26. . Validation
    27. . MARKET DYNAMICS
    28. . Overview
    29. . Drivers
    30. . Restraints
    31. . Opportunities
    32. . MARKET FACTOR ANALYSIS
    33. . Value chain Analysis
    34. . Porter's Five Forces Analysis
    35. . Bargaining Power of Suppliers
    36. . Bargaining Power of Buyers
    37. . Threat of New Entrants
    38. . Threat of Substitutes
    39. . Intensity of Rivalry
    40. . COVID-19 Impact Analysis
    41. . Market Impact Analysis
    42. . Regional Impact
    43. . Opportunity and Threat Analysis
    44. . BREAST CANCER MARKET, BY TYPE OF TREATMENT (USD BILLION)
    45. . Chemotherapy
    46. . Radiation Therapy
    47. . Targeted Therapy
    48. . Immunotherapy
    49. . Hormonal Therapy
    50. . BREAST CANCER MARKET, BY DISEASE STAGE (USD BILLION)
    51. . Stage 0
    52. . Stage I
    53. . Stage II
    54. . Stage III
    55. . Stage IV
    56. . BREAST CANCER MARKET, BY END-USER (USD BILLION)
    57. . Hospitals
    58. . Outpatient Clinics
    59. . Homecare Settings
    60. . Research Institutes
    61. . BREAST CANCER MARKET, BY DRUG CLASS (USD BILLION)
    62. . Taxanes
    63. . Anthracyclines
    64. . Hormonal Agents
    65. . Monoclonal Antibodies
    66. . BREAST CANCER MARKET, BY REGIONAL (USD BILLION)
    67. . North America
    68. . US
    69. . Canada
    70. . Europe
    71. . Germany
    72. . UK
    73. . France
    74. . Russia
    75. . Italy
    76. . Spain
    77. . Rest of Europe
    78. . APAC
    79. . China
    80. . India
    81. . Japan
    82. . South Korea
    83. . Malaysia
    84. . Thailand
    85. . Indonesia
    86. . Rest of APAC
    87. . South America
    88. . Brazil
    89. . Mexico
    90. . Argentina
    91. . Rest of South America
    92. . MEA
    93. . GCC Countries
    94. . South Africa
    95. . Rest of MEA
    96. . COMPETITIVE LANDSCAPE
    97. . Overview
    98. . Competitive Analysis
    99. . Market share Analysis
    100. . Major Growth Strategy in the Breast Cancer Market
    101. . Competitive Benchmarking
    102. . Leading Players in Terms of Number of Developments in the Breast Cancer Market
    103. . Key developments and growth strategies
    104. . New Product Launch/Service Deployment
    105. . Merger & Acquisitions
    106. . Joint Ventures
    107. . Major Players Financial Matrix
    108. . Sales and Operating Income
    109. . Major Players R&D Expenditure. 2023
    110. . COMPANY PROFILES
    111. . Genentech
    112. . Financial Overview
    113. . Products Offered
    114. . Key Developments
    115. . SWOT Analysis
    116. . Key Strategies
    117. . Pfizer
    118. . Financial Overview
    119. . Products Offered
    120. . Key Developments
    121. . SWOT Analysis
    122. . Key Strategies
    123. . Roche
    124. . Financial Overview
    125. . Products Offered
    126. . Key Developments
    127. . SWOT Analysis
    128. . Key Strategies
    129. . Gilead Sciences
    130. . Financial Overview
    131. . Products Offered
    132. . Key Developments
    133. . SWOT Analysis
    134. . Key Strategies
    135. . Eli Lilly
    136. . Financial Overview
    137. . Products Offered
    138. . Key Developments
    139. . SWOT Analysis
    140. . Key Strategies
    141. . Bristol Myers Squibb
    142. . Financial Overview
    143. . Products Offered
    144. . Key Developments
    145. . SWOT Analysis
    146. . Key Strategies
    147. . Johnson and Johnson
    148. . Financial Overview
    149. . Products Offered
    150. . Key Developments
    151. . SWOT Analysis
    152. . Key Strategies
    153. . AbbVie
    154. . Financial Overview
    155. . Products Offered
    156. . Key Developments
    157. . SWOT Analysis
    158. . Key Strategies
    159. . Novartis
    160. . Financial Overview
    161. . Products Offered
    162. . Key Developments
    163. . SWOT Analysis
    164. . Key Strategies
    165. . Mylan
    166. . Financial Overview
    167. . Products Offered
    168. . Key Developments
    169. . SWOT Analysis
    170. . Key Strategies
    171. . Bayer
    172. . Financial Overview
    173. . Products Offered
    174. . Key Developments
    175. . SWOT Analysis
    176. . Key Strategies
    177. . Merck
    178. . Financial Overview
    179. . Products Offered
    180. . Key Developments
    181. . SWOT Analysis
    182. . Key Strategies
    183. . AstraZeneca
    184. . Financial Overview
    185. . Products Offered
    186. . Key Developments
    187. . SWOT Analysis
    188. . Key Strategies
    189. . Amgen
    190. . Financial Overview
    191. . Products Offered
    192. . Key Developments
    193. . SWOT Analysis
    194. . Key Strategies
    195. . Sanofi
    196. . Financial Overview
    197. . Products Offered
    198. . Key Developments
    199. . SWOT Analysis
    200. . Key Strategies
    201. . APPENDIX
    202. . References
    203. . Related Reports LIST OF TABLES TABLE
    204. . LIST OF ASSUMPTIONS TABLE
    205. . NORTH AMERICA BREAST CANCER MARKET SIZE ESTIMATES & FORECAST, BY TYPE OF TREATMENT, 2019-2035 (USD BILLIONS) TABLE
    206. . NORTH AMERICA BREAST CANCER MARKET SIZE ESTIMATES & FORECAST, BY DISEASE STAGE, 2019-2035 (USD BILLIONS) TABLE
    207. . NORTH AMERICA BREAST CANCER MARKET SIZE ESTIMATES & FORECAST, BY END-USER, 2019-2035 (USD BILLIONS) TABLE
    208. . NORTH AMERICA BREAST CANCER MARKET SIZE ESTIMATES & FORECAST, BY DRUG CLASS, 2019-2035 (USD BILLIONS) TABLE
    209. . NORTH AMERICA BREAST CANCER MARKET SIZE ESTIMATES & FORECAST, BY REGIONAL, 2019-2035 (USD BILLIONS) TABLE
    210. . US BREAST CANCER MARKET SIZE ESTIMATES & FORECAST, BY TYPE OF TREATMENT, 2019-2035 (USD BILLIONS) TABLE
    211. . US BREAST CANCER MARKET SIZE ESTIMATES & FORECAST, BY DISEASE STAGE, 2019-2035 (USD BILLIONS) TABLE
    212. . US BREAST CANCER MARKET SIZE ESTIMATES & FORECAST, BY END-USER, 2019-2035 (USD BILLIONS) TABLE
    213. . US BREAST CANCER MARKET SIZE ESTIMATES & FORECAST, BY DRUG CLASS, 2019-2035 (USD BILLIONS) TABLE
    214. . US BREAST CANCER MARKET SIZE ESTIMATES & FORECAST, BY REGIONAL, 2019-2035 (USD BILLIONS) TABLE
    215. . CANADA BREAST CANCER MARKET SIZE ESTIMATES & FORECAST, BY TYPE OF TREATMENT, 2019-2035 (USD BILLIONS) TABLE
    216. . CANADA BREAST CANCER MARKET SIZE ESTIMATES & FORECAST, BY DISEASE STAGE, 2019-2035 (USD BILLIONS) TABLE
    217. . CANADA BREAST CANCER MARKET SIZE ESTIMATES & FORECAST, BY END-USER, 2019-2035 (USD BILLIONS) TABLE
    218. . CANADA BREAST CANCER MARKET SIZE ESTIMATES & FORECAST, BY DRUG CLASS, 2019-2035 (USD BILLIONS) TABLE
    219. . CANADA BREAST CANCER MARKET SIZE ESTIMATES & FORECAST, BY REGIONAL, 2019-2035 (USD BILLIONS) TABLE
    220. . EUROPE BREAST CANCER MARKET SIZE ESTIMATES & FORECAST, BY TYPE OF TREATMENT, 2019-2035 (USD BILLIONS) TABLE
    221. . EUROPE BREAST CANCER MARKET SIZE ESTIMATES & FORECAST, BY DISEASE STAGE, 2019-2035 (USD BILLIONS) TABLE
    222. . EUROPE BREAST CANCER MARKET SIZE ESTIMATES & FORECAST, BY END-USER, 2019-2035 (USD BILLIONS) TABLE
    223. . EUROPE BREAST CANCER MARKET SIZE ESTIMATES & FORECAST, BY DRUG CLASS, 2019-2035 (USD BILLIONS) TABLE
    224. . EUROPE BREAST CANCER MARKET SIZE ESTIMATES & FORECAST, BY REGIONAL, 2019-2035 (USD BILLIONS) TABLE
    225. . GERMANY BREAST CANCER MARKET SIZE ESTIMATES & FORECAST, BY TYPE OF TREATMENT, 2019-2035 (USD BILLIONS) TABLE
    226. . GERMANY BREAST CANCER MARKET SIZE ESTIMATES & FORECAST, BY DISEASE STAGE, 2019-2035 (USD BILLIONS) TABLE
    227. . GERMANY BREAST CANCER MARKET SIZE ESTIMATES & FORECAST, BY END-USER, 2019-2035 (USD BILLIONS) TABLE
    228. . GERMANY BREAST CANCER MARKET SIZE ESTIMATES & FORECAST, BY DRUG CLASS, 2019-2035 (USD BILLIONS) TABLE
    229. . GERMANY BREAST CANCER MARKET SIZE ESTIMATES & FORECAST, BY REGIONAL, 2019-2035 (USD BILLIONS) TABLE
    230. . UK BREAST CANCER MARKET SIZE ESTIMATES & FORECAST, BY TYPE OF TREATMENT, 2019-2035 (USD BILLIONS) TABLE
    231. . UK BREAST CANCER MARKET SIZE ESTIMATES & FORECAST, BY DISEASE STAGE, 2019-2035 (USD BILLIONS) TABLE
    232. . UK BREAST CANCER MARKET SIZE ESTIMATES & FORECAST, BY END-USER, 2019-2035 (USD BILLIONS) TABLE
    233. . UK BREAST CANCER MARKET SIZE ESTIMATES & FORECAST, BY DRUG CLASS, 2019-2035 (USD BILLIONS) TABLE
    234. . UK BREAST CANCER MARKET SIZE ESTIMATES & FORECAST, BY REGIONAL, 2019-2035 (USD BILLIONS) TABLE
    235. . FRANCE BREAST CANCER MARKET SIZE ESTIMATES & FORECAST, BY TYPE OF TREATMENT, 2019-2035 (USD BILLIONS) TABLE
    236. . FRANCE BREAST CANCER MARKET SIZE ESTIMATES & FORECAST, BY DISEASE STAGE, 2019-2035 (USD BILLIONS) TABLE
    237. . FRANCE BREAST CANCER MARKET SIZE ESTIMATES & FORECAST, BY END-USER, 2019-2035 (USD BILLIONS) TABLE
    238. . FRANCE BREAST CANCER MARKET SIZE ESTIMATES & FORECAST, BY DRUG CLASS, 2019-2035 (USD BILLIONS) TABLE
    239. . FRANCE BREAST CANCER MARKET SIZE ESTIMATES & FORECAST, BY REGIONAL, 2019-2035 (USD BILLIONS) TABLE
    240. . RUSSIA BREAST CANCER MARKET SIZE ESTIMATES & FORECAST, BY TYPE OF TREATMENT, 2019-2035 (USD BILLIONS) TABLE
    241. . RUSSIA BREAST CANCER MARKET SIZE ESTIMATES & FORECAST, BY DISEASE STAGE, 2019-2035 (USD BILLIONS) TABLE
    242. . RUSSIA BREAST CANCER MARKET SIZE ESTIMATES & FORECAST, BY END-USER, 2019-2035 (USD BILLIONS) TABLE
    243. . RUSSIA BREAST CANCER MARKET SIZE ESTIMATES & FORECAST, BY DRUG CLASS, 2019-2035 (USD BILLIONS) TABLE
    244. . RUSSIA BREAST CANCER MARKET SIZE ESTIMATES & FORECAST, BY REGIONAL, 2019-2035 (USD BILLIONS) TABLE
    245. . ITALY BREAST CANCER MARKET SIZE ESTIMATES & FORECAST, BY TYPE OF TREATMENT, 2019-2035 (USD BILLIONS) TABLE
    246. . ITALY BREAST CANCER MARKET SIZE ESTIMATES & FORECAST, BY DISEASE STAGE, 2019-2035 (USD BILLIONS) TABLE
    247. . ITALY BREAST CANCER MARKET SIZE ESTIMATES & FORECAST, BY END-USER, 2019-2035 (USD BILLIONS) TABLE
    248. . ITALY BREAST CANCER MARKET SIZE ESTIMATES & FORECAST, BY DRUG CLASS, 2019-2035 (USD BILLIONS) TABLE
    249. . ITALY BREAST CANCER MARKET SIZE ESTIMATES & FORECAST, BY REGIONAL, 2019-2035 (USD BILLIONS) TABLE
    250. . SPAIN BREAST CANCER MARKET SIZE ESTIMATES & FORECAST, BY TYPE OF TREATMENT, 2019-2035 (USD BILLIONS) TABLE
    251. . SPAIN BREAST CANCER MARKET SIZE ESTIMATES & FORECAST, BY DISEASE STAGE, 2019-2035 (USD BILLIONS) TABLE
    252. . SPAIN BREAST CANCER MARKET SIZE ESTIMATES & FORECAST, BY END-USER, 2019-2035 (USD BILLIONS) TABLE
    253. . SPAIN BREAST CANCER MARKET SIZE ESTIMATES & FORECAST, BY DRUG CLASS, 2019-2035 (USD BILLIONS) TABLE
    254. . SPAIN BREAST CANCER MARKET SIZE ESTIMATES & FORECAST, BY REGIONAL, 2019-2035 (USD BILLIONS) TABLE
    255. . REST OF EUROPE BREAST CANCER MARKET SIZE ESTIMATES & FORECAST, BY TYPE OF TREATMENT, 2019-2035 (USD BILLIONS) TABLE
    256. . REST OF EUROPE BREAST CANCER MARKET SIZE ESTIMATES & FORECAST, BY DISEASE STAGE, 2019-2035 (USD BILLIONS) TABLE
    257. . REST OF EUROPE BREAST CANCER MARKET SIZE ESTIMATES & FORECAST, BY END-USER, 2019-2035 (USD BILLIONS) TABLE
    258. . REST OF EUROPE BREAST CANCER MARKET SIZE ESTIMATES & FORECAST, BY DRUG CLASS, 2019-2035 (USD BILLIONS) TABLE
    259. . REST OF EUROPE BREAST CANCER MARKET SIZE ESTIMATES & FORECAST, BY REGIONAL, 2019-2035 (USD BILLIONS) TABLE
    260. . APAC BREAST CANCER MARKET SIZE ESTIMATES & FORECAST, BY TYPE OF TREATMENT, 2019-2035 (USD BILLIONS) TABLE
    261. . APAC BREAST CANCER MARKET SIZE ESTIMATES & FORECAST, BY DISEASE STAGE, 2019-2035 (USD BILLIONS) TABLE
    262. . APAC BREAST CANCER MARKET SIZE ESTIMATES & FORECAST, BY END-USER, 2019-2035 (USD BILLIONS) TABLE
    263. . APAC BREAST CANCER MARKET SIZE ESTIMATES & FORECAST, BY DRUG CLASS, 2019-2035 (USD BILLIONS) TABLE
    264. . APAC BREAST CANCER MARKET SIZE ESTIMATES & FORECAST, BY REGIONAL, 2019-2035 (USD BILLIONS) TABLE
    265. . CHINA BREAST CANCER MARKET SIZE ESTIMATES & FORECAST, BY TYPE OF TREATMENT, 2019-2035 (USD BILLIONS) TABLE
    266. . CHINA BREAST CANCER MARKET SIZE ESTIMATES & FORECAST, BY DISEASE STAGE, 2019-2035 (USD BILLIONS) TABLE
    267. . CHINA BREAST CANCER MARKET SIZE ESTIMATES & FORECAST, BY END-USER, 2019-2035 (USD BILLIONS) TABLE
    268. . CHINA BREAST CANCER MARKET SIZE ESTIMATES & FORECAST, BY DRUG CLASS, 2019-2035 (USD BILLIONS) TABLE
    269. . CHINA BREAST CANCER MARKET SIZE ESTIMATES & FORECAST, BY REGIONAL, 2019-2035 (USD BILLIONS) TABLE
    270. . INDIA BREAST CANCER MARKET SIZE ESTIMATES & FORECAST, BY TYPE OF TREATMENT, 2019-2035 (USD BILLIONS) TABLE
    271. . INDIA BREAST CANCER MARKET SIZE ESTIMATES & FORECAST, BY DISEASE STAGE, 2019-2035 (USD BILLIONS) TABLE
    272. . INDIA BREAST CANCER MARKET SIZE ESTIMATES & FORECAST, BY END-USER, 2019-2035 (USD BILLIONS) TABLE
    273. . INDIA BREAST CANCER MARKET SIZE ESTIMATES & FORECAST, BY DRUG CLASS, 2019-2035 (USD BILLIONS) TABLE
    274. . INDIA BREAST CANCER MARKET SIZE ESTIMATES & FORECAST, BY REGIONAL, 2019-2035 (USD BILLIONS) TABLE
    275. . JAPAN BREAST CANCER MARKET SIZE ESTIMATES & FORECAST, BY TYPE OF TREATMENT, 2019-2035 (USD BILLIONS) TABLE
    276. . JAPAN BREAST CANCER MARKET SIZE ESTIMATES & FORECAST, BY DISEASE STAGE, 2019-2035 (USD BILLIONS) TABLE
    277. . JAPAN BREAST CANCER MARKET SIZE ESTIMATES & FORECAST, BY END-USER, 2019-2035 (USD BILLIONS) TABLE
    278. . JAPAN BREAST CANCER MARKET SIZE ESTIMATES & FORECAST, BY DRUG CLASS, 2019-2035 (USD BILLIONS) TABLE
    279. . JAPAN BREAST CANCER MARKET SIZE ESTIMATES & FORECAST, BY REGIONAL, 2019-2035 (USD BILLIONS) TABLE
    280. . SOUTH KOREA BREAST CANCER MARKET SIZE ESTIMATES & FORECAST, BY TYPE OF TREATMENT, 2019-2035 (USD BILLIONS) TABLE
    281. . SOUTH KOREA BREAST CANCER MARKET SIZE ESTIMATES & FORECAST, BY DISEASE STAGE, 2019-2035 (USD BILLIONS) TABLE
    282. . SOUTH KOREA BREAST CANCER MARKET SIZE ESTIMATES & FORECAST, BY END-USER, 2019-2035 (USD BILLIONS) TABLE
    283. . SOUTH KOREA BREAST CANCER MARKET SIZE ESTIMATES & FORECAST, BY DRUG CLASS, 2019-2035 (USD BILLIONS) TABLE
    284. . SOUTH KOREA BREAST CANCER MARKET SIZE ESTIMATES & FORECAST, BY REGIONAL, 2019-2035 (USD BILLIONS) TABLE
    285. . MALAYSIA BREAST CANCER MARKET SIZE ESTIMATES & FORECAST, BY TYPE OF TREATMENT, 2019-2035 (USD BILLIONS) TABLE
    286. . MALAYSIA BREAST CANCER MARKET SIZE ESTIMATES & FORECAST, BY DISEASE STAGE, 2019-2035 (USD BILLIONS) TABLE
    287. . MALAYSIA BREAST CANCER MARKET SIZE ESTIMATES & FORECAST, BY END-USER, 2019-2035 (USD BILLIONS) TABLE
    288. . MALAYSIA BREAST CANCER MARKET SIZE ESTIMATES & FORECAST, BY DRUG CLASS, 2019-2035 (USD BILLIONS) TABLE
    289. . MALAYSIA BREAST CANCER MARKET SIZE ESTIMATES & FORECAST, BY REGIONAL, 2019-2035 (USD BILLIONS) TABLE
    290. . THAILAND BREAST CANCER MARKET SIZE ESTIMATES & FORECAST, BY TYPE OF TREATMENT, 2019-2035 (USD BILLIONS) TABLE
    291. . THAILAND BREAST CANCER MARKET SIZE ESTIMATES & FORECAST, BY DISEASE STAGE, 2019-2035 (USD BILLIONS) TABLE
    292. . THAILAND BREAST CANCER MARKET SIZE ESTIMATES & FORECAST, BY END-USER, 2019-2035 (USD BILLIONS) TABLE
    293. . THAILAND BREAST CANCER MARKET SIZE ESTIMATES & FORECAST, BY DRUG CLASS, 2019-2035 (USD BILLIONS) TABLE
    294. . THAILAND BREAST CANCER MARKET SIZE ESTIMATES & FORECAST, BY REGIONAL, 2019-2035 (USD BILLIONS) TABLE
    295. . INDONESIA BREAST CANCER MARKET SIZE ESTIMATES & FORECAST, BY TYPE OF TREATMENT, 2019-2035 (USD BILLIONS) TABLE
    296. . INDONESIA BREAST CANCER MARKET SIZE ESTIMATES & FORECAST, BY DISEASE STAGE, 2019-2035 (USD BILLIONS) TABLE
    297. . INDONESIA BREAST CANCER MARKET SIZE ESTIMATES & FORECAST, BY END-USER, 2019-2035 (USD BILLIONS) TABLE
    298. . INDONESIA BREAST CANCER MARKET SIZE ESTIMATES & FORECAST, BY DRUG CLASS, 2019-2035 (USD BILLIONS) TABLE
    299. . INDONESIA BREAST CANCER MARKET SIZE ESTIMATES & FORECAST, BY REGIONAL, 2019-2035 (USD BILLIONS) TABLE
    300. . REST OF APAC BREAST CANCER MARKET SIZE ESTIMATES & FORECAST, BY TYPE OF TREATMENT, 2019-2035 (USD BILLIONS) TABLE
    301. . REST OF APAC BREAST CANCER MARKET SIZE ESTIMATES & FORECAST, BY DISEASE STAGE, 2019-2035 (USD BILLIONS) TABLE
    302. . REST OF APAC BREAST CANCER MARKET SIZE ESTIMATES & FORECAST, BY END-USER, 2019-2035 (USD BILLIONS) TABLE
    303. . REST OF APAC BREAST CANCER MARKET SIZE ESTIMATES & FORECAST, BY DRUG CLASS, 2019-2035 (USD BILLIONS) TABLE
    304. . REST OF APAC BREAST CANCER MARKET SIZE ESTIMATES & FORECAST, BY REGIONAL, 2019-2035 (USD BILLIONS) TABLE
    305. . SOUTH AMERICA BREAST CANCER MARKET SIZE ESTIMATES & FORECAST, BY TYPE OF TREATMENT, 2019-2035 (USD BILLIONS) TABLE
    306. . SOUTH AMERICA BREAST CANCER MARKET SIZE ESTIMATES & FORECAST, BY DISEASE STAGE, 2019-2035 (USD BILLIONS) TABLE
    307. . SOUTH AMERICA BREAST CANCER MARKET SIZE ESTIMATES & FORECAST, BY END-USER, 2019-2035 (USD BILLIONS) TABLE
    308. . SOUTH AMERICA BREAST CANCER MARKET SIZE ESTIMATES & FORECAST, BY DRUG CLASS, 2019-2035 (USD BILLIONS) TABLE
    309. . SOUTH AMERICA BREAST CANCER MARKET SIZE ESTIMATES & FORECAST, BY REGIONAL, 2019-2035 (USD BILLIONS) TABLE
    310. . BRAZIL BREAST CANCER MARKET SIZE ESTIMATES & FORECAST, BY TYPE OF TREATMENT, 2019-2035 (USD BILLIONS) TABLE
    311. . BRAZIL BREAST CANCER MARKET SIZE ESTIMATES & FORECAST, BY DISEASE STAGE, 2019-2035 (USD BILLIONS) TABLE
    312. . BRAZIL BREAST CANCER MARKET SIZE ESTIMATES & FORECAST, BY END-USER, 2019-2035 (USD BILLIONS) TABLE
    313. . BRAZIL BREAST CANCER MARKET SIZE ESTIMATES & FORECAST, BY DRUG CLASS, 2019-2035 (USD BILLIONS) TABLE
    314. . BRAZIL BREAST CANCER MARKET SIZE ESTIMATES & FORECAST, BY REGIONAL, 2019-2035 (USD BILLIONS) TABLE
    315. . MEXICO BREAST CANCER MARKET SIZE ESTIMATES & FORECAST, BY TYPE OF TREATMENT, 2019-2035 (USD BILLIONS) TABLE
    316. . MEXICO BREAST CANCER MARKET SIZE ESTIMATES & FORECAST, BY DISEASE STAGE, 2019-2035 (USD BILLIONS) TABLE
    317. . MEXICO BREAST CANCER MARKET SIZE ESTIMATES & FORECAST, BY END-USER, 2019-2035 (USD BILLIONS) TABLE
    318. . MEXICO BREAST CANCER MARKET SIZE ESTIMATES & FORECAST, BY DRUG CLASS, 2019-2035 (USD BILLIONS) TABLE
    319. . MEXICO BREAST CANCER MARKET SIZE ESTIMATES & FORECAST, BY REGIONAL, 2019-2035 (USD BILLIONS) TABLE
    320. . ARGENTINA BREAST CANCER MARKET SIZE ESTIMATES & FORECAST, BY TYPE OF TREATMENT, 2019-2035 (USD BILLIONS) TABLE
    321. . ARGENTINA BREAST CANCER MARKET SIZE ESTIMATES & FORECAST, BY DISEASE STAGE, 2019-2035 (USD BILLIONS) TABLE
    322. . ARGENTINA BREAST CANCER MARKET SIZE ESTIMATES & FORECAST, BY END-USER, 2019-2035 (USD BILLIONS) TABLE
    323. . ARGENTINA BREAST CANCER MARKET SIZE ESTIMATES & FORECAST, BY DRUG CLASS, 2019-2035 (USD BILLIONS) TABLE
    324. . ARGENTINA BREAST CANCER MARKET SIZE ESTIMATES & FORECAST, BY REGIONAL, 2019-2035 (USD BILLIONS) TABLE
    325. . REST OF SOUTH AMERICA BREAST CANCER MARKET SIZE ESTIMATES & FORECAST, BY TYPE OF TREATMENT, 2019-2035 (USD BILLIONS) TABLE
    326. . REST OF SOUTH AMERICA BREAST CANCER MARKET SIZE ESTIMATES & FORECAST, BY DISEASE STAGE, 2019-2035 (USD BILLIONS) TABLE
    327. . REST OF SOUTH AMERICA BREAST CANCER MARKET SIZE ESTIMATES & FORECAST, BY END-USER, 2019-2035 (USD BILLIONS) TABLE
    328. . REST OF SOUTH AMERICA BREAST CANCER MARKET SIZE ESTIMATES & FORECAST, BY DRUG CLASS, 2019-2035 (USD BILLIONS) TABLE
    329. . REST OF SOUTH AMERICA BREAST CANCER MARKET SIZE ESTIMATES & FORECAST, BY REGIONAL, 2019-2035 (USD BILLIONS) TABLE
    330. . MEA BREAST CANCER MARKET SIZE ESTIMATES & FORECAST, BY TYPE OF TREATMENT, 2019-2035 (USD BILLIONS) TABLE
    331. . MEA BREAST CANCER MARKET SIZE ESTIMATES & FORECAST, BY DISEASE STAGE, 2019-2035 (USD BILLIONS) TABLE
    332. . MEA BREAST CANCER MARKET SIZE ESTIMATES & FORECAST, BY END-USER, 2019-2035 (USD BILLIONS) TABLE
    333. . MEA BREAST CANCER MARKET SIZE ESTIMATES & FORECAST, BY DRUG CLASS, 2019-2035 (USD BILLIONS) TABLE
    334. . MEA BREAST CANCER MARKET SIZE ESTIMATES & FORECAST, BY REGIONAL, 2019-2035 (USD BILLIONS) TABLE
    335. . GCC COUNTRIES BREAST CANCER MARKET SIZE ESTIMATES & FORECAST, BY TYPE OF TREATMENT, 2019-2035 (USD BILLIONS) TABLE
    336. . GCC COUNTRIES BREAST CANCER MARKET SIZE ESTIMATES & FORECAST, BY DISEASE STAGE, 2019-2035 (USD BILLIONS) TABLE
    337. . GCC COUNTRIES BREAST CANCER MARKET SIZE ESTIMATES & FORECAST, BY END-USER, 2019-2035 (USD BILLIONS) TABLE
    338. . GCC COUNTRIES BREAST CANCER MARKET SIZE ESTIMATES & FORECAST, BY DRUG CLASS, 2019-2035 (USD BILLIONS) TABLE
    339. . GCC COUNTRIES BREAST CANCER MARKET SIZE ESTIMATES & FORECAST, BY REGIONAL, 2019-2035 (USD BILLIONS) TABLE
    340. . SOUTH AFRICA BREAST CANCER MARKET SIZE ESTIMATES & FORECAST, BY TYPE OF TREATMENT, 2019-2035 (USD BILLIONS) TABLE
    341. . SOUTH AFRICA BREAST CANCER MARKET SIZE ESTIMATES & FORECAST, BY DISEASE STAGE, 2019-2035 (USD BILLIONS) TABLE
    342. . SOUTH AFRICA BREAST CANCER MARKET SIZE ESTIMATES & FORECAST, BY END-USER, 2019-2035 (USD BILLIONS) TABLE
    343. . SOUTH AFRICA BREAST CANCER MARKET SIZE ESTIMATES & FORECAST, BY DRUG CLASS, 2019-2035 (USD BILLIONS) TABLE
    344. . SOUTH AFRICA BREAST CANCER MARKET SIZE ESTIMATES & FORECAST, BY REGIONAL, 2019-2035 (USD BILLIONS) TABLE
    345. . REST OF MEA BREAST CANCER MARKET SIZE ESTIMATES & FORECAST, BY TYPE OF TREATMENT, 2019-2035 (USD BILLIONS) TABLE
    346. . REST OF MEA BREAST CANCER MARKET SIZE ESTIMATES & FORECAST, BY DISEASE STAGE, 2019-2035 (USD BILLIONS) TABLE
    347. . REST OF MEA BREAST CANCER MARKET SIZE ESTIMATES & FORECAST, BY END-USER, 2019-2035 (USD BILLIONS) TABLE
    348. . REST OF MEA BREAST CANCER MARKET SIZE ESTIMATES & FORECAST, BY DRUG CLASS, 2019-2035 (USD BILLIONS) TABLE
    349. . REST OF MEA BREAST CANCER MARKET SIZE ESTIMATES & FORECAST, BY REGIONAL, 2019-2035 (USD BILLIONS) TABLE
    350. . PRODUCT LAUNCH/PRODUCT DEVELOPMENT/APPROVAL TABLE
    351. . ACQUISITION/PARTNERSHIP LIST OF FIGURES FIGURE
    352. . MARKET SYNOPSIS FIGURE
    353. . NORTH AMERICA BREAST CANCER MARKET ANALYSIS FIGURE
    354. . US BREAST CANCER MARKET ANALYSIS BY TYPE OF TREATMENT FIGURE
    355. . US BREAST CANCER MARKET ANALYSIS BY DISEASE STAGE FIGURE
    356. . US BREAST CANCER MARKET ANALYSIS BY END-USER FIGURE
    357. . US BREAST CANCER MARKET ANALYSIS BY DRUG CLASS FIGURE
    358. . US BREAST CANCER MARKET ANALYSIS BY REGIONAL FIGURE
    359. . CANADA BREAST CANCER MARKET ANALYSIS BY TYPE OF TREATMENT FIGURE
    360. . CANADA BREAST CANCER MARKET ANALYSIS BY DISEASE STAGE FIGURE
    361. . CANADA BREAST CANCER MARKET ANALYSIS BY END-USER FIGURE
    362. . CANADA BREAST CANCER MARKET ANALYSIS BY DRUG CLASS FIGURE
    363. . CANADA BREAST CANCER MARKET ANALYSIS BY REGIONAL FIGURE
    364. . EUROPE BREAST CANCER MARKET ANALYSIS FIGURE
    365. . GERMANY BREAST CANCER MARKET ANALYSIS BY TYPE OF TREATMENT FIGURE
    366. . GERMANY BREAST CANCER MARKET ANALYSIS BY DISEASE STAGE FIGURE
    367. . GERMANY BREAST CANCER MARKET ANALYSIS BY END-USER FIGURE
    368. . GERMANY BREAST CANCER MARKET ANALYSIS BY DRUG CLASS FIGURE
    369. . GERMANY BREAST CANCER MARKET ANALYSIS BY REGIONAL FIGURE
    370. . UK BREAST CANCER MARKET ANALYSIS BY TYPE OF TREATMENT FIGURE
    371. . UK BREAST CANCER MARKET ANALYSIS BY DISEASE STAGE FIGURE
    372. . UK BREAST CANCER MARKET ANALYSIS BY END-USER FIGURE
    373. . UK BREAST CANCER MARKET ANALYSIS BY DRUG CLASS FIGURE
    374. . UK BREAST CANCER MARKET ANALYSIS BY REGIONAL FIGURE
    375. . FRANCE BREAST CANCER MARKET ANALYSIS BY TYPE OF TREATMENT FIGURE
    376. . FRANCE BREAST CANCER MARKET ANALYSIS BY DISEASE STAGE FIGURE
    377. . FRANCE BREAST CANCER MARKET ANALYSIS BY END-USER FIGURE
    378. . FRANCE BREAST CANCER MARKET ANALYSIS BY DRUG CLASS FIGURE
    379. . FRANCE BREAST CANCER MARKET ANALYSIS BY REGIONAL FIGURE
    380. . RUSSIA BREAST CANCER MARKET ANALYSIS BY TYPE OF TREATMENT FIGURE
    381. . RUSSIA BREAST CANCER MARKET ANALYSIS BY DISEASE STAGE FIGURE
    382. . RUSSIA BREAST CANCER MARKET ANALYSIS BY END-USER FIGURE
    383. . RUSSIA BREAST CANCER MARKET ANALYSIS BY DRUG CLASS FIGURE
    384. . RUSSIA BREAST CANCER MARKET ANALYSIS BY REGIONAL FIGURE
    385. . ITALY BREAST CANCER MARKET ANALYSIS BY TYPE OF TREATMENT FIGURE
    386. . ITALY BREAST CANCER MARKET ANALYSIS BY DISEASE STAGE FIGURE
    387. . ITALY BREAST CANCER MARKET ANALYSIS BY END-USER FIGURE
    388. . ITALY BREAST CANCER MARKET ANALYSIS BY DRUG CLASS FIGURE
    389. . ITALY BREAST CANCER MARKET ANALYSIS BY REGIONAL FIGURE
    390. . SPAIN BREAST CANCER MARKET ANALYSIS BY TYPE OF TREATMENT FIGURE
    391. . SPAIN BREAST CANCER MARKET ANALYSIS BY DISEASE STAGE FIGURE
    392. . SPAIN BREAST CANCER MARKET ANALYSIS BY END-USER FIGURE
    393. . SPAIN BREAST CANCER MARKET ANALYSIS BY DRUG CLASS FIGURE
    394. . SPAIN BREAST CANCER MARKET ANALYSIS BY REGIONAL FIGURE
    395. . REST OF EUROPE BREAST CANCER MARKET ANALYSIS BY TYPE OF TREATMENT FIGURE
    396. . REST OF EUROPE BREAST CANCER MARKET ANALYSIS BY DISEASE STAGE FIGURE
    397. . REST OF EUROPE BREAST CANCER MARKET ANALYSIS BY END-USER FIGURE
    398. . REST OF EUROPE BREAST CANCER MARKET ANALYSIS BY DRUG CLASS FIGURE
    399. . REST OF EUROPE BREAST CANCER MARKET ANALYSIS BY REGIONAL FIGURE
    400. . APAC BREAST CANCER MARKET ANALYSIS FIGURE
    401. . CHINA BREAST CANCER MARKET ANALYSIS BY TYPE OF TREATMENT FIGURE
    402. . CHINA BREAST CANCER MARKET ANALYSIS BY DISEASE STAGE FIGURE
    403. . CHINA BREAST CANCER MARKET ANALYSIS BY END-USER FIGURE
    404. . CHINA BREAST CANCER MARKET ANALYSIS BY DRUG CLASS FIGURE
    405. . CHINA BREAST CANCER MARKET ANALYSIS BY REGIONAL FIGURE
    406. . INDIA BREAST CANCER MARKET ANALYSIS BY TYPE OF TREATMENT FIGURE
    407. . INDIA BREAST CANCER MARKET ANALYSIS BY DISEASE STAGE FIGURE
    408. . INDIA BREAST CANCER MARKET ANALYSIS BY END-USER FIGURE
    409. . INDIA BREAST CANCER MARKET ANALYSIS BY DRUG CLASS FIGURE
    410. . INDIA BREAST CANCER MARKET ANALYSIS BY REGIONAL FIGURE
    411. . JAPAN BREAST CANCER MARKET ANALYSIS BY TYPE OF TREATMENT FIGURE
    412. . JAPAN BREAST CANCER MARKET ANALYSIS BY DISEASE STAGE FIGURE
    413. . JAPAN BREAST CANCER MARKET ANALYSIS BY END-USER FIGURE
    414. . JAPAN BREAST CANCER MARKET ANALYSIS BY DRUG CLASS FIGURE
    415. . JAPAN BREAST CANCER MARKET ANALYSIS BY REGIONAL FIGURE
    416. . SOUTH KOREA BREAST CANCER MARKET ANALYSIS BY TYPE OF TREATMENT FIGURE
    417. . SOUTH KOREA BREAST CANCER MARKET ANALYSIS BY DISEASE STAGE FIGURE
    418. . SOUTH KOREA BREAST CANCER MARKET ANALYSIS BY END-USER FIGURE
    419. . SOUTH KOREA BREAST CANCER MARKET ANALYSIS BY DRUG CLASS FIGURE
    420. . SOUTH KOREA BREAST CANCER MARKET ANALYSIS BY REGIONAL FIGURE
    421. . MALAYSIA BREAST CANCER MARKET ANALYSIS BY TYPE OF TREATMENT FIGURE
    422. . MALAYSIA BREAST CANCER MARKET ANALYSIS BY DISEASE STAGE FIGURE
    423. . MALAYSIA BREAST CANCER MARKET ANALYSIS BY END-USER FIGURE
    424. . MALAYSIA BREAST CANCER MARKET ANALYSIS BY DRUG CLASS FIGURE
    425. . MALAYSIA BREAST CANCER MARKET ANALYSIS BY REGIONAL FIGURE
    426. . THAILAND BREAST CANCER MARKET ANALYSIS BY TYPE OF TREATMENT FIGURE
    427. . THAILAND BREAST CANCER MARKET ANALYSIS BY DISEASE STAGE FIGURE
    428. . THAILAND BREAST CANCER MARKET ANALYSIS BY END-USER FIGURE
    429. . THAILAND BREAST CANCER MARKET ANALYSIS BY DRUG CLASS FIGURE
    430. . THAILAND BREAST CANCER MARKET ANALYSIS BY REGIONAL FIGURE
    431. . INDONESIA BREAST CANCER MARKET ANALYSIS BY TYPE OF TREATMENT FIGURE
    432. . INDONESIA BREAST CANCER MARKET ANALYSIS BY DISEASE STAGE FIGURE
    433. . INDONESIA BREAST CANCER MARKET ANALYSIS BY END-USER FIGURE
    434. . INDONESIA BREAST CANCER MARKET ANALYSIS BY DRUG CLASS FIGURE
    435. . INDONESIA BREAST CANCER MARKET ANALYSIS BY REGIONAL FIGURE
    436. . REST OF APAC BREAST CANCER MARKET ANALYSIS BY TYPE OF TREATMENT FIGURE
    437. . REST OF APAC BREAST CANCER MARKET ANALYSIS BY DISEASE STAGE FIGURE
    438. . REST OF APAC BREAST CANCER MARKET ANALYSIS BY END-USER FIGURE
    439. . REST OF APAC BREAST CANCER MARKET ANALYSIS BY DRUG CLASS FIGURE
    440. . REST OF APAC BREAST CANCER MARKET ANALYSIS BY REGIONAL FIGURE
    441. . SOUTH AMERICA BREAST CANCER MARKET ANALYSIS FIGURE
    442. . BRAZIL BREAST CANCER MARKET ANALYSIS BY TYPE OF TREATMENT FIGURE
    443. . BRAZIL BREAST CANCER MARKET ANALYSIS BY DISEASE STAGE FIGURE
    444. . BRAZIL BREAST CANCER MARKET ANALYSIS BY END-USER FIGURE
    445. . BRAZIL BREAST CANCER MARKET ANALYSIS BY DRUG CLASS FIGURE
    446. . BRAZIL BREAST CANCER MARKET ANALYSIS BY REGIONAL FIGURE
    447. . MEXICO BREAST CANCER MARKET ANALYSIS BY TYPE OF TREATMENT FIGURE
    448. . MEXICO BREAST CANCER MARKET ANALYSIS BY DISEASE STAGE FIGURE
    449. . MEXICO BREAST CANCER MARKET ANALYSIS BY END-USER FIGURE
    450. . MEXICO BREAST CANCER MARKET ANALYSIS BY DRUG CLASS FIGURE
    451. . MEXICO BREAST CANCER MARKET ANALYSIS BY REGIONAL FIGURE
    452. . ARGENTINA BREAST CANCER MARKET ANALYSIS BY TYPE OF TREATMENT FIGURE
    453. . ARGENTINA BREAST CANCER MARKET ANALYSIS BY DISEASE STAGE FIGURE
    454. . ARGENTINA BREAST CANCER MARKET ANALYSIS BY END-USER FIGURE
    455. . ARGENTINA BREAST CANCER MARKET ANALYSIS BY DRUG CLASS FIGURE
    456. . ARGENTINA BREAST CANCER MARKET ANALYSIS BY REGIONAL FIGURE
    457. . REST OF SOUTH AMERICA BREAST CANCER MARKET ANALYSIS BY TYPE OF TREATMENT FIGURE
    458. . REST OF SOUTH AMERICA BREAST CANCER MARKET ANALYSIS BY DISEASE STAGE FIGURE
    459. . REST OF SOUTH AMERICA BREAST CANCER MARKET ANALYSIS BY END-USER FIGURE
    460. . REST OF SOUTH AMERICA BREAST CANCER MARKET ANALYSIS BY DRUG CLASS FIGURE
    461. . REST OF SOUTH AMERICA BREAST CANCER MARKET ANALYSIS BY REGIONAL FIGURE
    462. . MEA BREAST CANCER MARKET ANALYSIS FIGURE
    463. . GCC COUNTRIES BREAST CANCER MARKET ANALYSIS BY TYPE OF TREATMENT FIGURE
    464. . GCC COUNTRIES BREAST CANCER MARKET ANALYSIS BY DISEASE STAGE FIGURE
    465. . GCC COUNTRIES BREAST CANCER MARKET ANALYSIS BY END-USER FIGURE
    466. . GCC COUNTRIES BREAST CANCER MARKET ANALYSIS BY DRUG CLASS FIGURE
    467. . GCC COUNTRIES BREAST CANCER MARKET ANALYSIS BY REGIONAL FIGURE
    468. . SOUTH AFRICA BREAST CANCER MARKET ANALYSIS BY TYPE OF TREATMENT FIGURE
    469. . SOUTH AFRICA BREAST CANCER MARKET ANALYSIS BY DISEASE STAGE FIGURE
    470. . SOUTH AFRICA BREAST CANCER MARKET ANALYSIS BY END-USER FIGURE
    471. . SOUTH AFRICA BREAST CANCER MARKET ANALYSIS BY DRUG CLASS FIGURE
    472. . SOUTH AFRICA BREAST CANCER MARKET ANALYSIS BY REGIONAL FIGURE
    473. . REST OF MEA BREAST CANCER MARKET ANALYSIS BY TYPE OF TREATMENT FIGURE
    474. . REST OF MEA BREAST CANCER MARKET ANALYSIS BY DISEASE STAGE FIGURE
    475. . REST OF MEA BREAST CANCER MARKET ANALYSIS BY END-USER FIGURE
    476. . REST OF MEA BREAST CANCER MARKET ANALYSIS BY DRUG CLASS FIGURE
    477. . REST OF MEA BREAST CANCER MARKET ANALYSIS BY REGIONAL FIGURE
    478. . KEY BUYING CRITERIA OF BREAST CANCER MARKET FIGURE
    479. . RESEARCH PROCESS OF MRFR FIGURE
    480. . DRO ANALYSIS OF BREAST CANCER MARKET FIGURE
    481. . DRIVERS IMPACT ANALYSIS: BREAST CANCER MARKET FIGURE
    482. . RESTRAINTS IMPACT ANALYSIS: BREAST CANCER MARKET FIGURE
    483. . SUPPLY / VALUE CHAIN: BREAST CANCER MARKET FIGURE
    484. . BREAST CANCER MARKET, BY TYPE OF TREATMENT, 2025 (% SHARE) FIGURE
    485. . BREAST CANCER MARKET, BY TYPE OF TREATMENT, 2019 TO 2035 (USD Billions) FIGURE
    486. . BREAST CANCER MARKET, BY DISEASE STAGE, 2025 (% SHARE) FIGURE
    487. . BREAST CANCER MARKET, BY DISEASE STAGE, 2019 TO 2035 (USD Billions) FIGURE
    488. . BREAST CANCER MARKET, BY END-USER, 2025 (% SHARE) FIGURE
    489. . BREAST CANCER MARKET, BY END-USER, 2019 TO 2035 (USD Billions) FIGURE
    490. . BREAST CANCER MARKET, BY DRUG CLASS, 2025 (% SHARE) FIGURE
    491. . BREAST CANCER MARKET, BY DRUG CLASS, 2019 TO 2035 (USD Billions) FIGURE
    492. . BREAST CANCER MARKET, BY REGIONAL, 2025 (% SHARE) FIGURE
    493. . BREAST CANCER MARKET, BY REGIONAL, 2019 TO 2035 (USD Billions) FIGURE
    494. . BENCHMARKING OF MAJOR COMPETITORS
    495. List of Tables and Figures
      1. Table FIGURE 1. MARKET SYNOPSIS FIGURE 2. NORTH AMERICA BREAST CANCER MARKET ANALYSIS FIGURE 3. US BREAST CANCER MARKET ANALYSIS BY TYPE OF TREATMENT FIGURE 4. US BREAST CANCER MARKET ANALYSIS BY DISEASE STAGE FIGURE 5. US BREAST CANCER MARKET ANALYSIS BY END-USER FIGURE 6. US BREAST CANCER MARKET ANALYSIS BY DRUG CLASS FIGURE 7. US BREAST CANCER MARKET ANALYSIS BY REGIONAL FIGURE 8. CANADA BREAST CANCER MARKET ANALYSIS BY TYPE OF TREATMENT FIGURE 9. CANADA BREAST CANCER MARKET ANALYSIS BY DISEASE STAGE FIGURE 10. CANADA BREAST CANCER MARKET ANALYSIS BY END-USER FIGURE 11. CANADA BREAST CANCER MARKET ANALYSIS BY DRUG CLASS FIGURE 12. CANADA BREAST CANCER MARKET ANALYSIS BY REGIONAL FIGURE 13. EUROPE BREAST CANCER MARKET ANALYSIS FIGURE 14. GERMANY BREAST CANCER MARKET ANALYSIS BY TYPE OF TREATMENT FIGURE 15. GERMANY BREAST CANCER MARKET ANALYSIS BY DISEASE STAGE FIGURE 16. GERMANY BREAST CANCER MARKET ANALYSIS BY END-USER FIGURE 17. GERMANY BREAST CANCER MARKET ANALYSIS BY DRUG CLASS FIGURE 18. GERMANY BREAST CANCER MARKET ANALYSIS BY REGIONAL FIGURE 19. UK BREAST CANCER MARKET ANALYSIS BY TYPE OF TREATMENT FIGURE 20. UK BREAST CANCER MARKET ANALYSIS BY DISEASE STAGE FIGURE 21. UK BREAST CANCER MARKET ANALYSIS BY END-USER FIGURE 22. UK BREAST CANCER MARKET ANALYSIS BY DRUG CLASS FIGURE 23. UK BREAST CANCER MARKET ANALYSIS BY REGIONAL FIGURE 24. FRANCE BREAST CANCER MARKET ANALYSIS BY TYPE OF TREATMENT FIGURE 25. FRANCE BREAST CANCER MARKET ANALYSIS BY DISEASE STAGE FIGURE 26. FRANCE BREAST CANCER MARKET ANALYSIS BY END-USER FIGURE 27. FRANCE BREAST CANCER MARKET ANALYSIS BY DRUG CLASS FIGURE 28. FRANCE BREAST CANCER MARKET ANALYSIS BY REGIONAL FIGURE 29. RUSSIA BREAST CANCER MARKET ANALYSIS BY TYPE OF TREATMENT FIGURE 30. RUSSIA BREAST CANCER MARKET ANALYSIS BY DISEASE STAGE FIGURE 31. RUSSIA BREAST CANCER MARKET ANALYSIS BY END-USER FIGURE 32. RUSSIA BREAST CANCER MARKET ANALYSIS BY DRUG CLASS FIGURE 33. RUSSIA BREAST CANCER MARKET ANALYSIS BY REGIONAL FIGURE 34. ITALY BREAST CANCER MARKET ANALYSIS BY TYPE OF TREATMENT FIGURE 35. ITALY BREAST CANCER MARKET ANALYSIS BY DISEASE STAGE FIGURE 36. ITALY BREAST CANCER MARKET ANALYSIS BY END-USER FIGURE 37. ITALY BREAST CANCER MARKET ANALYSIS BY DRUG CLASS FIGURE 38. ITALY BREAST CANCER MARKET ANALYSIS BY REGIONAL FIGURE 39. SPAIN BREAST CANCER MARKET ANALYSIS BY TYPE OF TREATMENT FIGURE 40. SPAIN BREAST CANCER MARKET ANALYSIS BY DISEASE STAGE FIGURE 41. SPAIN BREAST CANCER MARKET ANALYSIS BY END-USER FIGURE 42. SPAIN BREAST CANCER MARKET ANALYSIS BY DRUG CLASS FIGURE 43. SPAIN BREAST CANCER MARKET ANALYSIS BY REGIONAL FIGURE 44. REST OF EUROPE BREAST CANCER MARKET ANALYSIS BY TYPE OF TREATMENT FIGURE 45. REST OF EUROPE BREAST CANCER MARKET ANALYSIS BY DISEASE STAGE FIGURE 46. REST OF EUROPE BREAST CANCER MARKET ANALYSIS BY END-USER FIGURE 47. REST OF EUROPE BREAST CANCER MARKET ANALYSIS BY DRUG CLASS FIGURE 48. REST OF EUROPE BREAST CANCER MARKET ANALYSIS BY REGIONAL FIGURE 49. APAC BREAST CANCER MARKET ANALYSIS FIGURE 50. CHINA BREAST CANCER MARKET ANALYSIS BY TYPE OF TREATMENT FIGURE 51. CHINA BREAST CANCER MARKET ANALYSIS BY DISEASE STAGE FIGURE 52. CHINA BREAST CANCER MARKET ANALYSIS BY END-USER FIGURE 53. CHINA BREAST CANCER MARKET ANALYSIS BY DRUG CLASS FIGURE 54. CHINA BREAST CANCER MARKET ANALYSIS BY REGIONAL FIGURE 55. INDIA BREAST CANCER MARKET ANALYSIS BY TYPE OF TREATMENT FIGURE 56. INDIA BREAST CANCER MARKET ANALYSIS BY DISEASE STAGE FIGURE 57. INDIA BREAST CANCER MARKET ANALYSIS BY END-USER FIGURE 58. INDIA BREAST CANCER MARKET ANALYSIS BY DRUG CLASS FIGURE 59. INDIA BREAST CANCER MARKET ANALYSIS BY REGIONAL FIGURE 60. JAPAN BREAST CANCER MARKET ANALYSIS BY TYPE OF TREATMENT FIGURE 61. JAPAN BREAST CANCER MARKET ANALYSIS BY DISEASE STAGE FIGURE 62. JAPAN BREAST CANCER MARKET ANALYSIS BY END-USER FIGURE 63. JAPAN BREAST CANCER MARKET ANALYSIS BY DRUG CLASS FIGURE 64. JAPAN BREAST CANCER MARKET ANALYSIS BY REGIONAL FIGURE 65. SOUTH KOREA BREAST CANCER MARKET ANALYSIS BY TYPE OF TREATMENT FIGURE 66. SOUTH KOREA BREAST CANCER MARKET ANALYSIS BY DISEASE STAGE FIGURE 67. SOUTH KOREA BREAST CANCER MARKET ANALYSIS BY END-USER FIGURE 68. SOUTH KOREA BREAST CANCER MARKET ANALYSIS BY DRUG CLASS FIGURE 69. SOUTH KOREA BREAST CANCER MARKET ANALYSIS BY REGIONAL FIGURE 70. MALAYSIA BREAST CANCER MARKET ANALYSIS BY TYPE OF TREATMENT FIGURE 71. MALAYSIA BREAST CANCER MARKET ANALYSIS BY DISEASE STAGE FIGURE 72. MALAYSIA BREAST CANCER MARKET ANALYSIS BY END-USER FIGURE 73. MALAYSIA BREAST CANCER MARKET ANALYSIS BY DRUG CLASS FIGURE 74. MALAYSIA BREAST CANCER MARKET ANALYSIS BY REGIONAL FIGURE 75. THAILAND BREAST CANCER MARKET ANALYSIS BY TYPE OF TREATMENT FIGURE 76. THAILAND BREAST CANCER MARKET ANALYSIS BY DISEASE STAGE FIGURE 77. THAILAND BREAST CANCER MARKET ANALYSIS BY END-USER FIGURE 78. THAILAND BREAST CANCER MARKET ANALYSIS BY DRUG CLASS FIGURE 79. THAILAND BREAST CANCER MARKET ANALYSIS BY REGIONAL FIGURE 80. INDONESIA BREAST CANCER MARKET ANALYSIS BY TYPE OF TREATMENT FIGURE 81. INDONESIA BREAST CANCER MARKET ANALYSIS BY DISEASE STAGE FIGURE 82. INDONESIA BREAST CANCER MARKET ANALYSIS BY END-USER FIGURE 83. INDONESIA BREAST CANCER MARKET ANALYSIS BY DRUG CLASS FIGURE 84. INDONESIA BREAST CANCER MARKET ANALYSIS BY REGIONAL FIGURE 85. REST OF APAC BREAST CANCER MARKET ANALYSIS BY TYPE OF TREATMENT FIGURE 86. REST OF APAC BREAST CANCER MARKET ANALYSIS BY DISEASE STAGE FIGURE 87. REST OF APAC BREAST CANCER MARKET ANALYSIS BY END-USER FIGURE 88. REST OF APAC BREAST CANCER MARKET ANALYSIS BY DRUG CLASS FIGURE 89. REST OF APAC BREAST CANCER MARKET ANALYSIS BY REGIONAL FIGURE 90. SOUTH AMERICA BREAST CANCER MARKET ANALYSIS FIGURE 91. BRAZIL BREAST CANCER MARKET ANALYSIS BY TYPE OF TREATMENT FIGURE 92. BRAZIL BREAST CANCER MARKET ANALYSIS BY DISEASE STAGE FIGURE 93. BRAZIL BREAST CANCER MARKET ANALYSIS BY END-USER FIGURE 94. BRAZIL BREAST CANCER MARKET ANALYSIS BY DRUG CLASS FIGURE 95. BRAZIL BREAST CANCER MARKET ANALYSIS BY REGIONAL FIGURE 96. MEXICO BREAST CANCER MARKET ANALYSIS BY TYPE OF TREATMENT FIGURE 97. MEXICO BREAST CANCER MARKET ANALYSIS BY DISEASE STAGE FIGURE 98. MEXICO BREAST CANCER MARKET ANALYSIS BY END-USER FIGURE 99. MEXICO BREAST CANCER MARKET ANALYSIS BY DRUG CLASS FIGURE 100. MEXICO BREAST CANCER MARKET ANALYSIS BY REGIONAL FIGURE 101. ARGENTINA BREAST CANCER MARKET ANALYSIS BY TYPE OF TREATMENT FIGURE 102. ARGENTINA BREAST CANCER MARKET ANALYSIS BY DISEASE STAGE FIGURE 103. ARGENTINA BREAST CANCER MARKET ANALYSIS BY END-USER FIGURE 104. ARGENTINA BREAST CANCER MARKET ANALYSIS BY DRUG CLASS FIGURE 105. ARGENTINA BREAST CANCER MARKET ANALYSIS BY REGIONAL FIGURE 106. REST OF SOUTH AMERICA BREAST CANCER MARKET ANALYSIS BY TYPE OF TREATMENT FIGURE 107. REST OF SOUTH AMERICA BREAST CANCER MARKET ANALYSIS BY DISEASE STAGE FIGURE 108. REST OF SOUTH AMERICA BREAST CANCER MARKET ANALYSIS BY END-USER FIGURE 109. REST OF SOUTH AMERICA BREAST CANCER MARKET ANALYSIS BY DRUG CLASS FIGURE 110. REST OF SOUTH AMERICA BREAST CANCER MARKET ANALYSIS BY REGIONAL FIGURE 111. MEA BREAST CANCER MARKET ANALYSIS FIGURE 112. GCC COUNTRIES BREAST CANCER MARKET ANALYSIS BY TYPE OF TREATMENT FIGURE 113. GCC COUNTRIES BREAST CANCER MARKET ANALYSIS BY DISEASE STAGE FIGURE 114. GCC COUNTRIES BREAST CANCER MARKET ANALYSIS BY END-USER FIGURE 115. GCC COUNTRIES BREAST CANCER MARKET ANALYSIS BY DRUG CLASS FIGURE 116. GCC COUNTRIES BREAST CANCER MARKET ANALYSIS BY REGIONAL FIGURE 117. SOUTH AFRICA BREAST CANCER MARKET ANALYSIS BY TYPE OF TREATMENT FIGURE 118. SOUTH AFRICA BREAST CANCER MARKET ANALYSIS BY DISEASE STAGE FIGURE 119. SOUTH AFRICA BREAST CANCER MARKET ANALYSIS BY END-USER FIGURE 120. SOUTH AFRICA BREAST CANCER MARKET ANALYSIS BY DRUG CLASS FIGURE 121. SOUTH AFRICA BREAST CANCER MARKET ANALYSIS BY REGIONAL FIGURE 122. REST OF MEA BREAST CANCER MARKET ANALYSIS BY TYPE OF TREATMENT FIGURE 123. REST OF MEA BREAST CANCER MARKET ANALYSIS BY DISEASE STAGE FIGURE 124. REST OF MEA BREAST CANCER MARKET ANALYSIS BY END-USER FIGURE 125. REST OF MEA BREAST CANCER MARKET ANALYSIS BY DRUG CLASS FIGURE 126. REST OF MEA BREAST CANCER MARKET ANALYSIS BY REGIONAL FIGURE 127. KEY BUYING CRITERIA OF BREAST CANCER MARKET FIGURE 128. RESEARCH PROCESS OF MRFR FIGURE 129. DRO ANALYSIS OF BREAST CANCER MARKET FIGURE 130. DRIVERS IMPACT ANALYSIS: BREAST CANCER MARKET FIGURE 131. RESTRAINTS IMPACT ANALYSIS: BREAST CANCER MARKET FIGURE 132. SUPPLY / VALUE CHAIN: BREAST CANCER MARKET FIGURE 133. BREAST CANCER MARKET, BY TYPE OF TREATMENT, 2025 (% SHARE) FIGURE 134. BREAST CANCER MARKET, BY TYPE OF TREATMENT, 2019 TO 2035 (USD Billions) FIGURE 135. BREAST CANCER MARKET, BY DISEASE STAGE, 2025 (% SHARE) FIGURE 136. BREAST CANCER MARKET, BY DISEASE STAGE, 2019 TO 2035 (USD Billions) FIGURE 137. BREAST CANCER MARKET, BY END-USER, 2025 (% SHARE) FIGURE 138. BREAST CANCER MARKET, BY END-USER, 2019 TO 2035 (USD Billions) FIGURE 139. BREAST CANCER MARKET, BY DRUG CLASS, 2025 (% SHARE) FIGURE 140. BREAST CANCER MARKET, BY DRUG CLASS, 2019 TO 2035 (USD Billions) FIGURE 141. BREAST CANCER MARKET, BY REGIONAL, 2025 (% SHARE) FIGURE 142. BREAST CANCER MARKET, BY REGIONAL, 2019 TO 2035 (USD Billions) FIGURE 143. BENCHMARKING OF MAJOR COMPETITORS
    496. Table FIGURE 1. MARKET SYNOPSIS FIGURE 2. NORTH AMERICA BREAST CANCER MARKET ANALYSIS FIGURE 3. US BREAST CANCER MARKET ANALYSIS BY TYPE OF TREATMENT FIGURE 4. US BREAST CANCER MARKET ANALYSIS BY DISEASE STAGE FIGURE 5. US BREAST CANCER MARKET ANALYSIS BY END-USER FIGURE 6. US BREAST CANCER MARKET ANALYSIS BY DRUG CLASS FIGURE 7. US BREAST CANCER MARKET ANALYSIS BY REGIONAL FIGURE 8. CANADA BREAST CANCER MARKET ANALYSIS BY TYPE OF TREATMENT FIGURE 9. CANADA BREAST CANCER MARKET ANALYSIS BY DISEASE STAGE FIGURE 10. CANADA BREAST CANCER MARKET ANALYSIS BY END-USER FIGURE 11. CANADA BREAST CANCER MARKET ANALYSIS BY DRUG CLASS FIGURE 12. CANADA BREAST CANCER MARKET ANALYSIS BY REGIONAL FIGURE 13. EUROPE BREAST CANCER MARKET ANALYSIS FIGURE 14. GERMANY BREAST CANCER MARKET ANALYSIS BY TYPE OF TREATMENT FIGURE 15. GERMANY BREAST CANCER MARKET ANALYSIS BY DISEASE STAGE FIGURE 16. GERMANY BREAST CANCER MARKET ANALYSIS BY END-USER FIGURE 17. GERMANY BREAST CANCER MARKET ANALYSIS BY DRUG CLASS FIGURE 18. GERMANY BREAST CANCER MARKET ANALYSIS BY REGIONAL FIGURE 19. UK BREAST CANCER MARKET ANALYSIS BY TYPE OF TREATMENT FIGURE 20. UK BREAST CANCER MARKET ANALYSIS BY DISEASE STAGE FIGURE 21. UK BREAST CANCER MARKET ANALYSIS BY END-USER FIGURE 22. UK BREAST CANCER MARKET ANALYSIS BY DRUG CLASS FIGURE 23. UK BREAST CANCER MARKET ANALYSIS BY REGIONAL FIGURE 24. FRANCE BREAST CANCER MARKET ANALYSIS BY TYPE OF TREATMENT FIGURE 25. FRANCE BREAST CANCER MARKET ANALYSIS BY DISEASE STAGE FIGURE 26. FRANCE BREAST CANCER MARKET ANALYSIS BY END-USER FIGURE 27. FRANCE BREAST CANCER MARKET ANALYSIS BY DRUG CLASS FIGURE 28. FRANCE BREAST CANCER MARKET ANALYSIS BY REGIONAL FIGURE 29. RUSSIA BREAST CANCER MARKET ANALYSIS BY TYPE OF TREATMENT FIGURE 30. RUSSIA BREAST CANCER MARKET ANALYSIS BY DISEASE STAGE FIGURE 31. RUSSIA BREAST CANCER MARKET ANALYSIS BY END-USER FIGURE 32. RUSSIA BREAST CANCER MARKET ANALYSIS BY DRUG CLASS FIGURE 33. RUSSIA BREAST CANCER MARKET ANALYSIS BY REGIONAL FIGURE 34. ITALY BREAST CANCER MARKET ANALYSIS BY TYPE OF TREATMENT FIGURE 35. ITALY BREAST CANCER MARKET ANALYSIS BY DISEASE STAGE FIGURE 36. ITALY BREAST CANCER MARKET ANALYSIS BY END-USER FIGURE 37. ITALY BREAST CANCER MARKET ANALYSIS BY DRUG CLASS FIGURE 38. ITALY BREAST CANCER MARKET ANALYSIS BY REGIONAL FIGURE 39. SPAIN BREAST CANCER MARKET ANALYSIS BY TYPE OF TREATMENT FIGURE 40. SPAIN BREAST CANCER MARKET ANALYSIS BY DISEASE STAGE FIGURE 41. SPAIN BREAST CANCER MARKET ANALYSIS BY END-USER FIGURE 42. SPAIN BREAST CANCER MARKET ANALYSIS BY DRUG CLASS FIGURE 43. SPAIN BREAST CANCER MARKET ANALYSIS BY REGIONAL FIGURE 44. REST OF EUROPE BREAST CANCER MARKET ANALYSIS BY TYPE OF TREATMENT FIGURE 45. REST OF EUROPE BREAST CANCER MARKET ANALYSIS BY DISEASE STAGE FIGURE 46. REST OF EUROPE BREAST CANCER MARKET ANALYSIS BY END-USER FIGURE 47. REST OF EUROPE BREAST CANCER MARKET ANALYSIS BY DRUG CLASS FIGURE 48. REST OF EUROPE BREAST CANCER MARKET ANALYSIS BY REGIONAL FIGURE 49. APAC BREAST CANCER MARKET ANALYSIS FIGURE 50. CHINA BREAST CANCER MARKET ANALYSIS BY TYPE OF TREATMENT FIGURE 51. CHINA BREAST CANCER MARKET ANALYSIS BY DISEASE STAGE FIGURE 52. CHINA BREAST CANCER MARKET ANALYSIS BY END-USER FIGURE 53. CHINA BREAST CANCER MARKET ANALYSIS BY DRUG CLASS FIGURE 54. CHINA BREAST CANCER MARKET ANALYSIS BY REGIONAL FIGURE 55. INDIA BREAST CANCER MARKET ANALYSIS BY TYPE OF TREATMENT FIGURE 56. INDIA BREAST CANCER MARKET ANALYSIS BY DISEASE STAGE FIGURE 57. INDIA BREAST CANCER MARKET ANALYSIS BY END-USER FIGURE 58. INDIA BREAST CANCER MARKET ANALYSIS BY DRUG CLASS FIGURE 59. INDIA BREAST CANCER MARKET ANALYSIS BY REGIONAL FIGURE 60. JAPAN BREAST CANCER MARKET ANALYSIS BY TYPE OF TREATMENT FIGURE 61. JAPAN BREAST CANCER MARKET ANALYSIS BY DISEASE STAGE FIGURE 62. JAPAN BREAST CANCER MARKET ANALYSIS BY END-USER FIGURE 63. JAPAN BREAST CANCER MARKET ANALYSIS BY DRUG CLASS FIGURE 64. JAPAN BREAST CANCER MARKET ANALYSIS BY REGIONAL FIGURE 65. SOUTH KOREA BREAST CANCER MARKET ANALYSIS BY TYPE OF TREATMENT FIGURE 66. SOUTH KOREA BREAST CANCER MARKET ANALYSIS BY DISEASE STAGE FIGURE 67. SOUTH KOREA BREAST CANCER MARKET ANALYSIS BY END-USER FIGURE 68. SOUTH KOREA BREAST CANCER MARKET ANALYSIS BY DRUG CLASS FIGURE 69. SOUTH KOREA BREAST CANCER MARKET ANALYSIS BY REGIONAL FIGURE 70. MALAYSIA BREAST CANCER MARKET ANALYSIS BY TYPE OF TREATMENT FIGURE 71. MALAYSIA BREAST CANCER MARKET ANALYSIS BY DISEASE STAGE FIGURE 72. MALAYSIA BREAST CANCER MARKET ANALYSIS BY END-USER FIGURE 73. MALAYSIA BREAST CANCER MARKET ANALYSIS BY DRUG CLASS FIGURE 74. MALAYSIA BREAST CANCER MARKET ANALYSIS BY REGIONAL FIGURE 75. THAILAND BREAST CANCER MARKET ANALYSIS BY TYPE OF TREATMENT FIGURE 76. THAILAND BREAST CANCER MARKET ANALYSIS BY DISEASE STAGE FIGURE 77. THAILAND BREAST CANCER MARKET ANALYSIS BY END-USER FIGURE 78. THAILAND BREAST CANCER MARKET ANALYSIS BY DRUG CLASS FIGURE 79. THAILAND BREAST CANCER MARKET ANALYSIS BY REGIONAL FIGURE 80. INDONESIA BREAST CANCER MARKET ANALYSIS BY TYPE OF TREATMENT FIGURE 81. INDONESIA BREAST CANCER MARKET ANALYSIS BY DISEASE STAGE FIGURE 82. INDONESIA BREAST CANCER MARKET ANALYSIS BY END-USER FIGURE 83. INDONESIA BREAST CANCER MARKET ANALYSIS BY DRUG CLASS FIGURE 84. INDONESIA BREAST CANCER MARKET ANALYSIS BY REGIONAL FIGURE 85. REST OF APAC BREAST CANCER MARKET ANALYSIS BY TYPE OF TREATMENT FIGURE 86. REST OF APAC BREAST CANCER MARKET ANALYSIS BY DISEASE STAGE FIGURE 87. REST OF APAC BREAST CANCER MARKET ANALYSIS BY END-USER FIGURE 88. REST OF APAC BREAST CANCER MARKET ANALYSIS BY DRUG CLASS FIGURE 89. REST OF APAC BREAST CANCER MARKET ANALYSIS BY REGIONAL FIGURE 90. SOUTH AMERICA BREAST CANCER MARKET ANALYSIS FIGURE 91. BRAZIL BREAST CANCER MARKET ANALYSIS BY TYPE OF TREATMENT FIGURE 92. BRAZIL BREAST CANCER MARKET ANALYSIS BY DISEASE STAGE FIGURE 93. BRAZIL BREAST CANCER MARKET ANALYSIS BY END-USER FIGURE 94. BRAZIL BREAST CANCER MARKET ANALYSIS BY DRUG CLASS FIGURE 95. BRAZIL BREAST CANCER MARKET ANALYSIS BY REGIONAL FIGURE 96. MEXICO BREAST CANCER MARKET ANALYSIS BY TYPE OF TREATMENT FIGURE 97. MEXICO BREAST CANCER MARKET ANALYSIS BY DISEASE STAGE FIGURE 98. MEXICO BREAST CANCER MARKET ANALYSIS BY END-USER FIGURE 99. MEXICO BREAST CANCER MARKET ANALYSIS BY DRUG CLASS FIGURE 100. MEXICO BREAST CANCER MARKET ANALYSIS BY REGIONAL FIGURE 101. ARGENTINA BREAST CANCER MARKET ANALYSIS BY TYPE OF TREATMENT FIGURE 102. ARGENTINA BREAST CANCER MARKET ANALYSIS BY DISEASE STAGE FIGURE 103. ARGENTINA BREAST CANCER MARKET ANALYSIS BY END-USER FIGURE 104. ARGENTINA BREAST CANCER MARKET ANALYSIS BY DRUG CLASS FIGURE 105. ARGENTINA BREAST CANCER MARKET ANALYSIS BY REGIONAL FIGURE 106. REST OF SOUTH AMERICA BREAST CANCER MARKET ANALYSIS BY TYPE OF TREATMENT FIGURE 107. REST OF SOUTH AMERICA BREAST CANCER MARKET ANALYSIS BY DISEASE STAGE FIGURE 108. REST OF SOUTH AMERICA BREAST CANCER MARKET ANALYSIS BY END-USER FIGURE 109. REST OF SOUTH AMERICA BREAST CANCER MARKET ANALYSIS BY DRUG CLASS FIGURE 110. REST OF SOUTH AMERICA BREAST CANCER MARKET ANALYSIS BY REGIONAL FIGURE 111. MEA BREAST CANCER MARKET ANALYSIS FIGURE 112. GCC COUNTRIES BREAST CANCER MARKET ANALYSIS BY TYPE OF TREATMENT FIGURE 113. GCC COUNTRIES BREAST CANCER MARKET ANALYSIS BY DISEASE STAGE FIGURE 114. GCC COUNTRIES BREAST CANCER MARKET ANALYSIS BY END-USER FIGURE 115. GCC COUNTRIES BREAST CANCER MARKET ANALYSIS BY DRUG CLASS FIGURE 116. GCC COUNTRIES BREAST CANCER MARKET ANALYSIS BY REGIONAL FIGURE 117. SOUTH AFRICA BREAST CANCER MARKET ANALYSIS BY TYPE OF TREATMENT FIGURE 118. SOUTH AFRICA BREAST CANCER MARKET ANALYSIS BY DISEASE STAGE FIGURE 119. SOUTH AFRICA BREAST CANCER MARKET ANALYSIS BY END-USER FIGURE 120. SOUTH AFRICA BREAST CANCER MARKET ANALYSIS BY DRUG CLASS FIGURE 121. SOUTH AFRICA BREAST CANCER MARKET ANALYSIS BY REGIONAL FIGURE 122. REST OF MEA BREAST CANCER MARKET ANALYSIS BY TYPE OF TREATMENT FIGURE 123. REST OF MEA BREAST CANCER MARKET ANALYSIS BY DISEASE STAGE FIGURE 124. REST OF MEA BREAST CANCER MARKET ANALYSIS BY END-USER FIGURE 125. REST OF MEA BREAST CANCER MARKET ANALYSIS BY DRUG CLASS FIGURE 126. REST OF MEA BREAST CANCER MARKET ANALYSIS BY REGIONAL FIGURE 127. KEY BUYING CRITERIA OF BREAST CANCER MARKET FIGURE 128. RESEARCH PROCESS OF MRFR FIGURE 129. DRO ANALYSIS OF BREAST CANCER MARKET FIGURE 130. DRIVERS IMPACT ANALYSIS: BREAST CANCER MARKET FIGURE 131. RESTRAINTS IMPACT ANALYSIS: BREAST CANCER MARKET FIGURE 132. SUPPLY / VALUE CHAIN: BREAST CANCER MARKET FIGURE 133. BREAST CANCER MARKET, BY TYPE OF TREATMENT, 2025 (% SHARE) FIGURE 134. BREAST CANCER MARKET, BY TYPE OF TREATMENT, 2019 TO 2035 (USD Billions) FIGURE 135. BREAST CANCER MARKET, BY DISEASE STAGE, 2025 (% SHARE) FIGURE 136. BREAST CANCER MARKET, BY DISEASE STAGE, 2019 TO 2035 (USD Billions) FIGURE 137. BREAST CANCER MARKET, BY END-USER, 2025 (% SHARE) FIGURE 138. BREAST CANCER MARKET, BY END-USER, 2019 TO 2035 (USD Billions) FIGURE 139. BREAST CANCER MARKET, BY DRUG CLASS, 2025 (% SHARE) FIGURE 140. BREAST CANCER MARKET, BY DRUG CLASS, 2019 TO 2035 (USD Billions) FIGURE 141. BREAST CANCER MARKET, BY REGIONAL, 2025 (% SHARE) FIGURE 142. BREAST CANCER MARKET, BY REGIONAL, 2019 TO 2035 (USD Billions) FIGURE 143. BENCHMARKING OF MAJOR COMPETITORS

    Breast Cancer Market Segmentation

    • Breast Cancer Market By Type of Treatment (USD Billion, 2019-2035) 
      • Chemotherapy
      • Radiation Therapy
      • Targeted Therapy
      • Immunotherapy
      • Hormonal Therapy


    • Breast Cancer Market By Disease Stage (USD Billion, 2019-2035) 
      • Stage 0
      • Stage I
      • Stage II
      • Stage III
      • Stage IV


    • Breast Cancer Market By End-User (USD Billion, 2019-2035) 
      • Hospitals
      • Outpatient Clinics
      • Homecare Settings
      • Research Institutes


    • Breast Cancer Market By Drug Class (USD Billion, 2019-2035) 
      • Taxanes
      • Anthracyclines
      • Hormonal Agents
      • Monoclonal Antibodies


    • Breast Cancer Market By Regional (USD Billion, 2019-2035) 
      • North America
      • Europe
      • South America
      • Asia Pacific
      • Middle East and Africa


    Breast Cancer Market Regional Outlook (USD Billion, 2019-2035)


    • North America Outlook (USD Billion, 2019-2035)
      • North America Breast Cancer Market by Type of Treatment Type
        • Chemotherapy
        • Radiation Therapy
        • Targeted Therapy
        • Immunotherapy
        • Hormonal Therapy
      • North America Breast Cancer Market by Disease Stage Type
        • Stage 0
        • Stage I
        • Stage II
        • Stage III
        • Stage IV
      • North America Breast Cancer Market by End-User Type
        • Hospitals
        • Outpatient Clinics
        • Homecare Settings
        • Research Institutes
      • North America Breast Cancer Market by Drug Class Type
        • Taxanes
        • Anthracyclines
        • Hormonal Agents
        • Monoclonal Antibodies
      • North America Breast Cancer Market by Regional Type
        • US
        • Canada
      • US Outlook (USD Billion, 2019-2035)
      • US Breast Cancer Market by Type of Treatment Type
        • Chemotherapy
        • Radiation Therapy
        • Targeted Therapy
        • Immunotherapy
        • Hormonal Therapy
      • US Breast Cancer Market by Disease Stage Type
        • Stage 0
        • Stage I
        • Stage II
        • Stage III
        • Stage IV
      • US Breast Cancer Market by End-User Type
        • Hospitals
        • Outpatient Clinics
        • Homecare Settings
        • Research Institutes
      • US Breast Cancer Market by Drug Class Type
        • Taxanes
        • Anthracyclines
        • Hormonal Agents
        • Monoclonal Antibodies
      • CANADA Outlook (USD Billion, 2019-2035)
      • CANADA Breast Cancer Market by Type of Treatment Type
        • Chemotherapy
        • Radiation Therapy
        • Targeted Therapy
        • Immunotherapy
        • Hormonal Therapy
      • CANADA Breast Cancer Market by Disease Stage Type
        • Stage 0
        • Stage I
        • Stage II
        • Stage III
        • Stage IV
      • CANADA Breast Cancer Market by End-User Type
        • Hospitals
        • Outpatient Clinics
        • Homecare Settings
        • Research Institutes
      • CANADA Breast Cancer Market by Drug Class Type
        • Taxanes
        • Anthracyclines
        • Hormonal Agents
        • Monoclonal Antibodies
      • Europe Outlook (USD Billion, 2019-2035)
        • Europe Breast Cancer Market by Type of Treatment Type
          • Chemotherapy
          • Radiation Therapy
          • Targeted Therapy
          • Immunotherapy
          • Hormonal Therapy
        • Europe Breast Cancer Market by Disease Stage Type
          • Stage 0
          • Stage I
          • Stage II
          • Stage III
          • Stage IV
        • Europe Breast Cancer Market by End-User Type
          • Hospitals
          • Outpatient Clinics
          • Homecare Settings
          • Research Institutes
        • Europe Breast Cancer Market by Drug Class Type
          • Taxanes
          • Anthracyclines
          • Hormonal Agents
          • Monoclonal Antibodies
        • Europe Breast Cancer Market by Regional Type
          • Germany
          • UK
          • France
          • Russia
          • Italy
          • Spain
          • Rest of Europe
        • GERMANY Outlook (USD Billion, 2019-2035)
        • GERMANY Breast Cancer Market by Type of Treatment Type
          • Chemotherapy
          • Radiation Therapy
          • Targeted Therapy
          • Immunotherapy
          • Hormonal Therapy
        • GERMANY Breast Cancer Market by Disease Stage Type
          • Stage 0
          • Stage I
          • Stage II
          • Stage III
          • Stage IV
        • GERMANY Breast Cancer Market by End-User Type
          • Hospitals
          • Outpatient Clinics
          • Homecare Settings
          • Research Institutes
        • GERMANY Breast Cancer Market by Drug Class Type
          • Taxanes
          • Anthracyclines
          • Hormonal Agents
          • Monoclonal Antibodies
        • UK Outlook (USD Billion, 2019-2035)
        • UK Breast Cancer Market by Type of Treatment Type
          • Chemotherapy
          • Radiation Therapy
          • Targeted Therapy
          • Immunotherapy
          • Hormonal Therapy
        • UK Breast Cancer Market by Disease Stage Type
          • Stage 0
          • Stage I
          • Stage II
          • Stage III
          • Stage IV
        • UK Breast Cancer Market by End-User Type
          • Hospitals
          • Outpatient Clinics
          • Homecare Settings
          • Research Institutes
        • UK Breast Cancer Market by Drug Class Type
          • Taxanes
          • Anthracyclines
          • Hormonal Agents
          • Monoclonal Antibodies
        • FRANCE Outlook (USD Billion, 2019-2035)
        • FRANCE Breast Cancer Market by Type of Treatment Type
          • Chemotherapy
          • Radiation Therapy
          • Targeted Therapy
          • Immunotherapy
          • Hormonal Therapy
        • FRANCE Breast Cancer Market by Disease Stage Type
          • Stage 0
          • Stage I
          • Stage II
          • Stage III
          • Stage IV
        • FRANCE Breast Cancer Market by End-User Type
          • Hospitals
          • Outpatient Clinics
          • Homecare Settings
          • Research Institutes
        • FRANCE Breast Cancer Market by Drug Class Type
          • Taxanes
          • Anthracyclines
          • Hormonal Agents
          • Monoclonal Antibodies
        • RUSSIA Outlook (USD Billion, 2019-2035)
        • RUSSIA Breast Cancer Market by Type of Treatment Type
          • Chemotherapy
          • Radiation Therapy
          • Targeted Therapy
          • Immunotherapy
          • Hormonal Therapy
        • RUSSIA Breast Cancer Market by Disease Stage Type
          • Stage 0
          • Stage I
          • Stage II
          • Stage III
          • Stage IV
        • RUSSIA Breast Cancer Market by End-User Type
          • Hospitals
          • Outpatient Clinics
          • Homecare Settings
          • Research Institutes
        • RUSSIA Breast Cancer Market by Drug Class Type
          • Taxanes
          • Anthracyclines
          • Hormonal Agents
          • Monoclonal Antibodies
        • ITALY Outlook (USD Billion, 2019-2035)
        • ITALY Breast Cancer Market by Type of Treatment Type
          • Chemotherapy
          • Radiation Therapy
          • Targeted Therapy
          • Immunotherapy
          • Hormonal Therapy
        • ITALY Breast Cancer Market by Disease Stage Type
          • Stage 0
          • Stage I
          • Stage II
          • Stage III
          • Stage IV
        • ITALY Breast Cancer Market by End-User Type
          • Hospitals
          • Outpatient Clinics
          • Homecare Settings
          • Research Institutes
        • ITALY Breast Cancer Market by Drug Class Type
          • Taxanes
          • Anthracyclines
          • Hormonal Agents
          • Monoclonal Antibodies
        • SPAIN Outlook (USD Billion, 2019-2035)
        • SPAIN Breast Cancer Market by Type of Treatment Type
          • Chemotherapy
          • Radiation Therapy
          • Targeted Therapy
          • Immunotherapy
          • Hormonal Therapy
        • SPAIN Breast Cancer Market by Disease Stage Type
          • Stage 0
          • Stage I
          • Stage II
          • Stage III
          • Stage IV
        • SPAIN Breast Cancer Market by End-User Type
          • Hospitals
          • Outpatient Clinics
          • Homecare Settings
          • Research Institutes
        • SPAIN Breast Cancer Market by Drug Class Type
          • Taxanes
          • Anthracyclines
          • Hormonal Agents
          • Monoclonal Antibodies
        • REST OF EUROPE Outlook (USD Billion, 2019-2035)
        • REST OF EUROPE Breast Cancer Market by Type of Treatment Type
          • Chemotherapy
          • Radiation Therapy
          • Targeted Therapy
          • Immunotherapy
          • Hormonal Therapy
        • REST OF EUROPE Breast Cancer Market by Disease Stage Type
          • Stage 0
          • Stage I
          • Stage II
          • Stage III
          • Stage IV
        • REST OF EUROPE Breast Cancer Market by End-User Type
          • Hospitals
          • Outpatient Clinics
          • Homecare Settings
          • Research Institutes
        • REST OF EUROPE Breast Cancer Market by Drug Class Type
          • Taxanes
          • Anthracyclines
          • Hormonal Agents
          • Monoclonal Antibodies
        • APAC Outlook (USD Billion, 2019-2035)
          • APAC Breast Cancer Market by Type of Treatment Type
            • Chemotherapy
            • Radiation Therapy
            • Targeted Therapy
            • Immunotherapy
            • Hormonal Therapy
          • APAC Breast Cancer Market by Disease Stage Type
            • Stage 0
            • Stage I
            • Stage II
            • Stage III
            • Stage IV
          • APAC Breast Cancer Market by End-User Type
            • Hospitals
            • Outpatient Clinics
            • Homecare Settings
            • Research Institutes
          • APAC Breast Cancer Market by Drug Class Type
            • Taxanes
            • Anthracyclines
            • Hormonal Agents
            • Monoclonal Antibodies
          • APAC Breast Cancer Market by Regional Type
            • China
            • India
            • Japan
            • South Korea
            • Malaysia
            • Thailand
            • Indonesia
            • Rest of APAC
          • CHINA Outlook (USD Billion, 2019-2035)
          • CHINA Breast Cancer Market by Type of Treatment Type
            • Chemotherapy
            • Radiation Therapy
            • Targeted Therapy
            • Immunotherapy
            • Hormonal Therapy
          • CHINA Breast Cancer Market by Disease Stage Type
            • Stage 0
            • Stage I
            • Stage II
            • Stage III
            • Stage IV
          • CHINA Breast Cancer Market by End-User Type
            • Hospitals
            • Outpatient Clinics
            • Homecare Settings
            • Research Institutes
          • CHINA Breast Cancer Market by Drug Class Type
            • Taxanes
            • Anthracyclines
            • Hormonal Agents
            • Monoclonal Antibodies
          • INDIA Outlook (USD Billion, 2019-2035)
          • INDIA Breast Cancer Market by Type of Treatment Type
            • Chemotherapy
            • Radiation Therapy
            • Targeted Therapy
            • Immunotherapy
            • Hormonal Therapy
          • INDIA Breast Cancer Market by Disease Stage Type
            • Stage 0
            • Stage I
            • Stage II
            • Stage III
            • Stage IV
          • INDIA Breast Cancer Market by End-User Type
            • Hospitals
            • Outpatient Clinics
            • Homecare Settings
            • Research Institutes
          • INDIA Breast Cancer Market by Drug Class Type
            • Taxanes
            • Anthracyclines
            • Hormonal Agents
            • Monoclonal Antibodies
          • JAPAN Outlook (USD Billion, 2019-2035)
          • JAPAN Breast Cancer Market by Type of Treatment Type
            • Chemotherapy
            • Radiation Therapy
            • Targeted Therapy
            • Immunotherapy
            • Hormonal Therapy
          • JAPAN Breast Cancer Market by Disease Stage Type
            • Stage 0
            • Stage I
            • Stage II
            • Stage III
            • Stage IV
          • JAPAN Breast Cancer Market by End-User Type
            • Hospitals
            • Outpatient Clinics
            • Homecare Settings
            • Research Institutes
          • JAPAN Breast Cancer Market by Drug Class Type
            • Taxanes
            • Anthracyclines
            • Hormonal Agents
            • Monoclonal Antibodies
          • SOUTH KOREA Outlook (USD Billion, 2019-2035)
          • SOUTH KOREA Breast Cancer Market by Type of Treatment Type
            • Chemotherapy
            • Radiation Therapy
            • Targeted Therapy
            • Immunotherapy
            • Hormonal Therapy
          • SOUTH KOREA Breast Cancer Market by Disease Stage Type
            • Stage 0
            • Stage I
            • Stage II
            • Stage III
            • Stage IV
          • SOUTH KOREA Breast Cancer Market by End-User Type
            • Hospitals
            • Outpatient Clinics
            • Homecare Settings
            • Research Institutes
          • SOUTH KOREA Breast Cancer Market by Drug Class Type
            • Taxanes
            • Anthracyclines
            • Hormonal Agents
            • Monoclonal Antibodies
          • MALAYSIA Outlook (USD Billion, 2019-2035)
          • MALAYSIA Breast Cancer Market by Type of Treatment Type
            • Chemotherapy
            • Radiation Therapy
            • Targeted Therapy
            • Immunotherapy
            • Hormonal Therapy
          • MALAYSIA Breast Cancer Market by Disease Stage Type
            • Stage 0
            • Stage I
            • Stage II
            • Stage III
            • Stage IV
          • MALAYSIA Breast Cancer Market by End-User Type
            • Hospitals
            • Outpatient Clinics
            • Homecare Settings
            • Research Institutes
          • MALAYSIA Breast Cancer Market by Drug Class Type
            • Taxanes
            • Anthracyclines
            • Hormonal Agents
            • Monoclonal Antibodies
          • THAILAND Outlook (USD Billion, 2019-2035)
          • THAILAND Breast Cancer Market by Type of Treatment Type
            • Chemotherapy
            • Radiation Therapy
            • Targeted Therapy
            • Immunotherapy
            • Hormonal Therapy
          • THAILAND Breast Cancer Market by Disease Stage Type
            • Stage 0
            • Stage I
            • Stage II
            • Stage III
            • Stage IV
          • THAILAND Breast Cancer Market by End-User Type
            • Hospitals
            • Outpatient Clinics
            • Homecare Settings
            • Research Institutes
          • THAILAND Breast Cancer Market by Drug Class Type
            • Taxanes
            • Anthracyclines
            • Hormonal Agents
            • Monoclonal Antibodies
          • INDONESIA Outlook (USD Billion, 2019-2035)
          • INDONESIA Breast Cancer Market by Type of Treatment Type
            • Chemotherapy
            • Radiation Therapy
            • Targeted Therapy
            • Immunotherapy
            • Hormonal Therapy
          • INDONESIA Breast Cancer Market by Disease Stage Type
            • Stage 0
            • Stage I
            • Stage II
            • Stage III
            • Stage IV
          • INDONESIA Breast Cancer Market by End-User Type
            • Hospitals
            • Outpatient Clinics
            • Homecare Settings
            • Research Institutes
          • INDONESIA Breast Cancer Market by Drug Class Type
            • Taxanes
            • Anthracyclines
            • Hormonal Agents
            • Monoclonal Antibodies
          • REST OF APAC Outlook (USD Billion, 2019-2035)
          • REST OF APAC Breast Cancer Market by Type of Treatment Type
            • Chemotherapy
            • Radiation Therapy
            • Targeted Therapy
            • Immunotherapy
            • Hormonal Therapy
          • REST OF APAC Breast Cancer Market by Disease Stage Type
            • Stage 0
            • Stage I
            • Stage II
            • Stage III
            • Stage IV
          • REST OF APAC Breast Cancer Market by End-User Type
            • Hospitals
            • Outpatient Clinics
            • Homecare Settings
            • Research Institutes
          • REST OF APAC Breast Cancer Market by Drug Class Type
            • Taxanes
            • Anthracyclines
            • Hormonal Agents
            • Monoclonal Antibodies
          • South America Outlook (USD Billion, 2019-2035)
            • South America Breast Cancer Market by Type of Treatment Type
              • Chemotherapy
              • Radiation Therapy
              • Targeted Therapy
              • Immunotherapy
              • Hormonal Therapy
            • South America Breast Cancer Market by Disease Stage Type
              • Stage 0
              • Stage I
              • Stage II
              • Stage III
              • Stage IV
            • South America Breast Cancer Market by End-User Type
              • Hospitals
              • Outpatient Clinics
              • Homecare Settings
              • Research Institutes
            • South America Breast Cancer Market by Drug Class Type
              • Taxanes
              • Anthracyclines
              • Hormonal Agents
              • Monoclonal Antibodies
            • South America Breast Cancer Market by Regional Type
              • Brazil
              • Mexico
              • Argentina
              • Rest of South America
            • BRAZIL Outlook (USD Billion, 2019-2035)
            • BRAZIL Breast Cancer Market by Type of Treatment Type
              • Chemotherapy
              • Radiation Therapy
              • Targeted Therapy
              • Immunotherapy
              • Hormonal Therapy
            • BRAZIL Breast Cancer Market by Disease Stage Type
              • Stage 0
              • Stage I
              • Stage II
              • Stage III
              • Stage IV
            • BRAZIL Breast Cancer Market by End-User Type
              • Hospitals
              • Outpatient Clinics
              • Homecare Settings
              • Research Institutes
            • BRAZIL Breast Cancer Market by Drug Class Type
              • Taxanes
              • Anthracyclines
              • Hormonal Agents
              • Monoclonal Antibodies
            • MEXICO Outlook (USD Billion, 2019-2035)
            • MEXICO Breast Cancer Market by Type of Treatment Type
              • Chemotherapy
              • Radiation Therapy
              • Targeted Therapy
              • Immunotherapy
              • Hormonal Therapy
            • MEXICO Breast Cancer Market by Disease Stage Type
              • Stage 0
              • Stage I
              • Stage II
              • Stage III
              • Stage IV
            • MEXICO Breast Cancer Market by End-User Type
              • Hospitals
              • Outpatient Clinics
              • Homecare Settings
              • Research Institutes
            • MEXICO Breast Cancer Market by Drug Class Type
              • Taxanes
              • Anthracyclines
              • Hormonal Agents
              • Monoclonal Antibodies
            • ARGENTINA Outlook (USD Billion, 2019-2035)
            • ARGENTINA Breast Cancer Market by Type of Treatment Type
              • Chemotherapy
              • Radiation Therapy
              • Targeted Therapy
              • Immunotherapy
              • Hormonal Therapy
            • ARGENTINA Breast Cancer Market by Disease Stage Type
              • Stage 0
              • Stage I
              • Stage II
              • Stage III
              • Stage IV
            • ARGENTINA Breast Cancer Market by End-User Type
              • Hospitals
              • Outpatient Clinics
              • Homecare Settings
              • Research Institutes
            • ARGENTINA Breast Cancer Market by Drug Class Type
              • Taxanes
              • Anthracyclines
              • Hormonal Agents
              • Monoclonal Antibodies
            • REST OF SOUTH AMERICA Outlook (USD Billion, 2019-2035)
            • REST OF SOUTH AMERICA Breast Cancer Market by Type of Treatment Type
              • Chemotherapy
              • Radiation Therapy
              • Targeted Therapy
              • Immunotherapy
              • Hormonal Therapy
            • REST OF SOUTH AMERICA Breast Cancer Market by Disease Stage Type
              • Stage 0
              • Stage I
              • Stage II
              • Stage III
              • Stage IV
            • REST OF SOUTH AMERICA Breast Cancer Market by End-User Type
              • Hospitals
              • Outpatient Clinics
              • Homecare Settings
              • Research Institutes
            • REST OF SOUTH AMERICA Breast Cancer Market by Drug Class Type
              • Taxanes
              • Anthracyclines
              • Hormonal Agents
              • Monoclonal Antibodies
            • MEA Outlook (USD Billion, 2019-2035)
              • MEA Breast Cancer Market by Type of Treatment Type
                • Chemotherapy
                • Radiation Therapy
                • Targeted Therapy
                • Immunotherapy
                • Hormonal Therapy
              • MEA Breast Cancer Market by Disease Stage Type
                • Stage 0
                • Stage I
                • Stage II
                • Stage III
                • Stage IV
              • MEA Breast Cancer Market by End-User Type
                • Hospitals
                • Outpatient Clinics
                • Homecare Settings
                • Research Institutes
              • MEA Breast Cancer Market by Drug Class Type
                • Taxanes
                • Anthracyclines
                • Hormonal Agents
                • Monoclonal Antibodies
              • MEA Breast Cancer Market by Regional Type
                • GCC Countries
                • South Africa
                • Rest of MEA
              • GCC COUNTRIES Outlook (USD Billion, 2019-2035)
              • GCC COUNTRIES Breast Cancer Market by Type of Treatment Type
                • Chemotherapy
                • Radiation Therapy
                • Targeted Therapy
                • Immunotherapy
                • Hormonal Therapy
              • GCC COUNTRIES Breast Cancer Market by Disease Stage Type
                • Stage 0
                • Stage I
                • Stage II
                • Stage III
                • Stage IV
              • GCC COUNTRIES Breast Cancer Market by End-User Type
                • Hospitals
                • Outpatient Clinics
                • Homecare Settings
                • Research Institutes
              • GCC COUNTRIES Breast Cancer Market by Drug Class Type
                • Taxanes
                • Anthracyclines
                • Hormonal Agents
                • Monoclonal Antibodies
              • SOUTH AFRICA Outlook (USD Billion, 2019-2035)
              • SOUTH AFRICA Breast Cancer Market by Type of Treatment Type
                • Chemotherapy
                • Radiation Therapy
                • Targeted Therapy
                • Immunotherapy
                • Hormonal Therapy
              • SOUTH AFRICA Breast Cancer Market by Disease Stage Type
                • Stage 0
                • Stage I
                • Stage II
                • Stage III
                • Stage IV
              • SOUTH AFRICA Breast Cancer Market by End-User Type
                • Hospitals
                • Outpatient Clinics
                • Homecare Settings
                • Research Institutes
              • SOUTH AFRICA Breast Cancer Market by Drug Class Type
                • Taxanes
                • Anthracyclines
                • Hormonal Agents
                • Monoclonal Antibodies
              • REST OF MEA Outlook (USD Billion, 2019-2035)
              • REST OF MEA Breast Cancer Market by Type of Treatment Type
                • Chemotherapy
                • Radiation Therapy
                • Targeted Therapy
                • Immunotherapy
                • Hormonal Therapy
              • REST OF MEA Breast Cancer Market by Disease Stage Type
                • Stage 0
                • Stage I
                • Stage II
                • Stage III
                • Stage IV
              • REST OF MEA Breast Cancer Market by End-User Type
                • Hospitals
                • Outpatient Clinics
                • Homecare Settings
                • Research Institutes
              • REST OF MEA Breast Cancer Market by Drug Class Type
                • Taxanes
                • Anthracyclines
                • Hormonal Agents
                • Monoclonal Antibodies


    Infographic

    Free Sample Request

    Kindly complete the form below to receive a free sample of this Report

    Get Free Sample

    Customer Strories

    “I am very pleased with how market segments have been defined in a relevant way for my purposes (such as "Portable Freezers & refrigerators" and "last-mile"). In general the report is well structured. Thanks very much for your efforts.”

    Victoria Milne

    Founder
    Case Study
    Chemicals and Materials