• Cat-intel
  • MedIntelliX
  • Resources
  • About Us
  • Request Free Sample ×

    Kindly complete the form below to receive a free sample of this Report

    Leading companies partner with us for data-driven Insights

    clients tt-cursor

    Geographic Atrophy GA Market

    ID: MRFR/HC/9297-HCR
    120 Pages
    Kinjoll Dey
    September 2025

    Geographic Atrophy (GA) Market Research Report Information By Age Group (Above 60 Years and Above 75 Years), By Diagnosis (Fundus Autofluorescence (FAF), Optical Coherence Tomography Angiography (OCT-A), and Multifocal Electroretinography (MfERG)), By Therapeutic Agents Clinical Phase (Late-Stage (Phase III), Phase II, Phase I, and Pre-Clinical Stage & Discovery Candidates) and Region (North America, Europe, Asia-Pacific, and Rest of the World)—Forecast till 2032

    Share:
    Download PDF ×

    We do not share your information with anyone. However, we may send you emails based on your report interest from time to time. You may contact us at any time to opt-out.

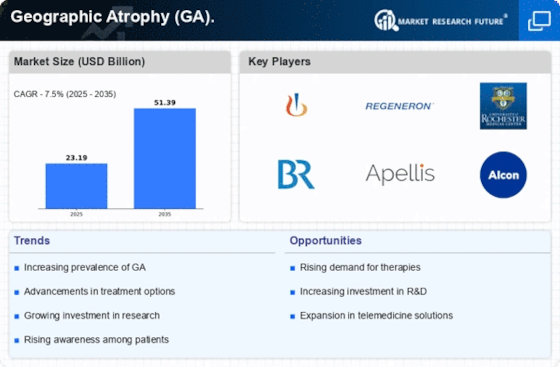
    Geographic Atrophy (GA) Market Research Report—Global Forecast till 2032 Infographic
    Purchase Options
    $ 4,950.0
    $ 5,950.0
    $ 7,250.0
    Table of Contents

    Geographic Atrophy GA Market Summary

    As per Market Research Future Analysis, the Global Geographic Atrophy (GA) Market was valued at USD 18.67 billion in 2021 and is projected to reach USD 36.1 billion by 2032, growing at a CAGR of 7.5% from 2024 to 2032. The market growth is driven by the increasing prevalence of geographic atrophy, particularly among the aging population, and rising R&D investments by pharmaceutical companies. The above 75 years age group holds the majority market share, with geographic atrophy affecting approximately 22% of individuals by age 90. The optical coherence tomography angiography (OCT-A) segment is expected to grow rapidly due to its non-invasive diagnostic capabilities.

    Key Market Trends & Highlights

    Key trends influencing the Geographic Atrophy market include demographic shifts and technological advancements in diagnostics.

    • The geriatric population is projected to increase from 727 million in 2020 to 1.5 billion by 2050, boosting market demand.
    • The OCT-A segment dominated the market in 2021 and is expected to be the fastest-growing segment during 2022-2030.
    • Late-stage (Phase III) clinical trials are driving market growth, with significant investments from biopharmaceutical companies.

    Market Size & Forecast

    2021 Market Size USD 18.67 Billion
    2022 Market Size USD 20.07 Billion
    2032 Market Size USD 36.1 Billion

    Major Players

    Key players in the market include Apellis Pharmaceuticals, Inc., Iveric Bio, Alkeus Pharmaceuticals, Inc., Genentech, Inc., and F. Hoffmann-La Roche AG.

    Geographic Atrophy GA Market Trends

      • Growing geriatric population to boost the market growth

    Geographic atrophy is one of the most common eye disorders in people over 60. It is the final stage of dry age-related macular degeneration (AMD), and it might lead to irreparable retinal loss. In geographic atrophy, a sharply delineated oval or round area of hypopigmentation occurred, and it has a diameter of at least 175 µm. According to a United Nations (UN) report released in December 2020, there were 727 million individuals aged 65 or over in 2020, and it is predicted that this number would increase to 1.5 billion by the year 2050.

    The rising life expectancy and falling fertility rates are both contributing to the world's rapidly expanding senior population. Additionally, according to the World Bank, the geriatric population (those over 65) made up 9.3% of the population in 2020, up from 5.9% in 1985.

    Furthermore, in developed nations such as the US, the UK, France, Germany, and others have, approximately 1 in 29 people over the age of 75 suffering from geographic atrophy. Thus, older people are at a higher risk of having geographic atrophy. Hence, the increasing geriatric population across the globe is positively impacting the geographic atrophy (GA) market.

    The graph that follows illustrates the treatment variations between the pegcetacoplan monthly, every other month, and sham treatment arms overall, as well as according to the tertiles of gender and age. Greater progression (i.e., greater mean change from baseline) is represented by data points on the right-hand side. Moreover, the primary analysis (mixed-effect model) of the sham group in the Phase 2 study shows the geographic atrophy progression as a vertical line. The upper and lower confidence limits of the mean are represented by colored bars.

    The increasing prevalence of geographic atrophy among the aging population underscores the urgent need for innovative therapeutic strategies and enhanced healthcare access to address this debilitating condition.

    National Eye Institute, National Institutes of Health

    Geographic Atrophy GA Market Drivers

    Market Growth Projections

    The Global Geographic Atrophy (GA) Market Industry is projected to experience substantial growth over the next decade. With a market size anticipated to reach 22.7 USD Billion in 2024 and further expand to 44.8 USD Billion by 2035, the industry is on a promising trajectory. The compound annual growth rate (CAGR) of 6.4% from 2025 to 2035 indicates a robust market environment driven by various factors, including advancements in treatment, increased healthcare spending, and demographic shifts. This growth presents opportunities for stakeholders to innovate and enhance patient care in geographic atrophy.

    Increased Healthcare Expenditure

    The Global Geographic Atrophy (GA) Market Industry benefits from rising healthcare expenditures across various regions. Governments and private sectors are investing more in ophthalmic care, particularly for chronic conditions like geographic atrophy. This trend is evident in countries with aging populations, where healthcare budgets are allocated to improve access to diagnostics and treatments. As a result, the market is expected to grow at a compound annual growth rate (CAGR) of 6.4% from 2025 to 2035. This increase in funding not only enhances patient care but also stimulates research and development in the field of GA.

    Advancements in Treatment Modalities

    Innovations in treatment options for geographic atrophy are significantly influencing the Global Geographic Atrophy (GA) Market Industry. Recent developments in pharmacological therapies, including complement inhibitors and gene therapies, show promise in slowing disease progression. Clinical trials are underway, with several candidates demonstrating potential efficacy. As these treatments become available, they are likely to enhance patient outcomes and increase market size. The anticipated growth trajectory suggests that by 2035, the market may expand to 44.8 USD Billion, reflecting the impact of these advancements on patient management and healthcare strategies.

    Emerging Markets and Demographic Shifts

    Emerging markets are becoming increasingly relevant to the Global Geographic Atrophy (GA) Market Industry as demographic shifts occur. Countries in Asia and Latin America are experiencing rapid urbanization and aging populations, which may lead to a rise in GA cases. These regions are beginning to invest in healthcare infrastructure and ophthalmic services, creating opportunities for market growth. The combination of demographic changes and economic development suggests that the GA market will see increased activity in these areas, potentially altering the global landscape of geographic atrophy management.

    Growing Awareness and Screening Programs

    The Global Geographic Atrophy (GA) Market Industry is positively impacted by heightened awareness and the implementation of screening programs for eye diseases. Public health initiatives aimed at educating populations about the risks and symptoms of geographic atrophy are crucial. Increased screening leads to earlier diagnosis and intervention, which can significantly alter disease progression. As awareness grows, more individuals seek medical advice, thereby driving demand for treatments. This proactive approach is likely to contribute to the market's expansion, as healthcare providers prioritize early detection and management of GA.

    Rising Prevalence of Age-Related Macular Degeneration

    The Global Geographic Atrophy (GA) Market Industry is witnessing a surge in demand due to the increasing prevalence of age-related macular degeneration (AMD). As populations age, particularly in developed nations, the incidence of AMD rises, leading to a higher number of patients experiencing geographic atrophy. This condition is projected to affect millions globally, with estimates suggesting that by 2024, the market could reach 22.7 USD Billion. The growing awareness and diagnosis of AMD further contribute to the expansion of the GA market, as healthcare systems adapt to manage this chronic condition more effectively.

    Market Segment Insights

    Geographic Atrophy (GA) Age Group Insights

    The geographic atrophy (GA) market segmentation, based on age group, includes those above 60 years and above 75 years. The above 75 years segment held the majority share in 2021 in the geographic atrophy (GA) market revenue. This is primarily owing to the rising prevalence of geographic atrophy in the above 75 years age group is due to age-related. For instance, according to the Retina Study Group of Portugal, geographic atrophy affects 1.3% of adults between the ages of 75 and 84, rising to approximately 22% by the age of 90.

    November 2021 Iveric Bio's(US) avacincaptad pegol (ACP, also known as Zimura), a novel investigational complement C5 inhibitor for the treatment of geographic atrophy (GA) secondary to age-related macular degeneration (AMD), has received Breakthrough Therapy designation from the U.S. Food and Drug Administration (FDA).

    Geographic Atrophy (GA) Diagnosis Insights

    The geographic atrophy (GA) market segmentation is based on diagnosis includes fundus autofluorescence (FAF), optical coherence tomography angiography (OCT-A), and multifocal electroretinography (MfERG). The optical coherence tomography angiography (OCT-A) segment dominated the market in 2021 and is projected to be the faster-growing segment during the forecast period, 2022-2030. This is due to optical coherence tomography angiography (OCT-A) has evolved as a non-invasive technology for visualizing the retina's and choroid's microvasculature. It is useful for the diagnosis and understanding of many retinal conditions such as geographic atrophy, diabetic retinopathy, dry age-related macular degeneration, wet age-related macular degeneration, vascular occlusions, and others.

    For instance, the AngioVue OCTA system is based on optical coherence tomography angiography offered by Optovue, Inc. (US).

    Geographic Atrophy (GA) Therapeutic Agents Clinical Phase Insights

    The geographic atrophy (GA) market data has been bifurcated into late-stage (Phase III), Phase II, Phase I, and pre-clinical stage & discovery candidates. The late-stage (Phase III) segment dominated the market in 2021 and is projected to be the faster-growing segment during the forecast period, 2022-2030. The growth of the biopharmaceutical companies’ segment in the market is mainly due to the Phase III clinical trials used to see if a new medicine or drug combination is better or equal to the current standard of care.

    For instance, Galderma Laboratories LP (US), an anti-inflammatory Doxycycline, is being studied in phase III clinical trials for the treatment of geographic atrophy. Hence, rising late-stage (Phase III) clinical trials in the geographic atrophy industry are likely to be the key factor driving the growth of this segment in the market.

    September 2021 Apellis Pharmaceuticals, Inc. (US) highlighted the best results from the phase III clinical trial for APL-2 Therapy in geographic atrophy and planned to file a new drug application with the FDA in the first half of 2022.

    Figure 2 Geographic Atrophy (GA) Market, By Therapeutic Agents Clinical Phase, 2021 & 2030 (USD Billion)

    Source Secondary Research, Primary Research, Market Research Future Database, and Analyst Review

    Get more detailed insights about Geographic Atrophy (GA) Market Research Report—Global Forecast till 2032

    Regional Insights

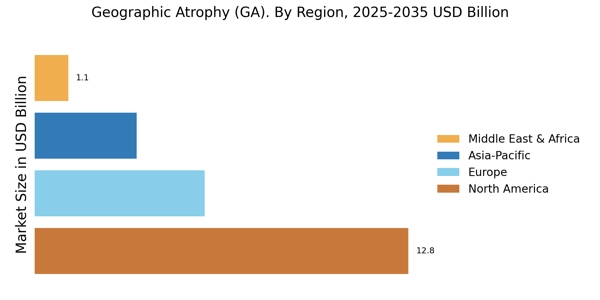
    By Region, the study segments the market into North America, Europe, Asia-Pacific, and the Rest of the World. The North America geographic atrophy (GA) market is expected to account for USD XX billion in 2021 and is expected to exhibit an XX% CAGR during the study period. This is attributed to the rising investment in the healthcare industry and the presence of major key players in the region such as Apellis Pharmaceuticals, Inc. (US), Iveric Bio (US), Alkeus Pharmaceuticals Inc. (US), and others.

    Moreover, the rising number of patients suffering from geographic atrophy and growing government initiatives related to geographic atrophy in the region further fuel the growth of the market.

    Further, the major countries studied are the U.S., Canada, Germany, France, the UK, Italy, Spain, China, Japan, India, Australia, South Korea, and Brazil.

    Figure 3 GEOGRAPHIC ATROPHY (GA) MARKET SHARE BY REGION 2021 (%)GEOGRAPHIC ATROPHY (GA) MARKET SHARE BY REGION 2021

    Source Secondary Research, Primary Research, Market Research Future Database and Analyst Review

    Europe geographic atrophy (GA) market is expected to account for the second-largest market share due to the rising older population, increasing demand for technologically innovative treatment, and growing R&D investment by the biopharmaceutical industry. Further, the Germany geographic atrophy (GA) market is expected to hold third place for the market share, and the UK geographic atrophy (GA) market is expected to fastest-growing market, and which is in the 4th place in the European region. Furthermore, France geographic atrophy (GA) market will hold the 5th place for the market share.

    The Asia-Pacific geographic atrophy (GA) market is expected to grow at a CAGR of XX% from 2022 to 2030. This is due to the developing healthcare infrastructure, the establishment of research organizations, and the rising prevalence of AMD disorders among the elderly population. Moreover, China geographic atrophy (GA) market is expected to hold the largest market share, and the India geographic atrophy (GA) market is expected fastest-growing market in the Asia-Pacific region.

    For instance, According to World Health Organization (WHO), 90% of the total visually impaired people live in developing countries such as China, India, and others, to become the leader in the geographic atrophy (GA) market.

    The Rest of the World includes the Middle East, Africa, and Latin America. Government initiatives to increase medical expenditure and increase healthcare infrastructure in the region contribute to the growth of the geographic atrophy (GA) market.

    Key Players and Competitive Insights

    The presence of major market players in the Geographic Atrophy (GA) market is characterized by the presence of many international, regional, and local players. growing geriatric population and increasing prevalence of geographic atrophy, and increased healthcare expenditure globally. In addition, the companies are investing in R&D activities to expand their product portfolio for GA, which further drives the growth of the geographic atrophy market. Moreover, the vendors compete based on cost, product quality, reliability, and aftermarket services and try to be the first to bring a treatment for the public.

    It is crucial for the players to offer cost-efficient and high-quality products for geographic atrophy to succeed in an intensely competitive market environment.

    One of the primary business strategies adopted by manufacturers in the geographic atrophy (GA) industry to benefit clients and expand the geographic atrophy (GA) market sector is to manufacture locally to reduce operating costs.

    Genentech, Inc. is a biotechnology company dedicated to discovering and developing medicines for patients suffering from serious and potentially fatal illnesses. Genentech is a wholly owned subsidiary of Roche Holding Ltd. Genentech conducts research, develops, manufactures, and distributes human pharmaceuticals to address important medical needs. The company produces animals from gene cells that would not typically be produced by the cell, and it has six offices across the U. S.

    For instance, in December 2022, Genentech (US) Launches Phase 2a Study of RG6501 (OpRegen) in Patients with Geographic Atrophy. a phase 2a, multicenter, open-label, single-arm clinical study of RG6501 (OpRegen), a retinal pigment epithelial cell therapy. The goal of the trial is to assess the safety and efficacy of OpRegen in up to 60 patients with geographic atrophy (GA) brought on by age-related macular degeneration. The study will examine the best subretinal surgical delivery method.

    Also, Iveric Bio (US) is a biopharmaceutical company dedicated to the research and creation of innovative therapies for retinal conditions with unmet medical needs. The company is developing both therapeutic product candidates for age-related retinal diseases and gene therapy product candidates for orphan inherited retinal diseases or IRDs. In June 2022, Iveric Bio's(US) positive topline data from Zimura GATHER2 Phase 3 clinical trial in geographic atrophy.

    Key Companies in the Geographic Atrophy GA Market market include

    Industry Developments

    Future Outlook

    Geographic Atrophy GA Market Future Outlook

    The Global Geographic Atrophy (GA) Market is projected to grow at a 6.4% CAGR from 2024 to 2035, driven by advancements in treatment modalities and increasing prevalence of age-related macular degeneration.

    New opportunities lie in:

    • Develop innovative gene therapies targeting GA progression.
    • Expand telemedicine solutions for remote patient monitoring and management.
    • Invest in AI-driven diagnostic tools for early detection of GA.

    By 2035, the Geographic Atrophy market is expected to exhibit robust growth, reflecting advancements in treatment and increased patient awareness.

    Market Segmentation

    Geographic Atrophy (GA) Regional Outlook

    North America
    • US
    • Canada

    Geographic Atrophy (GA) Age Group Outlook

    • Above 60 Years
    • Above 75 Years

    Geographic Atrophy (GA) Diagnosis Outlook

    • Fundus Autofluorescence (FAF)
    • Optical Coherence Tomography Angiography (OCT-A)
    • Multifocal Electroretinography (MfERG)

    Geographic Atrophy (GA) Therapeutic Agents Clinical Phase Outlook

    • Late-Stage (Phase III)
    • Phase II
    • Phase I
    • Pre-Clinical Stage & Discovery Candidates

    Report Scope

    Report Attribute/Metric Details
    Market Size 2021 USD 18.67 billion
    Market Size 2022 USD 20.07 billion
    Market Size 2032 USD 36.1 billion
    Compound Annual Growth Rate (CAGR) 7.5% (2022-2030)
    Base Year 2023
    Forecast Period 2024-2032
    Historical Data 2019 & 2022
    Forecast Units Value (USD Billion)
    Report Coverage Revenue Forecast, Competitive Landscape, Growth Factors, and Trends
    Segments Covered Age Group, Diagnosis, and Therapeutic Agents Clinical Phase, and Region
    Geographies Covered North America, Europe, Asia Pacific, and the Rest of the World
    Countries Covered The U.S, Canada, Germany, France, the UK, Italy, Spain, China, Japan, India, Australia, South Korea, and Brazil
    Key Companies Profiled Apellis Pharmaceuticals, Inc. (US), Iveric Bio (US), Alkeus Pharmaceuticals, Inc. (US), Hemera Biosciences LLC (US), Allegro Ophthalmics, LLC (US), Stealth BioTherapeutics (Cayman Islands), Gyroscope Therapeutics Limited (UK), F. Hoffmann-La Roche AG (Switzerland), Genentech, Inc. (US), and Gensight Biologics SA (France)
    Key Market Opportunities Development of new technologies for the treatment of geographic atrophy
    Key Market Dynamics Growing geriatric population Increasing prevalence of geographic atrophy across the globe Increase in R&D investments by pharmaceutical & biopharmaceutical companies

    Market Highlights

    Author
    Kinjoll Dey
    Research Analyst Level I

    He is an extremely curious individual currently working in Healthcare and Medical Devices Domain. Kinjoll is comfortably versed in data centric research backed by healthcare educational background. He leverages extensive data mining and analytics tools such as Primary and Secondary Research, Statistical Analysis, Machine Learning, Data Modelling. His key role also involves Technical Sales Support, Client Interaction and Project management within the Healthcare team. Lastly, he showcases extensive affinity towards learning new skills and remain fascinated in implementing them.

    Leave a Comment

    FAQs

    How much is the geographic atrophy (GA) market?

    The geographic atrophy (GA) market is anticipated to reach USD 36.1 billion at a CAGR of 7.5% during the forecast period of 2023 to 2032.

    What is the growth rate of the geographic atrophy (GA) market?

    The geographic atrophy (GA) market is expected to register a CAGR of 7.5% during the forecast period of 2023 to 2032.

    Which region held the largest market share in the Geographic Atrophy (GA) Market?

    The North America geographic atrophy (GA) market.

    Who are the key players in the geographic atrophy (GA) Market?

    Apellis Pharmaceuticals, Inc. (US), Iveric Bio (US), Alkeus Pharmaceuticals, Inc. (US), Hemera Biosciences LLC (US), Allegro Ophthalmics, LLC (US), Stealth BioTherapeutics (Cayman Islands), Gyroscope Therapeutics Limited (UK), F. Hoffmann-La Roche AG (Switzerland), Genentech, Inc. (US), and Gensight Biologics SA (France).

    Which type diagnosis the geographic atrophy (GA) market?

    The optical coherence tomography angiography (OCT-A) segment held the majority share in 2021

    Which stage had the largest market share in the Geographic Atrophy (GA) Market?

    The late-stage (Phase III) segment dominated the market in 2021 and is projected to be the faster-growing segment during the forecast period, 2023-2032.

    1. EXECUTIVE SUMMARY
    2. MARKET INTRODUCTION
      1. DEFINITION
      2. SCOPE OF THE STUDY
      3. RESEARCH OBJECTIVE
    3. RESEARCH METHODOLOGY
      1. DATA
    4. MINING
      1. SECONDARY RESEARCH
      2. PRIMARY RESEARCH
        1. PRIMARY
    5. INTERVIEWS AND INFORMATION GATHERING PROCESS
      1. BREAKDOWN OF PRIMARY RESPONDENTS
      2. FORECASTING TECHNIQUES
      3. RESEARCH METHODOLOGY FOR MARKET SIZE ESTIMATION
        1. BOTTOM-UP APPROACH
        2. TOP-DOWN APPROACH
      4. DATA TRIANGULATION
      5. VALIDATION
    6. MARKET DYNAMICS
      1. OVERVIEW
      2. DRIVERS
    7. RISING GERIATRIC POPULATION
      1. GROWING PREVALENCE OF GEOGRAPHIC ATROPHY
      2. RESTRAINTS
        1. LACK OF AVAILABILITY OF GEOGRAPHIC ATROPHY TREATMENT
      3. OPPORTUNITIES
        1. RISING R&D INVESTMENTS BY BIOPHARMACEUTICAL &
    8. BIOTECHNOLOGY COMPANIES
    9. MARKET FACTOR ANALYSIS
      1. VALUE CHAIN ANALYSIS
        1. R&D & DESIGNING
        2. MANUFACTURING
        3. DISTRIBUTION
    10. & SALES
      1. POST-SALES MONITORING
      2. PORTER'S FIVE FORCES MODEL
        1. THREAT OF NEW ENTRANTS
        2. BARGAINING POWER OF SUPPLIERS
    11. THREAT OF SUBSTITUTES
      1. BARGAINING POWER OF BUYERS
        1. INTENSITY
    12. OF RIVALRY
      1. IMPACT OF COVID-19 ON THE GLOBAL GEOGRAPHIC ATROPHY MARKET
        1. IMPACT ON MAKET GROWTH
        2. IMPACT ON PATIENTS WITH GEOGRAPHIC ATROPHY
        3. IMPACT ON R&D
    13. GLOBAL GEOGRAPHIC ATROPHY MARKET, BY AGE GROUP
      1. OVERVIEW
      2. LESS THAN 65 YEARS
      3. 65-74 YEARS
      4. 75-84 YEARS
      5. 85 YEARS AND ABOVE
    14. GLOBAL GEOGRAPHIC ATROPHY MARKET, BY DIAGNOSIS
      1. OVERVIEW
      2. FUNDUS AUTOFLUORESCENCE (FAF)
      3. OPTICAL COHERENCE
    15. TOMOGRAPHY ANGIOGRAPHY (OCT-A)
      1. MULTIFOCAL ELECTRORETINOGRAPHY (MFERG)
    16. GLOBAL GEOGRAPHIC ATROPHY MARKET, BY THERAPEUTIC AGENT’S CLINICAL PHASE
      1. OVERVIEW
      2. LATE-STAGE (PHASE III)
      3. PHASE II
      4. PHASE
    17. I
      1. PRE-CLINICAL STAGE & DISCOVERY CANDIDATES
    18. GLOBAL GEOGRAPHIC
    19. ATROPHY MARKET, BY REGION
      1. OVERVIEW
      2. AMERICAS
        1. NORTH AMERICA
        2. CENTRAL & SOUTH
    20. AMERICA
      1. BRAZIL
        1. ARGENTINA
    21. REST OF CENTRAL & SOUTH AMERICA
      1. EUROPE
        1. GERMANY
    22. FRANCE
      1. UK
        1. ITALY
        2. SPAIN
        3. NETHERLANDS
        4. DENAMARK
        5. REST OF EUROPE
      2. ASIA-PACIFIC
        1. CHINA
        2. INDIA
        3. JAPAN
        4. SOUTH KOREA
        5. AUSTRALIA
    23. TAIWAN
      1. REST OF ASIA-PACIFIC
      2. MIDDLE EAST AND AFRICA
    24. UAE
      1. SAUDI ARABIA
        1. SOUTH AFRICA
        2. REST OF MIDDLE EAST
    25. & AFRICA
    26. COMPETITIVE LANDSCAPE
      1. OVERVIEW
      2. COMPETITIVE
    27. BENCHMARKING
      1. MAJOR GROWTH STRATEGY IN THE GLOBAL GEOGRAPHIC ATROPHY MARKET
      2. THE LEADING PLAYER IN TERMS OF THE NUMBER OF DEVELOPMENTS IN THE GLOBAL GEOGRAPHIC
    28. ATROPHY MARKET
      1. KEY DEVELOPMENTS & GROWTH STRATEGIES
        1. PRODUCT
    29. LAUNCH/PRODUCT APPROVAL
      1. MERGER/ACQUISITION
      2. MAJOR PLAYERS SALES
    30. ANALYSIS
      1. SALES & OPERATING INCOME
        1. MAJOR PLAYERS R&D
    31. ANALYSIS
    32. COMPANY PROFILES
      1. F. HOFFMANN-LA ROCHE AG
    33. COMPANY OVERVIEW
      1. FINANCIAL OVERVIEW
        1. PRODUCTS OFFERED
        2. KEY DEVELOPMENTS
        3. SWOT ANALYSIS
        4. KEY STRATEGIES
      2. APELLIS PHARMACEUTICALS
        1. COMPANY OVERVIEW
        2. FINANCIAL
    34. OVERVIEW
      1. PRODUCTS OFFERED
        1. KEY DEVELOPMENTS
        2. SWOT
    35. ANALYSIS
      1. KEY STRATEGIES
      2. IVERIC BIO, INC.
        1. COMPANY
    36. OVERVIEWS
      1. FINANCIAL OVERVIEW
        1. PRODUCTS OFFERED
    37. KEY DEVELOPMENTS
      1. KEY STRATEGIES
      2. ALKEUS PHARMACEUTICALS
        1. COMPANY OVERVIEW
        2. FINANCIAL OVERVIEW
        3. PRODUCTS OFFERED
        4. KEY DEVELOPMENTS
        5. KEY STRATEGIES
      3. HEMERA BIOSCIENCES
    38. LLC
      1. COMPANY OVERVIEW
        1. FINANCIAL OVERVIEW
        2. PRODUCTS
    39. OFFERED
      1. KEY DEVELOPMENTS
        1. KEY STRATEGIES
      2. NGM BIOPHARMACEUTICALS
        1. COMPANY OVERVIEW
        2. FINANCIAL OVERVIEW
        3. PRODUCTS OFFERED
        4. KEY DEVELOPMENTS
        5. SWOT ANALYSIS
        6. KEY STRATEGIES
      3. JOHNSON & JOHNSON SERVICES, INC
        1. COMPANY OVERVIEW
    40. FINANCIAL OVERVIEW
      1. PRODUCTS OFFERED
        1. KEY DEVELOPMENTS
        2. SWOT ANALYSIS
        3. KEY STRATEGIES
      2. ASTRAZENECA
    41. COMPANY OVERVIEW
      1. FINANCIAL OVERVIEW
        1. PRODUCTS OFFERED
        2. KEY DEVELOPMENTS
        3. SWOT ANALYSIS
        4. KEY STRATEGIES
      2. NOVARTIS AG
        1. COMPANY OVERVIEW
        2. FINANCIAL OVERVIEW
        3. PRODUCTS OFFERED
        4. KEY DEVELOPMENTS
        5. KEY STRATEGIES
      3. STEALTH BIOTHERAPEUTICS CORP
        1. COMPANY OVERVIEW
    42. FINANCIAL OVERVIEW
      1. PRODUCTS OFFERED
        1. KEY DEVELOPMENTS
        2. KEY STRATEGIES
    43. APPENDIX
      1. REFERENCES
      2. RELATED
    44. REPORTS
    45. (USD MILLION)
    46. REGION, 2019–2030 (USD MILLION)
    47. FOR 75-84 YEARS, BY REGION, 2019–2030 (USD MILLION)
    48. ATROPHY MARKET, FOR 85 YEARS AND ABOVE, BY REGION, 2019–2030 (USD MILLION)
    49. REGION, 2019–2030 (USD MILLION)
    50. FOR OPTICAL COHERENCE TOMOGRAPHY ANGIOGRAPHY (OCT-A), BY REGION, 2019–2030
    51. (USD MILLION)
    52. (MFERG), BY REGION, 2019–2030 (USD MILLION)
    53. ATROPHY MARKET, BY THERAPEUTIC AGENT’S CLINICAL PHASE, 2019–2030 (USD
    54. MILLION)
    55. BY REGION, 2019–2030 (USD MILLION)
    56. MARKET, FOR PHASE II, BY REGION, 2019–2030 (USD MILLION)
    57. GEOGRAPHIC ATROPHY MARKET, FOR PHASE I, BY REGION, 2019–2030 (USD MILLION)
    58. CANDIDATES, BY REGION, 2019–2030 (USD MILLION)
    59. ATROPHY MARKET, BY REGION, 2019–2030 (USD MILLION)
    60. GEOGRAPHIC ATROPHY MARKET, BY COUNTRY, 2019–2030 (USD MILLION)
    61. AMERICAS: GEOGRAPHIC ATROPHY MARKET, BY AGE GROUP, 2019–2030 (USD MILLION)
    62. MILLION)
    63. CLINICAL PHASE, 2019–2030 (USD MILLION)
    64. ATROPHY MARKET, BY COUNTRY, 2019–2030 (USD MILLION)
    65. GEOGRAPHIC ATROPHY MARKET, BY AGE GROUP, 2019–2030 (USD MILLION)
    66. NORTH AMERICA: GEOGRAPHIC ATROPHY MARKET, BY DIAGNOSIS, 2019–2030 (USD
    67. MILLION)
    68. AGENT'S CLINICAL PHASE, 2019–2030 (USD MILLION)
    69. ATROPHY MARKET, BY AGE GROUP, 2019–2030 (USD MILLION)
    70. ATROPHY MARKET, BY DIAGNOSIS, 2019–2030 (USD MILLION)
    71. ATROPHY MARKET, BY THERAPEUTIC AGENT'S CLINICAL PHASE, 2019–2030 (USD MILLION)
    72. MILLION)
    73. (USD MILLION)
    74. CLINICAL PHASE, 2019–2030 (USD MILLION)
    75. MARKET, BY AGE GROUP, 2019–2030 (USD MILLION)
    76. ATROPHY MARKET, BY DIAGNOSIS, 2019–2030 (USD MILLION)
    77. GEOGRAPHIC ATROPHY MARKET, BY THERAPEUTIC AGENT'S CLINICAL PHASE, 2019–2030
    78. (USD MILLION)
    79. BY COUNTRY, 2019–2030 (USD MILLION)
    80. GEOGRAPHIC ATROPHY MARKET, BY AGE GROUP, 2019–2030 (USD MILLION)
    81. CENTRAL & SOUTH AMERICA: GEOGRAPHIC ATROPHY MARKET, BY DIAGNOSIS, 2019–2030
    82. (USD MILLION)
    83. BY THERAPEUTIC AGENT'S CLINICAL PHASE, 2019–2030 (USD MILLION)
    84. BRAZIL: GEOGRAPHIC ATROPHY MARKET, BY AGE GROUP, 2019–2030 (USD MILLION)
    85. MILLION)
    86. CLINICAL PHASE, 2019–2030 (USD MILLION)
    87. ATROPHY MARKET, BY AGE GROUP, 2019–2030 (USD MILLION)
    88. GEOGRAPHIC ATROPHY MARKET, BY DIAGNOSIS, 2019–2030 (USD MILLION)
    89. ARGENTINA: GEOGRAPHIC ATROPHY MARKET, BY THERAPEUTIC AGENT'S CLINICAL PHASE,
    90. –2030 (USD MILLION)
    91. AGE GROUP, 2019–2030 (USD MILLION)
    92. MARKET, BY DIAGNOSIS, 2019–2030 (USD MILLION)
    93. ATROPHY MARKET, BY THERAPEUTIC AGENT'S CLINICAL PHASE, 2019–2030 (USD MILLION)
    94. GROUP, 2019–2030 (USD MILLION)
    95. GEOGRAPHIC ATROPHY MARKET, BY DIAGNOSIS, 2019–2030 (USD MILLION)
    96. REST OF CENTRAL & SOUTH AMERICA: GEOGRAPHIC ATROPHY MARKET, BY THERAPEUTIC
    97. AGENT'S CLINICAL PHASE, 2019–2030 (USD MILLION)
    98. ATROPHY MARKET, BY REGION, 2019–2030 (USD MILLION)
    99. ATROPHY MARKET, BY AGE GROUP, 2019–2030 (USD MILLION)
    100. GEOGRAPHIC ATROPHY MARKET, BY DIAGNOSIS, 2019–2030 (USD MILLION)
    101. EUROPE: GEOGRAPHIC ATROPHY MARKET, BY THERAPEUTIC AGENT'S CLINICAL PHASE, 2019–2030
    102. (USD MILLION)
    103. (USD MILLION)
    104. (USD MILLION)
    105. CLINICAL PHASE, 2019–2030 (USD MILLION)
    106. MARKET, BY AGE GROUP, 2019–2030 (USD MILLION)
    107. ATROPHY MARKET, BY DIAGNOSIS, 2019–2030 (USD MILLION)
    108. GEOGRAPHIC ATROPHY MARKET, BY THERAPEUTIC AGENT'S CLINICAL PHASE, 2019–2030
    109. (USD MILLION)
    110. (USD MILLION)
    111. (USD MILLION)
    112. CLINICAL PHASE, 2019–2030 (USD MILLION)
    113. MARKET, BY AGE GROUP, 2019–2030 (USD MILLION)
    114. ATROPHY MARKET, BY DIAGNOSIS, 2019–2030 (USD MILLION)
    115. GEOGRAPHIC ATROPHY MARKET, BY THERAPEUTIC AGENT'S CLINICAL PHASE, 2019–2030
    116. (USD MILLION)
    117. (USD MILLION)
    118. (USD MILLION)
    119. CLINICAL PHASE, 2019–2030 (USD MILLION)
    120. ATROPHY MARKET, BY AGE GROUP, 2019–2030 (USD MILLION)
    121. GEOGRAPHIC ATROPHY MARKET, BY DIAGNOSIS, 2019–2030 (USD MILLION)
    122. NETHERLANDS: GEOGRAPHIC ATROPHY MARKET, BY THERAPEUTIC AGENT'S CLINICAL PHASE,
    123. –2030 (USD MILLION)
    124. BY AGE GROUP, 2019–2030 (USD MILLION)
    125. MARKET, BY DIAGNOSIS, 2019–2030 (USD MILLION)
    126. ATROPHY MARKET, BY THERAPEUTIC AGENT'S CLINICAL PHASE, 2019–2030 (USD MILLION)
    127. (USD MILLION)
    128. –2030 (USD MILLION)
    129. BY THERAPEUTIC AGENT'S CLINICAL PHASE, 2019–2030 (USD MILLION)
    130. ASIA-PACIFIC: GEOGRAPHIC ATROPHY MARKET, BY COUNTRY, 2019–2030 (USD MILLION)
    131. (USD MILLION)
    132. 2030 (USD MILLION)
    133. THERAPEUTIC AGENT’S CLINICAL PHASE, 2019–2030 (USD MILLION)
    134. CHINA: GEOGRAPHIC ATROPHY MARKET, BY AGE GROUP, 2019–2030 (USD MILLION)
    135. PHASE, 2019–2030 (USD MILLION)
    136. BY AGE GROUP, 2019–2030 (USD MILLION)
    137. MARKET, BY DIAGNOSIS, 2019-2030 (USD MILLION)
    138. MARKET, BY THERAPEUTIC AGENT’S CLINICAL PHASE, 2019–2030 (USD MILLION)
    139. MILLION)
    140. (USD MILLION)
    141. CLINICAL PHASE, 2019–2030 (USD MILLION)
    142. ATROPHY MARKET, BY AGE GROUP, 2019–2030 (USD MILLION)
    143. KOREA: GEOGRAPHIC ATROPHY MARKET, BY DIAGNOSIS, 2019-2030 (USD MILLION)
    144. SOUTH KOREA: GEOGRAPHIC ATROPHY MARKET, BY THERAPEUTIC AGENT’S CLINICAL
    145. PHASE, 2019–2030 (USD MILLION)
    146. MARKET, BY AGE GROUP, 2019–2030 (USD MILLION)
    147. ATROPHY MARKET, BY DIAGNOSIS, 2019-2030 (USD MILLION)
    148. ATROPHY MARKET, BY THERAPEUTIC AGENT’S CLINICAL PHASE, 2019–2030 (USD
    149. MILLION)
    150. (USD MILLION)
    151. (USD MILLION)
    152. CLINICAL PHASE, 2019–2030 (USD MILLION)
    153. GEOGRAPHIC ATROPHY MARKET, BY AGE GROUP, 2019–2030 (USD MILLION)
    154. REST OF ASIA-PACIFIC: GEOGRAPHIC ATROPHY MARKET, BY DIAGNOSIS, 2019-2030 (USD
    155. MILLION)
    156. AGENT’S CLINICAL PHASE, 2019–2030 (USD MILLION)
    157. EAST & AFRICA: GEOGRAPHIC ATROPHY MARKET, BY COUNTRY, 2019-2030 (USD MILLION)
    158. (USD MILLION)
    159. BY DIAGNOSIS, 2019-2030 (USD MILLION)
    160. ATROPHY MARKET, BY THERAPEUTIC AGENT’S CLINICAL PHASE, 2019–2030 (USD
    161. MILLION)
    162. (USD MILLION)
    163. (USD MILLION)
    164. CLINICAL PHASE, 2019–2030 (USD MILLION)
    165. ATROPHY MARKET, BY AGE GROUP, 2019–2030 (USD MILLION)
    166. ARABIA: GEOGRAPHIC ATROPHY MARKET, BY DIAGNOSIS, 2019-2030 (USD MILLION)
    167. SAUDI ARABIA: GEOGRAPHIC ATROPHY MARKET, BY THERAPEUTIC AGENT’S CLINICAL
    168. PHASE, 2019–2030 (USD MILLION)
    169. MARKET, BY AGE GROUP, 2019–2030 (USD MILLION)
    170. GEOGRAPHIC ATROPHY MARKET, BY DIAGNOSIS, 2019-2030 (USD MILLION)
    171. SOUTH AFRICA: GEOGRAPHIC ATROPHY MARKET, BY THERAPEUTIC AGENT’S CLINICAL PHASE,
    172. –2030 (USD MILLION)
    173. ATROPHY MARKET, BY AGE GROUP, 2019–2030 (USD MILLION)
    174. OF MIDDLE EAST & AFRICA: GEOGRAPHIC ATROPHY MARKET, BY DIAGNOSIS, 2019-2030
    175. (USD MILLION)
    176. MARKET, BY THERAPEUTIC AGENT’S CLINICAL PHASE, 2019–2030 (USD MILLION)
    177. MOST ACTIVE PLAYER IN THE GLOBAL GEOGRAPHIC ATROPHY MARKET
    178. LAUNCH/PRODUCT APPROVAL
    179. ROCHE AG: PRODUCTS OFFERED
    180. INC.: PRODUCTS OFFERED
    181. ALKEUS PHARMACEUTICALS: PRODUCTS OFFERED
    182. PRODUCTS OFFERED
    183. JOHNSON & JOHNSON SERVICES, INC: PRODUCTS OFFERED
    184. PRODUCTS OFFERED
    185. AG: PRODUCTS OFFERED
    186. STEALTH BIOTHERAPEUTICS INC: PRODUCTS OFFERED
    187. OF THE GLOBAL GEOGRAPHIC ATROPHY MARKET
    188. GEOGRAPHIC ATROPHY MARKET
    189. ATROPHY MARKET
    190. ATTRACTIVENESS, (USD MILLION)
    191. AGE GROUP, 2022 & 2030 (USD MILLION)
    192. MARKET SHARE, BY AGE GROUP, 2022 (%)
    193. BY DIAGNOSIS SEGMENT ATTRACTIVENESS, (USD MILLION)
    194. ATROPHY MARKET, BY DIAGNOSIS, 2022 & 2030 (USD MILLION)
    195. GEOGRAPHIC ATROPHY MARKET SHARE, BY DIAGNOSIS, 2022 (%)
    196. ATROPHY MARKET; THERAPEUTIC AGENT’S CLINICAL PHASE SEGMENT ATTRACTIVENESS,
    197. (USD MILLION)
    198. CLINICAL PHASE, 2022 & 2030 (USD MILLION)
    199. MARKET SHARE, BY THERAPEUTIC AGENT’S CLINICAL PHASE, 2022 (%)
    200. GLOBAL: GEOGRAPHIC ATROPHY MARKET SHARE (%), BY REGION, 2022
    201. MARKET ANALYSIS: GEOGRAPHIC ATROPHY MARKET, 2019-2030 (USD MILLION)
    202. NORTH AMERICA: GEOGRAPHIC ATROPHY MARKET SHARE (%), BY REGION 2022
    203. EUROPE MARKET ANALYSIS: GEOGRAPHIC ATROPHY MARKET, 2019-2030 (USD MILLION)
    204. ASIA-PACIFIC MARKET ANALYSIS: GEOGRAPHIC ATROPHY MARKET, 2019-2030 (USD MILLION)
    205. 2030 (USD MILLION)
    206. MARKET SHARE (%), BY COUNTRY, 2022
    207. MARKET
    208. MAJOR PLAYER R&D EXPENDITURE, 2022
    209. FINANCIAL OVERVIEW SNAPSHOT
    210. APELLIS PHARMACEUTICALS: SWOT ANALYSIS
    211. OVERVIEW SNAPSHOT
    212. JOHNSON & JOHNSON SERVICES, INC: FINANCIAL OVERVIEW SNAPSHOT
    213. JOHNSON & JOHNSON SERVICES, INC: SWOT ANALYSIS
    214. FINANCIAL OVERVIEW SNAPSHOT
    215. NOVARTIS AG: FINANCIAL OVERVIEW SNAPSHOT

    Geographic Atrophy Market Segmentation

    Geographic Atrophy Age Group Outlook (USD Billion, 2019-2030)

    • Less than 65 Years
    • 65-74 Years
    • 75-84 Years
    • 85 Years and Above

    Geographic Atrophy Diagnosis Outlook (USD Billion, 2019-2030)

    • Fundus Autofluorescence (FAF)
    • Optical Coherence Tomography Angiography (OCT-A)
    • Multifocal Electroretinography (mfERG)

    Geographic Atrophy Therapeutics Agent’s Clinical Phase Outlook (USD Billion, 2019-2030)

    • Late-Stage (Phase III)
    • Phase II
    • Phase I
    • Pre-Clinical Stage & Discovery Candidates

    Geographic Atrophy Regional Outlook (USD Billion, 2019-2030)

    • Americas Outlook (USD Billion, 2019-2030)

      • Americas Geographic Atrophy by Age Group
        • Less than 65 Years
        • 65-74 Years
        • 75-84 Years
        • 85 Years and Above
      • Americas Geographic Atrophy by Diagnosis
        • Fundus Autofluorescence (FAF)
        • Optical Coherence Tomography Angiography (OCT-A)
        • Multifocal Electroretinography (mfERG)
      • Americas Geographic Atrophy by Therapeutics Agent’s Clinical Phase
        • Late-Stage (Phase III)
        • Phase II
        • Phase I
        • Pre-Clinical Stage & Discovery Candidates
      • North America Outlook (USD Billion, 2019-2030)

      • North America Geographic Atrophy by Age Group
        • Less than 65 Years
        • 65-74 Years
        • 75-84 Years
        • 85 Years and Above
      • North America Geographic Atrophy by Diagnosis
        • Fundus Autofluorescence (FAF)
        • Optical Coherence Tomography Angiography (OCT-A)
        • Multifocal Electroretinography (mfERG)
      • North America Geographic Atrophy by Therapeutics Agent’s Clinical Phase
        • Late-Stage (Phase III)
        • Phase II
        • Phase I
        • Pre-Clinical Stage & Discovery Candidates
      • US Outlook (USD Billion, 2019-2030)

      • US Geographic Atrophy by Age Group
        • Less than 65 Years
        • 65-74 Years
        • 75-84 Years
        • 85 Years and Above
      • US Geographic Atrophy by Diagnosis
        • Fundus Autofluorescence (FAF)
        • Optical Coherence Tomography Angiography (OCT-A)
        • Multifocal Electroretinography (mfERG)
      • US Geographic Atrophy by Therapeutics Agent’s Clinical Phase
        • Late-Stage (Phase III)
        • Phase II
        • Phase I
        • Pre-Clinical Stage & Discovery Candidates
      • Canada Outlook (USD Billion, 2019-2030)

      • Canada Geographic Atrophy by Age Group
        • Less than 65 Years
        • 65-74 Years
        • 75-84 Years
        • 85 Years and Above
      • Canada Geographic Atrophy by Diagnosis
        • Fundus Autofluorescence (FAF)
        • Optical Coherence Tomography Angiography (OCT-A)
        • Multifocal Electroretinography (mfERG)
      • Canada Geographic Atrophy by Therapeutics Agent’s Clinical Phase
        • Late-Stage (Phase III)
        • Phase II
        • Phase I
        • Pre-Clinical Stage & Discovery Candidates
      • Mexico Outlook (USD Billion, 2019-2030)

      • Mexico Geographic Atrophy by Age Group
        • Less than 65 Years
        • 65-74 Years
        • 75-84 Years
        • 85 Years and Above
      • Mexico Geographic Atrophy by Diagnosis
        • Fundus Autofluorescence (FAF)
        • Optical Coherence Tomography Angiography (OCT-A)
        • Multifocal Electroretinography (mfERG)
      • Mexico Geographic Atrophy by Therapeutics Agent’s Clinical Phase
        • Late-Stage (Phase III)
        • Phase II
        • Phase I
        • Pre-Clinical Stage & Discovery Candidates
      • Central & South America Outlook (USD Billion, 2019-2030)

      • Central & South America Geographic Atrophy by Age Group
        • Less than 65 Years
        • 65-74 Years
        • 75-84 Years
        • 85 Years and Above
      • Central & South America Geographic Atrophy by Diagnosis
        • Fundus Autofluorescence (FAF)
        • Optical Coherence Tomography Angiography (OCT-A)
        • Multifocal Electroretinography (mfERG)
      • Central & South America Geographic Atrophy by Therapeutics Agent’s Clinical Phase
        • Late-Stage (Phase III)
        • Phase II
        • Phase I
        • Pre-Clinical Stage & Discovery Candidates
      • Brazil Outlook (USD Billion, 2019-2030)

      • Brazil Geographic Atrophy by Age Group
        • Less than 65 Years
        • 65-74 Years
        • 75-84 Years
        • 85 Years and Above
      • Brazil Geographic Atrophy by Diagnosis
        • Fundus Autofluorescence (FAF)
        • Optical Coherence Tomography Angiography (OCT-A)
        • Multifocal Electroretinography (mfERG)
      • Brazil Geographic Atrophy by Therapeutics Agent’s Clinical Phase
        • Late-Stage (Phase III)
        • Phase II
        • Phase I
        • Pre-Clinical Stage & Discovery Candidates
      • Argentina Outlook (USD Billion, 2019-2030)

      • Argentina Geographic Atrophy by Age Group
        • Less than 65 Years
        • 65-74 Years
        • 75-84 Years
        • 85 Years and Above
      • Argentina Geographic Atrophy by Diagnosis
        • Fundus Autofluorescence (FAF)
        • Optical Coherence Tomography Angiography (OCT-A)
        • Multifocal Electroretinography (mfERG)
      • Argentina Geographic Atrophy by Therapeutics Agent’s Clinical Phase
        • Late-Stage (Phase III)
        • Phase II
        • Phase I
        • Pre-Clinical Stage & Discovery Candidates
      • Chile Outlook (USD Billion, 2019-2030)

      • Chile Geographic Atrophy by Age Group
        • Less than 65 Years
        • 65-74 Years
        • 75-84 Years
        • 85 Years and Above
      • Chile Geographic Atrophy by Diagnosis
        • Fundus Autofluorescence (FAF)
        • Optical Coherence Tomography Angiography (OCT-A)
        • Multifocal Electroretinography (mfERG)
      • Chile Geographic Atrophy by Therapeutics Agent’s Clinical Phase
        • Late-Stage (Phase III)
        • Phase II
        • Phase I
        • Pre-Clinical Stage & Discovery Candidates
      • Rest of Central & South America Outlook (USD Billion, 2019-2030)

      • Rest of Central & South America Geographic Atrophy by Age Group
        • Less than 65 Years
        • 65-74 Years
        • 75-84 Years
        • 85 Years and Above
      • Rest of Central & South America Geographic Atrophy by Diagnosis
        • Fundus Autofluorescence (FAF)
        • Optical Coherence Tomography Angiography (OCT-A)
        • Multifocal Electroretinography (mfERG)
      • Rest of Central & South America Geographic Atrophy by Therapeutics Agent’s Clinical Phase
        • Late-Stage (Phase III)
        • Phase II
        • Phase I
        • Pre-Clinical Stage & Discovery Candidates
    • Europe Outlook (USD Billion, 2019-2030)

      • Europe Geographic Atrophy by Age Group
        • Less than 65 Years
        • 65-74 Years
        • 75-84 Years
        • 85 Years and Above
      • Europe Geographic Atrophy by Diagnosis
        • Fundus Autofluorescence (FAF)
        • Optical Coherence Tomography Angiography (OCT-A)
        • Multifocal Electroretinography (mfERG)
      • Europe Geographic Atrophy by Therapeutics Agent’s Clinical Phase
        • Late-Stage (Phase III)
        • Phase II
        • Phase I
        • Pre-Clinical Stage & Discovery Candidates
      • Germany Outlook (USD Billion, 2019-2030)

      • Germany Geographic Atrophy by Age Group
        • Less than 65 Years
        • 65-74 Years
        • 75-84 Years
        • 85 Years and Above
      • Germany Geographic Atrophy by Diagnosis
        • Fundus Autofluorescence (FAF)
        • Optical Coherence Tomography Angiography (OCT-A)
        • Multifocal Electroretinography (mfERG)
      • Germany Geographic Atrophy by Therapeutics Agent’s Clinical Phase
        • Late-Stage (Phase III)
        • Phase II
        • Phase I
        • Pre-Clinical Stage & Discovery Candidates
      • France Outlook (USD Billion, 2019-2030)

      • France Geographic Atrophy by Age Group
        • Less than 65 Years
        • 65-74 Years
        • 75-84 Years
        • 85 Years and Above
      • France Geographic Atrophy by Diagnosis
        • Fundus Autofluorescence (FAF)
        • Optical Coherence Tomography Angiography (OCT-A)
        • Multifocal Electroretinography (mfERG)
      • France Geographic Atrophy by Therapeutics Agent’s Clinical Phase
        • Late-Stage (Phase III)
        • Phase II
        • Phase I
        • Pre-Clinical Stage & Discovery Candidates
      • UK Outlook (USD Billion, 2019-2030)

      • UK Geographic Atrophy by Age Group
        • Less than 65 Years
        • 65-74 Years
        • 75-84 Years
        • 85 Years and Above
      • UK Geographic Atrophy by Diagnosis
        • Fundus Autofluorescence (FAF)
        • Optical Coherence Tomography Angiography (OCT-A)
        • Multifocal Electroretinography (mfERG)
      • UK Geographic Atrophy by Therapeutics Agent’s Clinical Phase
        • Late-Stage (Phase III)
        • Phase II
        • Phase I
        • Pre-Clinical Stage & Discovery Candidates
      • Italy Outlook (USD Billion, 2019-2030)

      • Italy Geographic Atrophy by Age Group
        • Less than 65 Years
        • 65-74 Years
        • 75-84 Years
        • 85 Years and Above
      • Italy Geographic Atrophy by Diagnosis
        • Fundus Autofluorescence (FAF)
        • Optical Coherence Tomography Angiography (OCT-A)
        • Multifocal Electroretinography (mfERG)
      • Italy Geographic Atrophy by Therapeutics Agent’s Clinical Phase
        • Late-Stage (Phase III)
        • Phase II
        • Phase I
        • Pre-Clinical Stage & Discovery Candidates
      • Spain Outlook (USD Billion, 2019-2030)

      • Spain Geographic Atrophy by Age Group
        • Less than 65 Years
        • 65-74 Years
        • 75-84 Years
        • 85 Years and Above
      • Spain Geographic Atrophy by Diagnosis
        • Fundus Autofluorescence (FAF)
        • Optical Coherence Tomography Angiography (OCT-A)
        • Multifocal Electroretinography (mfERG)
      • Spain Geographic Atrophy by Therapeutics Agent’s Clinical Phase
        • Late-Stage (Phase III)
        • Phase II
        • Phase I
        • Pre-Clinical Stage & Discovery Candidates
      • Netherlands Outlook (USD Billion, 2019-2030)

      • Netherlands Geographic Atrophy by Age Group
        • Less than 65 Years
        • 65-74 Years
        • 75-84 Years
        • 85 Years and Above
      • Netherlands Geographic Atrophy by Diagnosis
        • Fundus Autofluorescence (FAF)
        • Optical Coherence Tomography Angiography (OCT-A)
        • Multifocal Electroretinography (mfERG)
      • Netherlands Geographic Atrophy by Therapeutics Agent’s Clinical Phase
        • Late-Stage (Phase III)
        • Phase II
        • Phase I
        • Pre-Clinical Stage & Discovery Candidates
      • Denmark Outlook (USD Billion, 2019-2030)

      • Denmark Geographic Atrophy by Age Group
        • Less than 65 Years
        • 65-74 Years
        • 75-84 Years
        • 85 Years and Above
      • Denmark Geographic Atrophy by Diagnosis
        • Fundus Autofluorescence (FAF)
        • Optical Coherence Tomography Angiography (OCT-A)
        • Multifocal Electroretinography (mfERG)
      • Denmark Geographic Atrophy by Therapeutics Agent’s Clinical Phase
        • Late-Stage (Phase III)
        • Phase II
        • Phase I
        • Pre-Clinical Stage & Discovery Candidates
      • Rest of Europe Outlook (USD Billion, 2019-2030)

      • Rest of Europe Geographic Atrophy by Age Group
        • Less than 65 Years
        • 65-74 Years
        • 75-84 Years
        • 85 Years and Above
      • Rest of Europe Geographic Atrophy by Diagnosis
        • Fundus Autofluorescence (FAF)
        • Optical Coherence Tomography Angiography (OCT-A)
        • Multifocal Electroretinography (mfERG)
      • Rest of Europe Geographic Atrophy by Therapeutics Agent’s Clinical Phase
        • Late-Stage (Phase III)
        • Phase II
        • Phase I
        • Pre-Clinical Stage & Discovery Candidates
    • Asia-Pacific Outlook (USD Billion, 2019-2030)

      • Asia-Pacific Geographic Atrophy by Age Group
        • Less than 65 Years
        • 65-74 Years
        • 75-84 Years
        • 85 Years and Above
      • Asia-Pacific Geographic Atrophy by Diagnosis
        • Fundus Autofluorescence (FAF)
        • Optical Coherence Tomography Angiography (OCT-A)
        • Multifocal Electroretinography (mfERG)
      • Asia-Pacific Geographic Atrophy by Therapeutics Agent’s Clinical Phase
        • Late-Stage (Phase III)
        • Phase II
        • Phase I
        • Pre-Clinical Stage & Discovery Candidates
      • China Outlook (USD Billion, 2019-2030)

      • China Geographic Atrophy by Age Group
        • Less than 65 Years
        • 65-74 Years
        • 75-84 Years
        • 85 Years and Above
      • China Geographic Atrophy by Diagnosis
        • Fundus Autofluorescence (FAF)
        • Optical Coherence Tomography Angiography (OCT-A)
        • Multifocal Electroretinography (mfERG)
      • China Geographic Atrophy by Therapeutics Agent’s Clinical Phase
        • Late-Stage (Phase III)
        • Phase II
        • Phase I
        • Pre-Clinical Stage & Discovery Candidates
      • India Outlook (USD Billion, 2019-2030)

      • India Geographic Atrophy by Age Group
        • Less than 65 Years
        • 65-74 Years
        • 75-84 Years
        • 85 Years and Above
      • India Geographic Atrophy by Diagnosis
        • Fundus Autofluorescence (FAF)
        • Optical Coherence Tomography Angiography (OCT-A)
        • Multifocal Electroretinography (mfERG)
      • India Geographic Atrophy by Therapeutics Agent’s Clinical Phase
        • Late-Stage (Phase III)
        • Phase II
        • Phase I
        • Pre-Clinical Stage & Discovery Candidates
      • Japan Outlook (USD Billion, 2019-2030)

      • Japan Geographic Atrophy by Age Group
        • Less than 65 Years
        • 65-74 Years
        • 75-84 Years
        • 85 Years and Above
      • Japan Geographic Atrophy by Diagnosis
        • Fundus Autofluorescence (FAF)
        • Optical Coherence Tomography Angiography (OCT-A)
        • Multifocal Electroretinography (mfERG)
      • Japan Geographic Atrophy by Therapeutics Agent’s Clinical Phase
        • Late-Stage (Phase III)
        • Phase II
        • Phase I
        • Pre-Clinical Stage & Discovery Candidates
      • South Korea Outlook (USD Billion, 2019-2030)

      • South Korea Geographic Atrophy by Age Group
        • Less than 65 Years
        • 65-74 Years
        • 75-84 Years
        • 85 Years and Above
      • South Korea Geographic Atrophy by Diagnosis
        • Fundus Autofluorescence (FAF)
        • Optical Coherence Tomography Angiography (OCT-A)
        • Multifocal Electroretinography (mfERG)
      • South Korea Geographic Atrophy by Therapeutics Agent’s Clinical Phase
        • Late-Stage (Phase III)
        • Phase II
        • Phase I
        • Pre-Clinical Stage & Discovery Candidates
      • Australia Outlook (USD Billion, 2019-2030)

      • Australia Geographic Atrophy by Age Group
        • Less than 65 Years
        • 65-74 Years
        • 75-84 Years
        • 85 Years and Above
      • Australia Geographic Atrophy by Diagnosis
        • Fundus Autofluorescence (FAF)
        • Optical Coherence Tomography Angiography (OCT-A)
        • Multifocal Electroretinography (mfERG)
      • Australia Geographic Atrophy by Therapeutics Agent’s Clinical Phase
        • Late-Stage (Phase III)
        • Phase II
        • Phase I
        • Pre-Clinical Stage & Discovery Candidates
      • Taiwan Outlook (USD Billion, 2019-2030)

      • Taiwan Geographic Atrophy by Age Group
        • Less than 65 Years
        • 65-74 Years
        • 75-84 Years
        • 85 Years and Above
      • Taiwan Geographic Atrophy by Diagnosis
        • Fundus Autofluorescence (FAF)
        • Optical Coherence Tomography Angiography (OCT-A)
        • Multifocal Electroretinography (mfERG)
      • Taiwan Geographic Atrophy by Therapeutics Agent’s Clinical Phase
        • Late-Stage (Phase III)
        • Phase II
        • Phase I
        • Pre-Clinical Stage & Discovery Candidates
      • Rest of Asia-Pacific Outlook (USD Billion, 2019-2030)

      • Rest of Asia-Pacific Geographic Atrophy by Age Group
        • Less than 65 Years
        • 65-74 Years
        • 75-84 Years
        • 85 Years and Above
      • Rest of Asia-Pacific Geographic Atrophy by Diagnosis
        • Fundus Autofluorescence (FAF)
        • Optical Coherence Tomography Angiography (OCT-A)
        • Multifocal Electroretinography (mfERG)
      • Rest of Asia-Pacific Geographic Atrophy by Therapeutics Agent’s Clinical Phase
        • Late-Stage (Phase III)
        • Phase II
        • Phase I
        • Pre-Clinical Stage & Discovery Candidates
    • Middle East & Africa Outlook (USD Billion, 2019-2030)

      • Middle East & Africa Outlook (USD Billion, 2019-2030)

      • Middle East & Africa Geographic Atrophy by Age Group
        • Less than 65 Years
        • 65-74 Years
        • 75-84 Years
        • 85 Years and Above
      • Middle East & Africa Geographic Atrophy by Diagnosis
        • Fundus Autofluorescence (FAF)
        • Optical Coherence Tomography Angiography (OCT-A)
        • Multifocal Electroretinography (mfERG)
      • Middle East & Africa Geographic Atrophy by Therapeutics Agent’s Clinical Phase
        • Late-Stage (Phase III)
        • Phase II
        • Phase I
        • Pre-Clinical Stage & Discovery Candidates
      • UAE Outlook (USD Billion, 2019-2030)

      • UAE Geographic Atrophy by Age Group
        • Less than 65 Years
        • 65-74 Years
        • 75-84 Years
        • 85 Years and Above
      • UAE Geographic Atrophy by Diagnosis
        • Fundus Autofluorescence (FAF)
        • Optical Coherence Tomography Angiography (OCT-A)
        • Multifocal Electroretinography (mfERG)
      • UAE Geographic Atrophy by Therapeutics Agent’s Clinical Phase
        • Late-Stage (Phase III)
        • Phase II
        • Phase I
        • Pre-Clinical Stage & Discovery Candidates
      • Saudi Arabia Outlook (USD Billion, 2019-2030)

      • Saudi Arabia Geographic Atrophy by Age Group
        • Less than 65 Years
        • 65-74 Years
        • 75-84 Years
        • 85 Years and Above
      • Saudi Arabia Geographic Atrophy by Diagnosis
        • Fundus Autofluorescence (FAF)
        • Optical Coherence Tomography Angiography (OCT-A)
        • Multifocal Electroretinography (mfERG)
      • Saudi Arabia Geographic Atrophy by Therapeutics Agent’s Clinical Phase
        • Late-Stage (Phase III)
        • Phase II
        • Phase I
        • Pre-Clinical Stage & Discovery Candidates
      • South Africa Outlook (USD Billion, 2019-2030)

      • South Africa Geographic Atrophy by Age Group
        • Less than 65 Years
        • 65-74 Years
        • 75-84 Years
        • 85 Years and Above
      • South Africa Geographic Atrophy by Diagnosis
        • Fundus Autofluorescence (FAF)
        • Optical Coherence Tomography Angiography (OCT-A)
        • Multifocal Electroretinography (mfERG)
      • South Africa Geographic Atrophy by Therapeutics Agent’s Clinical Phase
        • Late-Stage (Phase III)
        • Phase II
        • Phase I
        • Pre-Clinical Stage & Discovery Candidates
      • Rest of Middle East & Africa Outlook (USD Billion, 2019-2030)

      • Rest of Middle East & Africa Geographic Atrophy by Age Group
        • Less than 65 Years
        • 65-74 Years
        • 75-84 Years
        • 85 Years and Above
      • Rest of Middle East & Africa Geographic Atrophy by Diagnosis
        • Fundus Autofluorescence (FAF)
        • Optical Coherence Tomography Angiography (OCT-A)
        • Multifocal Electroretinography (mfERG)
      • Rest of Middle East & Africa Geographic Atrophy by Therapeutics Agent’s Clinical Phase
        • Late-Stage (Phase III)
        • Phase II
        • Phase I
        • Pre-Clinical Stage & Discovery Candidates


    Geographic Atrophy (GA) Market Research Report—Global Forecast till 2032 Infographic
    Free Sample Request

    Kindly complete the form below to receive a free sample of this Report

    Customer Strories

    “I am very pleased with how market segments have been defined in a relevant way for my purposes (such as "Portable Freezers & refrigerators" and "last-mile"). In general the report is well structured. Thanks very much for your efforts.”

    Victoria Milne Founder
    Case Study

    Chemicals and Materials