• Cat-intel
  • MedIntelliX
  • Resources
  • About Us
  • Hero Background
    English
    Chinese
    French
    Japanese
    Korean
    German
    Spanish

    Europe LNG Bunkering Market Trends

    ID: MRFR/E&P/11165-HCR
    128 Pages
    Swapnil Palwe
    October 2025

    Europe LNG Bunkering Market Research Report Information By Product Type (Truck-to-Ship, Port-to-Ship, Ship-to-Ship, and Portable Tanks), By Application (Container Fleet, Tanker Fleet, Cargo Fleet, Ferries, Inland Vessels, and Others) – and Europe Market Forecast Till 2035

    Share:
    Download PDF ×

    We do not share your information with anyone. However, we may send you emails based on your report interest from time to time. You may contact us at any time to opt-out.

    Europe LNG Bunkering Market Infographic
    $ 4,950.0
    $ 5,950.0
    $ 7,250.0

    Market Trends

    Key Emerging Trends in the Europe LNG Bunkering Market

    The need for LNG bunkering in the marine industry is growing due to the increasing popularity of maritime trade. Maritime commerce plays a crucial role in the global economy, transporting the majority of goods across the seas. With the rising demand for commodities and raw materials from different countries, the maritime sector is expanding. As more ships are built and put into service to meet this demand, the need for fuel also rises.

    Ship owners and operators are facing the challenge of cutting fuel costs while meeting stringent environmental standards. In response, LNG (liquefied natural gas) is emerging as a favorable option. Compared to traditional marine fuels, LNG burns more cleanly, enabling shipping operators to reduce emissions and improve air quality. Additionally, especially during times of high oil prices, LNG tends to be more cost-effective than conventional marine fuels.

    LNG also helps maritime businesses comply with emission regulations such as the International Maritime Organization's (IMO) worldwide sulphur cap. Using LNG as a fuel allows ships to meet these standards without the need for expensive exhaust gas cleaning systems, as the sulphur content in LNG is significantly lower than that of conventional marine fuels.

    These advantages have contributed to the growing preference for LNG bunkering in shipping-based commerce. The trend is expected to continue as the world's population increases, the demand for goods rises, and more ships adopt LNG as a fuel source.

    Maritime trade is vital to the movement of goods globally. As the world population grows, so does the demand for commodities and raw materials from various countries. To meet this demand, the maritime sector is expanding, leading to the construction and deployment of more ships. However, this growth comes with challenges, particularly in terms of fuel costs and environmental impact.

    Ship owners and operators are increasingly turning to LNG as a solution to these challenges. LNG offers a cleaner burning alternative to traditional marine fuels, helping shipping companies reduce their emissions and contribute to better air quality. Moreover, the economic appeal of LNG, especially during periods of high oil prices, makes it an attractive choice for cost-conscious operators.

    Market Summary

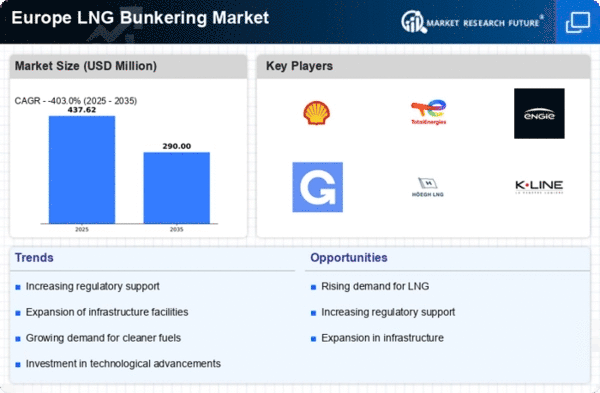
    The Europe LNG Bunkering market is projected to experience substantial growth from 175.52 USD Million in 2024 to 0.00 USD Million by 2035.

    Key Market Trends & Highlights

    Europe LNG Bunkering Key Trends and Highlights

    • The market is expected to grow at a compound annual growth rate of 15.84% from 2025 to 2035.
    • By 2035, the market valuation is anticipated to reach 982.0 USD Million, indicating robust expansion.
    • in 2024, the market is valued at 175.52 USD Million, reflecting the current investment landscape in LNG bunkering.
    • Growing adoption of LNG as a cleaner fuel alternative due to stringent environmental regulations is a major market driver.

    Market Size & Forecast

    2024 Market Size 175.52 (USD Million)
    2035 Market Size 0.00 (USD Million)
    CAGR (2025-2035) 0.00%
    Largest Regional Market Share in 2024 latin_america)

    Major Players

    Petroliam Nasiona Berhad (Petronas), Shv Energy, Exxon Mobil Corporation, Korea Gas Corporation, Polskie Lng S.A., Total Se, Royal Dutch Shell Plc, Crowley Maritime Corporation, Klaw Lng, Gasum Oy, Harvey Gulf International Marine, Broadview Energy Solutions B.V.

    Market Trends

    Rapid expansion of ferries in Europe is driving market growth

    Vessels used to transport freight over water are called ferries. Passenger ferries are utilized for transportation as water taxis or buses. In addition to the double-ended, hydrofoil, hovercraft, catamaran, roll-on/roll-off, cruise ferry (RoPax), rapid RoPax ferry, and others, there are various types of ferries. Additionally, the main fuels used by these boats are marine gas oil and heavy fuel oil. Notwithstanding, governmental mandates concerning the discharge of sulfur, carbon dioxide, and additional contaminants promote the utilization of LNG as a marine fuel.

    A rise in LNG-fueled ferries and OSVs is anticipated during the next five years, given the volume of orders for these vessels. During the projection period, there is a chance that the need for LNG bunkering services would rise. The European Commission created the European Green Deal in 2019, a package of legislative measures aimed at achieving carbon neutrality in Europe by the year 2050. It highlights the use of LNG as fuel for vehicles and marine vessels and briefly highlights the significance of LNG in accomplishing this goal.‏

    In the market for LNG bunkering, innovation is a major trend that is growing in popularity. To maintain their position in the market, major players are concentrating on introducing novel activities, such as ship-to-containership LNG bunkering. In January 2022, for example, the first ship-to-containership LNG bunkering operation in Marseilles was initiated by the French shipping and logistics company CMA CGM and the integrated energy and petroleum company TotalEnergies.

    During cargo operations, TotalEnergies' Gas Vitality, the first LNG bunker vessel based in France, refueled CMA CGM BALI, a 15, 000 TEU LNG-powered containership on the MEX 1 service connecting Asia and South Europe, with approximately 6, 000m3 of LNG through a ship-to-ship transfer alongside the Eurofos container terminal. Thus, driving the LNG bunkering market revenue.

    Europe LNG Bunkering Market Market Drivers

    Market Segment Insights

    LNG Bunkering Product Type Insights

    The Europe LNG Bunkering market segmentation, based on product type includes Truck-to-Ship, Port-to-Ship, Ship-to-Ship, and Portable Tanks. The ship-to-ship segment dominated the market mostly. The direct transfer of LNG between two ships is known as "ship-to-ship bunkering," and it usually involves a specialized LNG bunkering vessel and the receiving ship. This technique works especially well for bigger boats and enables bunkering to take place when both are anchored or at sea.

    Figure 1: Europe LNG Bunkering Market, by Product Type, 2022 & 2032 (USD Billion)

    Source: Secondary Research, Primary Research, Market Research Future Database and Analyst Review

    LNG Bunkering Application Insights

    The Europe LNG Bunkering market segmentation, based on application, includes Container Fleet, Tanker Fleet, Cargo Fleet, Ferries, Inland Vessels, and Others. The tanker category generated the most income. Various tanker fleets are available, with differences in tanker capacity: small tanker, intermediate tanker, large range 1 (LR1), large range 2 (LR2), very large crude carrier (VLCC), and ultra-large crude carrier (ULCC). Bulk gases and liquids are stored or transported using tanker fleets. These serve as storage and delivery systems for a variety of goods, including vegetable oil, wine, freshwater, molasses, and gas.

    Get more detailed insights about Europe LNG Bunkering Market Research Report—Forecast till 2032

    Regional Insights

    Europe held a sizable portion of the world market for LNG bunkering. This is explained by the region's early use of LNG as a maritime fuel and the existence of emission control areas (ECAs). Additionally, strict environmental rules are being framed by European nations to reduce air pollution, which is anticipated to promote the use of LNG as a maritime fuel in the area. Moreover, the growing need for LNG to lessen the maritime industry's carbon impact is a major driver of the LNG bunkering market.

    Moreover, LNG is a superior substitute fuel, and governments have been implementing measures to accommodate LNG.  Furthermore, strict environmental rules are being framed by European nations to reduce air pollution, which is anticipated to promote the use of LNG as a maritime fuel in the area.

    Figure 2: Europe Lng Bunkering Market Share By Region 2022 (Usd Billion)

    EUROPE LNG BUNKERING MARKET SHARE BY REGION 2022

    Source: Secondary Research, Primary Research, Market Research Future Database and Analyst Review

    Key Players and Competitive Insights

    Leading market players are investing heavily in research and development in order to expand their product lines, which will help the LNG bunkering market, grow even more. Market participants are also undertaking a variety of strategic activities to expand their  footprint, with important market developments including new product launches, contractual agreements, mergers and acquisitions, higher investments, and collaboration with other organizations. To expand and survive in a more competitive and rising market climate, LNG bunkering industry must offer cost-effective items.

    Key Companies in the Europe LNG Bunkering Market market include

    Industry Developments

    Market Segmentation

    LNG Bunkering Regional Outlook

    • Germany
    • France
    • UK
    • Italy
    • Spain
    • Sweden
    • Denmark
    • Luxembourg
    • Norway
    • Austria
    • Rest of Europe

    LNG Bunkering Application Outlook

    • Container Fleet
    • Tanker Fleet
    • Cargo Fleet
    • Ferries
    • Inland Vessels
    • Others

    LNG Bunkering Product Type Outlook

    • Truck-to-Ship
    • Port-to-Ship
    • Ship-to-Ship
    • Portable Tanks

    Report Scope

    Report Attribute/Metric Details
    Market Size 2035 USD 645.67 Million
    Compound Annual Growth Rate (CAGR) 0.00% (2025 - 2035)
    Base Year 2024
    Market Forecast Period 2025 - 2035
    Historical Data 2018- 2022
    Market Forecast Units Value (USD Billion)
    Report Coverage Revenue Forecast, Market Competitive Landscape, Growth Factors, and Trends
    Segments Covered Product Type, Application, and Region
    Region Covered Europe
    Countries Covered Germany, France, UK, Italy, Spain, Sweden, Denmark, Luxembourg, Norway, Austria, and Rest of Europe
    Key Companies Profiled PETROLIAM NASIONAL BERHAD (PETRONAS), SHV ENERGY, EXXON MOBIL CORPORATION, KOREA GAS CORPORATION, POLSKIE LNG S.A., TOTAL SE, ROYAL DUTCH SHELL PLC, CROWLEY MARITIME CORPORATION, KLAW LNG, GASUM OY, HARVEY GULF INTERNATIONAL MARINE, BROADVIEW ENERGY SOLUTIONS B.V.
    Key Market Opportunities Improvements to the LNG distribution network
    Key Market Dynamics Growing use of LNG as a fuel for ships while putting a greater emphasis on sustainable development·       Rise in the production and exploration of gas
    Market Size 2024 175.52 (Value (USD Billion))
    Market Size 2025 184.47 (Value (USD Billion))

    Market Highlights

    Author

    Swapnil Palwe
    Team Lead - Research

    She holds an experience of about 6+ years in market research and business consulting, working under the spectrum of information communication technology, telecommunications and semiconductor domains. aarti conceptualizes and implements a scalable business strategy and provides strategic leadership to the clients. her expertise lies in market estimation, competitive intelligence, pipeline analysis, customer assessment, etc.

    Leave a Comment

    Latest Comments

    John Doe
    john@example.com

    This is a great article! Really helped me understand the topic better.

    Posted on July 23, 2025, 10:15 AM
    Jane Smith
    jane@domain.com

    Thanks for sharing this. I’ve bookmarked it for later reference.

    Posted on July 22, 2025, 7:45 PM

    FAQs

    How much is the LNG bunkering market?

    The Europe LNG Bunkering market size was valued at USD 158.9 Million in 2022.

    What is the growth rate of the LNG bunkering market?

    The market is projected to grow at a CAGR of 15% during the forecast period, 2023-2032.

    Who are the key players in the LNG bunkering market?

    The key players in the market are PETROLIAM NASIONAL BERHAD (PETRONAS), SHV ENERGY, EXXON MOBIL CORPORATION, KOREA GAS CORPORATION, POLSKIE LNG S.A., TOTAL SE, ROYAL DUTCH SHELL PLC, CROWLEY MARITIME CORPORATION, KLAW LNG, GASUM OY, HARVEY GULF INTERNATIONAL MARINE, BROADVIEW ENERGY SOLUTIONS B.V.

    Which product type led the LNG bunkering market?

    The ship-to-ship category dominated the market in 2022.

    Which application had the largest market share in the LNG bunkering market?

    The tanker category had the largest share in the market.

    1. . EXECUTIVE SUMMARY
    2. . MARKET INTRODUCTION
    3. . Definition
    4. . Scope of the Study
    5. . Research Objective
    6. . Assumptions
    7. . Limitations
    8. . RESEARCH METHODOLOGY
    9. . Overview
    10. . Data Mining
    11. . Secondary Research
    12. . Primary Research
    13. . Primary Interviews and Information Gathering Process
    14. . Breakdown of Primary Respondents
    15. . Forecasting Model
    16. . Market Size Estimation
    17. . Bottom-Up Approach
    18. . Top-Down Approach
    19. . Data Triangulation
    20. . Validation
    21. . MARKET DYNAMICS
    22. . Overview
    23. . Drivers
    24. . Restraints
    25. . Opportunities
    26. . MARKET FACTOR ANALYSIS
    27. . Value Chain Analysis
    28. . Porter’s Five Forces Analysis
    29. . Bargaining Power of Suppliers
    30. . Bargaining Power of Buyers
    31. . Threat of New Entrants
    32. . Threat of Substitutes
    33. . Intensity of Rivalry
    34. . COVID-19 Impact Analysis
    35. . Market Impact Analysis
    36. . Regional Impact
    37. . Opportunity and Threat Analysis
    38. . EUROPE LNG BUNKERING MARKET, BY PRODUCT TYPE
    39. . Overview
    40. . Truck-to-Ship
    41. . Port-to-Ship
    42. . Ship-to-Ship
    43. . Portable Tanks
    44. . EUROPE LNG BUNKERING MARKET, BY APPLICATION
    45. . Overview
    46. . Container Fleet
    47. . Tanker Fleet
    48. . Cargo Fleet
    49. . Ferries
    50. . Inland Vessels
    51. . Others
    52. . EUROPE LNG BUNKERING MARKET, BY REGION
    53. . Overview
    54. . Europe
    55. . Germany
    56. . France
    57. . UK
    58. . Italy
    59. . Spain
    60. . Sweden
    61. . Denmark
    62. . Luxembourg
    63. . Norway
    64. . Austria
    65. . Rest of Europe
    66. . COMPETITIVE LANDSCAPE
    67. . Overview
    68. . Competitive Analysis
    69. . Market Share Analysis
    70. . Major Growth Strategy in the Europe LNG Bunkering Market,
    71. . Competitive Benchmarking
    72. . Leading Players in Terms of Number of Developments in the Europe LNG Bunkering Market,
    73. . Key developments and Growth Strategies
    74. . New Product Launch/Service Deployment
    75. . Merger & Acquisitions
    76. . Joint Ventures
    77. . Major Players Financial Matrix
    78. . Sales & Operating Income, 2022
    79. . Major Players R&D Expenditure. 2022
    80. . COMPANY PROFILES
    81. . PETROLIAM NASIONAL BERHAD (PETRONAS)
    82. . Company Overview
    83. . Financial Overview
    84. . Products Offered
    85. . Key Developments
    86. . SWOT Analysis
    87. . Key Strategies
    88. . SHV ENERGY
    89. . Company Overview
    90. . Financial Overview
    91. . Products Offered
    92. . Key Developments
    93. . SWOT Analysis
    94. . Key Strategies
    95. . EXXON MOBIL CORPORATION
    96. . Company Overview
    97. . Financial Overview
    98. . Products Offered
    99. . Key Developments
    100. . SWOT Analysis
    101. . Key Strategies
    102. . KOREA GAS CORPORATION
    103. . Company Overview
    104. . Financial Overview
    105. . Products Offered
    106. . Key Developments
    107. . SWOT Analysis
    108. . Key Strategies
    109. . POLSKIE LNG S.A
    110. . Company Overview
    111. . Financial Overview
    112. . Products Offered
    113. . Key Developments
    114. . SWOT Analysis
    115. . Key Strategies
    116. . TOTAL SE
    117. . Company Overview
    118. . Financial Overview
    119. . Products Offered
    120. . Key Developments
    121. . SWOT Analysis
    122. . Key Strategies
    123. . ROYAL DUTCH SHELL PLC
    124. . Company Overview
    125. . Financial Overview
    126. . Products Offered
    127. . Key Developments
    128. . SWOT Analysis
    129. . Key Strategies
    130. . CROWLEY MARITIME CORPORATION
    131. . Company Overview
    132. . Financial Overview
    133. . Products Offered
    134. . Key Developments
    135. . SWOT Analysis
    136. . Key Strategies
    137. . KLAW LNG
    138. . Company Overview
    139. . Financial Overview
    140. . Products Offered
    141. . Key Developments
    142. . SWOT Analysis
    143. . Key Strategies
    144. . GASUM OY
    145. . Company Overview
    146. . Financial Overview
    147. . Products Offered
    148. . Key Developments
    149. . SWOT Analysis
    150. . Key Strategies
    151. . HARVEY GULF INTERNATIONAL MARINE
    152. . Company Overview
    153. . Financial Overview
    154. . Products Offered
    155. . Key Developments
    156. . SWOT Analysis
    157. . Key Strategies
    158. . BROADVIEW ENERGY SOLUTIONS B.V.
    159. . Company Overview
    160. . Financial Overview
    161. . Products Offered
    162. . Key Developments
    163. . SWOT Analysis
    164. . Key Strategies
    165. . APPENDIX
    166. . References
    167. . Related Reports   LIST OF TABLES TABLE 1 EUROPE LNG BUNKERING MARKET, SYNOPSIS, 2018-2032 TABLE 2 EUROPE LNG BUNKERING MARKET, ESTIMATES & FORECAST, 2018-2032 (USD BILLION) TABLE 3 EUROPE LNG BUNKERING MARKET, BY PRODUCT TYPE, 2018-2032 (USD BILLION) TABLE 4 EUROPE LNG BUNKERING MARKET, BY APPLICATION, 2018-2032 (USD BILLION) TABLE 1 GERMANY: LNG BUNKERING MARKET, BY PRODUCT TYPE, 2018-2032 (USD BILLION) TABLE 2 GERMANY: LNG BUNKERING MARKET, BY APPLICATION, 2018-2032 (USD BILLION) TABLE 3 FRANCE: LNG BUNKERING MARKET, BY PRODUCT TYPE, 2018-2032 (USD BILLION) TABLE 4 FRANCE: LNG BUNKERING MARKET, BY APPLICATION, 2018-2032 (USD BILLION) TABLE 5 ITALY: LNG BUNKERING MARKET, BY PRODUCT TYPE, 2018-2032 (USD BILLION) TABLE 6 ITALY: LNG BUNKERING MARKET, BY APPLICATION, 2018-2032 (USD BILLION) TABLE 7 SPAIN: LNG BUNKERING MARKET, BY PRODUCT TYPE, 2018-2032 (USD BILLION) TABLE 8 SPAIN: LNG BUNKERING MARKET, BY APPLICATION, 2018-2032 (USD BILLION) TABLE 9 UK: LNG BUNKERING MARKET, BY PRODUCT TYPE, 2018-2032 (USD BILLION) TABLE 10 UK: LNG BUNKERING MARKET, BY APPLICATION, 2018-2032 (USD BILLION) TABLE 11 SWEDEN: LNG BUNKERING MARKET, BY PRODUCT TYPE, 2018-2032 (USD BILLION) TABLE 12 SWEDEN: LNG BUNKERING MARKET, BY APPLICATION, 2018-2032 (USD BILLION) TABLE 13 DENMARK: LNG BUNKERING MARKET, BY PRODUCT TYPE, 2018-2032 (USD BILLION) TABLE 14 DENMARK: LNG BUNKERING MARKET, BY APPLICATION, 2018-2032 (USD BILLION) TABLE 15 LUXEMBOURG: LNG BUNKERING MARKET, BY PRODUCT TYPE, 2018-2032 (USD BILLION) TABLE 16 LUXEMBOURG: LNG BUNKERING MARKET, BY APPLICATION, 2018-2032 (USD BILLION) TABLE 17 NORWAY: LNG BUNKERING MARKET, BY PRODUCT TYPE, 2018-2032 (USD BILLION) TABLE 18 NORWAY: LNG BUNKERING MARKET, BY APPLICATION, 2018-2032 (USD BILLION) TABLE 19 AUSTRIA: LNG BUNKERING MARKET, BY PRODUCT TYPE, 2018-2032 (USD BILLION) TABLE 20 AUSTRIA: LNG BUNKERING MARKET, BY APPLICATION, 2018-2032 (USD BILLION) TABLE 21 REST OF EUROPE: LNG BUNKERING MARKET, BY PRODUCT TYPE, 2018-2032 (USD BILLION) TABLE 22 REST OF EUROPE: LNG BUNKERING MARKET, BY APPLICATION, 2018-2032 (USD BILLION) LIST OF FIGURES FIGURE 1 RESEARCH PROCESS FIGURE 2 MARKET STRUCTURE FOR THE EUROPE LNG BUNKERING MARKET FIGURE 3 MARKET DYNAMICS FOR THE EUROPE LNG BUNKERING MARKET FIGURE 4 EUROPE LNG BUNKERING MARKET, SHARE (%), BY PRODUCT TYPE, 2021 FIGURE 5 EUROPE LNG BUNKERING MARKET, SHARE (%), BY APPLICATION, 2021 FIGURE 6 EUROPE LNG BUNKERING MARKET, SHARE (%), BY REGION, 2021 FIGURE 7 EUROPE LNG BUNKERING MARKET: COMPANY SHARE ANALYSIS, 2021 (%) FIGURE 8 PETROLIAM NASIONAL BERHAD (PETRONAS): FINANCIAL OVERVIEW SNAPSHOT FIGURE 9 PETROLIAM NASIONAL BERHAD (PETRONAS): SWOT ANALYSIS FIGURE 10 SHV ENERGY: FINANCIAL OVERVIEW SNAPSHOT FIGURE 11 SHV ENERGY: SWOT ANALYSIS FIGURE 12 EXXON MOBIL CORPORATION: FINANCIAL OVERVIEW SNAPSHOT FIGURE 13 EXXON MOBIL CORPORATION: SWOT ANALYSIS FIGURE 14 KOREA GAS CORPORATION: FINANCIAL OVERVIEW SNAPSHOT FIGURE 15 KOREA GAS CORPORATION: SWOT ANALYSIS FIGURE 16 POLSKIE LNG S.A: FINANCIAL OVERVIEW SNAPSHOT FIGURE 17 POLSKIE LNG S.A: SWOT ANALYSIS FIGURE 18 TOTAL SE: FINANCIAL OVERVIEW SNAPSHOT FIGURE 19 TOTAL SE: SWOT ANALYSIS FIGURE 20 ROYAL DUTCH SHELL PLC: FINANCIAL OVERVIEW SNAPSHOT FIGURE 21 ROYAL DUTCH SHELL PLC: SWOT ANALYSIS FIGURE 22 CROWLEY MARITIME CORPORATION: FINANCIAL OVERVIEW SNAPSHOT FIGURE 23 CROWLEY MARITIME CORPORATION: SWOT ANALYSIS FIGURE 24 KLAW LNG: FINANCIAL OVERVIEW SNAPSHOT FIGURE 25 KLAW LNG: SWOT ANALYSIS FIGURE 26 GASUM OY: FINANCIAL OVERVIEW SNAPSHOT FIGURE 27 GASUM OY: SWOT ANALYSIS FIGURE 28 HARVEY GULF INTERNATIONAL MARINE: FINANCIAL OVERVIEW SNAPSHOT FIGURE 29 HARVEY GULF INTERNATIONAL MARINE: SWOT ANALYSIS FIGURE 30 BROADVIEW ENERGY SOLUTIONS B.V.: FINANCIAL OVERVIEW SNAPSHOT FIGURE 31 BROADVIEW ENERGY SOLUTIONS B.V.: SWOT ANALYSIS
    168. List of Tables and Figures
      1. Table FIGURE 1 RESEARCH PROCESS FIGURE 2 MARKET STRUCTURE FOR THE EUROPE LNG BUNKERING MARKET FIGURE 3 MARKET DYNAMICS FOR THE EUROPE LNG BUNKERING MARKET FIGURE 4 EUROPE LNG BUNKERING MARKET, SHARE (%), BY PRODUCT TYPE, 2021 FIGURE 5 EUROPE LNG BUNKERING MARKET, SHARE (%), BY APPLICATION, 2021 FIGURE 6 EUROPE LNG BUNKERING MARKET, SHARE (%), BY REGION, 2021 FIGURE 7 EUROPE LNG BUNKERING MARKET: COMPANY SHARE ANALYSIS, 2021 (%) FIGURE 8 PETROLIAM NASIONAL BERHAD (PETRONAS): FINANCIAL OVERVIEW SNAPSHOT FIGURE 9 PETROLIAM NASIONAL BERHAD (PETRONAS): SWOT ANALYSIS FIGURE 10 SHV ENERGY: FINANCIAL OVERVIEW SNAPSHOT FIGURE 11 SHV ENERGY: SWOT ANALYSIS FIGURE 12 EXXON MOBIL CORPORATION: FINANCIAL OVERVIEW SNAPSHOT FIGURE 13 EXXON MOBIL CORPORATION: SWOT ANALYSIS FIGURE 14 KOREA GAS CORPORATION: FINANCIAL OVERVIEW SNAPSHOT FIGURE 15 KOREA GAS CORPORATION: SWOT ANALYSIS FIGURE 16 POLSKIE LNG S.A: FINANCIAL OVERVIEW SNAPSHOT FIGURE 17 POLSKIE LNG S.A: SWOT ANALYSIS FIGURE 18 TOTAL SE: FINANCIAL OVERVIEW SNAPSHOT FIGURE 19 TOTAL SE: SWOT ANALYSIS FIGURE 20 ROYAL DUTCH SHELL PLC: FINANCIAL OVERVIEW SNAPSHOT FIGURE 21 ROYAL DUTCH SHELL PLC: SWOT ANALYSIS FIGURE 22 CROWLEY MARITIME CORPORATION: FINANCIAL OVERVIEW SNAPSHOT FIGURE 23 CROWLEY MARITIME CORPORATION: SWOT ANALYSIS FIGURE 24 KLAW LNG: FINANCIAL OVERVIEW SNAPSHOT FIGURE 25 KLAW LNG: SWOT ANALYSIS FIGURE 26 GASUM OY: FINANCIAL OVERVIEW SNAPSHOT FIGURE 27 GASUM OY: SWOT ANALYSIS FIGURE 28 HARVEY GULF INTERNATIONAL MARINE: FINANCIAL OVERVIEW SNAPSHOT FIGURE 29 HARVEY GULF INTERNATIONAL MARINE: SWOT ANALYSIS FIGURE 30 BROADVIEW ENERGY SOLUTIONS B.V.: FINANCIAL OVERVIEW SNAPSHOT FIGURE 31 BROADVIEW ENERGY SOLUTIONS B.V.: SWOT ANALYSIS
    169. Table FIGURE 1 RESEARCH PROCESS FIGURE 2 MARKET STRUCTURE FOR THE EUROPE LNG BUNKERING MARKET FIGURE 3 MARKET DYNAMICS FOR THE EUROPE LNG BUNKERING MARKET FIGURE 4 EUROPE LNG BUNKERING MARKET, SHARE (%), BY PRODUCT TYPE, 2021 FIGURE 5 EUROPE LNG BUNKERING MARKET, SHARE (%), BY APPLICATION, 2021 FIGURE 6 EUROPE LNG BUNKERING MARKET, SHARE (%), BY REGION, 2021 FIGURE 7 EUROPE LNG BUNKERING MARKET: COMPANY SHARE ANALYSIS, 2021 (%) FIGURE 8 PETROLIAM NASIONAL BERHAD (PETRONAS): FINANCIAL OVERVIEW SNAPSHOT FIGURE 9 PETROLIAM NASIONAL BERHAD (PETRONAS): SWOT ANALYSIS FIGURE 10 SHV ENERGY: FINANCIAL OVERVIEW SNAPSHOT FIGURE 11 SHV ENERGY: SWOT ANALYSIS FIGURE 12 EXXON MOBIL CORPORATION: FINANCIAL OVERVIEW SNAPSHOT FIGURE 13 EXXON MOBIL CORPORATION: SWOT ANALYSIS FIGURE 14 KOREA GAS CORPORATION: FINANCIAL OVERVIEW SNAPSHOT FIGURE 15 KOREA GAS CORPORATION: SWOT ANALYSIS FIGURE 16 POLSKIE LNG S.A: FINANCIAL OVERVIEW SNAPSHOT FIGURE 17 POLSKIE LNG S.A: SWOT ANALYSIS FIGURE 18 TOTAL SE: FINANCIAL OVERVIEW SNAPSHOT FIGURE 19 TOTAL SE: SWOT ANALYSIS FIGURE 20 ROYAL DUTCH SHELL PLC: FINANCIAL OVERVIEW SNAPSHOT FIGURE 21 ROYAL DUTCH SHELL PLC: SWOT ANALYSIS FIGURE 22 CROWLEY MARITIME CORPORATION: FINANCIAL OVERVIEW SNAPSHOT FIGURE 23 CROWLEY MARITIME CORPORATION: SWOT ANALYSIS FIGURE 24 KLAW LNG: FINANCIAL OVERVIEW SNAPSHOT FIGURE 25 KLAW LNG: SWOT ANALYSIS FIGURE 26 GASUM OY: FINANCIAL OVERVIEW SNAPSHOT FIGURE 27 GASUM OY: SWOT ANALYSIS FIGURE 28 HARVEY GULF INTERNATIONAL MARINE: FINANCIAL OVERVIEW SNAPSHOT FIGURE 29 HARVEY GULF INTERNATIONAL MARINE: SWOT ANALYSIS FIGURE 30 BROADVIEW ENERGY SOLUTIONS B.V.: FINANCIAL OVERVIEW SNAPSHOT FIGURE 31 BROADVIEW ENERGY SOLUTIONS B.V.: SWOT ANALYSIS

    Europe LNG Bunkering Market Segmentation

    Market Segmentation Overview

    • Detailed segmentation data will be available in the full report
    • Comprehensive analysis by multiple parameters
    • Regional and country-level breakdowns
    • Market size forecasts by segment
    Infographic

    Free Sample Request

    Kindly complete the form below to receive a free sample of this Report

    Get Free Sample

    Customer Strories

    “I am very pleased with how market segments have been defined in a relevant way for my purposes (such as "Portable Freezers & refrigerators" and "last-mile"). In general the report is well structured. Thanks very much for your efforts.”

    Victoria Milne

    Founder
    Case Study
    Chemicals and Materials