• Cat-intel
  • MedIntelliX
  • Resources
  • About Us
  • Hero Background
    English
    Chinese
    French
    Japanese
    Korean
    German
    Spanish

    Europe LNG Bunkering Market Size

    ID: MRFR/E&P/11165-HCR
    128 Pages
    Swapnil Palwe
    October 2025

    Europe LNG Bunkering Market Research Report Information By Product Type (Truck-to-Ship, Port-to-Ship, Ship-to-Ship, and Portable Tanks), By Application (Container Fleet, Tanker Fleet, Cargo Fleet, Ferries, Inland Vessels, and Others) – and Europe Market Forecast Till 2035

    Share:
    Download PDF ×

    We do not share your information with anyone. However, we may send you emails based on your report interest from time to time. You may contact us at any time to opt-out.

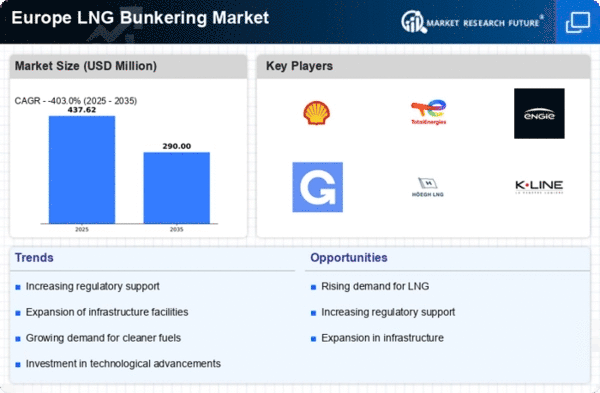
    Europe LNG Bunkering Market Infographic
    Purchase Options

    Europe Lng Bunkering Size

    Europe LNG Bunkering Market Growth Projections and Opportunities

    The LNG bunkering market is on the rise, thanks to the increasing use of liquefied natural gas (LNG) as a fuel in the shipping industry. This growth is closely tied to the expansion of the ship sector, which plays a pivotal role in global trade. Given that a significant portion of goods is transported by sea, the demand for shipping services is steadily climbing. This demand is fueled by the constant need for goods and raw materials from around the world, a need that the shipping industry fulfills.

    The global economy's growth and the emergence of new markets are additional factors driving the demand for shipping. As these markets expand, so does the necessity for more ships to facilitate the movement of products. Consequently, this surge in trade contributes to the increasing demand for LNG bunkering services. The reason behind this lies in the growing number of ships either being constructed with LNG-powered engines or being retrofitted to utilize LNG as a fuel source. The expansion of the marine industry, particularly the adoption of LNG as a fuel, has led to an upswing in the requirement for LNG bunkering infrastructure. This infrastructure encompasses not only new bunkering ships but also the development of LNG storage facilities and bunkering terminals. As the ship sector continues to grow, so does the need for a reliable and efficient LNG bunkering system.

    It's noteworthy that the creation of new LNG bunkering infrastructure is a natural consequence of the burgeoning ship industry. This infrastructure not only supports the current demand for LNG bunkering services but also lays the foundation for the future. The ongoing development of LNG bunkering facilities contributes to the maturity and dependability of the LNG bunkering market.

    In essence, the relationship between the expanding ship sector and the growing LNG bunkering market is symbiotic. The demand for LNG bunkering services is propelled by the increasing use of LNG in the marine industry, and, in turn, the expansion of LNG bunkering infrastructure is a response to the rising demands of the ship sector. This interdependence is expected to foster the continuous growth and development of the LNG bunkering market.

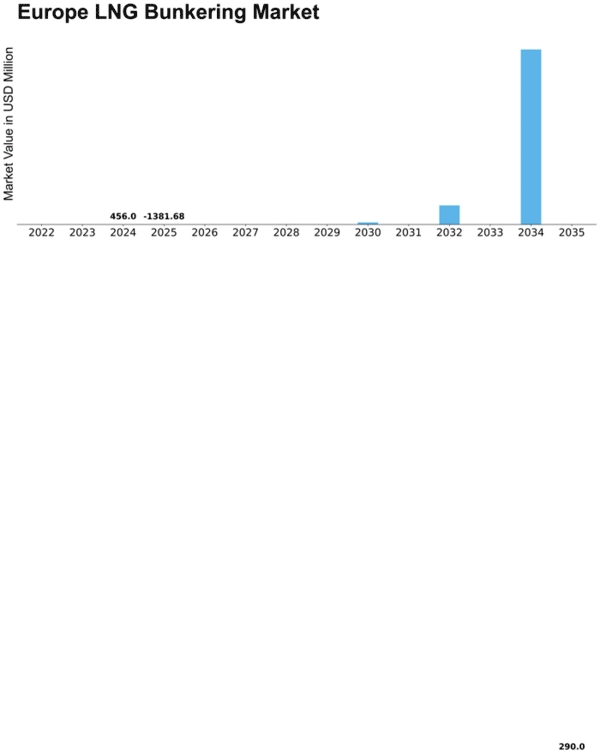
    Europe LNG Bunkering Market Size Graph
    Author
    Swapnil Palwe
    Team Lead - Research

    With a technical background as Bachelor's in Mechanical Engineering, with MBA in Operations Management , Swapnil has 6+ years of experience in market research, consulting and analytics with the tasks of data mining, analysis, and project execution. He is the POC for our clients, for their consulting projects running under the Automotive/A&D domain. Swapnil has worked on major projects in verticals such as Aerospace & Defense, Automotive and many other domain projects. He has worked on projects for fortune 500 companies' syndicate and consulting projects along with several government projects.

    Leave a Comment

    FAQs

    How much is the LNG bunkering market?

    The Europe LNG Bunkering market size was valued at USD 158.9 Million in 2022.

    What is the growth rate of the LNG bunkering market?

    The market is projected to grow at a CAGR of 15% during the forecast period, 2023-2032.

    Who are the key players in the LNG bunkering market?

    The key players in the market are PETROLIAM NASIONAL BERHAD (PETRONAS), SHV ENERGY, EXXON MOBIL CORPORATION, KOREA GAS CORPORATION, POLSKIE LNG S.A., TOTAL SE, ROYAL DUTCH SHELL PLC, CROWLEY MARITIME CORPORATION, KLAW LNG, GASUM OY, HARVEY GULF INTERNATIONAL MARINE, BROADVIEW ENERGY SOLUTIONS B.V.

    Which product type led the LNG bunkering market?

    The ship-to-ship category dominated the market in 2022.

    Which application had the largest market share in the LNG bunkering market?

    The tanker category had the largest share in the market.

    Market Summary

    The Europe LNG Bunkering market is projected to experience substantial growth from 175.52 USD Million in 2024 to 982 USD Million by 2035.

    Key Market Trends & Highlights

    Europe LNG Bunkering Key Trends and Highlights

    • The market is expected to grow at a compound annual growth rate of 15.84% from 2025 to 2035. By 2035, the market valuation is anticipated to reach 982.0 USD Million, indicating robust expansion. in 2024, the market is valued at 175.52 USD Million, reflecting the current investment landscape in LNG bunkering. Growing adoption of LNG as a cleaner fuel alternative due to stringent environmental regulations is a major market driver.

    Market Size & Forecast

    2024 Market Size 175.52 (USD Million)
    2035 Market Size 982 (USD Million)
    CAGR (2025-2035) 15.84%
    Largest Regional Market Share in 2024 latin_america)

    Major Players

    <p>Petroliam Nasiona Berhad (Petronas), Shv Energy, Exxon Mobil Corporation, Korea Gas Corporation, Polskie Lng S.A., Total Se, Royal Dutch Shell Plc, Crowley Maritime Corporation, Klaw Lng, Gasum Oy, Harvey Gulf International Marine, Broadview Energy Solutions B.V.</p>

    Market Trends

    Rapid expansion of ferries in Europe is driving market growth

    Vessels used to transport freight over water are called ferries. Passenger ferries are utilized for transportation as water taxis or buses. In addition to the double-ended, hydrofoil, hovercraft, catamaran, roll-on/roll-off, cruise ferry (RoPax), rapid RoPax ferry, and others, there are various types of ferries. Additionally, the main fuels used by these boats are marine gas oil and heavy fuel oil. Notwithstanding, governmental mandates concerning the discharge of sulfur, carbon dioxide, and additional contaminants promote the utilization of LNG as a marine fuel.

    A rise in LNG-fueled ferries and OSVs is anticipated during the next five years, given the volume of orders for these vessels. During the projection period, there is a chance that the need for LNG bunkering services would rise. The European Commission created the European Green Deal in 2019, a package of legislative measures aimed at achieving carbon neutrality in Europe by the year 2050. It highlights the use of LNG as fuel for vehicles and marine vessels and briefly highlights the significance of LNG in accomplishing this goal.‏

    In the market for LNG bunkering, innovation is a major trend that is growing in popularity. To maintain their position in the market, major players are concentrating on introducing novel activities, such as ship-to-containership LNG bunkering. In January 2022, for example, the first ship-to-containership LNG bunkering operation in Marseilles was initiated by the French shipping and logistics company CMA CGM and the integrated energy and petroleum company TotalEnergies.

    During cargo operations, TotalEnergies' Gas Vitality, the first LNG bunker vessel based in France, refueled CMA CGM BALI, a 15, 000 TEU LNG-powered containership on the MEX 1 service connecting Asia and South Europe, with approximately 6, 000m3 of LNG through a ship-to-ship transfer alongside the Eurofos container terminal. Thus, driving the LNG bunkering market revenue.

    Europe LNG Bunkering Market Market Drivers

    Market Segment Insights

    LNG Bunkering Product Type Insights

    <p>The Europe LNG Bunkering market segmentation, based on product type includes Truck-to-Ship, Port-to-Ship, Ship-to-Ship, and Portable Tanks. The ship-to-ship segment dominated the market mostly. The direct transfer of LNG between two ships is known as "ship-to-ship bunkering," and it usually involves a specialized LNG bunkering vessel and the receiving ship. This technique works especially well for bigger boats and enables bunkering to take place when both are anchored or at sea.</p>

    <p>Figure 1: Europe LNG Bunkering Market, by Product Type, 2022 &amp; 2032 (USD Billion)</p>

    <p>Source: Secondary Research, Primary Research, Market Research Future Database and Analyst Review</p>

    LNG Bunkering Application Insights

    <p>The Europe LNG Bunkering market segmentation, based on application, includes Container Fleet, Tanker Fleet, Cargo Fleet, Ferries, Inland Vessels, and Others. The tanker category generated the most income. Various tanker fleets are available, with differences in tanker capacity: small tanker, intermediate tanker, large range 1 (LR1), large range 2 (LR2), very large crude carrier (VLCC), and ultra-large crude carrier (ULCC). Bulk gases and liquids are stored or transported using tanker fleets. These serve as storage and delivery systems for a variety of goods, including vegetable oil, wine, freshwater, molasses, and gas.</p>

    Get more detailed insights about Europe LNG Bunkering Market Research Report—Forecast till 2035

    Regional Insights

    Europe held a sizable portion of the world market for LNG bunkering. This is explained by the region's early use of LNG as a maritime fuel and the existence of emission control areas (ECAs). Additionally, strict environmental rules are being framed by European nations to reduce air pollution, which is anticipated to promote the use of LNG as a maritime fuel in the area. Moreover, the growing need for LNG to lessen the maritime industry's carbon impact is a major driver of the LNG bunkering market.

    Moreover, LNG is a superior substitute fuel, and governments have been implementing measures to accommodate LNG.  Furthermore, strict environmental rules are being framed by European nations to reduce air pollution, which is anticipated to promote the use of LNG as a maritime fuel in the area.

    Figure 2: Europe Lng Bunkering Market Share By Region 2022 (Usd Billion)

    EUROPE LNG BUNKERING MARKET SHARE BY REGION 2022

    Source: Secondary Research, Primary Research, Market Research Future Database and Analyst Review

    Key Players and Competitive Insights

    Leading market players are investing heavily in research and development in order to expand their product lines, which will help the LNG bunkering market, grow even more. Market participants are also undertaking a variety of strategic activities to expand their  footprint, with important market developments including new product launches, contractual agreements, mergers and acquisitions, higher investments, and collaboration with other organizations. To expand and survive in a more competitive and rising market climate, LNG bunkering industry must offer cost-effective items.

    Key Companies in the Europe LNG Bunkering Market market include

    Industry Developments

    Future Outlook

    Europe LNG Bunkering Market Future Outlook

    Market Segmentation

    LNG Bunkering Regional Outlook

    • EuropeGermanyFranceUKItalySpainSwedenDenmarkLuxembourgNorwayAustriaRest of Europe
    • Germany
    • France
    • UK
    • Italy
    • Spain
    • Sweden
    • Denmark
    • Luxembourg
    • Norway
    • Austria
    • Rest of Europe

    LNG Bunkering Application Outlook

    • Container Fleet
    • Tanker Fleet
    • Cargo Fleet
    • Ferries
    • Inland Vessels
    • Others

    LNG Bunkering Product Type Outlook

    • Truck-to-Ship
    • Port-to-Ship
    • Ship-to-Ship
    • Portable Tanks

    Report Scope

    Report Attribute/MetricDetails
    Market Size 2035USD 645.67 Million
    Compound Annual Growth Rate (CAGR)0.00% (2025 - 2035)
    Base Year2024
    Market Forecast Period2025 - 2035
    Historical Data2018- 2022
    Market Forecast UnitsValue (USD Billion)
    Report CoverageRevenue Forecast, Market Competitive Landscape, Growth Factors, and Trends
    Segments CoveredProduct Type, Application, and Region
    Region CoveredEurope
    Countries CoveredGermany, France, UK, Italy, Spain, Sweden, Denmark, Luxembourg, Norway, Austria, and Rest of Europe
    Key Companies ProfiledPETROLIAM NASIONAL BERHAD (PETRONAS), SHV ENERGY, EXXON MOBIL CORPORATION, KOREA GAS CORPORATION, POLSKIE LNG S.A., TOTAL SE, ROYAL DUTCH SHELL PLC, CROWLEY MARITIME CORPORATION, KLAW LNG, GASUM OY, HARVEY GULF INTERNATIONAL MARINE, BROADVIEW ENERGY SOLUTIONS B.V.
    Key Market OpportunitiesImprovements to the LNG distribution network
    Key Market DynamicsGrowing use of LNG as a fuel for ships while putting a greater emphasis on sustainable development·       Rise in the production and exploration of gas
    Market Size 2024175.52 (Value (USD Billion))
    Market Size 2025184.47 (Value (USD Billion))

    FAQs

    How much is the LNG bunkering market?

    The Europe LNG Bunkering market size was valued at USD 158.9 Million in 2022.

    What is the growth rate of the LNG bunkering market?

    The market is projected to grow at a CAGR of 15% during the forecast period, 2023-2032.

    Who are the key players in the LNG bunkering market?

    The key players in the market are PETROLIAM NASIONAL BERHAD (PETRONAS), SHV ENERGY, EXXON MOBIL CORPORATION, KOREA GAS CORPORATION, POLSKIE LNG S.A., TOTAL SE, ROYAL DUTCH SHELL PLC, CROWLEY MARITIME CORPORATION, KLAW LNG, GASUM OY, HARVEY GULF INTERNATIONAL MARINE, BROADVIEW ENERGY SOLUTIONS B.V.

    Which product type led the LNG bunkering market?

    The ship-to-ship category dominated the market in 2022.

    Which application had the largest market share in the LNG bunkering market?

    The tanker category had the largest share in the market.

    1. SECTION I: EXECUTIVE SUMMARY AND KEY HIGHLIGHTS
      1. | 1.1 EXECUTIVE SUMMARY
      2. | | 1.1.1 Market Overview
      3. | | 1.1.2 Key Findings
      4. | | 1.1.3 Market Segmentation
      5. | | 1.1.4 Competitive Landscape
      6. | | 1.1.5 Challenges and Opportunities
      7. | | 1.1.6 Future Outlook
    2. SECTION II: SCOPING, METHODOLOGY AND MARKET STRUCTURE
      1. | 2.1 MARKET INTRODUCTION
      2. | | 2.1.1 Definition
      3. | | 2.1.2 Scope of the study
      4. | | | 2.1.2.1 Research Objective
      5. | | | 2.1.2.2 Assumption
      6. | | | 2.1.2.3 Limitations
      7. | 2.2 RESEARCH METHODOLOGY
      8. | | 2.2.1 Overview
      9. | | 2.2.2 Data Mining
      10. | | 2.2.3 Secondary Research
      11. | | 2.2.4 Primary Research
      12. | | | 2.2.4.1 Primary Interviews and Information Gathering Process
      13. | | | 2.2.4.2 Breakdown of Primary Respondents
      14. | | 2.2.5 Forecasting Model
      15. | | 2.2.6 Market Size Estimation
      16. | | | 2.2.6.1 Bottom-Up Approach
      17. | | | 2.2.6.2 Top-Down Approach
      18. | | 2.2.7 Data Triangulation
      19. | | 2.2.8 Validation
    3. SECTION III: QUALITATIVE ANALYSIS
      1. | 3.1 MARKET DYNAMICS
      2. | | 3.1.1 Overview
      3. | | 3.1.2 Drivers
      4. | | 3.1.3 Restraints
      5. | | 3.1.4 Opportunities
      6. | 3.2 MARKET FACTOR ANALYSIS
      7. | | 3.2.1 Value chain Analysis
      8. | | 3.2.2 Porter's Five Forces Analysis
      9. | | | 3.2.2.1 Bargaining Power of Suppliers
      10. | | | 3.2.2.2 Bargaining Power of Buyers
      11. | | | 3.2.2.3 Threat of New Entrants
      12. | | | 3.2.2.4 Threat of Substitutes
      13. | | | 3.2.2.5 Intensity of Rivalry
      14. | | 3.2.3 COVID-19 Impact Analysis
      15. | | | 3.2.3.1 Market Impact Analysis
      16. | | | 3.2.3.2 Regional Impact
      17. | | | 3.2.3.3 Opportunity and Threat Analysis
    4. SECTION IV: QUANTITATIVE ANALYSIS
      1. | 4.1 Energy & Power, BY Product Type (USD Million)
      2. | | 4.1.1 Truck-to-Ship
      3. | | 4.1.2 Port-to-Ship
      4. | | 4.1.3 Ship-to-Ship
      5. | | 4.1.4 Portable Tanks
      6. | 4.2 Energy & Power, BY Application (USD Million)
      7. | | 4.2.1 Container Fleet
      8. | | 4.2.2 Tanker Fleet
      9. | | 4.2.3 Cargo Fleet
      10. | | 4.2.4 Ferries
      11. | | 4.2.5 Inland Vessels
      12. | | 4.2.6 Others
      13. | 4.3 Energy & Power, BY Region (USD Million)
      14. | | 4.3.1 North America
      15. | | | 4.3.1.1 US
      16. | | | 4.3.1.2 Canada
      17. | | 4.3.2 Europe
      18. | | | 4.3.2.1 Germany
      19. | | | 4.3.2.2 UK
      20. | | | 4.3.2.3 France
      21. | | | 4.3.2.4 Russia
      22. | | | 4.3.2.5 Italy
      23. | | | 4.3.2.6 Spain
      24. | | | 4.3.2.7 Rest of Europe
      25. | | 4.3.3 APAC
      26. | | | 4.3.3.1 China
      27. | | | 4.3.3.2 India
      28. | | | 4.3.3.3 Japan
      29. | | | 4.3.3.4 South Korea
      30. | | | 4.3.3.5 Malaysia
      31. | | | 4.3.3.6 Thailand
      32. | | | 4.3.3.7 Indonesia
      33. | | | 4.3.3.8 Rest of APAC
      34. | | 4.3.4 South America
      35. | | | 4.3.4.1 Brazil
      36. | | | 4.3.4.2 Mexico
      37. | | | 4.3.4.3 Argentina
      38. | | | 4.3.4.4 Rest of South America
      39. | | 4.3.5 MEA
      40. | | | 4.3.5.1 GCC Countries
      41. | | | 4.3.5.2 South Africa
      42. | | | 4.3.5.3 Rest of MEA
    5. SECTION V: COMPETITIVE ANALYSIS
      1. | 5.1 Competitive Landscape
      2. | | 5.1.1 Overview
      3. | | 5.1.2 Competitive Analysis
      4. | | 5.1.3 Market share Analysis
      5. | | 5.1.4 Major Growth Strategy in the Energy & Power
      6. | | 5.1.5 Competitive Benchmarking
      7. | | 5.1.6 Leading Players in Terms of Number of Developments in the Energy & Power
      8. | | 5.1.7 Key developments and growth strategies
      9. | | | 5.1.7.1 New Product Launch/Service Deployment
      10. | | | 5.1.7.2 Merger & Acquisitions
      11. | | | 5.1.7.3 Joint Ventures
      12. | | 5.1.8 Major Players Financial Matrix
      13. | | | 5.1.8.1 Sales and Operating Income
      14. | | | 5.1.8.2 Major Players R&D Expenditure. 2023
      15. | 5.2 Company Profiles
      16. | | 5.2.1 Shell (GB)
      17. | | | 5.2.1.1 Financial Overview
      18. | | | 5.2.1.2 Products Offered
      19. | | | 5.2.1.3 Key Developments
      20. | | | 5.2.1.4 SWOT Analysis
      21. | | | 5.2.1.5 Key Strategies
      22. | | 5.2.2 TotalEnergies (FR)
      23. | | | 5.2.2.1 Financial Overview
      24. | | | 5.2.2.2 Products Offered
      25. | | | 5.2.2.3 Key Developments
      26. | | | 5.2.2.4 SWOT Analysis
      27. | | | 5.2.2.5 Key Strategies
      28. | | 5.2.3 Gasum (FI)
      29. | | | 5.2.3.1 Financial Overview
      30. | | | 5.2.3.2 Products Offered
      31. | | | 5.2.3.3 Key Developments
      32. | | | 5.2.3.4 SWOT Analysis
      33. | | | 5.2.3.5 Key Strategies
      34. | | 5.2.4 Engie (FR)
      35. | | | 5.2.4.1 Financial Overview
      36. | | | 5.2.4.2 Products Offered
      37. | | | 5.2.4.3 Key Developments
      38. | | | 5.2.4.4 SWOT Analysis
      39. | | | 5.2.4.5 Key Strategies
      40. | | 5.2.5 Svitzer (DK)
      41. | | | 5.2.5.1 Financial Overview
      42. | | | 5.2.5.2 Products Offered
      43. | | | 5.2.5.3 Key Developments
      44. | | | 5.2.5.4 SWOT Analysis
      45. | | | 5.2.5.5 Key Strategies
      46. | | 5.2.6 Bunker Holding (DK)
      47. | | | 5.2.6.1 Financial Overview
      48. | | | 5.2.6.2 Products Offered
      49. | | | 5.2.6.3 Key Developments
      50. | | | 5.2.6.4 SWOT Analysis
      51. | | | 5.2.6.5 Key Strategies
      52. | | 5.2.7 K Line (JP)
      53. | | | 5.2.7.1 Financial Overview
      54. | | | 5.2.7.2 Products Offered
      55. | | | 5.2.7.3 Key Developments
      56. | | | 5.2.7.4 SWOT Analysis
      57. | | | 5.2.7.5 Key Strategies
      58. | | 5.2.8 Aegean Bunkering (GR)
      59. | | | 5.2.8.1 Financial Overview
      60. | | | 5.2.8.2 Products Offered
      61. | | | 5.2.8.3 Key Developments
      62. | | | 5.2.8.4 SWOT Analysis
      63. | | | 5.2.8.5 Key Strategies
      64. | | 5.2.9 Port of Rotterdam (NL)
      65. | | | 5.2.9.1 Financial Overview
      66. | | | 5.2.9.2 Products Offered
      67. | | | 5.2.9.3 Key Developments
      68. | | | 5.2.9.4 SWOT Analysis
      69. | | | 5.2.9.5 Key Strategies
      70. | 5.3 Appendix
      71. | | 5.3.1 References
      72. | | 5.3.2 Related Reports
    6. LIST OF FIGURES
      1. | 6.1 MARKET SYNOPSIS
      2. | 6.2 NORTH AMERICA MARKET ANALYSIS
      3. | 6.3 US MARKET ANALYSIS BY PRODUCT TYPE
      4. | 6.4 US MARKET ANALYSIS BY APPLICATION
      5. | 6.5 CANADA MARKET ANALYSIS BY PRODUCT TYPE
      6. | 6.6 CANADA MARKET ANALYSIS BY APPLICATION
      7. | 6.7 EUROPE MARKET ANALYSIS
      8. | 6.8 GERMANY MARKET ANALYSIS BY PRODUCT TYPE
      9. | 6.9 GERMANY MARKET ANALYSIS BY APPLICATION
      10. | 6.10 UK MARKET ANALYSIS BY PRODUCT TYPE
      11. | 6.11 UK MARKET ANALYSIS BY APPLICATION
      12. | 6.12 FRANCE MARKET ANALYSIS BY PRODUCT TYPE
      13. | 6.13 FRANCE MARKET ANALYSIS BY APPLICATION
      14. | 6.14 RUSSIA MARKET ANALYSIS BY PRODUCT TYPE
      15. | 6.15 RUSSIA MARKET ANALYSIS BY APPLICATION
      16. | 6.16 ITALY MARKET ANALYSIS BY PRODUCT TYPE
      17. | 6.17 ITALY MARKET ANALYSIS BY APPLICATION
      18. | 6.18 SPAIN MARKET ANALYSIS BY PRODUCT TYPE
      19. | 6.19 SPAIN MARKET ANALYSIS BY APPLICATION
      20. | 6.20 REST OF EUROPE MARKET ANALYSIS BY PRODUCT TYPE
      21. | 6.21 REST OF EUROPE MARKET ANALYSIS BY APPLICATION
      22. | 6.22 APAC MARKET ANALYSIS
      23. | 6.23 CHINA MARKET ANALYSIS BY PRODUCT TYPE
      24. | 6.24 CHINA MARKET ANALYSIS BY APPLICATION
      25. | 6.25 INDIA MARKET ANALYSIS BY PRODUCT TYPE
      26. | 6.26 INDIA MARKET ANALYSIS BY APPLICATION
      27. | 6.27 JAPAN MARKET ANALYSIS BY PRODUCT TYPE
      28. | 6.28 JAPAN MARKET ANALYSIS BY APPLICATION
      29. | 6.29 SOUTH KOREA MARKET ANALYSIS BY PRODUCT TYPE
      30. | 6.30 SOUTH KOREA MARKET ANALYSIS BY APPLICATION
      31. | 6.31 MALAYSIA MARKET ANALYSIS BY PRODUCT TYPE
      32. | 6.32 MALAYSIA MARKET ANALYSIS BY APPLICATION
      33. | 6.33 THAILAND MARKET ANALYSIS BY PRODUCT TYPE
      34. | 6.34 THAILAND MARKET ANALYSIS BY APPLICATION
      35. | 6.35 INDONESIA MARKET ANALYSIS BY PRODUCT TYPE
      36. | 6.36 INDONESIA MARKET ANALYSIS BY APPLICATION
      37. | 6.37 REST OF APAC MARKET ANALYSIS BY PRODUCT TYPE
      38. | 6.38 REST OF APAC MARKET ANALYSIS BY APPLICATION
      39. | 6.39 SOUTH AMERICA MARKET ANALYSIS
      40. | 6.40 BRAZIL MARKET ANALYSIS BY PRODUCT TYPE
      41. | 6.41 BRAZIL MARKET ANALYSIS BY APPLICATION
      42. | 6.42 MEXICO MARKET ANALYSIS BY PRODUCT TYPE
      43. | 6.43 MEXICO MARKET ANALYSIS BY APPLICATION
      44. | 6.44 ARGENTINA MARKET ANALYSIS BY PRODUCT TYPE
      45. | 6.45 ARGENTINA MARKET ANALYSIS BY APPLICATION
      46. | 6.46 REST OF SOUTH AMERICA MARKET ANALYSIS BY PRODUCT TYPE
      47. | 6.47 REST OF SOUTH AMERICA MARKET ANALYSIS BY APPLICATION
      48. | 6.48 MEA MARKET ANALYSIS
      49. | 6.49 GCC COUNTRIES MARKET ANALYSIS BY PRODUCT TYPE
      50. | 6.50 GCC COUNTRIES MARKET ANALYSIS BY APPLICATION
      51. | 6.51 SOUTH AFRICA MARKET ANALYSIS BY PRODUCT TYPE
      52. | 6.52 SOUTH AFRICA MARKET ANALYSIS BY APPLICATION
      53. | 6.53 REST OF MEA MARKET ANALYSIS BY PRODUCT TYPE
      54. | 6.54 REST OF MEA MARKET ANALYSIS BY APPLICATION
      55. | 6.55 KEY BUYING CRITERIA OF ENERGY & POWER
      56. | 6.56 RESEARCH PROCESS OF MRFR
      57. | 6.57 DRO ANALYSIS OF ENERGY & POWER
      58. | 6.58 DRIVERS IMPACT ANALYSIS: ENERGY & POWER
      59. | 6.59 RESTRAINTS IMPACT ANALYSIS: ENERGY & POWER
      60. | 6.60 SUPPLY / VALUE CHAIN: ENERGY & POWER
      61. | 6.61 ENERGY & POWER, BY PRODUCT TYPE, 2024 (% SHARE)
      62. | 6.62 ENERGY & POWER, BY PRODUCT TYPE, 2024 TO 2035 (USD Million)
      63. | 6.63 ENERGY & POWER, BY APPLICATION, 2024 (% SHARE)
      64. | 6.64 ENERGY & POWER, BY APPLICATION, 2024 TO 2035 (USD Million)
      65. | 6.65 BENCHMARKING OF MAJOR COMPETITORS
    7. LIST OF TABLES
      1. | 7.1 LIST OF ASSUMPTIONS
      2. | | 7.1.1
      3. | 7.2 North America MARKET SIZE ESTIMATES; FORECAST
      4. | | 7.2.1 BY PRODUCT TYPE, 2025-2035 (USD Million)
      5. | | 7.2.2 BY APPLICATION, 2025-2035 (USD Million)
      6. | 7.3 US MARKET SIZE ESTIMATES; FORECAST
      7. | | 7.3.1 BY PRODUCT TYPE, 2025-2035 (USD Million)
      8. | | 7.3.2 BY APPLICATION, 2025-2035 (USD Million)
      9. | 7.4 Canada MARKET SIZE ESTIMATES; FORECAST
      10. | | 7.4.1 BY PRODUCT TYPE, 2025-2035 (USD Million)
      11. | | 7.4.2 BY APPLICATION, 2025-2035 (USD Million)
      12. | 7.5 Europe MARKET SIZE ESTIMATES; FORECAST
      13. | | 7.5.1 BY PRODUCT TYPE, 2025-2035 (USD Million)
      14. | | 7.5.2 BY APPLICATION, 2025-2035 (USD Million)
      15. | 7.6 Germany MARKET SIZE ESTIMATES; FORECAST
      16. | | 7.6.1 BY PRODUCT TYPE, 2025-2035 (USD Million)
      17. | | 7.6.2 BY APPLICATION, 2025-2035 (USD Million)
      18. | 7.7 UK MARKET SIZE ESTIMATES; FORECAST
      19. | | 7.7.1 BY PRODUCT TYPE, 2025-2035 (USD Million)
      20. | | 7.7.2 BY APPLICATION, 2025-2035 (USD Million)
      21. | 7.8 France MARKET SIZE ESTIMATES; FORECAST
      22. | | 7.8.1 BY PRODUCT TYPE, 2025-2035 (USD Million)
      23. | | 7.8.2 BY APPLICATION, 2025-2035 (USD Million)
      24. | 7.9 Russia MARKET SIZE ESTIMATES; FORECAST
      25. | | 7.9.1 BY PRODUCT TYPE, 2025-2035 (USD Million)
      26. | | 7.9.2 BY APPLICATION, 2025-2035 (USD Million)
      27. | 7.10 Italy MARKET SIZE ESTIMATES; FORECAST
      28. | | 7.10.1 BY PRODUCT TYPE, 2025-2035 (USD Million)
      29. | | 7.10.2 BY APPLICATION, 2025-2035 (USD Million)
      30. | 7.11 Spain MARKET SIZE ESTIMATES; FORECAST
      31. | | 7.11.1 BY PRODUCT TYPE, 2025-2035 (USD Million)
      32. | | 7.11.2 BY APPLICATION, 2025-2035 (USD Million)
      33. | 7.12 Rest of Europe MARKET SIZE ESTIMATES; FORECAST
      34. | | 7.12.1 BY PRODUCT TYPE, 2025-2035 (USD Million)
      35. | | 7.12.2 BY APPLICATION, 2025-2035 (USD Million)
      36. | 7.13 APAC MARKET SIZE ESTIMATES; FORECAST
      37. | | 7.13.1 BY PRODUCT TYPE, 2025-2035 (USD Million)
      38. | | 7.13.2 BY APPLICATION, 2025-2035 (USD Million)
      39. | 7.14 China MARKET SIZE ESTIMATES; FORECAST
      40. | | 7.14.1 BY PRODUCT TYPE, 2025-2035 (USD Million)
      41. | | 7.14.2 BY APPLICATION, 2025-2035 (USD Million)
      42. | 7.15 India MARKET SIZE ESTIMATES; FORECAST
      43. | | 7.15.1 BY PRODUCT TYPE, 2025-2035 (USD Million)
      44. | | 7.15.2 BY APPLICATION, 2025-2035 (USD Million)
      45. | 7.16 Japan MARKET SIZE ESTIMATES; FORECAST
      46. | | 7.16.1 BY PRODUCT TYPE, 2025-2035 (USD Million)
      47. | | 7.16.2 BY APPLICATION, 2025-2035 (USD Million)
      48. | 7.17 South Korea MARKET SIZE ESTIMATES; FORECAST
      49. | | 7.17.1 BY PRODUCT TYPE, 2025-2035 (USD Million)
      50. | | 7.17.2 BY APPLICATION, 2025-2035 (USD Million)
      51. | 7.18 Malaysia MARKET SIZE ESTIMATES; FORECAST
      52. | | 7.18.1 BY PRODUCT TYPE, 2025-2035 (USD Million)
      53. | | 7.18.2 BY APPLICATION, 2025-2035 (USD Million)
      54. | 7.19 Thailand MARKET SIZE ESTIMATES; FORECAST
      55. | | 7.19.1 BY PRODUCT TYPE, 2025-2035 (USD Million)
      56. | | 7.19.2 BY APPLICATION, 2025-2035 (USD Million)
      57. | 7.20 Indonesia MARKET SIZE ESTIMATES; FORECAST
      58. | | 7.20.1 BY PRODUCT TYPE, 2025-2035 (USD Million)
      59. | | 7.20.2 BY APPLICATION, 2025-2035 (USD Million)
      60. | 7.21 Rest of APAC MARKET SIZE ESTIMATES; FORECAST
      61. | | 7.21.1 BY PRODUCT TYPE, 2025-2035 (USD Million)
      62. | | 7.21.2 BY APPLICATION, 2025-2035 (USD Million)
      63. | 7.22 South America MARKET SIZE ESTIMATES; FORECAST
      64. | | 7.22.1 BY PRODUCT TYPE, 2025-2035 (USD Million)
      65. | | 7.22.2 BY APPLICATION, 2025-2035 (USD Million)
      66. | 7.23 Brazil MARKET SIZE ESTIMATES; FORECAST
      67. | | 7.23.1 BY PRODUCT TYPE, 2025-2035 (USD Million)
      68. | | 7.23.2 BY APPLICATION, 2025-2035 (USD Million)
      69. | 7.24 Mexico MARKET SIZE ESTIMATES; FORECAST
      70. | | 7.24.1 BY PRODUCT TYPE, 2025-2035 (USD Million)
      71. | | 7.24.2 BY APPLICATION, 2025-2035 (USD Million)
      72. | 7.25 Argentina MARKET SIZE ESTIMATES; FORECAST
      73. | | 7.25.1 BY PRODUCT TYPE, 2025-2035 (USD Million)
      74. | | 7.25.2 BY APPLICATION, 2025-2035 (USD Million)
      75. | 7.26 Rest of South America MARKET SIZE ESTIMATES; FORECAST
      76. | | 7.26.1 BY PRODUCT TYPE, 2025-2035 (USD Million)
      77. | | 7.26.2 BY APPLICATION, 2025-2035 (USD Million)
      78. | 7.27 MEA MARKET SIZE ESTIMATES; FORECAST
      79. | | 7.27.1 BY PRODUCT TYPE, 2025-2035 (USD Million)
      80. | | 7.27.2 BY APPLICATION, 2025-2035 (USD Million)
      81. | 7.28 GCC Countries MARKET SIZE ESTIMATES; FORECAST
      82. | | 7.28.1 BY PRODUCT TYPE, 2025-2035 (USD Million)
      83. | | 7.28.2 BY APPLICATION, 2025-2035 (USD Million)
      84. | 7.29 South Africa MARKET SIZE ESTIMATES; FORECAST
      85. | | 7.29.1 BY PRODUCT TYPE, 2025-2035 (USD Million)
      86. | | 7.29.2 BY APPLICATION, 2025-2035 (USD Million)
      87. | 7.30 Rest of MEA MARKET SIZE ESTIMATES; FORECAST
      88. | | 7.30.1 BY PRODUCT TYPE, 2025-2035 (USD Million)
      89. | | 7.30.2 BY APPLICATION, 2025-2035 (USD Million)
      90. | 7.31 PRODUCT LAUNCH/PRODUCT DEVELOPMENT/APPROVAL
      91. | | 7.31.1
      92. | 7.32 ACQUISITION/PARTNERSHIP
      93. | | 7.32.1

    Europe LNG Bunkering Market Segmentation

    Market Segmentation Overview

    • Detailed segmentation data will be available in the full report
    • Comprehensive analysis by multiple parameters
    • Regional and country-level breakdowns
    • Market size forecasts by segment
    Infographic

    Free Sample Request

    Kindly complete the form below to receive a free sample of this Report

    Get Free Sample

    Customer Strories

    “I am very pleased with how market segments have been defined in a relevant way for my purposes (such as "Portable Freezers & refrigerators" and "last-mile"). In general the report is well structured. Thanks very much for your efforts.”

    Victoria Milne

    Founder
    Case Study
    Chemicals and Materials

    Compare Licence

    ×
    Features License Type
    Single User Multiuser License Enterprise User
    Price $4,950 $5,950 $7,250
    Maximum User Access Limit 1 User Upto 10 Users Unrestricted Access Throughout the Organization
    Free Customization
    Direct Access to Analyst
    Deliverable Format
    Platform Access
    Discount on Next Purchase 10% 15% 15%
    Printable Versions