• Cat-intel
  • MedIntelliX
  • Resources
  • About Us
  • Request Free Sample ×

    Kindly complete the form below to receive a free sample of this Report

    Leading companies partner with us for data-driven Insights

    clients tt-cursor

    Dietary Supplements Personalized Nutrition Market

    ID: MRFR/F-B & N/4248-CR
    166 Pages
    Snehal Singh
    March 2018

    Dietary Supplements in the Age of Personalized Nutrition Market Research Report Information By Product Category (Vitamins and Herbs & Botanicals), By Application (Lifestyle Diseases and Inherited Disease), By Gender (Female and Male), By Dosage Form (Capsules, Powder, Liquids, Soft Gels, and Others), And By Region (North America, Europe, Asia-Pacific, And Rest Of The World) –Market Forecast Till 2034

    Share:
    Download PDF ×

    We do not share your information with anyone. However, we may send you emails based on your report interest from time to time. You may contact us at any time to opt-out.

    Dietary Supplements in the age of Personalized Nutrition Market Research Report - Global Forecast till 2034 Infographic
    Purchase Options
    $ 4,950.0
    $ 5,950.0
    $ 7,250.0
    Table of Contents

    Dietary Supplements Personalized Nutrition Market Summary

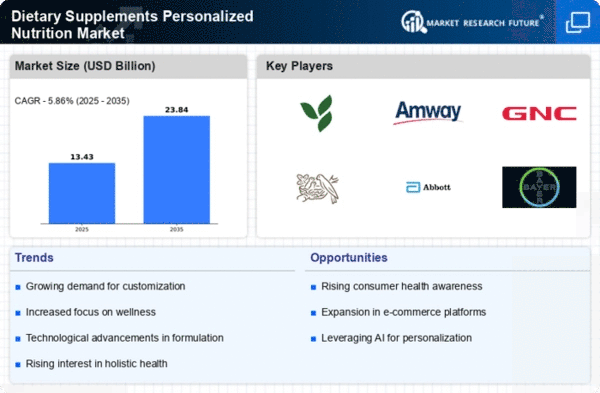
    As per Market Research Future Analysis, the Global Dietary Supplements in the Age of Personalized Nutrition Market is poised for significant growth, driven by an increasing aging population and rising health consciousness. The market size was estimated at USD 16.00 Billion in 2024 and is projected to reach USD 72.18 Billion by 2034, growing at a CAGR of 16.26% from 2025 to 2034. The demand for personalized dietary supplements is surging as consumers seek tailored nutritional solutions to meet their unique health needs. Innovations in product offerings, particularly through AI technology, are enhancing market competitiveness.

    Key Market Trends & Highlights

    The market is witnessing several key trends that are shaping its growth trajectory.

    • The market is expected to grow from USD 18.60 Billion in 2025 to USD 72.18 Billion by 2034.
    • Chronic illness prevalence is driving demand, with 37.3 million Americans projected to have diabetes by 2022.
    • The vitamins segment dominated the market, with 31% of survey participants taking multi-mineral supplements.
    • The female segment generated the most income due to specific dietary needs related to hormonal balance.

    Market Size & Forecast

    2024 Market Size USD 16.00 Billion
    2025 Market Size USD 18.60 Billion
    2034 Market Size USD 72.18 Billion
    CAGR (2025-2034) 16.26%

    Major Players

    Key players include Nestlé Health Science, Danone Nutricia, Carlyle Group, Amway (Nutrilite), Archer Daniels Midland, and Abbott Laboratories.

    Dietary Supplements Personalized Nutrition Market Trends

      • Growing prevalence of chronic illness is driving the market growth

    The market for dietary supplements in the age of personalized nutrition is anticipated to develop as chronic illness prevalence rises. Chronic diseases are characterized as long-lasting ailments that, while often incurable, can be controlled with dietary changes and medical care. These disorders frequently progress gradually over time due to a confluence of genetic, environmental, and behavioral variables. Because it takes into account a person's particular genetic make-up, health history, and present health state, dietary supplements in the age of personalized nutrition is crucial to the treatment of chronic disease.

    This enables the development of a personalized nutrition strategy that targets certain health issues and deals with any nutrient deficits or imbalances. For instance, according to the Centers for Disease Control and Prevention, a US national public health organisation, 37.3 million Americans, or 11.3% of the country's population, will have diabetes by 2022. As a result, the market CAGR for dietary supplements in the age of personalized nutrition is being driven by the rising prevalence of disease.

    The dietary supplements in the age of personalized nutrition market is growing in popularity, and one significant trend is product innovation. To remain competitive, major players in the market are concentrating on utilizing cutting-edge technology like artificial intelligence. For instance, an Al-based personalized nutrition service was introduced by the Indian nutraceutical start-up BhookhaHaathi in April 2020. The Al examines a particular consumer's profile, puts them in groups with other customers who have similar profiles, forecasts their health needs, and recommends the necessary nutrients. The system makes recommendations that are specifically suited to the user's past, present, and future health situation.

    Thus, driving the dietary supplements in the age of personalized nutrition market revenue.

    The increasing consumer demand for tailored health solutions suggests a transformative shift in the dietary supplements market, emphasizing the importance of personalized nutrition in enhancing individual well-being.

    U.S. Food and Drug Administration (FDA)

    Dietary Supplements Personalized Nutrition Market Drivers

    Rising Health Consciousness

    The Global Dietary Supplements in the Age of Personalized Nutrition Industry is experiencing a surge in demand driven by increasing health consciousness among consumers. Individuals are becoming more aware of the importance of nutrition in maintaining overall health and preventing chronic diseases. This trend is evident as the market is projected to reach 16 USD Billion in 2024, reflecting a growing preference for supplements tailored to individual health needs. The rise in lifestyle-related health issues has prompted consumers to seek personalized nutrition solutions, thereby propelling the growth of dietary supplements that cater to specific health requirements.

    Market Segment Insights

    Dietary Supplements in the Age of Personalized Nutrition Product Category Insights

    The  dietary supplements in the age of personalized nutrition market segmentation, based on product category includes Vitamins and Herbs & Botanicals. The vitamins segment dominated the market. Any dietary gaps that people may have in their diets can be easily filled by taking vitamin supplements. A research published in June 2022 in JAMA Network Open reports that 31% of survey participants take multi-mineral supplements. The human body needs three specific vitamins, according to Dr. Heather Moday's advice in her CNBC article from January 2022. In addition, market growth is anticipated to be aided by product development in the sector.

    Dietary Supplements in the Age of Personalized Nutrition Application Insights

    The  dietary supplements in the age of personalized nutrition market segmentation, based on application, includes Lifestyle Diseases and Inherited Disease. The lifestyle diseases category generated the most income. Non-communicable diseases (NCDs), usually referred to as lifestyle diseases, are medical problems whose main causes are poor lifestyle decisions and practices. These illnesses are frequently linked to long-term exposure to risk factors include a poor diet, a sedentary lifestyle, tobacco use, excessive alcohol use, and ongoing stress. This group of diseases includes stroke, hypertension (high blood pressure), and coronary artery disease.

    These diseases can arise as a result of unhealthy eating patterns, inactivity, smoking, and drinking too much alcohol.

    Figure 1  Dietary Supplements in the Age of Personalized Nutrition Market, by Application, 2022 & 2032 (USD Billion)Dietary Supplements in the Age of Personalized Nutrition Market, by Application, 2022 & 2032

    Source Secondary Research, Primary Research, MRFR Database and Analyst Review

    Dietary Supplements in the Age of Personalized Nutrition Gender Insights

    The  dietary supplements in the age of personalized nutrition market segmentation, based on gender, includes Female and Male. The female category generated the most income. Due to conditions including menstruation, pregnancy, menopause, and general hormonal balance, women's dietary demands are different. As a result, there has been an increase in the production of women's health supplements that cater exclusively to these requirements. These dietary supplements frequently include nutrients like iron, vitamin D, calcium, folic acid, and omega-3 fatty acids that are crucial for bone health, reproductive health, and general well-being.

    Dietary Supplements in the Age of Personalized Nutrition Dosage Form Insights

    The  dietary supplements in the age of personalized nutrition market segmentation, based on dosage form, includes Capsules, Powder, Liquids, Soft Gels, and Others. The liquids category generated the most income because senior people and children are using it more frequently. The benefit of liquid supplements and vitamins is that it is simpler to customize them by adding different amounts of various nutrients to create a unique blend. The elderly population finds it simple to consume supplements in this form, and they also absorb more quickly into the body.

    Regional Insights

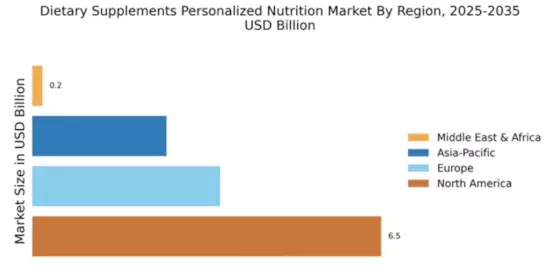
    By region, the study provides the market insights into North America, Europe, Asia-Pacific and Rest of the World. The North American dietary supplements in the age of personalized nutrition market area will dominate this market. The existence of significant manufacturers, the high consumption of dietary supplements, the growing awareness of weight control, among other factors, are largely responsible for this huge proportion. One of the key drivers of market expansion is the availability of a well-developed infrastructure for creating AI-based platforms for dietary supplements in the age of personalized nutrition.

    Further, the major countries studied in the market report are The US, Canada, German, France, the UK, Italy, Spain, China, Japan, India, Australia, South Korea, and Brazil.

    Figure 2  DIETARY SUPPLEMENTS IN THE AGE OF PERSONALIZED NUTRITION MARKET SHARE BY REGION 2022 (USD Billion)DIETARY SUPPLEMENTS IN THE AGE OF PERSONALIZED NUTRITION MARKET SHARE BY REGION 2022

    Source Secondary Research, Primary Research, MRFR Database and Analyst Review

    Europe dietary supplements in the age of personalized nutrition market accounts for the second-largest market share. In the era of personalized nutrition, rapid R&D on clinical nutrition and new product innovation in dietary supplements are fueling revenue growth in this sector. Additionally, the region's revenue is growing as a result of an increase in the number of sports clubs, their personalized nutrition plans, and a greater emphasis on immunity and health. Additionally, the region's revenue growth is being fueled by changes in lifestyle, consumer preferences, the increase of the middle class, and the presence of well-known important companies.

    Further, the German dietary supplements in the age of personalized nutrition market held the largest market share, and the UK dietary supplements in the age of personalized nutrition market was the fastest growing market in the European region

    The Asia-Pacific dietary supplements in the age of personalized nutrition Market is expected to grow at the fastest CAGR from 2023 to 2032. The region is anticipated to experience the quickest growth because it offers a lot of opportunities and has developing economies. The dietary supplements in the age of personalized nutrition market growth includes various factors like recent advancements in healthcare, strengthening economies, a large population that is ageing, and higher healthcare spending are having an impact on the growth of the dietary supplement market.

    Moreover, China’s dietary supplements in the age of personalized nutrition market held the largest market share, and the Indian dietary supplements in the age of personalized nutrition market was the fastest growing market in the Asia-Pacific region.

    Key Players and Competitive Insights

    Leading market players are investing heavily in research and development in order to expand their product lines, which will help the dietary supplements in the age of personalized nutrition market, grow even more. Market participants are also undertaking a variety of strategic activities to expand their  footprint, with important market developments including new product launches, contractual agreements, mergers and acquisitions, higher investments, and collaboration with other organizations. To expand and survive in a more competitive and rising market climate, dietary supplements in the age of personalized nutrition industry must offer cost-effective items.

    Manufacturing locally to minimize operational costs is one of the key business tactics used by manufacturers in the  dietary supplements in the age of personalized nutrition industry to benefit clients and increase the market sector. In recent years, the dietary supplements in the age of personalized nutrition industry has offered some of the most significant advantages to market. Major players in the dietary supplements in the age of personalized nutrition market attempting to increase market demand by investing in research and development operations include Nestlé Health Science, Danone Nutricia, Carlyle Group, Amway (Nutrilite), Archer Daniels Midland and Abbott Laboratories.

    Amway Corp., an affiliate of Alticor  Holdings Inc., is a direct seller that makes, sells, and distributes goods for body care, beauty, and nutrition. The company's product line includes cookware, energy drinks, surface cleaners, surface cleansers with disinfectants, dish detergents, weight management and sports nutrition products, vitamins, minerals, nutritional supplements, and weight management goods. Additionally, it provides makeup removers, hair, body, and oral care products, as well as cleansers, toners, moisturizers, eye and lip care items, serums, masques/exfoliators, and other intensive treatments.

    Agriculture-related goods, commodities, and ingredients are produced, processed, transported, stored, and marketed by Archer Daniels Midland Co (ADM). The business manufactures oilseeds, corn, wheat, and other agricultural goods as well as ingredients for food and beverages. The range of products offered by ADM includes wheat, animal feed, vegetable oil, maize sweeteners, natural flavors and colors, health and nutrition goods and biofuels. Through its  grain elevator and transportation network, the firm stores, cleans, and delivers agricultural commodities including oilseeds, corn, wheat, milo, oats, and barley as well as various products made from these inputs.

    Key Companies in the Dietary Supplements Personalized Nutrition Market market include

    Industry Developments

    July 2018:A portion of Mixfit Inc.'s shares was purchased by Royal DSM. With this transaction, DSM and Mixfit officially declared their collaboration on the creation of dietary supplements and nutritional goods.

    June 2018:Using a combination of artificial intelligence, DNA testing, and smartphone applications, Nestle S.A. decided to target the ageing population of Japan when launching its first personalised nutrition service.

    Future Outlook

    Dietary Supplements Personalized Nutrition Market Future Outlook

    The Global Dietary Supplements market in the Age of Personalized Nutrition is projected to grow at a 16.26% CAGR from 2024 to 2035, driven by technological advancements and consumer demand for tailored health solutions.

    New opportunities lie in:

    • Develop AI-driven personalized supplement recommendations based on genetic profiling.
    • Expand product lines to include plant-based and organic dietary supplements.
    • Leverage e-commerce platforms for targeted marketing and direct-to-consumer sales strategies.

    By 2035, the market is expected to reach unprecedented levels, reflecting a robust demand for personalized nutrition solutions.

    Market Segmentation

    Dietary Supplements in the Age of Personalized Nutrition Regional Outlook (USD Billion, 2018-2032)

    North America
    • US
    • Canada

    Dietary Supplements in the Age of Personalized Nutrition Application Outlook (USD Billion, 2018-2032)

    • Lifestyle Diseases
    • Inherited Disease

    Dietary Supplements in the Age of Personalized Nutrition Dosage Form Outlook (USD Billion, 2018-2032)

    • Capsules
    • Powder
    • Liquids
    • Soft Gels
    • Others

    Dietary Supplements in the Age of Personalized Nutrition Product Gender Outlook (USD Billion, 2018-2032)

    • Female
    • Male

    Dietary Supplements in the Age of Personalized Nutrition Product Category Outlook (USD Billion, 2018-2032)

    • Vitamins
    • HERBS & BOTANICALS

    Report Scope

    Report Attribute/Metric Details
    Market Size 2024   16.00 (USD Billion)
    Market Size 2025   18.60 (USD Billion)
    Market Size 2034   72.18 (USD Billion)
    Compound Annual Growth Rate (CAGR)   16.26 % (2025 - 2034)
    Report Coverage Revenue Forecast, Competitive Landscape, Growth Factors, and Trends
    Base Year 2024
    Market Forecast Period 2025 - 2034
    Historical Data 2020 - 2024
    Report Coverage Revenue Forecast, Market Competitive Landscape, Growth Factors, and Trends
    Segments Covered Product Category, Application, Gender, Dosage Form, and Region
    Geographies Covered North America, Europe, Asia Pacific, and the Rest of the World
    Countries Covered The US, Canada, German, France, UK, Italy, Spain, China, Japan, India, Australia, South Korea, and Brazil
    Key Companies Profiled Nestlé Health Science, Danone Nutricia, Carlyle Group, Amway (Nutrilite), Archer Daniels Midland and Abbott Laboratories
    Key Market Opportunities Massive advancements in the dietary supplements preparation in the field of personalized nutrition
    Key Market Dynamics Changing food habits Stringent regulatory framework

    Market Highlights

    Author
    Snehal Singh
    Assistant Manager - Research

    High acumen in analyzing complex macro & micro markets with more than 6 years of work experience in the field of market research. By implementing her analytical skills in forecasting and estimation into market research reports, she has expertise in Packaging, Construction, and Equipment domains. She handles a team size of 20-25 resources and ensures smooth running of the projects, associated marketing activities, and client servicing.

    Leave a Comment

    FAQs

    How much is the Dietary supplements in the age of personalized nutrition market?

    The Dietary supplements in the age of personalized nutrition market size was valued at USD 12.9 Billion in 2022.

    What is the growth rate of the Dietary supplements in the age of personalized nutrition market?

    The market is projected to grow at a CAGR of 16.26% during the forecast period, 2025 - 2034

    Which region held the largest market share in the Dietary supplements in the age of personalized nutrition market?

    North America had the largest share in the market.

    Who are the key players in the Dietary supplements in the age of personalized nutrition market?

    The key players in the market are Nestlé Health Science, Danone Nutricia, Carlyle Group, Amway (Nutrilite), Archer Daniels Midland and Abbott Laboratories.

    Which product category led the Dietary supplements in the age of personalized nutrition market?

    The vitamins category dominated the market in 2022.

    Which gender had the largest market share in the Dietary supplements in the age of personalized nutrition market?

    The female category had the largest share in the market.

    1. '1 Report Prologue
    2. Market Introduction
      1. Introduction 21
      2. Scope of Study 21
      3. Research Objective 21
      4. Assumptions &
    3. Limitations 21
      1. Assumptions 21
        1. Limitations 21
    4. Research Methodology
      1. Primary Research Methodology 24
        1. Secondary
    5. Research Methodology 25
      1. Market Share Analysis 25
        1. Market Pricing
    6. Approach 26
    7. Market Dynamics
      1. Introduction 28
      2. Drivers
        1. Increasing incidence of diseases due to sedentary lifestyles and a
    8. lack of balanced diet 29
      1. Rising awareness towards weight management and
    9. maintenance of a healthy lifestyle 30
      1. Increasing Geriatric Population
      2. Restraints 32
        1. Negative publicity and presence of misbranded
    10. supplements 32
      1. Lack of awareness about consumption of dosage of the supplements
      2. Opportunities 34
        1. Introduction of e-commerce portals 34
        2. Increase in merger & acquisition activity and growing R&D spending
    11. for dietary supplements 35
      1. Challenges 36
        1. Increasing regulatory
    12. pressures 36
      1. Mega Trends: 37
        1. Rise in Global Obesity Population
        2. Increasing sales of VMHS category 37
      2. Macroeconomic Indicators
      3. Technology Trend & Assessment 38
    13. Market Factor Analysis
      1. Porter’s Five Forces Model 40
        1. Bargaining Power of Suppliers
        2. Bargaining Power of Buyers 40
        3. Threat of New Entrants 41
        4. Threat of Substitutes 41
        5. Intensity of Rivalry 41
      2. Value
    14. Chain Analysis 41
      1. R&D 42
        1. Manufacturing 42
        2. Distribution
    15. & Sales 42
      1. Post-Sales Monitoring 42
      2. Demand & Supply:
    16. Gap Analysis 43
      1. Pricing Analysis 43
      2. Investment Opportunity Analysis
    17. Global Dietary Supplements in an Age of Personalized Nutrition Market,
    18. By Product Category
      1. Introduction 45
      2. Vitamins 46
      3. Herbs
    19. & Botanicals 46
      1. Sports Supplements 47
      2. Meal Supplements 47
      3. Minerals 47
    20. Global Dietary Supplements in the Age of Personalized
    21. Nutrition Market, By Application
      1. Introduction 49
      2. Lifestyle Diseases
      3. Inherited Diseases 50
      4. Genetic Predispositions 50
    22. Global Dietary Supplements in the Age of Personalized Nutrition Market, By Gender
      1. Introduction 52
      2. Female 53
        1. 55 + Age Group 53
    23. 54 Age Group 54
      1. 19-34 Age Group 54
        1. 0-18 Age Group 54
      2. Male 55
        1. 55 + Age Group 55
        2. 35-54 Age Group 56
    24. 34 Age Group 56
      1. 0-18 Age Group 56
    25. Global Dietary Supplements
    26. in the Age of Personalized Nutrition Market, By Dosage Form
      1. Introduction
      2. Tablets 59
      3. Capsules 59
      4. Powder 60
      5. Liquids
      6. Soft Gels 60
    27. Global Dietary Supplements in the Age of
    28. Personalized Nutrition Market, By End user
      1. Introduction 62
      2. Hospitals
    29. & Clinics 63
      1. Homecare 63
    30. Global Dietary Supplements
    31. in the Age of Personalized Nutrition Market, By Region
      1. Introduction 65
      2. Americas 66
        1. North America 70
    32. Canada 74
      1. South America 77
      2. Europe 80
        1. Western Europe
    33. Italy 93
      1. Spain 96
        1. Rest of Western Europe 98
    34. Eastern Europe 100
      1. Asia Pacific 103
        1. Japan 107
    35. China 109
      1. India 112
        1. Republic of Korea 114
        2. Australia
        3. Rest of Asia Pacific 119
      2. The Middle East & Africa
        1. UAE 126
        2. Saudi Arabia 128
        3. Oman 131
    36. Kuwait 133
      1. Qatar 135
        1. Rest of Middle East & Africa 138
    37. Company Landscape
      1. Company Share Analysis 142
    38. Company
    39. Profiles
      1. Abbott Laboratories 144
        1. Company Overview 144
    40. Financials 144
      1. Products 144
        1. Strategy 144
        2. Key
    41. Developments 144
      1. Bayer AG 145
        1. Company Overview 145
    42. Financials 145
      1. Products 145
        1. Strategy 145
        2. Key
    43. Developments 145
      1. GlaxoSmithKline Plc. 146
        1. Company Overview
        2. Financials 146
        3. Products 146
        4. Strategy 146
        5. Key Developments 146
      2. Pfizer Inc. 147
        1. Company Overview
        2. Financials 147
        3. Products 147
        4. Strategy 147
        5. Key Developments 147
      3. Balchem Corporation 148
        1. Company
    44. Overview 148
      1. Financials 148
        1. Products 148
        2. Strategy
        3. Key Developments 148
      2. Natures Product Inc. 149
    45. Company Overview 149
      1. Financials 149
        1. Products 149
    46. Strategy 149
      1. Key Developments 149
      2. Bactolac Pharmaceutical
    47. Inc. 150
      1. Company Overview 150
        1. Financials 150
    48. Products 150
      1. Strategy 150
        1. Key Developments 150
    49. Nestle Health Science 151
      1. Company Overview 151
        1. Financials
        2. Products 151
        3. Strategy 151
        4. Key Developments
      2. Danone Nutricia 152
        1. Company Overview 152
        2. Financials
        3. Products 152
        4. Strategy 152
        5. Key Developments
      3. Carlyle Group 153
        1. Company Overview 153
    50. Financials 153
      1. Products 153
        1. Strategy 153
    51. Key Developments 153
      1. Herbalife International 154
        1. Company
    52. Overview 154
      1. Financials 154
        1. Products 154
    53. Strategy 154
      1. Key Developments 154
      2. Archer Daniels Midland
        1. Company Overview 155
        2. Financials 155
        3. Products
        4. Strategy 155
        5. Key Developments 155
      3. Danisco
    54. (DuPont) 156
      1. Company Overview 156
        1. Financials 156
    55. Products 156
      1. Strategy 156
        1. Key Developments 156
    56. Glanbia 157
      1. Company Overview 157
        1. Financials 157
    57. Products 157
      1. Strategy 157
        1. Key Developments 157
    58. Amway (Nutrilite) 158
      1. Company Overview 158
        1. Financials
        2. Products 158
        3. Strategy 158
        4. Key Developments
    59. Conclusion
      1. Key Findings 160
        1. CEO’s
    60. Viewpoint 160
      1. Key Companies to Watch 160
        1. Prediction of Dietary
    61. Supplements in an Age of Personalized Nutrition Industry 160
    62. Appendix
      1. Discussion Blue Print 162
    63. List of Tables
    64. BY PRODUCT CATEGORY 2023-2032 (USD MILLION) 46
    65. IN THE AGE OF PERSONALIZED NUTRITION, FOR VITAMINS, BY REGION 2023-2032 (USD MILLION)
    66. FOR HERBS & BOTANICALS, BY REGION 2023-2032 (USD MILLION) 46
    67. DIETARY SUPPLEMENTS IN THE AGE OF PERSONALIZED NUTRITION, FOR SPORTS SUPPLEMENTS,
    68. BY REGION 2023-2032 (USD MILLION) 47
    69. THE AGE OF PERSONALIZED NUTRITION, FOR MEAL SUPPLEMENTS, BY REGION 2023-2032 (USD
    70. MILLION) 47
    71. FOR MINERALS, BY REGION 2023-2032 (USD MILLION) 47
    72. IN THE AGE OF PERSONALIZED NUTRITION, BY APPLICATION 2023-2032 (USD MILLION) 49
    73. DISEASES, BY REGION 2023-2032 (USD MILLION) 50
    74. IN THE AGE OF PERSONALIZED NUTRITION, FOR INHERITED DISEASES, BY REGION 2023-2032
    75. (USD MILLION) 50
    76. NUTRITION, FOR GENETIC PREDISPOSITIONS, BY REGION 2023-2032 (USD MILLION) 50
    77. 2032 (USD MILLION) 52
    78. PERSONALIZED NUTRITION, FOR FEMALE, BY REGION 2023-2032 (USD MILLION) 53
    79. GLOBAL DIETARY SUPPLEMENTS IN THE AGE OF PERSONALIZED NUTRITION, FOR FEMALE,
    80. BY TYPE 2023-2032 (USD MILLION) 53
    81. AGE OF PERSONALIZED NUTRITION, FOR FEMALE, FOR 55 + AGE GROUP, BY REGION 2023-2032
    82. (USD MILLION) 53
    83. NUTRITION, FOR FEMALE, FOR 35-54 AGE GROUP, BY REGION 2023-2032 (USD MILLION) 54
    84. FEMALE, FOR 19-34 AGE GROUP, BY REGION 2023-2032 (USD MILLION) 54
    85. GLOBAL DIETARY SUPPLEMENTS IN THE AGE OF PERSONALIZED NUTRITION, FOR FEMALE, FOR
    86. 18 AGE GROUP, BY REGION 2023-2032 (USD MILLION) 54
    87. SUPPLEMENTS IN THE AGE OF PERSONALIZED NUTRITION, FOR MALE, BY REGION 2023-2032
    88. (USD MILLION) 55
    89. NUTRITION, FOR MALE, BY TYPE 2023-2032 (USD MILLION) 55
    90. SUPPLEMENTS IN THE AGE OF PERSONALIZED NUTRITION, FOR MALE, FOR 55 + AGE GROUP,
    91. BY REGION 2023-2032 (USD MILLION) 55
    92. THE AGE OF PERSONALIZED NUTRITION, FOR MALE, FOR 35-54 AGE GROUP, BY REGION 2023-2032
    93. (USD MILLION) 56
    94. NUTRITION, FOR MALE, FOR 19-34 AGE GROUP, BY REGION 2023-2032 (USD MILLION) 56
    95. MALE, FOR 0-18 AGE GROUP, BY REGION 2023-2032 (USD MILLION) 56
    96. DIETARY SUPPLEMENTS IN THE AGE OF PERSONALIZED NUTRITION, BY DOSAGE FORM 2023-2032
    97. (USD MILLION) 59
    98. NUTRITION, FOR TABLETS, BY REGION 2023-2032 (USD MILLION) 59
    99. DIETARY SUPPLEMENTS IN THE AGE OF PERSONALIZED NUTRITION, FOR CAPSULES, BY REGION
    100. 2032 (USD MILLION) 59
    101. PERSONALIZED NUTRITION, FOR POWDER, BY REGION 2023-2032 (USD MILLION) 60
    102. GLOBAL DIETARY SUPPLEMENTS IN THE AGE OF PERSONALIZED NUTRITION, FOR LIQUIDS,
    103. BY REGION 2023-2032 (USD MILLION) 60
    104. THE AGE OF PERSONALIZED NUTRITION, FOR SOFT GELS, BY REGION 2023-2032 (USD MILLION)
    105. BY END USER 2023-2032 (USD MILLION) 62
    106. IN THE AGE OF PERSONALIZED NUTRITION, FOR HOSPITALS & CLINICS, BY REGION 2023-2032
    107. (USD MILLION) 63
    108. NUTRITION, FOR HOMECARE, BY REGION 2023-2032 (USD MILLION) 63
    109. DIETARY SUPPLEMENTS IN THE AGE OF PERSONALIZED NUTRITION MARKET, BY REGION 2023-2032
    110. (USD MILLION) 65
    111. NUTRITION MARKET SHARE, BY COUNTRY 2020 (%) 67
    112. IN THE AGE OF PERSONALIZED NUTRITION MARKET, BY REGION 2023-2032 (USD MILLION) 67
    113. PRODUCT CATEGORY 2023-2032 (USD MILLION) 67
    114. IN THE AGE OF PERSONALIZED NUTRITION MARKET, BY APPLICATION 2023-2032 (USD MILLION)
    115. BY GENDER 2023-2032 (USD MILLION) 68
    116. IN THE AGE OF PERSONALIZED NUTRITION FOR FEMALE, BY TYPE 2023-2032 (USD MILLION)
    117. FOR MALE, BY TYPE 2023-2032 (USD MILLION) 69
    118. IN THE AGE OF PERSONALIZED NUTRITION, BY DOSAGE FORM 2023-2032 (USD MILLION) 69
    119. END USER 2023-2032 (USD MILLION) 69
    120. IN THE AGE OF PERSONALIZED NUTRITION, BY PRODUCT CATEGORY 2023-2032 (USD MILLION)
    121. MARKET, BY APPLICATION 2023-2032 (USD MILLION) 70
    122. SUPPLEMENTS IN THE AGE OF PERSONALIZED NUTRITION, BY GENDER 2023-2032 (USD MILLION)
    123. FOR FEMALE, BY TYPE 2023-2032 (USD MILLION) 71
    124. SUPPLEMENTS IN THE AGE OF PERSONALIZED NUTRITION FOR MALE, BY TYPE 2023-2032 (USD
    125. MILLION) 71
    126. NUTRITION, BY DOSAGE FORM 2023-2032 (USD MILLION) 71
    127. DIETARY SUPPLEMENTS IN THE AGE OF PERSONALIZED NUTRITION, BY END USER 2023-2032
    128. (USD MILLION) 72
    129. NUTRITION, BY PRODUCT CATEGORY 2023-2032 (USD MILLION) 72
    130. SUPPLEMENTS IN THE AGE OF PERSONALIZED NUTRITION MARKET, BY APPLICATION 2023-2032
    131. (USD MILLION) 72
    132. NUTRITION, BY GENDER 2023-2032 (USD MILLION) 73
    133. IN THE AGE OF PERSONALIZED NUTRITION FOR FEMALE, BY TYPE 2023-2032 (USD MILLION)
    134. MALE, BY TYPE 2023-2032 (USD MILLION) 73
    135. IN THE AGE OF PERSONALIZED NUTRITION, BY DOSAGE FORM 2023-2032 (USD MILLION) 74
    136. USER 2023-2032 (USD MILLION) 74
    137. AGE OF PERSONALIZED NUTRITION, BY PRODUCT CATEGORY 2023-2032 (USD MILLION) 74
    138. BY APPLICATION 2023-2032 (USD MILLION) 75
    139. IN THE AGE OF PERSONALIZED NUTRITION, BY GENDER 2023-2032 (USD MILLION) 75
    140. CANADA DIETARY SUPPLEMENTS IN THE AGE OF PERSONALIZED NUTRITION FOR FEMALE, BY
    141. TYPE 2023-2032 (USD MILLION) 75
    142. AGE OF PERSONALIZED NUTRITION FOR MALE, BY TYPE 2023-2032 (USD MILLION) 76
    143. CANADA DIETARY SUPPLEMENTS IN THE AGE OF PERSONALIZED NUTRITION, BY DOSAGE FORM
    144. 2032 (USD MILLION) 76
    145. PERSONALIZED NUTRITION, BY END USER 2023-2032 (USD MILLION) 76
    146. AMERICA DIETARY SUPPLEMENTS IN THE AGE OF PERSONALIZED NUTRITION, BY PRODUCT CATEGORY
    147. 2032 (USD MILLION) 77
    148. AGE OF PERSONALIZED NUTRITION MARKET, BY APPLICATION 2023-2032 (USD MILLION) 77
    149. BY GENDER 2023-2032 (USD MILLION) 77
    150. IN THE AGE OF PERSONALIZED NUTRITION FOR FEMALE, BY TYPE 2023-2032 (USD MILLION)
    151. FOR MALE, BY TYPE 2023-2032 (USD MILLION) 78
    152. SUPPLEMENTS IN THE AGE OF PERSONALIZED NUTRITION, BY DOSAGE FORM 2023-2032 (USD
    153. MILLION) 78
    154. NUTRITION, BY END USER 2023-2032 (USD MILLION) 79
    155. IN THE AGE OF PERSONALIZED NUTRITION MARKET, BY REGION 2023-2032 (USD MILLION) 81
    156. CATEGORY 2023-2032 (USD MILLION) 82
    157. THE AGE OF PERSONALIZED NUTRITION MARKET, BY APPLICATION 2023-2032 (USD MILLION)
    158. BY GENDER 2023-2032 (USD MILLION) 82
    159. THE AGE OF PERSONALIZED NUTRITION FOR FEMALE, BY TYPE 2023-2032 (USD MILLION) 83
    160. BY TYPE 2023-2032 (USD MILLION) 83
    161. AGE OF PERSONALIZED NUTRITION, BY DOSAGE FORM 2023-2032 (USD MILLION) 83
    162. EUROPE DIETARY SUPPLEMENTS IN THE AGE OF PERSONALIZED NUTRITION, BY END USER
    163. 2032 (USD MILLION) 84
    164. THE AGE OF PERSONALIZED NUTRITION, BY PRODUCT CATEGORY 2023-2032 (USD MILLION) 84
    165. MARKET, BY APPLICATION 2023-2032 (USD MILLION) 84
    166. DIETARY SUPPLEMENTS IN THE AGE OF PERSONALIZED NUTRITION, BY GENDER 2023-2032 (USD
    167. MILLION) 85
    168. NUTRITION FOR FEMALE, BY TYPE 2023-2032 (USD MILLION) 85
    169. EUROPE DIETARY SUPPLEMENTS IN THE AGE OF PERSONALIZED NUTRITION FOR MALE, BY TYPE
    170. 2032 (USD MILLION) 85
    171. THE AGE OF PERSONALIZED NUTRITION, BY DOSAGE FORM 2023-2032 (USD MILLION) 86
    172. BY END USER 2023-2032 (USD MILLION) 86
    173. IN THE AGE OF PERSONALIZED NUTRITION, BY PRODUCT CATEGORY 2023-2032 (USD MILLION)
    174. MARKET, BY APPLICATION 2023-2032 (USD MILLION) 87
    175. SUPPLEMENTS IN THE AGE OF PERSONALIZED NUTRITION, BY GENDER 2023-2032 (USD MILLION)
    176. FOR FEMALE, BY TYPE 2023-2032 (USD MILLION) 87
    177. IN THE AGE OF PERSONALIZED NUTRITION FOR MALE, BY TYPE 2023-2032 (USD MILLION) 88
    178. DOSAGE FORM 2023-2032 (USD MILLION) 88
    179. IN THE AGE OF PERSONALIZED NUTRITION, BY END USER 2023-2032 (USD MILLION) 88
    180. CATEGORY 2023-2032 (USD MILLION) 89
    181. THE AGE OF PERSONALIZED NUTRITION MARKET, BY APPLICATION 2023-2032 (USD MILLION)
    182. BY GENDER 2023-2032 (USD MILLION) 89
    183. THE AGE OF PERSONALIZED NUTRITION FOR FEMALE, BY TYPE 2023-2032 (USD MILLION) 90
    184. BY TYPE 2023-2032 (USD MILLION) 90
    185. AGE OF PERSONALIZED NUTRITION, BY DOSAGE FORM 2023-2032 (USD MILLION) 90
    186. FRANCE DIETARY SUPPLEMENTS IN THE AGE OF PERSONALIZED NUTRITION, BY END USER
    187. 2032 (USD MILLION) 91
    188. PERSONALIZED NUTRITION, BY PRODUCT CATEGORY 2023-2032 (USD MILLION) 91
    189. U.K. DIETARY SUPPLEMENTS IN THE AGE OF PERSONALIZED NUTRITION MARKET, BY APPLICATION
    190. 2032 (USD MILLION) 91
    191. PERSONALIZED NUTRITION, BY GENDER 2023-2032 (USD MILLION) 92
    192. DIETARY SUPPLEMENTS IN THE AGE OF PERSONALIZED NUTRITION FOR FEMALE, BY TYPE 2023-2032
    193. (USD MILLION) 92
    194. NUTRITION FOR MALE, BY TYPE 2023-2032 (USD MILLION) 92
    195. SUPPLEMENTS IN THE AGE OF PERSONALIZED NUTRITION, BY DOSAGE FORM 2023-2032 (USD
    196. MILLION) 93
    197. BY END USER 2023-2032 (USD MILLION) 93
    198. IN THE AGE OF PERSONALIZED NUTRITION, BY PRODUCT CATEGORY 2023-2032 (USD MILLION)
    199. MARKET, BY APPLICATION 2023-2032 (USD MILLION) 94
    200. IN THE AGE OF PERSONALIZED NUTRITION, BY GENDER 2023-2032 (USD MILLION) 94
    201. ITALY DIETARY SUPPLEMENTS IN THE AGE OF PERSONALIZED NUTRITION FOR FEMALE, BY
    202. TYPE 2023-2032 (USD MILLION) 94
    203. AGE OF PERSONALIZED NUTRITION FOR FEMALE, BY TYPE 2023-2032 (USD MILLION) 95
    204. FORM 2023-2032 (USD MILLION) 95
    205. AGE OF PERSONALIZED NUTRITION, BY END USER 2023-2032 (USD MILLION) 95
    206. SPAIN DIETARY SUPPLEMENTS IN THE AGE OF PERSONALIZED NUTRITION, BY PRODUCT CATEGORY
    207. 2032 (USD MILLION) 96
    208. PERSONALIZED NUTRITION MARKET, BY APPLICATION 2023-2032 (USD MILLION) 96
    209. SPAIN DIETARY SUPPLEMENTS IN THE AGE OF PERSONALIZED NUTRITION, BY GENDER 2023-2032
    210. (USD MILLION) 96
    211. NUTRITION FOR FEMALE, BY TYPE 2023-2032 (USD MILLION) 97
    212. SUPPLEMENTS IN THE AGE OF PERSONALIZED NUTRITION FOR MALE, BY TYPE 2023-2032 (USD
    213. MILLION) 97
    214. NUTRITION, BY DOSAGE FORM 2023-2032 (USD MILLION) 97
    215. SUPPLEMENTS IN THE AGE OF PERSONALIZED NUTRITION, BY END USER 2023-2032 (USD MILLION)
    216. NUTRITION, BY PRODUCT CATEGORY 2023-2032 (USD MILLION) 98
    217. WESTERN EUROPE DIETARY SUPPLEMENTS IN THE AGE OF PERSONALIZED NUTRITION MARKET,
    218. BY APPLICATION 2023-2032 (USD MILLION) 98
    219. DIETARY SUPPLEMENTS IN THE AGE OF PERSONALIZED NUTRITION, BY GENDER 2023-2032 (USD
    220. MILLION) 99
    221. OF PERSONALIZED NUTRITION FOR FEMALE, BY TYPE 2023-2032 (USD MILLION) 99
    222. REST OF WESTERN EUROPE DIETARY SUPPLEMENTS IN THE AGE OF PERSONALIZED NUTRITION
    223. FOR MALE, BY TYPE 2023-2032 (USD MILLION) 99
    224. DIETARY SUPPLEMENTS IN THE AGE OF PERSONALIZED NUTRITION, BY DOSAGE FORM 2023-2032
    225. (USD MILLION) 100
    226. AGE OF PERSONALIZED NUTRITION, BY DOSAGE FORM 2023-2032 (USD MILLION) 100
    227. EASTERN EUROPE DIETARY SUPPLEMENTS IN THE AGE OF PERSONALIZED NUTRITION, BY
    228. PRODUCT CATEGORY 2023-2032 (USD MILLION) 100
    229. SUPPLEMENTS IN THE AGE OF PERSONALIZED NUTRITION MARKET, BY APPLICATION 2023-2032
    230. (USD MILLION) 101
    231. PERSONALIZED NUTRITION, BY GENDER 2023-2032 (USD MILLION) 101
    232. EUROPE DIETARY SUPPLEMENTS IN THE AGE OF PERSONALIZED NUTRITION FOR FEMALE, BY TYPE
    233. 2032 (USD MILLION) 101
    234. THE AGE OF PERSONALIZED NUTRITION FOR MALE, BY TYPE 2023-2032 (USD MILLION) 102
    235. BY DOSAGE FORM 2023-2032 (USD MILLION) 102
    236. SUPPLEMENTS IN THE AGE OF PERSONALIZED NUTRITION, BY END USER 2023-2032 (USD MILLION)
    237. MARKET, BY COUNTRY 2023-2032 (USD MILLION) 104
    238. SUPPLEMENTS IN THE AGE OF PERSONALIZED NUTRITION, BY PRODUCT CATEGORY 2023-2032
    239. (USD MILLION) 105
    240. PERSONALIZED NUTRITION MARKET, BY APPLICATION 2023-2032 (USD MILLION) 105
    241. ASIA PACIFIC DIETARY SUPPLEMENTS IN THE AGE OF PERSONALIZED NUTRITION, BY GENDER
    242. 2032 (USD MILLION) 105
    243. AGE OF PERSONALIZED NUTRITION FOR FEMALE, BY TYPE 2023-2032 (USD MILLION) 106
    244. FOR MALE, BY TYPE 2023-2032 (USD MILLION) 106
    245. SUPPLEMENTS IN THE AGE OF PERSONALIZED NUTRITION, BY DOSAGE FORM 2023-2032 (USD
    246. MILLION) 106
    247. NUTRITION, BY END USER 2023-2032 (USD MILLION) 107
    248. SUPPLEMENTS IN THE AGE OF PERSONALIZED NUTRITION, BY PRODUCT CATEGORY 2023-2032
    249. (USD MILLION) 107
    250. NUTRITION MARKET, BY APPLICATION 2023-2032 (USD MILLION) 107
    251. DIETARY SUPPLEMENTS IN THE AGE OF PERSONALIZED NUTRITION, BY GENDER 2023-2032 (USD
    252. MILLION) 108
    253. NUTRITION FOR FEMALE, BY TYPE 2023-2032 (USD MILLION) 108
    254. SUPPLEMENTS IN THE AGE OF PERSONALIZED NUTRITION FOR MALE, BY TYPE 2023-2032 (USD
    255. MILLION) 108
    256. NUTRITION, BY DOSAGE FORM 2023-2032 (USD MILLION) 109
    257. SUPPLEMENTS IN THE AGE OF PERSONALIZED NUTRITION, BY END USER 2023-2032 (USD MILLION)
    258. BY PRODUCT CATEGORY 2023-2032 (USD MILLION) 109
    259. IN THE AGE OF PERSONALIZED NUTRITION MARKET, BY APPLICATION 2023-2032 (USD MILLION)
    260. BY GENDER 2023-2032 (USD MILLION) 110
    261. THE AGE OF PERSONALIZED NUTRITION FOR FEMALE, BY TYPE 2023-2032 (USD MILLION) 110
    262. BY TYPE 2023-2032 (USD MILLION) 111
    263. THE AGE OF PERSONALIZED NUTRITION, BY DOSAGE FORM 2023-2032 (USD MILLION) 111
    264. USER 2023-2032 (USD MILLION) 111
    265. AGE OF PERSONALIZED NUTRITION, BY PRODUCT CATEGORY 2023-2032 (USD MILLION) 112
    266. BY APPLICATION 2023-2032 (USD MILLION) 112
    267. IN THE AGE OF PERSONALIZED NUTRITION, BY GENDER 2023-2032 (USD MILLION) 112
    268. INDIA DIETARY SUPPLEMENTS IN THE AGE OF PERSONALIZED NUTRITION FOR FEMALE, BY
    269. TYPE 2023-2032 (USD MILLION) 113
    270. AGE OF PERSONALIZED NUTRITION FOR MALE, BY TYPE 2023-2032 (USD MILLION) 113
    271. INDIA DIETARY SUPPLEMENTS IN THE AGE OF PERSONALIZED NUTRITION, BY DOSAGE FORM
    272. 2032 (USD MILLION) 113
    273. OF PERSONALIZED NUTRITION, BY END USER 2023-2032 (USD MILLION) 114
    274. REPUBLIC OF KOREA DIETARY SUPPLEMENTS IN THE AGE OF PERSONALIZED NUTRITION, BY PRODUCT
    275. CATEGORY 2023-2032 (USD MILLION) 114
    276. IN THE AGE OF PERSONALIZED NUTRITION MARKET, BY APPLICATION 2023-2032 (USD MILLION)
    277. NUTRITION, BY GENDER 2023-2032 (USD MILLION) 115
    278. DIETARY SUPPLEMENTS IN THE AGE OF PERSONALIZED NUTRITION FOR FEMALE, BY TYPE 2023-2032
    279. (USD MILLION) 115
    280. OF PERSONALIZED NUTRITION FOR MALE, BY TYPE 2023-2032 (USD MILLION) 115
    281. REPUBLIC OF KOREA DIETARY SUPPLEMENTS IN THE AGE OF PERSONALIZED NUTRITION,
    282. BY DOSAGE FORM 2023-2032 (USD MILLION) 116
    283. SUPPLEMENTS IN THE AGE OF PERSONALIZED NUTRITION, BY END USER 2023-2032 (USD MILLION)
    284. BY PRODUCT CATEGORY 2023-2032 (USD MILLION) 116
    285. SUPPLEMENTS IN THE AGE OF PERSONALIZED NUTRITION MARKET, BY APPLICATION 2023-2032
    286. (USD MILLION) 117
    287. NUTRITION, BY GENDER 2023-2032 (USD MILLION) 117
    288. SUPPLEMENTS IN THE AGE OF PERSONALIZED NUTRITION FOR FEMALE, BY TYPE 2023-2032 (USD
    289. MILLION) 117
    290. NUTRITION FOR MALE, BY TYPE 2023-2032 (USD MILLION) 118
    291. DIETARY SUPPLEMENTS IN THE AGE OF PERSONALIZED NUTRITION, BY DOSAGE FORM 2023-2032
    292. (USD MILLION) 118
    293. NUTRITION, BY END USER 2023-2032 (USD MILLION) 118
    294. DIETARY SUPPLEMENTS IN THE AGE OF PERSONALIZED NUTRITION, BY PRODUCT CATEGORY 2023-2032
    295. (USD MILLION) 119
    296. AGE OF PERSONALIZED NUTRITION MARKET, BY APPLICATION 2023-2032 (USD MILLION) 119
    297. NUTRITION, BY GENDER 2023-2032 (USD MILLION) 119
    298. DIETARY SUPPLEMENTS IN THE AGE OF PERSONALIZED NUTRITION FOR FEMALE, BY TYPE 2023-2032
    299. (USD MILLION) 120
    300. AGE OF PERSONALIZED NUTRITION FOR MALE, BY TYPE 2023-2032 (USD MILLION) 120
    301. REST OF ASIA PACIFIC DIETARY SUPPLEMENTS IN THE AGE OF PERSONALIZED NUTRITION,
    302. BY DOSAGE FORM 2023-2032 (USD MILLION) 120
    303. SUPPLEMENTS IN THE AGE OF PERSONALIZED NUTRITION, BY END USER 2023-2032 (USD MILLION)
    304. PERSONALIZED NUTRITION MARKET, BY COUNTRY 2023-2032 (USD MILLION) 123
    305. THE MIDDLE EAST & AFRICA DIETARY SUPPLEMENTS IN THE AGE OF PERSONALIZED
    306. NUTRITION, BY PRODUCT CATEGORY 2023-2032 (USD MILLION) 124
    307. EAST & AFRICA DIETARY SUPPLEMENTS IN THE AGE OF PERSONALIZED NUTRITION MARKET,
    308. BY APPLICATION 2023-2032 (USD MILLION) 124
    309. AFRICA DIETARY SUPPLEMENTS IN THE AGE OF PERSONALIZED NUTRITION, BY GENDER 2023-2032
    310. (USD MILLION) 124
    311. IN THE AGE OF PERSONALIZED NUTRITION FOR FEMALE, BY TYPE 2023-2032 (USD MILLION)
    312. PERSONALIZED NUTRITION FOR MALE, BY TYPE 2023-2032 (USD MILLION) 125
    313. THE MIDDLE EAST & AFRICA DIETARY SUPPLEMENTS IN THE AGE OF PERSONALIZED
    314. NUTRITION, BY DOSAGE FORM 2023-2032 (USD MILLION) 125
    315. EAST & AFRICA DIETARY SUPPLEMENTS IN THE AGE OF PERSONALIZED NUTRITION, BY END
    316. USER 2023-2032 (USD MILLION) 126
    317. OF PERSONALIZED NUTRITION, BY PRODUCT CATEGORY 2023-2032 (USD MILLION) 126
    318. UAE DIETARY SUPPLEMENTS IN THE AGE OF PERSONALIZED NUTRITION MARKET, BY APPLICATION
    319. 2032 (USD MILLION) 126
    320. PERSONALIZED NUTRITION, BY GENDER 2023-2032 (USD MILLION) 127
    321. DIETARY SUPPLEMENTS IN THE AGE OF PERSONALIZED NUTRITION FOR FEMALE, BY TYPE 2023-2032
    322. (USD MILLION) 127
    323. NUTRITION FOR MALE, BY TYPE 2023-2032 (USD MILLION) 127
    324. SUPPLEMENTS IN THE AGE OF PERSONALIZED NUTRITION, BY DOSAGE FORM 2023-2032 (USD
    325. MILLION) 128

    Dietary Supplements in the Age of Personalized Nutrition Market Segmentation

    Dietary Supplements in the Age of Personalized Nutrition Product Category Outlook (USD Billion, 2018-2032)

    • Vitamins
    • Herbs & Botanicals

    Dietary Supplements in the Age of Personalized Nutrition Application Outlook (USD Billion, 2018-2032)

    • Lifestyle Diseases
    • Inherited Disease

    Dietary Supplements in the Age of Personalized Nutrition Product Gender Outlook (USD Billion, 2018-2032)

    • Female
    • Male

    Dietary Supplements in the Age of Personalized Nutrition Dosage Form Outlook (USD Billion, 2018-2032)

    • Capsules
    • Powder
    • Liquids
    • Soft Gels
    • Others

    Dietary Supplements in the Age of Personalized Nutrition Regional Outlook (USD Billion, 2018-2032)

    • North America Outlook (USD Billion, 2018-2032)

      • North America Dietary Supplements in the Age of Personalized Nutrition by Product Category
        • Vitamins
        • Herbs & Botanicals
      • North America Dietary Supplements in the Age of Personalized Nutrition by Application
        • Lifestyle Diseases
        • Inherited Disease
      • North America Dietary Supplements in the Age of Personalized Nutrition by Product Gender
        • Female
        • Male
      • North America Dietary Supplements in the Age of Personalized Nutrition by Dosage Form
        • Capsules
        • Powder
        • Liquids
        • Soft Gels
        • Others
      • US Outlook (USD Billion, 2018-2032)

      • US Dietary Supplements in the Age of Personalized Nutrition by Product Category
        • Vitamins
        • Herbs & Botanicals
      • US Dietary Supplements in the Age of Personalized Nutrition by Application
        • Lifestyle Diseases
        • Inherited Disease
      • US Dietary Supplements in the Age of Personalized Nutrition by Product Gender
        • Female
        • Male
      • US Dietary Supplements in the Age of Personalized Nutrition by Dosage Form
        • Capsules
        • Powder
        • Liquids
        • Soft Gels
        • Others
      • CANADA Outlook (USD Billion, 2018-2032)

      • CANADA Dietary Supplements in the Age of Personalized Nutrition by Product Category
        • Vitamins
        • Herbs & Botanicals
      • CANADA Dietary Supplements in the Age of Personalized Nutrition by Application
        • Lifestyle Diseases
        • Inherited Disease
      • CANADA Dietary Supplements in the Age of Personalized Nutrition by Product Gender
        • Female
        • Male
      • CANADA Dietary Supplements in the Age of Personalized Nutrition by Dosage Form
        • Capsules
        • Powder
        • Liquids
        • Soft Gels
        • Others
    • Europe Outlook (USD Billion, 2018-2032)

      • Europe Dietary Supplements in the Age of Personalized Nutrition by Product Category
        • Vitamins
        • Herbs & Botanicals
      • Europe Dietary Supplements in the Age of Personalized Nutrition by Application
        • Lifestyle Diseases
        • Inherited Disease
      • Europe Dietary Supplements in the Age of Personalized Nutrition by Product Gender
        • Female
        • Male
      • Europe Dietary Supplements in the Age of Personalized Nutrition by Dosage Form
        • Capsules
        • Powder
        • Liquids
        • Soft Gels
        • Others
      • Germany Outlook (USD Billion, 2018-2032)

      • Germany Dietary Supplements in the Age of Personalized Nutrition by Product Category
        • Vitamins
        • Herbs & Botanicals
      • Germany Dietary Supplements in the Age of Personalized Nutrition by Application
        • Lifestyle Diseases
        • Inherited Disease
      • Germany Dietary Supplements in the Age of Personalized Nutrition by Product Gender
        • Female
        • Male
      • Germany Dietary Supplements in the Age of Personalized Nutrition by Dosage Form
        • Capsules
        • Powder
        • Liquids
        • Soft Gels
        • Others
      • France Outlook (USD Billion, 2018-2032)

      • France Dietary Supplements in the Age of Personalized Nutrition by Product Category
        • Vitamins
        • Herbs & Botanicals
      • France Dietary Supplements in the Age of Personalized Nutrition by Application
        • Lifestyle Diseases
        • Inherited Disease
      • France Dietary Supplements in the Age of Personalized Nutrition by Product Gender
        • Female
        • Male
      • France Dietary Supplements in the Age of Personalized Nutrition by Dosage Form
        • Capsules
        • Powder
        • Liquids
        • Soft Gels
        • Others
      • UK Outlook (USD Billion, 2018-2032)

      • UK Dietary Supplements in the Age of Personalized Nutrition by Product Category
        • Vitamins
        • Herbs & Botanicals
      • UK Dietary Supplements in the Age of Personalized Nutrition by Application
        • Lifestyle Diseases
        • Inherited Disease
      • UK Dietary Supplements in the Age of Personalized Nutrition by Product Gender
        • Female
        • Male
      • UK Dietary Supplements in the Age of Personalized Nutrition by Dosage Form
        • Capsules
        • Powder
        • Liquids
        • Soft Gels
        • Others
      • ITALY Outlook (USD Billion, 2018-2032)

      • ITALY Dietary Supplements in the Age of Personalized Nutrition by Product Category
        • Vitamins
        • Herbs & Botanicals
      • ITALY Dietary Supplements in the Age of Personalized Nutrition by Application
        • Lifestyle Diseases
        • Inherited Disease
      • ITALY Dietary Supplements in the Age of Personalized Nutrition by Product Gender
        • Female
        • Male
      • ITALY Dietary Supplements in the Age of Personalized Nutrition by Dosage Form
        • Capsules
        • Powder
        • Liquids
        • Soft Gels
        • Others
      • SPAIN Outlook (USD Billion, 2018-2032)

      • Spain Dietary Supplements in the Age of Personalized Nutrition by Product Category
        • Vitamins
        • Herbs & Botanicals
      • Spain Dietary Supplements in the Age of Personalized Nutrition by Application
        • Lifestyle Diseases
        • Inherited Disease
      • Spain Dietary Supplements in the Age of Personalized Nutrition by Product Gender
        • Female
        • Male
      • Spain Dietary Supplements in the Age of Personalized Nutrition by Dosage Form
        • Capsules
        • Powder
        • Liquids
        • Soft Gels
        • Others
      • Rest Of Europe Outlook (USD Billion, 2018-2032)

      • Rest Of Europe Dietary Supplements in the Age of Personalized Nutrition by Product Category
        • Vitamins
        • Herbs & Botanicals
      • REST OF EUROPE Dietary Supplements in the Age of Personalized Nutrition by Application
        • Lifestyle Diseases
        • Inherited Disease
      • REST OF EUROPE Dietary Supplements in the Age of Personalized Nutrition by Product Gender
        • Female
        • Male
      • REST OF EUROPE Dietary Supplements in the Age of Personalized Nutrition by Dosage Form
        • Capsules
        • Powder
        • Liquids
        • Soft Gels
        • Others
    • Asia-Pacific Outlook (USD Billion, 2018-2032)

      • Asia-Pacific Dietary Supplements in the Age of Personalized Nutrition by Product Category
        • Vitamins
        • Herbs & Botanicals
      • Asia-Pacific Dietary Supplements in the Age of Personalized Nutrition by Application
        • Lifestyle Diseases
        • Inherited Disease
      • Asia-Pacific Dietary Supplements in the Age of Personalized Nutrition by Product Gender
        • Female
        • Male
      • Asia-Pacific Dietary Supplements in the Age of Personalized Nutrition by Dosage Form
        • Capsules
        • Powder
        • Liquids
        • Soft Gels
        • Others
      • China Outlook (USD Billion, 2018-2032)

      • China Dietary Supplements in the Age of Personalized Nutrition by Product Category
        • Vitamins
        • Herbs & Botanicals
      • China Dietary Supplements in the Age of Personalized Nutrition by Application
        • Lifestyle Diseases
        • Inherited Disease
      • China Dietary Supplements in the Age of Personalized Nutrition by Product Gender
        • Female
        • Male
      • China Dietary Supplements in the Age of Personalized Nutrition by Dosage Form
        • Capsules
        • Powder
        • Liquids
        • Soft Gels
        • Others
      • Japan Outlook (USD Billion, 2018-2032)

      • Japan Dietary Supplements in the Age of Personalized Nutrition by Product Category
        • Vitamins
        • Herbs & Botanicals
      • Japan Dietary Supplements in the Age of Personalized Nutrition by Application
        • Lifestyle Diseases
        • Inherited Disease
      • Japan Dietary Supplements in the Age of Personalized Nutrition by Product Gender
        • Female
        • Male
      • Japan Dietary Supplements in the Age of Personalized Nutrition by Dosage Form
        • Capsules
        • Powder
        • Liquids
        • Soft Gels
        • Others
      • India Outlook (USD Billion, 2018-2032)

      • India Dietary Supplements in the Age of Personalized Nutrition by Product Category
        • Vitamins
        • Herbs & Botanicals
      • India Dietary Supplements in the Age of Personalized Nutrition by Application
        • Lifestyle Diseases
        • Inherited Disease
      • India Dietary Supplements in the Age of Personalized Nutrition by Product Gender
        • Female
        • Male
      • India Dietary Supplements in the Age of Personalized Nutrition by Dosage Form
        • Capsules
        • Powder
        • Liquids
        • Soft Gels
        • Others
      • Australia Outlook (USD Billion, 2018-2032)

      • Australia Dietary Supplements in the Age of Personalized Nutrition by Product Category
        • Vitamins
        • Herbs & Botanicals
      • Australia Dietary Supplements in the Age of Personalized Nutrition by Application
        • Lifestyle Diseases
        • Inherited Disease
      • Australia Dietary Supplements in the Age of Personalized Nutrition by Product Gender
        • Female
        • Male
      • Australia Dietary Supplements in the Age of Personalized Nutrition by Dosage Form
        • Capsules
        • Powder
        • Liquids
        • Soft Gels
        • Others
      • Rest of Asia-Pacific Outlook (USD Billion, 2018-2032)

      • Rest of Asia-Pacific Dietary Supplements in the Age of Personalized Nutrition by Product Category
        • Vitamins
        • Herbs & Botanicals
      • Rest of Asia-Pacific Dietary Supplements in the Age of Personalized Nutrition by Application
        • Lifestyle Diseases
        • Inherited Disease
      • Rest of Asia-Pacific Dietary Supplements in the Age of Personalized Nutrition by Product Gender
        • Female
        • Male
      • Rest of Asia-Pacific Dietary Supplements in the Age of Personalized Nutrition by Dosage Form
        • Capsules
        • Powder
        • Liquids
        • Soft Gels
        • Others
    • Rest of the World Outlook (USD Billion, 2018-2032)

      • Rest of the World Dietary Supplements in the Age of Personalized Nutrition by Product Category
        • Vitamins
        • Herbs & Botanicals
      • Rest of the World Dietary Supplements in the Age of Personalized Nutrition by Application
        • Lifestyle Diseases
        • Inherited Disease
      • Rest of the World Dietary Supplements in the Age of Personalized Nutrition by Product Gender
        • Female
        • Male
      • Rest of the World Dietary Supplements in the Age of Personalized Nutrition by Dosage Form
        • Capsules
        • Powder
        • Liquids
        • Soft Gels
        • Others
      • Middle East Outlook (USD Billion, 2018-2032)

      • Middle East Dietary Supplements in the Age of Personalized Nutrition by Product Category
        • Vitamins
        • Herbs & Botanicals
      • Middle East Dietary Supplements in the Age of Personalized Nutrition by Application
        • Lifestyle Diseases
        • Inherited Disease
      • Middle East Dietary Supplements in the Age of Personalized Nutrition by Product Gender
        • Female
        • Male
      • Middle East Dietary Supplements in the Age of Personalized Nutrition by Dosage Form
        • Capsules
        • Powder
        • Liquids
        • Soft Gels
        • Others
      • Africa Outlook (USD Billion, 2018-2032)

      • Africa Dietary Supplements in the Age of Personalized Nutrition by Product Category
        • Vitamins
        • Herbs & Botanicals
      • Africa Dietary Supplements in the Age of Personalized Nutrition by Application
        • Lifestyle Diseases
        • Inherited Disease
      • Africa Dietary Supplements in the Age of Personalized Nutrition by Product Gender
        • Female
        • Male
      • Africa Dietary Supplements in the Age of Personalized Nutrition by Dosage Form
        • Capsules
        • Powder
        • Liquids
        • Soft Gels
        • Others
      • Latin America Outlook (USD Billion, 2018-2032)

      • Latin America Dietary Supplements in the Age of Personalized Nutrition by Product Category
        • Vitamins
        • Herbs & Botanicals
      • Latin America Dietary Supplements in the Age of Personalized Nutrition by Application
        • Lifestyle Diseases
        • Inherited Disease
      • Latin America Dietary Supplements in the Age of Personalized Nutrition by Product Gender
        • Female
        • Male
      • Latin America Dietary Supplements in the Age of Personalized Nutrition by Dosage Form
        • Capsules
        • Powder
        • Liquids
        • Soft Gels
        • Others
    Dietary Supplements in the age of Personalized Nutrition Market Research Report - Global Forecast till 2034 Infographic
    Free Sample Request

    Kindly complete the form below to receive a free sample of this Report

    Customer Strories

    “I am very pleased with how market segments have been defined in a relevant way for my purposes (such as "Portable Freezers & refrigerators" and "last-mile"). In general the report is well structured. Thanks very much for your efforts.”

    Victoria Milne Founder
    Case Study

    Chemicals and Materials