• Cat-intel
  • MedIntelliX
  • Resources
  • About Us
  • Request Free Sample ×

    Kindly complete the form below to receive a free sample of this Report

    Leading companies partner with us for data-driven Insights

    clients tt-cursor

    Commodity Liner Market

    ID: MRFR/PNT/32612-HCR
    111 Pages
    Sakshi Gupta
    September 2025

    Commodity Liner Market Research Report By Material Type (Steel, Aluminum, Plastic, Composite), By Application (Construction, Manufacturing, Energy, Transportation), By End Use (Residential, Commercial, Industrial), By Market Category (High-end, Mid-range, Economical) and By Regional (North America, Europe, South America, Asia Pacific, Middle East and Africa) - Forecast to 2034.

    Share:
    Download PDF ×

    We do not share your information with anyone. However, we may send you emails based on your report interest from time to time. You may contact us at any time to opt-out.

    Commodity Liner Market  Research Report — Global Forecast till 2034 Infographic
    Purchase Options
    $ 4,950.0
    $ 5,950.0
    $ 7,250.0
    Table of Contents

    Commodity Liner Market Summary

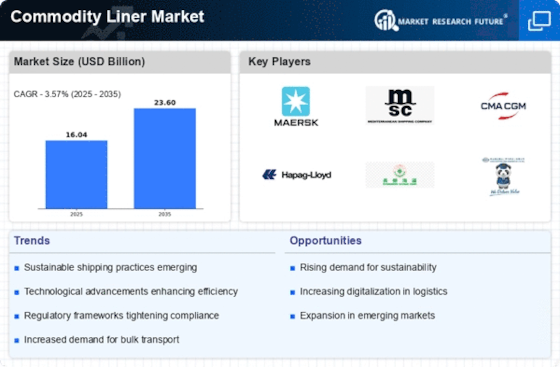
    The Global Commodity Liner Market is projected to grow from 16.0 USD Billion in 2024 to 23.6 USD Billion by 2035, reflecting a steady growth trajectory.

    Key Market Trends & Highlights

    Commodity Liner Key Trends and Highlights

    • The market is expected to experience a compound annual growth rate (CAGR) of 3.58% from 2025 to 2035.
    • By 2035, the market valuation is anticipated to reach 23.6 USD Billion, indicating robust growth potential.
    • In 2024, the market is valued at 16.0 USD Billion, laying a strong foundation for future expansion.
    • Growing adoption of sustainable shipping practices due to increasing environmental regulations is a major market driver.

    Market Size & Forecast

    2024 Market Size 16.0 (USD Billion)
    2035 Market Size 23.6 (USD Billion)
    CAGR (2025-2035) 3.58%

    Major Players

    Wan Hai Lines, Evergreen Marine, ZIM Integrated Shipping Services, K Line, COSCO Shipping, CMA CGM, Yang Ming Marine Transport, NYK Line, Hapag-Lloyd, MOL, Hanjin Shipping, Mediterranean Shipping Company, P. Moller, Maersk, PIL

    Commodity Liner Market Trends

    The Commodity Liner Market is influenced by several key market drivers. The rise in trade has led to increased demand for efficient transport solutions. The expansion of e-commerce is also spurring growth as businesses seek reliable shipping options to meet customer expectations. Emerging markets are developing infrastructure, which further enhances shipping capabilities. Innovations in technology, such as automation and data analytics, are streamlining operations and cutting costs. These drivers create a dynamic environment for the market, prompting companies to adapt quickly to remain competitive.

    There are numerous opportunities to be explored within this market.Sustainability has become a focus for many shipping companies, leading to the development of greener technologies. Investing in fuel-efficient vessels can attract environmentally conscious clients and help companies comply with regulations. Additionally, strategic partnerships with logistics firms can enhance service offerings and create more comprehensive solutions for clients. As the market continues to grow, firms can leverage these opportunities for expansion and increased market share. Recent trends highlight a shift towards digitalization in shipping processes.

    Companies are adopting digital platforms for booking and tracking shipments, improving efficiency and customer experience.The focus on end-to-end visibility is becoming paramount, prompting many liners to invest in technology that provides real-time updates. There is also a growing trend towards containerization, which enhances cargo safety and ease of transport. These trends illustrate how companies in the Commodity Liner Market are evolving to meet new challenges and customer needs. By embracing these shifts, the industry can capitalize on emerging opportunities and drive future growth.

    The Global Commodity Liner Market is poised for robust growth, driven by increasing demand for efficient transportation solutions and the ongoing evolution of supply chain dynamics.

    U.S. Department of Transportation

    Commodity Liner Market Drivers

    Expansion of Global Trade Activities

    The expansion of global trade activities significantly influences the Global Commodity Liner Market Industry. As economies recover and trade agreements proliferate, the demand for liner shipping services is expected to rise. The World Trade Organization forecasts a steady increase in merchandise trade volumes, which could bolster the shipping sector. This growth is particularly evident in emerging markets, where increased consumer demand drives imports and exports. The Global Commodity Liner Market is anticipated to benefit from this trend, with projections indicating a market size of 23.6 USD Billion by 2035. This expansion underscores the vital role of liner shipping in facilitating international trade.

    Market Trends and Growth Projections

    The Global Commodity Liner Market Industry is characterized by various market trends and growth projections that illustrate its dynamic nature. The market is expected to grow steadily, with projections indicating a size of 16.0 USD Billion in 2024 and 23.6 USD Billion by 2035. This growth trajectory suggests a robust demand for liner shipping services, driven by factors such as increased global trade and technological advancements. The anticipated CAGR of 3.58% from 2025 to 2035 further underscores the industry's resilience and adaptability in the face of evolving market conditions. These trends highlight the importance of strategic planning and investment in the Global Commodity Liner Market.

    Technological Advancements in Shipping

    Technological advancements play a crucial role in shaping the Global Commodity Liner Market Industry. Innovations such as automation, digitalization, and data analytics enhance operational efficiency and reduce costs. For example, the implementation of advanced tracking systems allows for real-time monitoring of cargo, improving supply chain transparency. Furthermore, the adoption of smart shipping technologies is likely to streamline operations and optimize route planning. These advancements not only improve service delivery but also contribute to sustainability efforts by minimizing fuel consumption. As a result, the Global Commodity Liner Market is expected to grow at a CAGR of 3.58% from 2025 to 2035, driven by these technological innovations.

    Increasing Consumer Demand for Fast Delivery

    The increasing consumer demand for fast delivery services is reshaping the Global Commodity Liner Market Industry. With the rise of e-commerce, customers expect quicker shipping times, prompting liner companies to enhance their service offerings. This shift is particularly pronounced in regions with high online shopping penetration, where timely delivery is a competitive advantage. Companies are investing in faster vessels and optimizing their logistics networks to meet these expectations. As a result, the Global Commodity Liner Market is likely to experience sustained growth, driven by the need for efficient and rapid shipping solutions that cater to evolving consumer preferences.

    Regulatory Changes and Compliance Requirements

    Regulatory changes and compliance requirements significantly impact the Global Commodity Liner Market Industry. Governments worldwide are implementing stricter regulations concerning safety, environmental standards, and trade practices. Compliance with these regulations often necessitates substantial investments in fleet upgrades and operational adjustments. For instance, the introduction of the International Maritime Organization's sulfur cap has compelled shipping companies to invest in cleaner fuels and technologies. While these changes may pose challenges, they also present opportunities for growth as companies innovate to meet new standards. The Global Commodity Liner Market is thus positioned to evolve in response to these regulatory dynamics, ensuring compliance while fostering market expansion.

    Growing Demand for Sustainable Shipping Solutions

    The Global Commodity Liner Market Industry is witnessing a notable shift towards sustainable shipping solutions. As environmental regulations tighten, companies are increasingly adopting eco-friendly practices. This trend is driven by the need to reduce carbon emissions and enhance operational efficiency. For instance, the International Maritime Organization has set ambitious targets for reducing greenhouse gas emissions from shipping. Consequently, investments in cleaner technologies and alternative fuels are on the rise, which may contribute to the market's growth. The Global Commodity Liner Market is projected to reach 16.0 USD Billion in 2024, reflecting the industry's adaptation to sustainability demands.

    Market Segment Insights

    Commodity Liner Market Material Type Insights

    The Commodity Liner Market, segmented by Material Type, presents a diverse range of opportunities and trends that underlie its structure and growth trajectories. The overall market, valued at 14.96 USD Billion in 2023, showcases significant potential driven by the rising demand for liners across multiple industries. Steel, which holds a dominant position, is valued at 5.5 USD Billion in 2023 and is expected to reach 7.3 USD Billion by 2032.

    This material's strength and durability make it an ideal choice for heavy-duty applications, thereby catering to major industrial sectors.Following closely is Aluminum, valued at 3.0 USD Billion in 2023 and predicted to increase to 4.1 USD Billion in 2032. Noted for its lightweight and corrosion-resistant properties, offering efficiencies in both performance and cost, making it significant for manufacturers focusing on energy and material optimization.

    Plastic, with a market valuation of 4.0 USD Billion in 2023, is on track to grow to 5.2 USD Billion by 2032, driven by its versatility and ability to cater to a variety of uses, especially in consumer goods and packaging sectors, reflecting the growing preference for lightweight, cost-effective alternatives.Composite materials, while having the lowest valuation of 2.46 USD Billion in 2023 and anticipated to rise to 3.9 USD Billion by 2032, are gaining traction due to their unique properties like high strength-to-weight ratio, making them suitable for specialized applications that require enhanced performance.

    The intricacies of these materials underline important market trends that reflect the evolving needs of end-users looking for efficient and sustainable solutions. The Commodity Liner Market segmentation by Material Type illustrates how different materials cater to distinct requirements across industries, encapsulating a broad spectrum of growth opportunities that can be leveraged in the coming years.The increasing awareness of sustainability and performance efficiency among consumers and manufacturers alike enhances the significance of these materials and their respective contributions to the overall market growth.

    Each material type exhibits unique attributes aligning with various operational demands, forming the bedrock upon which the Commodity Liner Market evolution stands. Insight into market dynamics highlights the notable challenges faced, such as regulatory compliances, environmental impacts associated with certain materials, and competition among material alternatives.However, the growth drivers are robust, encompassing technological advancements and increased investment in manufacturing innovations that promise to enhance material efficiencies. The Commodity Liner Market data illustrates a constructive outlook, supported by extensive research into market behaviors and evolving consumer preferences, establishing a conducive environment for continued expansion and evolution of the Material Type segment.

    Commodity Liner Market Application Insights

    The Construction sector remains significant, driven by increasing urbanization and infrastructure projects, which create a strong demand for commodity liners. The Manufacturing industry also plays a vital role, focusing on the efficient transport of raw materials necessary for production processes. The Energy sector is evolving, acting as a driving force for the adoption of advanced commodity liners to support renewable energy initiatives and reduce environmental impact.Transportation is another critical area within this market segment, as efficient liner solutions are essential for logistics and freight movements globally.

    Collectively, these applications contribute to the overall market growth, supported by trends in sustainable practices and rising trade activities. As new technologies emerge, the Commodity Liner Market data indicates opportunities for innovation, although challenges related to raw material costs and supply chain disruptions persist in the industry, shaping future market trends and growth prospects.

    Commodity Liner Market End Use Insights

    This segment encompasses diverse applications, notably in the Residential, Commercial and Industrial sectors. Each of these applications plays a crucial role in driving market dynamics, with the Residential sector often exhibiting a significant demand due to the increasing need for cost-effective and efficient materials in construction and renovations.

    The Commercial sector also represents a substantial portion of the market, driven by the growth of retail spaces, offices, and other establishments that require durable and versatile lining solutions.Meanwhile, the Industrial sector stands out with its requirement for high-performance liners capable of withstanding rigorous operational conditions, making it vital for sectors such as manufacturing and logistics. As the Commodity Liner Market revenue continues to grow, the segmentation highlights various opportunities and challenges, including the need for sustainable materials and innovations driven by shifting consumer preferences.

    Understanding these aspects is essential for stakeholders to navigate the complexities of emerging market trends and future growth avenues.

    Commodity Liner Market Category Insights

    Market Category segmentation reveals distinct classifications comprising High-end, Mid-range and Economical offerings. High-end products often dominate due to their superior quality and performance, attracting customers who seek advanced features and durability. Mid-range options appeal to a broader audience, balancing cost and functionality, thereby capturing a significant share of the market.Economical choices cater to budget-conscious consumers, fulfilling essential needs while facilitating widespread market participation. The steady growth in various segments is driven by rising consumer preferences for customized solutions, technological advancements, and increased trade activities.

    However, challenges such as fluctuating raw material costs and environmental regulations continue to hover over the industry. Nonetheless, emerging opportunities are evident in sustainability trends and expanding e-commerce platforms, which are poised to enhance the Commodity Liner Market revenue further.Collectively, the Commodity Liner Market statistics indicate a comprehensive landscape with room for interesting developments in the coming years.

    Get more detailed insights about Commodity Liner Market Research Report — Global Forecast till 2034

    Regional Insights

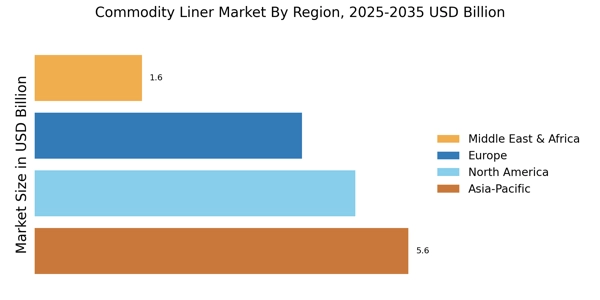
    The Commodity Liner Market is expected to showcase significant growth across various regions. In 2023, North America leads with a market value of 5.0 USD Billion, expected to reach 6.5 USD Billion by 2032, highlighting its majority holding in this segment. Europe follows closely, valued at 4.0 USD Billion in 2023, projected to grow to 5.3 USD Billion, reflecting strong demand for liner services in the region.

    The Asia-Pacific (APAC) market, while smaller at 3.5 USD Billion in 2023, is anticipated to reach 4.8 USD Billion, signaling its increasing role in the Commodity Liner Market with growing economies and trade activities.South America and the Middle East Africa (MEA) represent the smaller markets, with values of 1.0 USD Billion and 1.46 USD Billion in 2023, respectively, but are poised for growth, reaching 1.5 USD Billion and 2.4 USD Billion by 2032. The growth of drivers includes rising trade activities and e-commerce, with challenges like regulatory compliance and infrastructure limitations.

    Overall, the Commodity Liner Market segmentation showcases varied growth potential and opportunities across its regional landscape .

    Source Primary Research, Secondary Research, Market Research Future Database and Analyst Review

    Key Players and Competitive Insights

    The Commodity Liner Market has become increasingly competitive, driven by various factors such as globalization, innovation in shipping technologies, and the growing demand for efficient logistics solutions. Analyzing competitive insights within this market reveals not only the key players' strategies but also how they adapt to changing market dynamics. Companies are constantly refining their operational efficiencies, expanding their service portfolios, and enhancing customer service to maintain successful market positions. The market is characterized by emerging challenges and opportunities, compelling liners to innovate and differentiate themselves to meet customer expectations effectively.

    Understanding the competitive landscape is vital for any stakeholder looking to navigate this intricate marketplace, which includes a diverse range of services from container shipping to bulk transport.Wan Hai Lines has established itself as a noteworthy player in the Commodity Liner Market. The company is recognized for its robust operational capabilities and extensive network of shipping routes, which cater to multiple trade lanes, particularly in Asia and the Pacific. Wan Hai Lines has leveraged its strength in customer service, offering tailored solutions that respond to specific client needs, thereby fostering loyalty and repeat business.

    Additionally, the company's commitment to fleet modernization and investment in state-of-the-art vessels has allowed it to efficiently manage transport times and reduce operational costs, creating a competitive advantage. Wan Hai Lines' strategic partnerships with both local and international shipping entities further bolster its market presence, enabling the company to maintain service reliability and adaptability in a rapidly evolving industry.Evergreen Marine is another significant participant in the Commodity Liner Market, known for its extensive reach and solid reputation in the shipping industry.

    The company's comprehensive range of services includes container shipping, intermodal services, and terminal operations, allowing it to cater to various customer needs and preferences. Evergreen Marine's strengths lie in its strategic fleet management, maintaining a young and technologically advanced fleet that promotes energy efficiency and reduces environmental impact. Furthermore, the company has invested heavily in digital transformation and data analytics to optimize its logistics operations, providing customers with real-time tracking and improving supply chain transparency. This emphasis on innovation and dedication to sustainability helps Evergreen Marine remain competitive and relevant in the ever-changing landscape of the Commodity Liner Market.

    Key Companies in the Commodity Liner Market market include

    Industry Developments

    Recent developments in the Commodity Liner Market have been characterized by increased consolidation and competitive dynamics among key players such as A.P. Moller-Maersk, COSCO Shipping, and CMA CGM. Notably, ZIM Integrated Shipping Services has announced expansions in service offerings amidst rising freight rates, while Wan Hai Lines has been actively enhancing its fleet capabilities to secure a stronger market position.

    Current affairs also highlight the ongoing disruptions in supply chains due to geopolitical tensions and environmental regulations that are prompting lines like Evergreen Marine and Hapag-Lloyd to innovate their logistics strategies. Additionally, NyK Line and MOL are exploring alliances to strengthen their market presence. Recent mergers and acquisitions have seen industry players raise significant capital, with reports of consolidation trends that will further shape the competitive landscape.

    The overall growth in market valuation for these companies reflects a response to escalating demand for container shipping services, driven by e-commerce and trade fluctuations, which is likely to impact operational strategies for companies like Yang Ming Marine Transport and ONE.

    Future Outlook

    Commodity Liner Market Future Outlook

    The Commodity Liner Market is projected to grow at a 3.58% CAGR from 2024 to 2035, driven by technological advancements, increasing demand for efficient logistics, and sustainable practices.

    New opportunities lie in:

    • Invest in digital platforms for real-time tracking and analytics.
    • Develop eco-friendly liner solutions to meet regulatory demands.
    • Expand services in emerging markets to capture new customer segments.

    By 2035, the Commodity Liner Market is expected to exhibit robust growth, reflecting evolving industry dynamics.

    Market Segmentation

    Commodity Liner Market End Use Outlook

    • Residential
    • Commercial
    • Industrial

    Commodity Liner Market Regional Outlook

    • North America
    • Europe
    • South America
    • Asia Pacific
    • Middle East and Africa

    Commodity Liner Market Application Outlook

    • Construction
    • Manufacturing
    • Energy
    • Transportation

    Commodity Liner Market Material Type Outlook

    • Steel
    • Aluminum
    • Plastic
    • Composite

    Commodity Liner Market Market Category Outlook

    • High-end
    • Mid-range
    • Economical

    Report Scope

    Report Attribute/Metric Details
    Market Size 2024 16.04 (USD Billion)
    Market Size 2025 16.62 (USD Billion)
    Market Size 2034 22.79 (USD Billion)
    Compound Annual Growth Rate (CAGR) 3.6% (2025 - 2034)
    Report Coverage Revenue Forecast, Competitive Landscape, Growth Factors, and Trends
    Base Year 2024
    Market Forecast Period 2025 - 2034
    Historical Data 2020 - 2024
    Market Forecast Units USD Billion
    Key Companies Profiled Wan Hai Lines, Evergreen Marine, ZIM Integrated Shipping Services, K Line, COSCO Shipping, CMA CGM, Yang Ming Marine Transport, NYK Line, HapagLloyd, MOL, Hanjin Shipping, Mediterranean Shipping Company, A.P. MollerMaersk, PIL, ONE
    Segments Covered Material Type, Application, End Use, Market Category, Regional
    Key Market Opportunities 1.      Sustainable shipping solutions demand, 2.      Technological advancements in logistics, 3.      Increasing trade volumes, 4.      Emerging markets with growth potential, 5.      Enhanced fuel efficiency regulations
    Key Market Dynamics 1.      Supply chain disruptions, 2.      Increasing trade volumes, 3.      Environmental regulations, 4.      Technological advancements, 5.      Competitive pricing pressures
    Countries Covered North America, Europe, APAC, South America, MEA

    Market Highlights

    Author
    Sakshi Gupta
    Research Analyst Level II

    I have about two years of experience working in the consumer goods and retail industries and I am a biotech graduate.A tech-savvy analytically focused professional with a strong capabilities in identification, concept generation, and strategy evaluation. I can produce data-driven solutions while fusing unusual viewpoints with original concepts. I have been extensively working on business case studies, competitive & comparative analyses, and strategic reports. My primary areas of experience include client management, financial analysis, supply chain evaluation, market entry strategy evaluation, and estimating and forecasting market size.

    Leave a Comment

    FAQs

    What was the expected market size of the Commodity Liner Market by 2034?

    The Commodity Liner Market was expected to be valued at 22.79 USD Billion by 2034.

    What is the projected compound annual growth rate (CAGR) of the market from 2025 to 2034?

    The anticipated CAGR for the Commodity Liner Market from 2025 to 2034 is 3.6%.

    Which region is projected to dominate the Commodity Liner Market by 2034?

    North America is projected to dominate the market with a value of 6.5 USD Billion by 2034.

    What is the market size for Steel in the Commodity Liner Market in 2034?

    The market size for Steel in the Commodity Liner Market is expected to reach 7.3 USD Billion by 2034.

    Who are the major players in the Commodity Liner Market?

    Major players in the market include Wan Hai Lines, Evergreen Marine, ZIM Integrated Shipping Services, and A.P. Moller Maersk.

    What is the expected market size for the Aluminum segment by 2034?

    The Aluminum segment of the Commodity Liner Market is estimated to be valued at 4.1 USD Billion by 2034.

    How much is the Plastic segment projected to grow by 2034?

    The Plastic segment is projected to grow to a value of 5.2 USD Billion by 2034.

    What is the expected market size for South America in the Commodity Liner Market by 2034?

    The expected market size for South America in the Commodity Liner Market is projected to be 1.5 USD Billion by 2034.

    What are some emerging trends impacting the Commodity Liner Market?

    Emerging trends include increased digitalization in shipping and a shift towards sustainable materials.

    What is the expected market size for Composite materials by 2034?

    The market size for Composite materials in the Commodity Liner Market is projected to be 3.9 USD Billion by 2034.

    1. EXECUTIVE SUMMARY
      1. Market
    2. Overview
      1. Key Findings
      2. Market Segmentation
    3. Competitive Landscape
      1. Challenges and
    4. Opportunities
      1. Future Outlook
    5. MARKET INTRODUCTION
      1. Definition
      2. Scope of the study
        1. Research Objective
        2. Assumption
    6. Limitations
    7. RESEARCH METHODOLOGY
      1. Overview
    8. Data Mining
      1. Secondary Research
      2. Primary Research
        1. Primary Interviews and Information Gathering Process
        2. Breakdown of Primary Respondents
      3. Forecasting Model
      4. Market Size Estimation
    9. Bottom-Up Approach
      1. Top-Down Approach
      2. Data Triangulation
      3. Validation
    10. MARKET DYNAMICS
      1. Overview
    11. Drivers
      1. Restraints
      2. Opportunities
    12. MARKET FACTOR ANALYSIS
      1. Value chain Analysis
      2. Porter's Five Forces Analysis
        1. Bargaining Power of Suppliers
    13. Bargaining Power of Buyers
      1. Threat
    14. of New Entrants
      1. Threat of Substitutes
        1. Intensity of Rivalry
      2. COVID-19 Impact Analysis
    15. Market Impact Analysis
      1. Regional
    16. Impact
      1. Opportunity and Threat Analysis
    17. COMMODITY LINER MARKET, BY MATERIAL TYPE (USD
    18. BILLION)
      1. Steel
      2. Aluminum
      3. Plastic
      4. Composite
    19. COMMODITY LINER MARKET, BY APPLICATION (USD BILLION)
      1. Construction
      2. Manufacturing
      3. Energy
    20. Transportation
    21. COMMODITY LINER MARKET,
    22. BY END USE (USD BILLION)
      1. Residential
      2. Commercial
    23. Industrial
    24. COMMODITY LINER MARKET, BY
    25. MARKET CATEGORY (USD BILLION)
      1. High-end
      2. Mid-range
    26. Economical
    27. COMMODITY LINER MARKET,
    28. BY REGIONAL (USD BILLION)
      1. North America
        1. US
    29. Canada
      1. Europe
        1. Germany
        2. UK
        3. France
    30. Russia
      1. Italy
        1. Spain
        2. Rest of
    31. Europe
      1. APAC
        1. China
        2. India
        3. Japan
    32. South Korea
      1. Malaysia
        1. Thailand
    33. Indonesia
      1. Rest of APAC
      2. South America
        1. Brazil
        2. Mexico
        3. Argentina
    34. Rest of South America
      1. MEA
        1. GCC Countries
        2. South Africa
    35. Rest of MEA
    36. COMPETITIVE LANDSCAPE
      1. Overview
    37. Competitive Analysis
      1. Market share
    38. Analysis
      1. Major Growth Strategy in
    39. the Commodity Liner Market
      1. Competitive
    40. Benchmarking
      1. Leading Players in Terms
    41. of Number of Developments in the Commodity Liner Market
      1. Key developments and growth strategies
        1. New Product Launch/Service Deployment
        2. Merger & Acquisitions
    42. Joint Ventures
      1. Major Players Financial
    43. Matrix
      1. Sales and Operating Income
        1. Major Players R&D Expenditure. 2023
    44. COMPANY PROFILES
      1. Wan Hai Lines
    45. Financial Overview
      1. Products Offered
        1. Key Developments
        2. SWOT Analysis
    46. Key Strategies
      1. Evergreen Marine
        1. Financial Overview
        2. Products Offered
    47. Key Developments
      1. SWOT Analysis
        1. Key Strategies
      2. ZIM Integrated Shipping Services
        1. Financial Overview
    48. Products Offered
      1. Key Developments
        1. SWOT Analysis
        2. Key Strategies
    49. K Line
      1. Financial Overview
        1. Products Offered
        2. Key Developments
    50. SWOT Analysis
      1. Key Strategies
      2. COSCO Shipping
        1. Financial Overview
    51. Products Offered
      1. Key Developments
        1. SWOT Analysis
        2. Key Strategies
    52. CMA CGM
      1. Financial Overview
        1. Products Offered
        2. Key Developments
    53. SWOT Analysis
      1. Key Strategies
      2. Yang Ming Marine Transport
        1. Financial Overview
    54. Products Offered
      1. Key Developments
        1. SWOT Analysis
        2. Key Strategies
    55. NYK Line
      1. Financial Overview
        1. Products Offered
        2. Key Developments
    56. SWOT Analysis
      1. Key Strategies
      2. HapagLloyd
    57. Financial Overview
      1. Products Offered
        1. Key Developments
        2. SWOT Analysis
    58. Key Strategies
      1. MOL
        1. Financial Overview
    59. Products Offered
      1. Key Developments
        1. SWOT Analysis
        2. Key Strategies
    60. Hanjin Shipping
      1. Financial Overview
        1. Products Offered
        2. Key Developments
    61. SWOT Analysis
      1. Key Strategies
      2. Mediterranean Shipping Company
        1. Financial Overview
    62. Products Offered
      1. Key Developments
        1. SWOT Analysis
        2. Key Strategies
    63. A.P. MollerMaersk
      1. Financial Overview
        1. Products Offered
        2. Key Developments
    64. SWOT Analysis
      1. Key Strategies
      2. PIL
    65. Financial Overview
      1. Products Offered
        1. Key Developments
        2. SWOT Analysis
    66. Key Strategies
      1. ONE
        1. Financial Overview
    67. Products Offered
      1. Key Developments
        1. SWOT Analysis
        2. Key Strategies
      2. References
      3. Related Reports
    68. ESTIMATES & FORECAST, BY MATERIAL TYPE, 2025-2034 (USD BILLIONS)
    69. BY APPLICATION, 2025-2034 (USD BILLIONS)
    70. NORTH AMERICA COMMODITY LINER MARKET SIZE ESTIMATES & FORECAST, BY END USE,
    71. 2034 (USD BILLIONS)
    72. AMERICA COMMODITY LINER MARKET SIZE ESTIMATES & FORECAST, BY MARKET CATEGORY,
    73. 2034 (USD BILLIONS)
    74. AMERICA COMMODITY LINER MARKET SIZE ESTIMATES & FORECAST, BY REGIONAL, 2025-2034
    75. (USD BILLIONS)
    76. MARKET SIZE ESTIMATES & FORECAST, BY MATERIAL TYPE, 2025-2034 (USD BILLIONS)
    77. & FORECAST, BY APPLICATION, 2025-2034 (USD BILLIONS)
    78. END USE, 2025-2034 (USD BILLIONS)
    79. US COMMODITY LINER MARKET SIZE ESTIMATES & FORECAST, BY MARKET CATEGORY,
    80. 2034 (USD BILLIONS)
    81. LINER MARKET SIZE ESTIMATES & FORECAST, BY REGIONAL, 2025-2034 (USD BILLIONS)
    82. & FORECAST, BY MATERIAL TYPE, 2025-2034 (USD BILLIONS)
    83. BY APPLICATION, 2025-2034 (USD BILLIONS)
    84. CANADA COMMODITY LINER MARKET SIZE ESTIMATES & FORECAST, BY END USE, 2025-2034
    85. (USD BILLIONS)
    86. LINER MARKET SIZE ESTIMATES & FORECAST, BY MARKET CATEGORY, 2025-2034 (USD BILLIONS)
    87. & FORECAST, BY REGIONAL, 2025-2034 (USD BILLIONS)
    88. BY MATERIAL TYPE, 2025-2034 (USD BILLIONS)
    89. EUROPE COMMODITY LINER MARKET SIZE ESTIMATES & FORECAST, BY APPLICATION,
    90. 2034 (USD BILLIONS)
    91. COMMODITY LINER MARKET SIZE ESTIMATES & FORECAST, BY END USE, 2025-2034 (USD
    92. BILLIONS)
    93. MARKET SIZE ESTIMATES & FORECAST, BY MARKET CATEGORY, 2025-2034 (USD BILLIONS)
    94. & FORECAST, BY REGIONAL, 2025-2034 (USD BILLIONS)
    95. BY MATERIAL TYPE, 2025-2034 (USD BILLIONS)
    96. GERMANY COMMODITY LINER MARKET SIZE ESTIMATES & FORECAST, BY APPLICATION,
    97. 2034 (USD BILLIONS)
    98. COMMODITY LINER MARKET SIZE ESTIMATES & FORECAST, BY END USE, 2025-2034 (USD
    99. BILLIONS)
    100. MARKET SIZE ESTIMATES & FORECAST, BY MARKET CATEGORY, 2025-2034 (USD BILLIONS)
    101. & FORECAST, BY REGIONAL, 2025-2034 (USD BILLIONS)
    102. MATERIAL TYPE, 2025-2034 (USD BILLIONS)
    103. UK COMMODITY LINER MARKET SIZE ESTIMATES & FORECAST, BY APPLICATION, 2025-2034
    104. (USD BILLIONS)
    105. MARKET SIZE ESTIMATES & FORECAST, BY END USE, 2025-2034 (USD BILLIONS)
    106. & FORECAST, BY MARKET CATEGORY, 2025-2034 (USD BILLIONS)
    107. REGIONAL, 2025-2034 (USD BILLIONS)
    108. FRANCE COMMODITY LINER MARKET SIZE ESTIMATES & FORECAST, BY MATERIAL TYPE,
    109. 2034 (USD BILLIONS)
    110. COMMODITY LINER MARKET SIZE ESTIMATES & FORECAST, BY APPLICATION, 2025-2034
    111. (USD BILLIONS)
    112. LINER MARKET SIZE ESTIMATES & FORECAST, BY END USE, 2025-2034 (USD BILLIONS)
    113. & FORECAST, BY MARKET CATEGORY, 2025-2034 (USD BILLIONS)
    114. BY REGIONAL, 2025-2034 (USD BILLIONS)
    115. RUSSIA COMMODITY LINER MARKET SIZE ESTIMATES & FORECAST, BY MATERIAL TYPE,
    116. 2034 (USD BILLIONS)
    117. COMMODITY LINER MARKET SIZE ESTIMATES & FORECAST, BY APPLICATION, 2025-2034
    118. (USD BILLIONS)
    119. LINER MARKET SIZE ESTIMATES & FORECAST, BY END USE, 2025-2034 (USD BILLIONS)
    120. & FORECAST, BY MARKET CATEGORY, 2025-2034 (USD BILLIONS)
    121. BY REGIONAL, 2025-2034 (USD BILLIONS)
    122. ITALY COMMODITY LINER MARKET SIZE ESTIMATES & FORECAST, BY MATERIAL TYPE,
    123. 2034 (USD BILLIONS)
    124. COMMODITY LINER MARKET SIZE ESTIMATES & FORECAST, BY APPLICATION, 2025-2034
    125. (USD BILLIONS)
    126. LINER MARKET SIZE ESTIMATES & FORECAST, BY END USE, 2025-2034 (USD BILLIONS)
    127. & FORECAST, BY MARKET CATEGORY, 2025-2034 (USD BILLIONS)
    128. BY REGIONAL, 2025-2034 (USD BILLIONS)
    129. SPAIN COMMODITY LINER MARKET SIZE ESTIMATES & FORECAST, BY MATERIAL TYPE,
    130. 2034 (USD BILLIONS)
    131. COMMODITY LINER MARKET SIZE ESTIMATES & FORECAST, BY APPLICATION, 2025-2034
    132. (USD BILLIONS)
    133. LINER MARKET SIZE ESTIMATES & FORECAST, BY END USE, 2025-2034 (USD BILLIONS)
    134. & FORECAST, BY MARKET CATEGORY, 2025-2034 (USD BILLIONS)
    135. BY REGIONAL, 2025-2034 (USD BILLIONS)
    136. REST OF EUROPE COMMODITY LINER MARKET SIZE ESTIMATES & FORECAST, BY MATERIAL
    137. TYPE, 2025-2034 (USD BILLIONS)
    138. REST OF EUROPE COMMODITY LINER MARKET SIZE ESTIMATES & FORECAST, BY APPLICATION,
    139. 2034 (USD BILLIONS)
    140. OF EUROPE COMMODITY LINER MARKET SIZE ESTIMATES & FORECAST, BY END USE, 2025-2034
    141. (USD BILLIONS)
    142. COMMODITY LINER MARKET SIZE ESTIMATES & FORECAST, BY MARKET CATEGORY, 2025-2034
    143. (USD BILLIONS)
    144. COMMODITY LINER MARKET SIZE ESTIMATES & FORECAST, BY REGIONAL, 2025-2034 (USD
    145. BILLIONS)
    146. MARKET SIZE ESTIMATES & FORECAST, BY MATERIAL TYPE, 2025-2034 (USD BILLIONS)
    147. & FORECAST, BY APPLICATION, 2025-2034 (USD BILLIONS)
    148. BY END USE, 2025-2034 (USD BILLIONS)
    149. APAC COMMODITY LINER MARKET SIZE ESTIMATES & FORECAST, BY MARKET CATEGORY,
    150. 2034 (USD BILLIONS)
    151. COMMODITY LINER MARKET SIZE ESTIMATES & FORECAST, BY REGIONAL, 2025-2034 (USD
    152. BILLIONS)
    153. MARKET SIZE ESTIMATES & FORECAST, BY MATERIAL TYPE, 2025-2034 (USD BILLIONS)
    154. & FORECAST, BY APPLICATION, 2025-2034 (USD BILLIONS)
    155. BY END USE, 2025-2034 (USD BILLIONS)
    156. CHINA COMMODITY LINER MARKET SIZE ESTIMATES & FORECAST, BY MARKET CATEGORY,
    157. 2034 (USD BILLIONS)
    158. COMMODITY LINER MARKET SIZE ESTIMATES & FORECAST, BY REGIONAL, 2025-2034 (USD
    159. BILLIONS)
    160. MARKET SIZE ESTIMATES & FORECAST, BY MATERIAL TYPE, 2025-2034 (USD BILLIONS)
    161. & FORECAST, BY APPLICATION, 2025-2034 (USD BILLIONS)
    162. BY END USE, 2025-2034 (USD BILLIONS)
    163. INDIA COMMODITY LINER MARKET SIZE ESTIMATES & FORECAST, BY MARKET CATEGORY,
    164. 2034 (USD BILLIONS)
    165. COMMODITY LINER MARKET SIZE ESTIMATES & FORECAST, BY REGIONAL, 2025-2034 (USD
    166. BILLIONS)
    167. MARKET SIZE ESTIMATES & FORECAST, BY MATERIAL TYPE, 2025-2034 (USD BILLIONS)
    168. & FORECAST, BY APPLICATION, 2025-2034 (USD BILLIONS)
    169. BY END USE, 2025-2034 (USD BILLIONS)
    170. JAPAN COMMODITY LINER MARKET SIZE ESTIMATES & FORECAST, BY MARKET CATEGORY,
    171. 2034 (USD BILLIONS)
    172. COMMODITY LINER MARKET SIZE ESTIMATES & FORECAST, BY REGIONAL, 2025-2034 (USD
    173. BILLIONS)
    174. LINER MARKET SIZE ESTIMATES & FORECAST, BY MATERIAL TYPE, 2025-2034 (USD BILLIONS)
    175. ESTIMATES & FORECAST, BY APPLICATION, 2025-2034 (USD BILLIONS)
    176. BY END USE, 2025-2034 (USD BILLIONS)
    177. SOUTH KOREA COMMODITY LINER MARKET SIZE ESTIMATES & FORECAST, BY MARKET
    178. CATEGORY, 2025-2034 (USD BILLIONS)
    179. SOUTH KOREA COMMODITY LINER MARKET SIZE ESTIMATES & FORECAST, BY REGIONAL,
    180. 2034 (USD BILLIONS)
    181. COMMODITY LINER MARKET SIZE ESTIMATES & FORECAST, BY MATERIAL TYPE, 2025-2034
    182. (USD BILLIONS)
    183. LINER MARKET SIZE ESTIMATES & FORECAST, BY APPLICATION, 2025-2034 (USD BILLIONS)
    184. & FORECAST, BY END USE, 2025-2034 (USD BILLIONS)
    185. BY MARKET CATEGORY, 2025-2034 (USD BILLIONS)
    186. MALAYSIA COMMODITY LINER MARKET SIZE ESTIMATES & FORECAST, BY REGIONAL,
    187. 2034 (USD BILLIONS)
    188. COMMODITY LINER MARKET SIZE ESTIMATES & FORECAST, BY MATERIAL TYPE, 2025-2034
    189. (USD BILLIONS)
    190. LINER MARKET SIZE ESTIMATES & FORECAST, BY APPLICATION, 2025-2034 (USD BILLIONS)
    191. & FORECAST, BY END USE, 2025-2034 (USD BILLIONS)
    192. BY MARKET CATEGORY, 2025-2034 (USD BILLIONS)
    193. THAILAND COMMODITY LINER MARKET SIZE ESTIMATES & FORECAST, BY REGIONAL,
    194. 2034 (USD BILLIONS)
    195. COMMODITY LINER MARKET SIZE ESTIMATES & FORECAST, BY MATERIAL TYPE, 2025-2034
    196. (USD BILLIONS)
    197. LINER MARKET SIZE ESTIMATES & FORECAST, BY APPLICATION, 2025-2034 (USD BILLIONS)
    198. & FORECAST, BY END USE, 2025-2034 (USD BILLIONS)
    199. BY MARKET CATEGORY, 2025-2034 (USD BILLIONS)
    200. INDONESIA COMMODITY LINER MARKET SIZE ESTIMATES & FORECAST, BY REGIONAL,
    201. 2034 (USD BILLIONS)
    202. OF APAC COMMODITY LINER MARKET SIZE ESTIMATES & FORECAST, BY MATERIAL TYPE,
    203. 2034 (USD BILLIONS)
    204. OF APAC COMMODITY LINER MARKET SIZE ESTIMATES & FORECAST, BY APPLICATION, 2025-2034
    205. (USD BILLIONS)
    206. LINER MARKET SIZE ESTIMATES & FORECAST, BY END USE, 2025-2034 (USD BILLIONS)
    207. ESTIMATES & FORECAST, BY MARKET CATEGORY, 2025-2034 (USD BILLIONS)
    208. ESTIMATES & FORECAST, BY REGIONAL, 2025-2034 (USD BILLIONS)
    209. FORECAST, BY MATERIAL TYPE, 2025-2034 (USD BILLIONS)
    210. FORECAST, BY APPLICATION, 2025-2034 (USD BILLIONS)
    211. FORECAST, BY END USE, 2025-2034 (USD BILLIONS)
    212. SOUTH AMERICA COMMODITY LINER MARKET SIZE ESTIMATES & FORECAST, BY MARKET
    213. CATEGORY, 2025-2034 (USD BILLIONS)
    214. SOUTH AMERICA COMMODITY LINER MARKET SIZE ESTIMATES & FORECAST, BY REGIONAL,
    215. 2034 (USD BILLIONS)
    216. COMMODITY LINER MARKET SIZE ESTIMATES & FORECAST, BY MATERIAL TYPE, 2025-2034
    217. (USD BILLIONS)
    218. LINER MARKET SIZE ESTIMATES & FORECAST, BY APPLICATION, 2025-2034 (USD BILLIONS)
    219. & FORECAST, BY END USE, 2025-2034 (USD BILLIONS)
    220. BY MARKET CATEGORY, 2025-2034 (USD BILLIONS)
    221. BRAZIL COMMODITY LINER MARKET SIZE ESTIMATES & FORECAST, BY REGIONAL, 2025-2034
    222. (USD BILLIONS)
    223. LINER MARKET SIZE ESTIMATES & FORECAST, BY MATERIAL TYPE, 2025-2034 (USD BILLIONS)
    224. & FORECAST, BY APPLICATION, 2025-2034 (USD BILLIONS)
    225. BY END USE, 2025-2034 (USD BILLIONS)
    226. MEXICO COMMODITY LINER MARKET SIZE ESTIMATES & FORECAST, BY MARKET CATEGORY,
    227. 2034 (USD BILLIONS)
    228. COMMODITY LINER MARKET SIZE ESTIMATES & FORECAST, BY REGIONAL, 2025-2034 (USD
    229. BILLIONS)
    230. LINER MARKET SIZE ESTIMATES & FORECAST, BY MATERIAL TYPE, 2025-2034 (USD BILLIONS)
    231. ESTIMATES & FORECAST, BY APPLICATION, 2025-2034 (USD BILLIONS)
    232. BY END USE, 2025-2034 (USD BILLIONS)
    233. ARGENTINA COMMODITY LINER MARKET SIZE ESTIMATES & FORECAST, BY MARKET CATEGORY,
    234. 2034 (USD BILLIONS)
    235. COMMODITY LINER MARKET SIZE ESTIMATES & FORECAST, BY REGIONAL, 2025-2034 (USD
    236. BILLIONS)
    237. COMMODITY LINER MARKET SIZE ESTIMATES & FORECAST, BY MATERIAL TYPE, 2025-2034
    238. (USD BILLIONS)
    239. AMERICA COMMODITY LINER MARKET SIZE ESTIMATES & FORECAST, BY APPLICATION, 2025-2034
    240. (USD BILLIONS)
    241. AMERICA COMMODITY LINER MARKET SIZE ESTIMATES & FORECAST, BY END USE, 2025-2034
    242. (USD BILLIONS)
    243. AMERICA COMMODITY LINER MARKET SIZE ESTIMATES & FORECAST, BY MARKET CATEGORY,
    244. 2034 (USD BILLIONS)
    245. OF SOUTH AMERICA COMMODITY LINER MARKET SIZE ESTIMATES & FORECAST, BY REGIONAL,
    246. 2034 (USD BILLIONS)
    247. COMMODITY LINER MARKET SIZE ESTIMATES & FORECAST, BY MATERIAL TYPE, 2025-2034
    248. (USD BILLIONS)
    249. LINER MARKET SIZE ESTIMATES & FORECAST, BY APPLICATION, 2025-2034 (USD BILLIONS)
    250. & FORECAST, BY END USE, 2025-2034 (USD BILLIONS)
    251. BY MARKET CATEGORY, 2025-2034 (USD BILLIONS)
    252. MEA COMMODITY LINER MARKET SIZE ESTIMATES & FORECAST, BY REGIONAL, 2025-2034
    253. (USD BILLIONS)
    254. COMMODITY LINER MARKET SIZE ESTIMATES & FORECAST, BY MATERIAL TYPE, 2025-2034
    255. (USD BILLIONS)
    256. COMMODITY LINER MARKET SIZE ESTIMATES & FORECAST, BY APPLICATION, 2025-2034
    257. (USD BILLIONS)
    258. COMMODITY LINER MARKET SIZE ESTIMATES & FORECAST, BY END USE, 2025-2034 (USD
    259. BILLIONS)
    260. LINER MARKET SIZE ESTIMATES & FORECAST, BY MARKET CATEGORY, 2025-2034 (USD BILLIONS)
    261. ESTIMATES & FORECAST, BY REGIONAL, 2025-2034 (USD BILLIONS)
    262. BY MATERIAL TYPE, 2025-2034 (USD BILLIONS)
    263. SOUTH AFRICA COMMODITY LINER MARKET SIZE ESTIMATES & FORECAST, BY APPLICATION,
    264. 2034 (USD BILLIONS)
    265. AFRICA COMMODITY LINER MARKET SIZE ESTIMATES & FORECAST, BY END USE, 2025-2034
    266. (USD BILLIONS)
    267. COMMODITY LINER MARKET SIZE ESTIMATES & FORECAST, BY MARKET CATEGORY, 2025-2034
    268. (USD BILLIONS)
    269. COMMODITY LINER MARKET SIZE ESTIMATES & FORECAST, BY REGIONAL, 2025-2034 (USD
    270. BILLIONS)
    271. LINER MARKET SIZE ESTIMATES & FORECAST, BY MATERIAL TYPE, 2025-2034 (USD BILLIONS)
    272. ESTIMATES & FORECAST, BY APPLICATION, 2025-2034 (USD BILLIONS)
    273. BY END USE, 2025-2034 (USD BILLIONS)
    274. REST OF MEA COMMODITY LINER MARKET SIZE ESTIMATES & FORECAST, BY MARKET
    275. CATEGORY, 2025-2034 (USD BILLIONS)
    276. REST OF MEA COMMODITY LINER MARKET SIZE ESTIMATES & FORECAST, BY REGIONAL,
    277. 2034 (USD BILLIONS)
    278. LAUNCH/PRODUCT DEVELOPMENT/APPROVAL
    279. ACQUISITION/PARTNERSHIP
    280. USE
    281. ANALYSIS BY MARKET CATEGORY
    282. COMMODITY LINER MARKET ANALYSIS BY REGIONAL
    283. CANADA COMMODITY LINER MARKET ANALYSIS BY MATERIAL TYPE
    284. BY END USE
    285. LINER MARKET ANALYSIS BY MARKET CATEGORY
    286. CANADA COMMODITY LINER MARKET ANALYSIS BY REGIONAL
    287. BY APPLICATION
    288. LINER MARKET ANALYSIS BY END USE
    289. GERMANY COMMODITY LINER MARKET ANALYSIS BY MARKET CATEGORY
    290. MATERIAL TYPE
    291. MARKET ANALYSIS BY APPLICATION
    292. UK COMMODITY LINER MARKET ANALYSIS BY END USE
    293. UK COMMODITY LINER MARKET ANALYSIS BY MARKET CATEGORY
    294. BY APPLICATION
    295. LINER MARKET ANALYSIS BY END USE
    296. FRANCE COMMODITY LINER MARKET ANALYSIS BY MARKET CATEGORY
    297. BY MATERIAL TYPE
    298. LINER MARKET ANALYSIS BY APPLICATION
    299. RUSSIA COMMODITY LINER MARKET ANALYSIS BY END USE
    300. BY REGIONAL
    301. LINER MARKET ANALYSIS BY MATERIAL TYPE
    302. ITALY COMMODITY LINER MARKET ANALYSIS BY APPLICATION
    303. BY MARKET CATEGORY
    304. LINER MARKET ANALYSIS BY REGIONAL
    305. SPAIN COMMODITY LINER MARKET ANALYSIS BY MATERIAL TYPE
    306. BY END USE
    307. MARKET ANALYSIS BY MARKET CATEGORY
    308. SPAIN COMMODITY LINER MARKET ANALYSIS BY REGIONAL
    309. TYPE
    310. LINER MARKET ANALYSIS BY APPLICATION
    311. REST OF EUROPE COMMODITY LINER MARKET ANALYSIS BY END USE
    312. ANALYSIS BY REGIONAL
    313. LINER MARKET ANALYSIS
    314. COMMODITY LINER MARKET ANALYSIS BY MATERIAL TYPE
    315. CHINA COMMODITY LINER MARKET ANALYSIS BY APPLICATION
    316. BY MARKET CATEGORY
    317. LINER MARKET ANALYSIS BY REGIONAL
    318. INDIA COMMODITY LINER MARKET ANALYSIS BY MATERIAL TYPE
    319. BY END USE
    320. MARKET ANALYSIS BY MARKET CATEGORY
    321. INDIA COMMODITY LINER MARKET ANALYSIS BY REGIONAL
    322. BY APPLICATION
    323. LINER MARKET ANALYSIS BY END USE
    324. JAPAN COMMODITY LINER MARKET ANALYSIS BY MARKET CATEGORY
    325. BY MATERIAL TYPE
    326. COMMODITY LINER MARKET ANALYSIS BY APPLICATION
    327. SOUTH KOREA COMMODITY LINER MARKET ANALYSIS BY END USE
    328. BY REGIONAL
    329. LINER MARKET ANALYSIS BY MATERIAL TYPE
    330. MALAYSIA COMMODITY LINER MARKET ANALYSIS BY APPLICATION
    331. BY MARKET CATEGORY
    332. COMMODITY LINER MARKET ANALYSIS BY REGIONAL
    333. THAILAND COMMODITY LINER MARKET ANALYSIS BY MATERIAL TYPE
    334. BY END USE
    335. LINER MARKET ANALYSIS BY MARKET CATEGORY
    336. THAILAND COMMODITY LINER MARKET ANALYSIS BY REGIONAL
    337. BY APPLICATION
    338. LINER MARKET ANALYSIS BY END USE
    339. INDONESIA COMMODITY LINER MARKET ANALYSIS BY MARKET CATEGORY
    340. BY MATERIAL TYPE
    341. COMMODITY LINER MARKET ANALYSIS BY APPLICATION
    342. REST OF APAC COMMODITY LINER MARKET ANALYSIS BY END USE
    343. BY REGIONAL
    344. LINER MARKET ANALYSIS
    345. COMMODITY LINER MARKET ANALYSIS BY MATERIAL TYPE
    346. BRAZIL COMMODITY LINER MARKET ANALYSIS BY APPLICATION
    347. BY MARKET CATEGORY
    348. LINER MARKET ANALYSIS BY REGIONAL
    349. MEXICO COMMODITY LINER MARKET ANALYSIS BY MATERIAL TYPE
    350. BY END USE
    351. LINER MARKET ANALYSIS BY MARKET CATEGORY
    352. MEXICO COMMODITY LINER MARKET ANALYSIS BY REGIONAL
    353. BY APPLICATION
    354. LINER MARKET ANALYSIS BY END USE
    355. ARGENTINA COMMODITY LINER MARKET ANALYSIS BY MARKET CATEGORY
    356. MARKET ANALYSIS BY MATERIAL TYPE
    357. REST OF SOUTH AMERICA COMMODITY LINER MARKET ANALYSIS BY APPLICATION
    358. MARKET ANALYSIS BY END USE
    359. REST OF SOUTH AMERICA COMMODITY LINER MARKET ANALYSIS BY MARKET CATEGORY
    360. MARKET ANALYSIS BY REGIONAL
    361. MEA COMMODITY LINER MARKET ANALYSIS
    362. GCC COUNTRIES COMMODITY LINER MARKET ANALYSIS BY MATERIAL TYPE
    363. ANALYSIS BY END USE
    364. COMMODITY LINER MARKET ANALYSIS BY MARKET CATEGORY
    365. BY MATERIAL TYPE
    366. COMMODITY LINER MARKET ANALYSIS BY APPLICATION
    367. SOUTH AFRICA COMMODITY LINER MARKET ANALYSIS BY END USE
    368. BY REGIONAL
    369. LINER MARKET ANALYSIS BY MATERIAL TYPE
    370. REST OF MEA COMMODITY LINER MARKET ANALYSIS BY APPLICATION
    371. BY MARKET CATEGORY
    372. MEA COMMODITY LINER MARKET ANALYSIS BY REGIONAL
    373. KEY BUYING CRITERIA OF COMMODITY LINER MARKET
    374. DRO ANALYSIS OF COMMODITY LINER MARKET
    375. DRIVERS IMPACT ANALYSIS: COMMODITY LINER MARKET
    376. MARKET
    377. BY MATERIAL TYPE, 2024 (% SHARE)
    378. COMMODITY LINER MARKET, BY MATERIAL TYPE, 2025 to 2034 (USD Billions)
    379. (% SHARE)
    380. MARKET, BY APPLICATION, 2025 to 2034 (USD Billions)
    381. to 2034 (USD Billions)
    382. LINER MARKET, BY MARKET CATEGORY, 2024 (% SHARE)
    383. COMMODITY LINER MARKET, BY MARKET CATEGORY, 2025 to 2034 (USD Billions)
    384. (% SHARE)
    385. MARKET, BY REGIONAL, 2025 to 2034 (USD Billions)
    386. BENCHMARKING OF MAJOR COMPETITORS

    TABLE OF CONTENTS

    1. EXECUTIVE SUMMARY

    1.1. Market Overview

    1.2. Key Findings

    1.3. Market Segmentation

    1.4. Competitive Landscape

    1.5. Challenges and Opportunities

    1.6. Future Outlook

    2. MARKET INTRODUCTION

    2.1. Definition

    2.2. Scope of the study

    2.2.1. Research Objective

    2.2.2. Assumption

    2.2.3. Limitations

    3. RESEARCH METHODOLOGY

    3.1. Overview

    3.2. Data Mining

    3.3. Secondary Research

    3.4. Primary Research

    3.4.1. Primary Interviews and Information Gathering Process

    3.4.2. Breakdown of Primary Respondents

    3.5. Forecasting Model

    3.6. Market Size Estimation

    3.6.1. Bottom-Up Approach

    3.6.2. Top-Down Approach

    3.7. Data Triangulation

    3.8. Validation

    4. MARKET DYNAMICS

    4.1. Overview

    4.2. Drivers

    4.3. Restraints

    4.4. Opportunities

    5. MARKET FACTOR ANALYSIS

    5.1. Value chain Analysis

    5.2. Porter's Five Forces Analysis

    5.2.1. Bargaining Power of Suppliers

    5.2.2. Bargaining Power of Buyers

    5.2.3. Threat of New Entrants

    5.2.4. Threat of Substitutes

    5.2.5. Intensity of Rivalry

    5.3. COVID-19 Impact Analysis

    5.3.1. Market Impact Analysis

    5.3.2. Regional Impact

    5.3.3. Opportunity and Threat Analysis

    6. COMMODITY LINER MARKET, BY MATERIAL TYPE (USD BILLION)

    6.1. Steel

    6.2. Aluminum

    6.3. Plastic

    6.4. Composite

    7. COMMODITY LINER MARKET, BY APPLICATION (USD BILLION)

    7.1. Construction

    7.2. Manufacturing

    7.3. Energy

    7.4. Transportation

    8. COMMODITY LINER MARKET, BY END USE (USD BILLION)

    8.1. Residential

    8.2. Commercial

    8.3. Industrial

    9. COMMODITY LINER MARKET, BY MARKET CATEGORY (USD BILLION)

    9.1. High-end

    9.2. Mid-range

    9.3. Economical

    10. COMMODITY LINER MARKET, BY REGIONAL (USD BILLION)

    10.1. North America

    10.1.1. US

    10.1.2. Canada

    10.2. Europe

    10.2.1. Germany

    10.2.2. UK

    10.2.3. France

    10.2.4. Russia

    10.2.5. Italy

    10.2.6. Spain

    10.2.7. Rest of Europe

    10.3. APAC

    10.3.1. China

    10.3.2. India

    10.3.3. Japan

    10.3.4. South Korea

    10.3.5. Malaysia

    10.3.6. Thailand

    10.3.7. Indonesia

    10.3.8. Rest of APAC

    10.4. South America

    10.4.1. Brazil

    10.4.2. Mexico

    10.4.3. Argentina

    10.4.4. Rest of South America

    10.5. MEA

    10.5.1. GCC Countries

    10.5.2. South Africa

    10.5.3. Rest of MEA

    11. COMPETITIVE LANDSCAPE

    11.1. Overview

    11.2. Competitive Analysis

    11.3. Market share Analysis

    11.4. Major Growth Strategy in the Commodity Liner Market

    11.5. Competitive Benchmarking

    11.6. Leading Players in Terms of Number of Developments in the Commodity Liner Market

    11.7. Key developments and growth strategies

    11.7.1. New Product Launch/Service Deployment

    11.7.2. Merger & Acquisitions

    11.7.3. Joint Ventures

    11.8. Major Players Financial Matrix

    11.8.1. Sales and Operating Income

    11.8.2. Major Players R&D Expenditure. 2023

    12. COMPANY PROFILES

    12.1. Wan Hai Lines

    12.1.1. Financial Overview

    12.1.2. Products Offered

    12.1.3. Key Developments

    12.1.4. SWOT Analysis

    12.1.5. Key Strategies

    12.2. Evergreen Marine

    12.2.1. Financial Overview

    12.2.2. Products Offered

    12.2.3. Key Developments

    12.2.4. SWOT Analysis

    12.2.5. Key Strategies

    12.3. ZIM Integrated Shipping Services

    12.3.1. Financial Overview

    12.3.2. Products Offered

    12.3.3. Key Developments

    12.3.4. SWOT Analysis

    12.3.5. Key Strategies

    12.4. K Line

    12.4.1. Financial Overview

    12.4.2. Products Offered

    12.4.3. Key Developments

    12.4.4. SWOT Analysis

    12.4.5. Key Strategies

    12.5. COSCO Shipping

    12.5.1. Financial Overview

    12.5.2. Products Offered

    12.5.3. Key Developments

    12.5.4. SWOT Analysis

    12.5.5. Key Strategies

    12.6. CMA CGM

    12.6.1. Financial Overview

    12.6.2. Products Offered

    12.6.3. Key Developments

    12.6.4. SWOT Analysis

    12.6.5. Key Strategies

    12.7. Yang Ming Marine Transport

    12.7.1. Financial Overview

    12.7.2. Products Offered

    12.7.3. Key Developments

    12.7.4. SWOT Analysis

    12.7.5. Key Strategies

    12.8. NYK Line

    12.8.1. Financial Overview

    12.8.2. Products Offered

    12.8.3. Key Developments

    12.8.4. SWOT Analysis

    12.8.5. Key Strategies

    12.9. HapagLloyd

    12.9.1. Financial Overview

    12.9.2. Products Offered

    12.9.3. Key Developments

    12.9.4. SWOT Analysis

    12.9.5. Key Strategies

    12.10. MOL

    12.10.1. Financial Overview

    12.10.2. Products Offered

    12.10.3. Key Developments

    12.10.4. SWOT Analysis

    12.10.5. Key Strategies

    12.11. Hanjin Shipping

    12.11.1. Financial Overview

    12.11.2. Products Offered

    12.11.3. Key Developments

    12.11.4. SWOT Analysis

    12.11.5. Key Strategies

    12.12. Mediterranean Shipping Company

    12.12.1. Financial Overview

    12.12.2. Products Offered

    12.12.3. Key Developments

    12.12.4. SWOT Analysis

    12.12.5. Key Strategies

    12.13. A.P. MollerMaersk

    12.13.1. Financial Overview

    12.13.2. Products Offered

    12.13.3. Key Developments

    12.13.4. SWOT Analysis

    12.13.5. Key Strategies

    12.14. PIL

    12.14.1. Financial Overview

    12.14.2. Products Offered

    12.14.3. Key Developments

    12.14.4. SWOT Analysis

    12.14.5. Key Strategies

    12.15. ONE

    12.15.1. Financial Overview

    12.15.2. Products Offered

    12.15.3. Key Developments

    12.15.4. SWOT Analysis

    12.15.5. Key Strategies

    13. APPENDIX

    13.1. References

    13.2. Related Reports

    LIST OF TABLES

    TABLE 1. LIST OF ASSUMPTIONS

    TABLE 2. NORTH AMERICA COMMODITY LINER MARKET SIZE ESTIMATES & FORECAST, BY MATERIAL TYPE, 2019-2032 (USD BILLIONS)

    TABLE 3. NORTH AMERICA COMMODITY LINER MARKET SIZE ESTIMATES & FORECAST, BY APPLICATION, 2019-2032 (USD BILLIONS)

    TABLE 4. NORTH AMERICA COMMODITY LINER MARKET SIZE ESTIMATES & FORECAST, BY END USE, 2019-2032 (USD BILLIONS)

    TABLE 5. NORTH AMERICA COMMODITY LINER MARKET SIZE ESTIMATES & FORECAST, BY MARKET CATEGORY, 2019-2032 (USD BILLIONS)

    TABLE 6. NORTH AMERICA COMMODITY LINER MARKET SIZE ESTIMATES & FORECAST, BY REGIONAL, 2019-2032 (USD BILLIONS)

    TABLE 7. US COMMODITY LINER MARKET SIZE ESTIMATES & FORECAST, BY MATERIAL TYPE, 2019-2032 (USD BILLIONS)

    TABLE 8. US COMMODITY LINER MARKET SIZE ESTIMATES & FORECAST, BY APPLICATION, 2019-2032 (USD BILLIONS)

    TABLE 9. US COMMODITY LINER MARKET SIZE ESTIMATES & FORECAST, BY END USE, 2019-2032 (USD BILLIONS)

    TABLE 10. US COMMODITY LINER MARKET SIZE ESTIMATES & FORECAST, BY MARKET CATEGORY, 2019-2032 (USD BILLIONS)

    TABLE 11. US COMMODITY LINER MARKET SIZE ESTIMATES & FORECAST, BY REGIONAL, 2019-2032 (USD BILLIONS)

    TABLE 12. CANADA COMMODITY LINER MARKET SIZE ESTIMATES & FORECAST, BY MATERIAL TYPE, 2019-2032 (USD BILLIONS)

    TABLE 13. CANADA COMMODITY LINER MARKET SIZE ESTIMATES & FORECAST, BY APPLICATION, 2019-2032 (USD BILLIONS)

    TABLE 14. CANADA COMMODITY LINER MARKET SIZE ESTIMATES & FORECAST, BY END USE, 2019-2032 (USD BILLIONS)

    TABLE 15. CANADA COMMODITY LINER MARKET SIZE ESTIMATES & FORECAST, BY MARKET CATEGORY, 2019-2032 (USD BILLIONS)

    TABLE 16. CANADA COMMODITY LINER MARKET SIZE ESTIMATES & FORECAST, BY REGIONAL, 2019-2032 (USD BILLIONS)

    TABLE 17. EUROPE COMMODITY LINER MARKET SIZE ESTIMATES & FORECAST, BY MATERIAL TYPE, 2019-2032 (USD BILLIONS)

    TABLE 18. EUROPE COMMODITY LINER MARKET SIZE ESTIMATES & FORECAST, BY APPLICATION, 2019-2032 (USD BILLIONS)

    TABLE 19. EUROPE COMMODITY LINER MARKET SIZE ESTIMATES & FORECAST, BY END USE, 2019-2032 (USD BILLIONS)

    TABLE 20. EUROPE COMMODITY LINER MARKET SIZE ESTIMATES & FORECAST, BY MARKET CATEGORY, 2019-2032 (USD BILLIONS)

    TABLE 21. EUROPE COMMODITY LINER MARKET SIZE ESTIMATES & FORECAST, BY REGIONAL, 2019-2032 (USD BILLIONS)

    TABLE 22. GERMANY COMMODITY LINER MARKET SIZE ESTIMATES & FORECAST, BY MATERIAL TYPE, 2019-2032 (USD BILLIONS)

    TABLE 23. GERMANY COMMODITY LINER MARKET SIZE ESTIMATES & FORECAST, BY APPLICATION, 2019-2032 (USD BILLIONS)

    TABLE 24. GERMANY COMMODITY LINER MARKET SIZE ESTIMATES & FORECAST, BY END USE, 2019-2032 (USD BILLIONS)

    TABLE 25. GERMANY COMMODITY LINER MARKET SIZE ESTIMATES & FORECAST, BY MARKET CATEGORY, 2019-2032 (USD BILLIONS)

    TABLE 26. GERMANY COMMODITY LINER MARKET SIZE ESTIMATES & FORECAST, BY REGIONAL, 2019-2032 (USD BILLIONS)

    TABLE 27. UK COMMODITY LINER MARKET SIZE ESTIMATES & FORECAST, BY MATERIAL TYPE, 2019-2032 (USD BILLIONS)

    TABLE 28. UK COMMODITY LINER MARKET SIZE ESTIMATES & FORECAST, BY APPLICATION, 2019-2032 (USD BILLIONS)

    TABLE 29. UK COMMODITY LINER MARKET SIZE ESTIMATES & FORECAST, BY END USE, 2019-2032 (USD BILLIONS)

    TABLE 30. UK COMMODITY LINER MARKET SIZE ESTIMATES & FORECAST, BY MARKET CATEGORY, 2019-2032 (USD BILLIONS)

    TABLE 31. UK COMMODITY LINER MARKET SIZE ESTIMATES & FORECAST, BY REGIONAL, 2019-2032 (USD BILLIONS)

    TABLE 32. FRANCE COMMODITY LINER MARKET SIZE ESTIMATES & FORECAST, BY MATERIAL TYPE, 2019-2032 (USD BILLIONS)

    TABLE 33. FRANCE COMMODITY LINER MARKET SIZE ESTIMATES & FORECAST, BY APPLICATION, 2019-2032 (USD BILLIONS)

    TABLE 34. FRANCE COMMODITY LINER MARKET SIZE ESTIMATES & FORECAST, BY END USE, 2019-2032 (USD BILLIONS)

    TABLE 35. FRANCE COMMODITY LINER MARKET SIZE ESTIMATES & FORECAST, BY MARKET CATEGORY, 2019-2032 (USD BILLIONS)

    TABLE 36. FRANCE COMMODITY LINER MARKET SIZE ESTIMATES & FORECAST, BY REGIONAL, 2019-2032 (USD BILLIONS)

    TABLE 37. RUSSIA COMMODITY LINER MARKET SIZE ESTIMATES & FORECAST, BY MATERIAL TYPE, 2019-2032 (USD BILLIONS)

    TABLE 38. RUSSIA COMMODITY LINER MARKET SIZE ESTIMATES & FORECAST, BY APPLICATION, 2019-2032 (USD BILLIONS)

    TABLE 39. RUSSIA COMMODITY LINER MARKET SIZE ESTIMATES & FORECAST, BY END USE, 2019-2032 (USD BILLIONS)

    TABLE 40. RUSSIA COMMODITY LINER MARKET SIZE ESTIMATES & FORECAST, BY MARKET CATEGORY, 2019-2032 (USD BILLIONS)

    TABLE 41. RUSSIA COMMODITY LINER MARKET SIZE ESTIMATES & FORECAST, BY REGIONAL, 2019-2032 (USD BILLIONS)

    TABLE 42. ITALY COMMODITY LINER MARKET SIZE ESTIMATES & FORECAST, BY MATERIAL TYPE, 2019-2032 (USD BILLIONS)

    TABLE 43. ITALY COMMODITY LINER MARKET SIZE ESTIMATES & FORECAST, BY APPLICATION, 2019-2032 (USD BILLIONS)

    TABLE 44. ITALY COMMODITY LINER MARKET SIZE ESTIMATES & FORECAST, BY END USE, 2019-2032 (USD BILLIONS)

    TABLE 45. ITALY COMMODITY LINER MARKET SIZE ESTIMATES & FORECAST, BY MARKET CATEGORY, 2019-2032 (USD BILLIONS)

    TABLE 46. ITALY COMMODITY LINER MARKET SIZE ESTIMATES & FORECAST, BY REGIONAL, 2019-2032 (USD BILLIONS)

    TABLE 47. SPAIN COMMODITY LINER MARKET SIZE ESTIMATES & FORECAST, BY MATERIAL TYPE, 2019-2032 (USD BILLIONS)

    TABLE 48. SPAIN COMMODITY LINER MARKET SIZE ESTIMATES & FORECAST, BY APPLICATION, 2019-2032 (USD BILLIONS)

    TABLE 49. SPAIN COMMODITY LINER MARKET SIZE ESTIMATES & FORECAST, BY END USE, 2019-2032 (USD BILLIONS)

    TABLE 50. SPAIN COMMODITY LINER MARKET SIZE ESTIMATES & FORECAST, BY MARKET CATEGORY, 2019-2032 (USD BILLIONS)

    TABLE 51. SPAIN COMMODITY LINER MARKET SIZE ESTIMATES & FORECAST, BY REGIONAL, 2019-2032 (USD BILLIONS)

    TABLE 52. REST OF EUROPE COMMODITY LINER MARKET SIZE ESTIMATES & FORECAST, BY MATERIAL TYPE, 2019-2032 (USD BILLIONS)

    TABLE 53. REST OF EUROPE COMMODITY LINER MARKET SIZE ESTIMATES & FORECAST, BY APPLICATION, 2019-2032 (USD BILLIONS)

    TABLE 54. REST OF EUROPE COMMODITY LINER MARKET SIZE ESTIMATES & FORECAST, BY END USE, 2019-2032 (USD BILLIONS)

    TABLE 55. REST OF EUROPE COMMODITY LINER MARKET SIZE ESTIMATES & FORECAST, BY MARKET CATEGORY, 2019-2032 (USD BILLIONS)

    TABLE 56. REST OF EUROPE COMMODITY LINER MARKET SIZE ESTIMATES & FORECAST, BY REGIONAL, 2019-2032 (USD BILLIONS)

    TABLE 57. APAC COMMODITY LINER MARKET SIZE ESTIMATES & FORECAST, BY MATERIAL TYPE, 2019-2032 (USD BILLIONS)

    TABLE 58. APAC COMMODITY LINER MARKET SIZE ESTIMATES & FORECAST, BY APPLICATION, 2019-2032 (USD BILLIONS)

    TABLE 59. APAC COMMODITY LINER MARKET SIZE ESTIMATES & FORECAST, BY END USE, 2019-2032 (USD BILLIONS)

    TABLE 60. APAC COMMODITY LINER MARKET SIZE ESTIMATES & FORECAST, BY MARKET CATEGORY, 2019-2032 (USD BILLIONS)

    TABLE 61. APAC COMMODITY LINER MARKET SIZE ESTIMATES & FORECAST, BY REGIONAL, 2019-2032 (USD BILLIONS)

    TABLE 62. CHINA COMMODITY LINER MARKET SIZE ESTIMATES & FORECAST, BY MATERIAL TYPE, 2019-2032 (USD BILLIONS)

    TABLE 63. CHINA COMMODITY LINER MARKET SIZE ESTIMATES & FORECAST, BY APPLICATION, 2019-2032 (USD BILLIONS)

    TABLE 64. CHINA COMMODITY LINER MARKET SIZE ESTIMATES & FORECAST, BY END USE, 2019-2032 (USD BILLIONS)

    TABLE 65. CHINA COMMODITY LINER MARKET SIZE ESTIMATES & FORECAST, BY MARKET CATEGORY, 2019-2032 (USD BILLIONS)

    TABLE 66. CHINA COMMODITY LINER MARKET SIZE ESTIMATES & FORECAST, BY REGIONAL, 2019-2032 (USD BILLIONS)

    TABLE 67. INDIA COMMODITY LINER MARKET SIZE ESTIMATES & FORECAST, BY MATERIAL TYPE, 2019-2032 (USD BILLIONS)

    TABLE 68. INDIA COMMODITY LINER MARKET SIZE ESTIMATES & FORECAST, BY APPLICATION, 2019-2032 (USD BILLIONS)

    TABLE 69. INDIA COMMODITY LINER MARKET SIZE ESTIMATES & FORECAST, BY END USE, 2019-2032 (USD BILLIONS)

    TABLE 70. INDIA COMMODITY LINER MARKET SIZE ESTIMATES & FORECAST, BY MARKET CATEGORY, 2019-2032 (USD BILLIONS)

    TABLE 71. INDIA COMMODITY LINER MARKET SIZE ESTIMATES & FORECAST, BY REGIONAL, 2019-2032 (USD BILLIONS)

    TABLE 72. JAPAN COMMODITY LINER MARKET SIZE ESTIMATES & FORECAST, BY MATERIAL TYPE, 2019-2032 (USD BILLIONS)

    TABLE 73. JAPAN COMMODITY LINER MARKET SIZE ESTIMATES & FORECAST, BY APPLICATION, 2019-2032 (USD BILLIONS)

    TABLE 74. JAPAN COMMODITY LINER MARKET SIZE ESTIMATES & FORECAST, BY END USE, 2019-2032 (USD BILLIONS)

    TABLE 75. JAPAN COMMODITY LINER MARKET SIZE ESTIMATES & FORECAST, BY MARKET CATEGORY, 2019-2032 (USD BILLIONS)

    TABLE 76. JAPAN COMMODITY LINER MARKET SIZE ESTIMATES & FORECAST, BY REGIONAL, 2019-2032 (USD BILLIONS)

    TABLE 77. SOUTH KOREA COMMODITY LINER MARKET SIZE ESTIMATES & FORECAST, BY MATERIAL TYPE, 2019-2032 (USD BILLIONS)

    TABLE 78. SOUTH KOREA COMMODITY LINER MARKET SIZE ESTIMATES & FORECAST, BY APPLICATION, 2019-2032 (USD BILLIONS)

    TABLE 79. SOUTH KOREA COMMODITY LINER MARKET SIZE ESTIMATES & FORECAST, BY END USE, 2019-2032 (USD BILLIONS)

    TABLE 80. SOUTH KOREA COMMODITY LINER MARKET SIZE ESTIMATES & FORECAST, BY MARKET CATEGORY, 2019-2032 (USD BILLIONS)

    TABLE 81. SOUTH KOREA COMMODITY LINER MARKET SIZE ESTIMATES & FORECAST, BY REGIONAL, 2019-2032 (USD BILLIONS)

    TABLE 82. MALAYSIA COMMODITY LINER MARKET SIZE ESTIMATES & FORECAST, BY MATERIAL TYPE, 2019-2032 (USD BILLIONS)

    TABLE 83. MALAYSIA COMMODITY LINER MARKET SIZE ESTIMATES & FORECAST, BY APPLICATION, 2019-2032 (USD BILLIONS)

    TABLE 84. MALAYSIA COMMODITY LINER MARKET SIZE ESTIMATES & FORECAST, BY END USE, 2019-2032 (USD BILLIONS)

    TABLE 85. MALAYSIA COMMODITY LINER MARKET SIZE ESTIMATES & FORECAST, BY MARKET CATEGORY, 2019-2032 (USD BILLIONS)

    TABLE 86. MALAYSIA COMMODITY LINER MARKET SIZE ESTIMATES & FORECAST, BY REGIONAL, 2019-2032 (USD BILLIONS)

    TABLE 87. THAILAND COMMODITY LINER MARKET SIZE ESTIMATES & FORECAST, BY MATERIAL TYPE, 2019-2032 (USD BILLIONS)

    TABLE 88. THAILAND COMMODITY LINER MARKET SIZE ESTIMATES & FORECAST, BY APPLICATION, 2019-2032 (USD BILLIONS)

    TABLE 89. THAILAND COMMODITY LINER MARKET SIZE ESTIMATES & FORECAST, BY END USE, 2019-2032 (USD BILLIONS)

    TABLE 90. THAILAND COMMODITY LINER MARKET SIZE ESTIMATES & FORECAST, BY MARKET CATEGORY, 2019-2032 (USD BILLIONS)

    TABLE 91. THAILAND COMMODITY LINER MARKET SIZE ESTIMATES & FORECAST, BY REGIONAL, 2019-2032 (USD BILLIONS)

    TABLE 92. INDONESIA COMMODITY LINER MARKET SIZE ESTIMATES & FORECAST, BY MATERIAL TYPE, 2019-2032 (USD BILLIONS)

    TABLE 93. INDONESIA COMMODITY LINER MARKET SIZE ESTIMATES & FORECAST, BY APPLICATION, 2019-2032 (USD BILLIONS)

    TABLE 94. INDONESIA COMMODITY LINER MARKET SIZE ESTIMATES & FORECAST, BY END USE, 2019-2032 (USD BILLIONS)

    TABLE 95. INDONESIA COMMODITY LINER MARKET SIZE ESTIMATES & FORECAST, BY MARKET CATEGORY, 2019-2032 (USD BILLIONS)

    TABLE 96. INDONESIA COMMODITY LINER MARKET SIZE ESTIMATES & FORECAST, BY REGIONAL, 2019-2032 (USD BILLIONS)

    TABLE 97. REST OF APAC COMMODITY LINER MARKET SIZE ESTIMATES & FORECAST, BY MATERIAL TYPE, 2019-2032 (USD BILLIONS)

    TABLE 98. REST OF APAC COMMODITY LINER MARKET SIZE ESTIMATES & FORECAST, BY APPLICATION, 2019-2032 (USD BILLIONS)

    TABLE 99. REST OF APAC COMMODITY LINER MARKET SIZE ESTIMATES & FORECAST, BY END USE, 2019-2032 (USD BILLIONS)

    TABLE 100. REST OF APAC COMMODITY LINER MARKET SIZE ESTIMATES & FORECAST, BY MARKET CATEGORY, 2019-2032 (USD BILLIONS)

    TABLE 101. REST OF APAC COMMODITY LINER MARKET SIZE ESTIMATES & FORECAST, BY REGIONAL, 2019-2032 (USD BILLIONS)

    TABLE 102. SOUTH AMERICA COMMODITY LINER MARKET SIZE ESTIMATES & FORECAST, BY MATERIAL TYPE, 2019-2032 (USD BILLIONS)

    TABLE 103. SOUTH AMERICA COMMODITY LINER MARKET SIZE ESTIMATES & FORECAST, BY APPLICATION, 2019-2032 (USD BILLIONS)

    TABLE 104. SOUTH AMERICA COMMODITY LINER MARKET SIZE ESTIMATES & FORECAST, BY END USE, 2019-2032 (USD BILLIONS)

    TABLE 105. SOUTH AMERICA COMMODITY LINER MARKET SIZE ESTIMATES & FORECAST, BY MARKET CATEGORY, 2019-2032 (USD BILLIONS)

    TABLE 106. SOUTH AMERICA COMMODITY LINER MARKET SIZE ESTIMATES & FORECAST, BY REGIONAL, 2019-2032 (USD BILLIONS)

    TABLE 107. BRAZIL COMMODITY LINER MARKET SIZE ESTIMATES & FORECAST, BY MATERIAL TYPE, 2019-2032 (USD BILLIONS)

    TABLE 108. BRAZIL COMMODITY LINER MARKET SIZE ESTIMATES & FORECAST, BY APPLICATION, 2019-2032 (USD BILLIONS)

    TABLE 109. BRAZIL COMMODITY LINER MARKET SIZE ESTIMATES & FORECAST, BY END USE, 2019-2032 (USD BILLIONS)

    TABLE 110. BRAZIL COMMODITY LINER MARKET SIZE ESTIMATES & FORECAST, BY MARKET CATEGORY, 2019-2032 (USD BILLIONS)

    TABLE 111. BRAZIL COMMODITY LINER MARKET SIZE ESTIMATES & FORECAST, BY REGIONAL, 2019-2032 (USD BILLIONS)

    TABLE 112. MEXICO COMMODITY LINER MARKET SIZE ESTIMATES & FORECAST, BY MATERIAL TYPE, 2019-2032 (USD BILLIONS)

    TABLE 113. MEXICO COMMODITY LINER MARKET SIZE ESTIMATES & FORECAST, BY APPLICATION, 2019-2032 (USD BILLIONS)

    TABLE 114. MEXICO COMMODITY LINER MARKET SIZE ESTIMATES & FORECAST, BY END USE, 2019-2032 (USD BILLIONS)

    TABLE 115. MEXICO COMMODITY LINER MARKET SIZE ESTIMATES & FORECAST, BY MARKET CATEGORY, 2019-2032 (USD BILLIONS)

    TABLE 116. MEXICO COMMODITY LINER MARKET SIZE ESTIMATES & FORECAST, BY REGIONAL, 2019-2032 (USD BILLIONS)

    TABLE 117. ARGENTINA COMMODITY LINER MARKET SIZE ESTIMATES & FORECAST, BY MATERIAL TYPE, 2019-2032 (USD BILLIONS)

    TABLE 118. ARGENTINA COMMODITY LINER MARKET SIZE ESTIMATES & FORECAST, BY APPLICATION, 2019-2032 (USD BILLIONS)

    TABLE 119. ARGENTINA COMMODITY LINER MARKET SIZE ESTIMATES & FORECAST, BY END USE, 2019-2032 (USD BILLIONS)

    TABLE 120. ARGENTINA COMMODITY LINER MARKET SIZE ESTIMATES & FORECAST, BY MARKET CATEGORY, 2019-2032 (USD BILLIONS)

    TABLE 121. ARGENTINA COMMODITY LINER MARKET SIZE ESTIMATES & FORECAST, BY REGIONAL, 2019-2032 (USD BILLIONS)

    TABLE 122. REST OF SOUTH AMERICA COMMODITY LINER MARKET SIZE ESTIMATES & FORECAST, BY MATERIAL TYPE, 2019-2032 (USD BILLIONS)

    TABLE 123. REST OF SOUTH AMERICA COMMODITY LINER MARKET SIZE ESTIMATES & FORECAST, BY APPLICATION, 2019-2032 (USD BILLIONS)

    TABLE 124. REST OF SOUTH AMERICA COMMODITY LINER MARKET SIZE ESTIMATES & FORECAST, BY END USE, 2019-2032 (USD BILLIONS)

    TABLE 125. REST OF SOUTH AMERICA COMMODITY LINER MARKET SIZE ESTIMATES & FORECAST, BY MARKET CATEGORY, 2019-2032 (USD BILLIONS)

    TABLE 126. REST OF SOUTH AMERICA COMMODITY LINER MARKET SIZE ESTIMATES & FORECAST, BY REGIONAL, 2019-2032 (USD BILLIONS)

    TABLE 127. MEA COMMODITY LINER MARKET SIZE ESTIMATES & FORECAST, BY MATERIAL TYPE, 2019-2032 (USD BILLIONS)

    TABLE 128. MEA COMMODITY LINER MARKET SIZE ESTIMATES & FORECAST, BY APPLICATION, 2019-2032 (USD BILLIONS)

    TABLE 129. MEA COMMODITY LINER MARKET SIZE ESTIMATES & FORECAST, BY END USE, 2019-2032 (USD BILLIONS)

    TABLE 130. MEA COMMODITY LINER MARKET SIZE ESTIMATES & FORECAST, BY MARKET CATEGORY, 2019-2032 (USD BILLIONS)

    TABLE 131. MEA COMMODITY LINER MARKET SIZE ESTIMATES & FORECAST, BY REGIONAL, 2019-2032 (USD BILLIONS)

    TABLE 132. GCC COUNTRIES COMMODITY LINER MARKET SIZE ESTIMATES & FORECAST, BY MATERIAL TYPE, 2019-2032 (USD BILLIONS)

    TABLE 133. GCC COUNTRIES COMMODITY LINER MARKET SIZE ESTIMATES & FORECAST, BY APPLICATION, 2019-2032 (USD BILLIONS)

    TABLE 134. GCC COUNTRIES COMMODITY LINER MARKET SIZE ESTIMATES & FORECAST, BY END USE, 2019-2032 (USD BILLIONS)

    TABLE 135. GCC COUNTRIES COMMODITY LINER MARKET SIZE ESTIMATES & FORECAST, BY MARKET CATEGORY, 2019-2032 (USD BILLIONS)

    TABLE 136. GCC COUNTRIES COMMODITY LINER MARKET SIZE ESTIMATES & FORECAST, BY REGIONAL, 2019-2032 (USD BILLIONS)

    TABLE 137. SOUTH AFRICA COMMODITY LINER MARKET SIZE ESTIMATES & FORECAST, BY MATERIAL TYPE, 2019-2032 (USD BILLIONS)

    TABLE 138. SOUTH AFRICA COMMODITY LINER MARKET SIZE ESTIMATES & FORECAST, BY APPLICATION, 2019-2032 (USD BILLIONS)

    TABLE 139. SOUTH AFRICA COMMODITY LINER MARKET SIZE ESTIMATES & FORECAST, BY END USE, 2019-2032 (USD BILLIONS)

    TABLE 140. SOUTH AFRICA COMMODITY LINER MARKET SIZE ESTIMATES & FORECAST, BY MARKET CATEGORY, 2019-2032 (USD BILLIONS)

    TABLE 141. SOUTH AFRICA COMMODITY LINER MARKET SIZE ESTIMATES & FORECAST, BY REGIONAL, 2019-2032 (USD BILLIONS)

    TABLE 142. REST OF MEA COMMODITY LINER MARKET SIZE ESTIMATES & FORECAST, BY MATERIAL TYPE, 2019-2032 (USD BILLIONS)

    TABLE 143. REST OF MEA COMMODITY LINER MARKET SIZE ESTIMATES & FORECAST, BY APPLICATION, 2019-2032 (USD BILLIONS)

    TABLE 144. REST OF MEA COMMODITY LINER MARKET SIZE ESTIMATES & FORECAST, BY END USE, 2019-2032 (USD BILLIONS)

    TABLE 145. REST OF MEA COMMODITY LINER MARKET SIZE ESTIMATES & FORECAST, BY MARKET CATEGORY, 2019-2032 (USD BILLIONS)

    TABLE 146. REST OF MEA COMMODITY LINER MARKET SIZE ESTIMATES & FORECAST, BY REGIONAL, 2019-2032 (USD BILLIONS)

    TABLE 147. PRODUCT LAUNCH/PRODUCT DEVELOPMENT/APPROVAL

    TABLE 148. ACQUISITION/PARTNERSHIP

    LIST OF FIGURES

    FIGURE 1. MARKET SYNOPSIS

    FIGURE 2. NORTH AMERICA COMMODITY LINER MARKET ANALYSIS

    FIGURE 3. US COMMODITY LINER MARKET ANALYSIS BY MATERIAL TYPE

    FIGURE 4. US COMMODITY LINER MARKET ANALYSIS BY APPLICATION

    FIGURE 5. US COMMODITY LINER MARKET ANALYSIS BY END USE

    FIGURE 6. US COMMODITY LINER MARKET ANALYSIS BY MARKET CATEGORY

    FIGURE 7. US COMMODITY LINER MARKET ANALYSIS BY REGIONAL

    FIGURE 8. CANADA COMMODITY LINER MARKET ANALYSIS BY MATERIAL TYPE

    FIGURE 9. CANADA COMMODITY LINER MARKET ANALYSIS BY APPLICATION

    FIGURE 10. CANADA COMMODITY LINER MARKET ANALYSIS BY END USE

    FIGURE 11. CANADA COMMODITY LINER MARKET ANALYSIS BY MARKET CATEGORY

    FIGURE 12. CANADA COMMODITY LINER MARKET ANALYSIS BY REGIONAL

    FIGURE 13. EUROPE COMMODITY LINER MARKET ANALYSIS

    FIGURE 14. GERMANY COMMODITY LINER MARKET ANALYSIS BY MATERIAL TYPE

    FIGURE 15. GERMANY COMMODITY LINER MARKET ANALYSIS BY APPLICATION

    FIGURE 16. GERMANY COMMODITY LINER MARKET ANALYSIS BY END USE

    FIGURE 17. GERMANY COMMODITY LINER MARKET ANALYSIS BY MARKET CATEGORY

    FIGURE 18. GERMANY COMMODITY LINER MARKET ANALYSIS BY REGIONAL

    FIGURE 19. UK COMMODITY LINER MARKET ANALYSIS BY MATERIAL TYPE

    FIGURE 20. UK COMMODITY LINER MARKET ANALYSIS BY APPLICATION

    FIGURE 21. UK COMMODITY LINER MARKET ANALYSIS BY END USE

    FIGURE 22. UK COMMODITY LINER MARKET ANALYSIS BY MARKET CATEGORY

    FIGURE 23. UK COMMODITY LINER MARKET ANALYSIS BY REGIONAL

    FIGURE 24. FRANCE COMMODITY LINER MARKET ANALYSIS BY MATERIAL TYPE

    FIGURE 25. FRANCE COMMODITY LINER MARKET ANALYSIS BY APPLICATION

    FIGURE 26. FRANCE COMMODITY LINER MARKET ANALYSIS BY END USE

    FIGURE 27. FRANCE COMMODITY LINER MARKET ANALYSIS BY MARKET CATEGORY

    FIGURE 28. FRANCE COMMODITY LINER MARKET ANALYSIS BY REGIONAL

    FIGURE 29. RUSSIA COMMODITY LINER MARKET ANALYSIS BY MATERIAL TYPE

    FIGURE 30. RUSSIA COMMODITY LINER MARKET ANALYSIS BY APPLICATION

    FIGURE 31. RUSSIA COMMODITY LINER MARKET ANALYSIS BY END USE

    FIGURE 32. RUSSIA COMMODITY LINER MARKET ANALYSIS BY MARKET CATEGORY

    FIGURE 33. RUSSIA COMMODITY LINER MARKET ANALYSIS BY REGIONAL

    FIGURE 34. ITALY COMMODITY LINER MARKET ANALYSIS BY MATERIAL TYPE

    FIGURE 35. ITALY COMMODITY LINER MARKET ANALYSIS BY APPLICATION

    FIGURE 36. ITALY COMMODITY LINER MARKET ANALYSIS BY END USE

    FIGURE 37. ITALY COMMODITY LINER MARKET ANALYSIS BY MARKET CATEGORY

    FIGURE 38. ITALY COMMODITY LINER MARKET ANALYSIS BY REGIONAL

    FIGURE 39. SPAIN COMMODITY LINER MARKET ANALYSIS BY MATERIAL TYPE

    FIGURE 40. SPAIN COMMODITY LINER MARKET ANALYSIS BY APPLICATION

    FIGURE 41. SPAIN COMMODITY LINER MARKET ANALYSIS BY END USE

    FIGURE 42. SPAIN COMMODITY LINER MARKET ANALYSIS BY MARKET CATEGORY

    FIGURE 43. SPAIN COMMODITY LINER MARKET ANALYSIS BY REGIONAL

    FIGURE 44. REST OF EUROPE COMMODITY LINER MARKET ANALYSIS BY MATERIAL TYPE

    FIGURE 45. REST OF EUROPE COMMODITY LINER MARKET ANALYSIS BY APPLICATION

    FIGURE 46. REST OF EUROPE COMMODITY LINER MARKET ANALYSIS BY END USE

    FIGURE 47. REST OF EUROPE COMMODITY LINER MARKET ANALYSIS BY MARKET CATEGORY

    FIGURE 48. REST OF EUROPE COMMODITY LINER MARKET ANALYSIS BY REGIONAL

    FIGURE 49. APAC COMMODITY LINER MARKET ANALYSIS

    FIGURE 50. CHINA COMMODITY LINER MARKET ANALYSIS BY MATERIAL TYPE

    FIGURE 51. CHINA COMMODITY LINER MARKET ANALYSIS BY APPLICATION

    FIGURE 52. CHINA COMMODITY LINER MARKET ANALYSIS BY END USE

    FIGURE 53. CHINA COMMODITY LINER MARKET ANALYSIS BY MARKET CATEGORY

    FIGURE 54. CHINA COMMODITY LINER MARKET ANALYSIS BY REGIONAL

    FIGURE 55. INDIA COMMODITY LINER MARKET ANALYSIS BY MATERIAL TYPE

    FIGURE 56. INDIA COMMODITY LINER MARKET ANALYSIS BY APPLICATION

    FIGURE 57. INDIA COMMODITY LINER MARKET ANALYSIS BY END USE

    FIGURE 58. INDIA COMMODITY LINER MARKET ANALYSIS BY MARKET CATEGORY

    FIGURE 59. INDIA COMMODITY LINER MARKET ANALYSIS BY REGIONAL

    FIGURE 60. JAPAN COMMODITY LINER MARKET ANALYSIS BY MATERIAL TYPE

    FIGURE 61. JAPAN COMMODITY LINER MARKET ANALYSIS BY APPLICATION

    FIGURE 62. JAPAN COMMODITY LINER MARKET ANALYSIS BY END USE

    FIGURE 63. JAPAN COMMODITY LINER MARKET ANALYSIS BY MARKET CATEGORY

    FIGURE 64. JAPAN COMMODITY LINER MARKET ANALYSIS BY REGIONAL

    FIGURE 65. SOUTH KOREA COMMODITY LINER MARKET ANALYSIS BY MATERIAL TYPE

    FIGURE 66. SOUTH KOREA COMMODITY LINER MARKET ANALYSIS BY APPLICATION

    FIGURE 67. SOUTH KOREA COMMODITY LINER MARKET ANALYSIS BY END USE

    FIGURE 68. SOUTH KOREA COMMODITY LINER MARKET ANALYSIS BY MARKET CATEGORY

    FIGURE 69. SOUTH KOREA COMMODITY LINER MARKET ANALYSIS BY REGIONAL

    FIGURE 70. MALAYSIA COMMODITY LINER MARKET ANALYSIS BY MATERIAL TYPE

    FIGURE 71. MALAYSIA COMMODITY LINER MARKET ANALYSIS BY APPLICATION

    FIGURE 72. MALAYSIA COMMODITY LINER MARKET ANALYSIS BY END USE

    FIGURE 73. MALAYSIA COMMODITY LINER MARKET ANALYSIS BY MARKET CATEGORY

    FIGURE 74. MALAYSIA COMMODITY LINER MARKET ANALYSIS BY REGIONAL

    FIGURE 75. THAILAND COMMODITY LINER MARKET ANALYSIS BY MATERIAL TYPE

    FIGURE 76. THAILAND COMMODITY LINER MARKET ANALYSIS BY APPLICATION

    FIGURE 77. THAILAND COMMODITY LINER MARKET ANALYSIS BY END USE

    FIGURE 78. THAILAND COMMODITY LINER MARKET ANALYSIS BY MARKET CATEGORY

    FIGURE 79. THAILAND COMMODITY LINER MARKET ANALYSIS BY REGIONAL

    FIGURE 80. INDONESIA COMMODITY LINER MARKET ANALYSIS BY MATERIAL TYPE

    FIGURE 81. INDONESIA COMMODITY LINER MARKET ANALYSIS BY APPLICATION

    FIGURE 82. INDONESIA COMMODITY LINER MARKET ANALYSIS BY END USE

    FIGURE 83. INDONESIA COMMODITY LINER MARKET ANALYSIS BY MARKET CATEGORY

    FIGURE 84. INDONESIA COMMODITY LINER MARKET ANALYSIS BY REGIONAL

    FIGURE 85. REST OF APAC COMMODITY LINER MARKET ANALYSIS BY MATERIAL TYPE

    FIGURE 86. REST OF APAC COMMODITY LINER MARKET ANALYSIS BY APPLICATION

    FIGURE 87. REST OF APAC COMMODITY LINER MARKET ANALYSIS BY END USE

    FIGURE 88. REST OF APAC COMMODITY LINER MARKET ANALYSIS BY MARKET CATEGORY

    FIGURE 89. REST OF APAC COMMODITY LINER MARKET ANALYSIS BY REGIONAL

    FIGURE 90. SOUTH AMERICA COMMODITY LINER MARKET ANALYSIS

    FIGURE 91. BRAZIL COMMODITY LINER MARKET ANALYSIS BY MATERIAL TYPE

    FIGURE 92. BRAZIL COMMODITY LINER MARKET ANALYSIS BY APPLICATION

    FIGURE 93. BRAZIL COMMODITY LINER MARKET ANALYSIS BY END USE

    FIGURE 94. BRAZIL COMMODITY LINER MARKET ANALYSIS BY MARKET CATEGORY

    FIGURE 95. BRAZIL COMMODITY LINER MARKET ANALYSIS BY REGIONAL

    FIGURE 96. MEXICO COMMODITY LINER MARKET ANALYSIS BY MATERIAL TYPE

    FIGURE 97. MEXICO COMMODITY LINER MARKET ANALYSIS BY APPLICATION

    FIGURE 98. MEXICO COMMODITY LINER MARKET ANALYSIS BY END USE

    FIGURE 99. MEXICO COMMODITY LINER MARKET ANALYSIS BY MARKET CATEGORY

    FIGURE 100. MEXICO COMMODITY LINER MARKET ANALYSIS BY REGIONAL

    FIGURE 101. ARGENTINA COMMODITY LINER MARKET ANALYSIS BY MATERIAL TYPE

    FIGURE 102. ARGENTINA COMMODITY LINER MARKET ANALYSIS BY APPLICATION

    FIGURE 103. ARGENTINA COMMODITY LINER MARKET ANALYSIS BY END USE

    FIGURE 104. ARGENTINA COMMODITY LINER MARKET ANALYSIS BY MARKET CATEGORY

    FIGURE 105. ARGENTINA COMMODITY LINER MARKET ANALYSIS BY REGIONAL

    FIGURE 106. REST OF SOUTH AMERICA COMMODITY LINER MARKET ANALYSIS BY MATERIAL TYPE

    FIGURE 107. REST OF SOUTH AMERICA COMMODITY LINER MARKET ANALYSIS BY APPLICATION

    FIGURE 108. REST OF SOUTH AMERICA COMMODITY LINER MARKET ANALYSIS BY END USE

    FIGURE 109. REST OF SOUTH AMERICA COMMODITY LINER MARKET ANALYSIS BY MARKET CATEGORY

    FIGURE 110. REST OF SOUTH AMERICA COMMODITY LINER MARKET ANALYSIS BY REGIONAL

    FIGURE 111. MEA COMMODITY LINER MARKET ANALYSIS

    FIGURE 112. GCC COUNTRIES COMMODITY LINER MARKET ANALYSIS BY MATERIAL TYPE

    FIGURE 113. GCC COUNTRIES COMMODITY LINER MARKET ANALYSIS BY APPLICATION

    FIGURE 114. GCC COUNTRIES COMMODITY LINER MARKET ANALYSIS BY END USE

    FIGURE 115. GCC COUNTRIES COMMODITY LINER MARKET ANALYSIS BY MARKET CATEGORY

    FIGURE 116. GCC COUNTRIES COMMODITY LINER MARKET ANALYSIS BY REGIONAL

    FIGURE 117. SOUTH AFRICA COMMODITY LINER MARKET ANALYSIS BY MATERIAL TYPE

    FIGURE 118. SOUTH AFRICA COMMODITY LINER MARKET ANALYSIS BY APPLICATION

    FIGURE 119. SOUTH AFRICA COMMODITY LINER MARKET ANALYSIS BY END USE

    FIGURE 120. SOUTH AFRICA COMMODITY LINER MARKET ANALYSIS BY MARKET CATEGORY

    FIGURE 121. SOUTH AFRICA COMMODITY LINER MARKET ANALYSIS BY REGIONAL

    FIGURE 122. REST OF MEA COMMODITY LINER MARKET ANALYSIS BY MATERIAL TYPE

    FIGURE 123. REST OF MEA COMMODITY LINER MARKET ANALYSIS BY APPLICATION

    FIGURE 124. REST OF MEA COMMODITY LINER MARKET ANALYSIS BY END USE

    FIGURE 125. REST OF MEA COMMODITY LINER MARKET ANALYSIS BY MARKET CATEGORY

    FIGURE 126. REST OF MEA COMMODITY LINER MARKET ANALYSIS BY REGIONAL

    FIGURE 127. KEY BUYING CRITERIA OF COMMODITY LINER MARKET

    FIGURE 128. RESEARCH PROCESS OF MRFR

    FIGURE 129. DRO ANALYSIS OF COMMODITY LINER MARKET

    FIGURE 130. DRIVERS IMPACT ANALYSIS: COMMODITY LINER MARKET

    FIGURE 131. RESTRAINTS IMPACT ANALYSIS: COMMODITY LINER MARKET

    FIGURE 132. SUPPLY / VALUE CHAIN: COMMODITY LINER MARKET

    FIGURE 133. COMMODITY LINER MARKET, BY MATERIAL TYPE, 2024 (% SHARE)

    FIGURE 134. COMMODITY LINER MARKET, BY MATERIAL TYPE, 2019 TO 2032 (USD Billions)

    FIGURE 135. COMMODITY LINER MARKET, BY APPLICATION, 2024 (% SHARE)

    FIGURE 136. COMMODITY LINER MARKET, BY APPLICATION, 2019 TO 2032 (USD Billions)

    FIGURE 137. COMMODITY LINER MARKET, BY END USE, 2024 (% SHARE)

    FIGURE 138. COMMODITY LINER MARKET, BY END USE, 2019 TO 2032 (USD Billions)

    FIGURE 139. COMMODITY LINER MARKET, BY MARKET CATEGORY, 2024 (% SHARE)

    FIGURE 140. COMMODITY LINER MARKET, BY MARKET CATEGORY, 2019 TO 2032 (USD Billions)

    FIGURE 141. COMMODITY LINER MARKET, BY REGIONAL, 2024 (% SHARE)

    FIGURE 142. COMMODITY LINER MARKET, BY REGIONAL, 2019 TO 2032 (USD Billions)

    FIGURE 143. BENCHMARKING OF MAJOR COMPETITORS

    Report Infographic
    Free Sample Request

    Kindly complete the form below to receive a free sample of this Report

    Customer Strories

    “I am very pleased with how market segments have been defined in a relevant way for my purposes (such as "Portable Freezers & refrigerators" and "last-mile"). In general the report is well structured. Thanks very much for your efforts.”

    Victoria Milne Founder
    Case Study

    Chemicals and Materials